whiteboard virtual cu recunoa ştere şi recunoaştere şi...
TRANSCRIPT
Whiteboard Virtual cu Recunoaştere şi
Manipulare de Text
Whiteboard Virtual cu Whiteboard Virtual cu RecunoaRecunoaşşteretere şşi i
Manipulare de TextManipulare de Text
Coordonator: Absolvent:Coordonator: Absolvent:Tiberiu MariTiberiu MariŃŃa Marius a Marius LupouLupou
Cuprins• Obiective• Arhitectura sistemului• Modulul de AchiziŃie• Modulul de Afişare Rezultat• Rezultate şi evaluare• Concluzii
Obiectivele propuse• SoluŃie alternativă pentru tablele
tradiŃionale• InteracŃiune non-standard• Post procesare a informaŃiilor• Costuri reduse
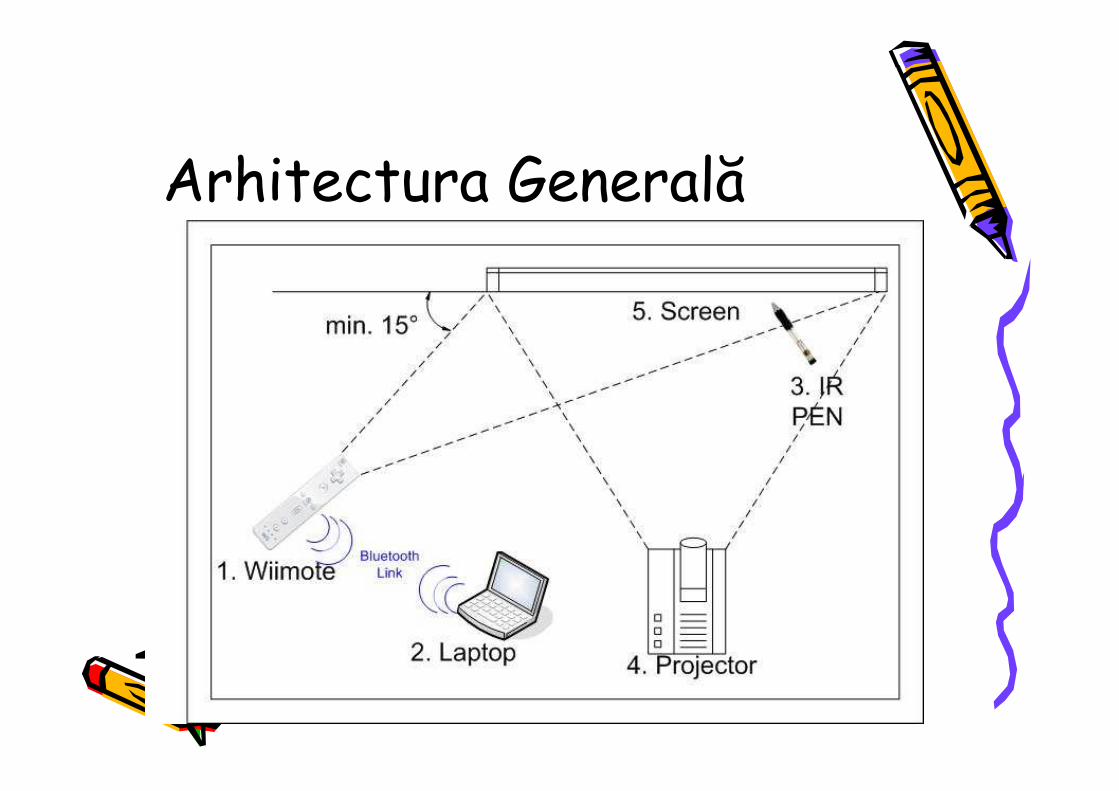
Arhitectura Generală
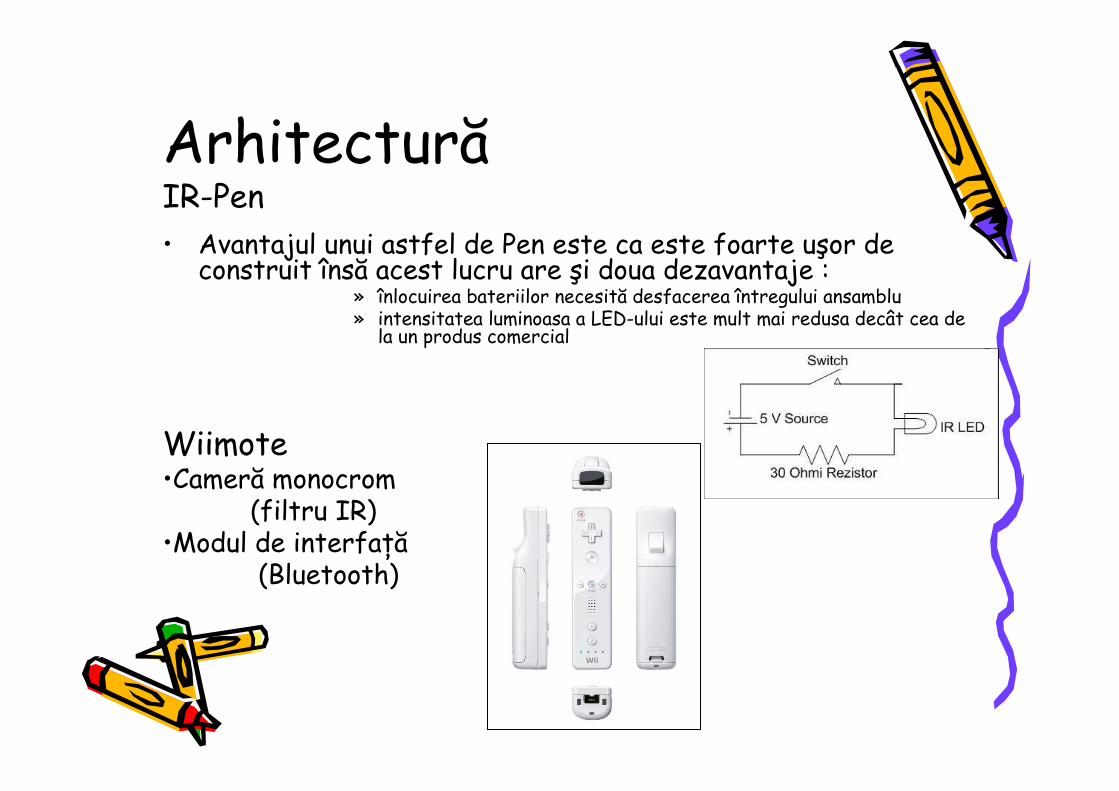
ArhitecturăIR-Pen• Avantajul unui astfel de Pen este ca este foarte uşor de
construit însă acest lucru are şi doua dezavantaje : » înlocuirea bateriilor necesită desfacerea întregului ansamblu» intensitatea luminoasa a LED-ului este mult mai redusa decât cea de
la un produs comercial
Wiimote•Cameră monocrom
(filtru IR)•Modul de interfaŃă
(Bluetooth)
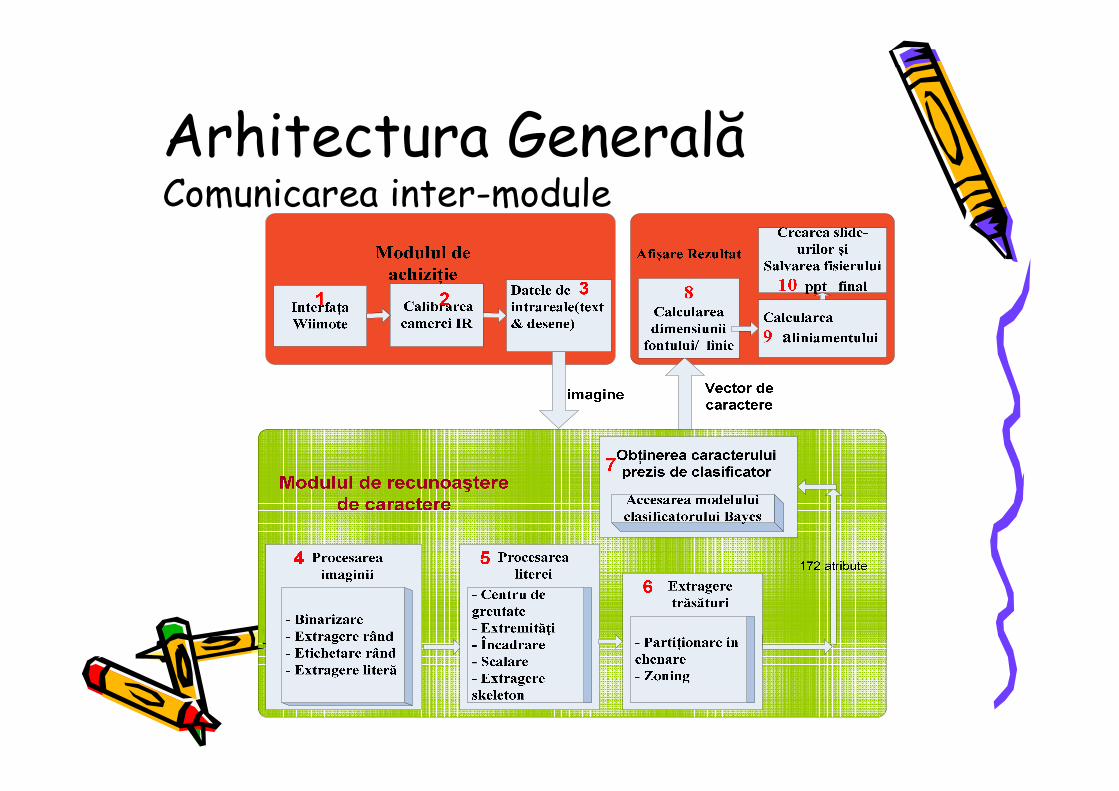
Arhitectura GeneralăComunicarea inter-module
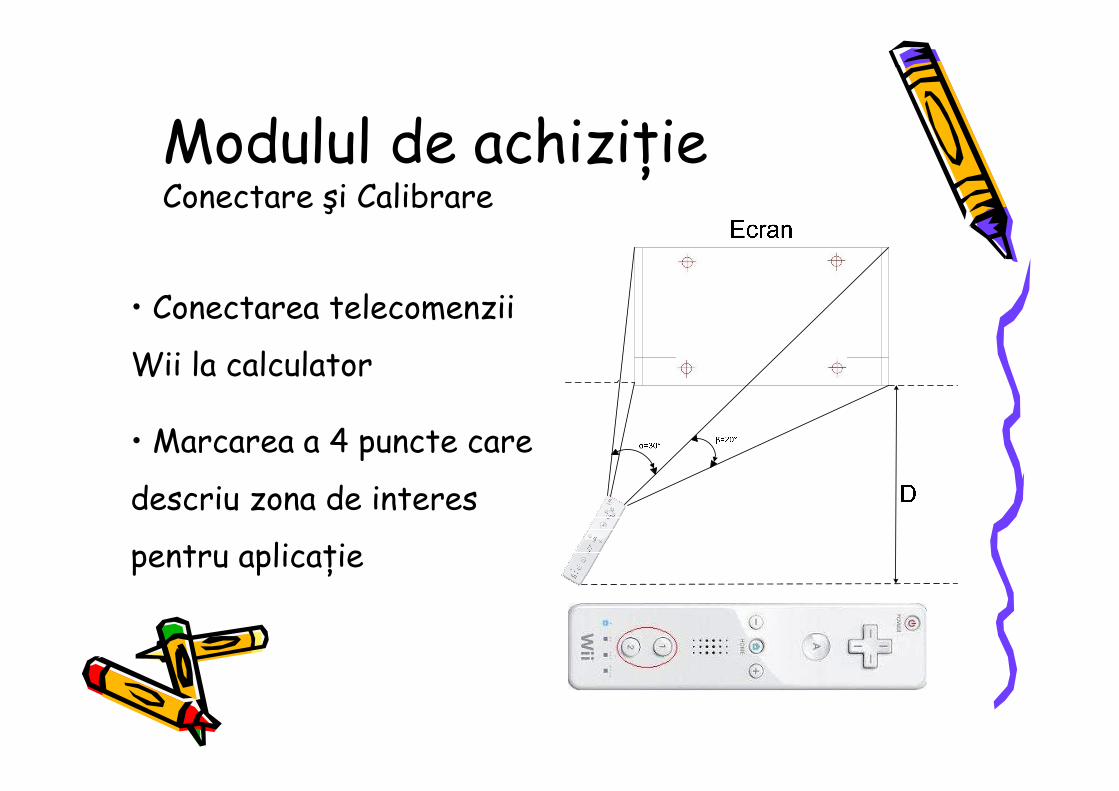
Modulul de achiziŃie Conectare şi Calibrare
• Conectarea telecomenzii
Wii la calculator
• Marcarea a 4 puncte care
descriu zona de interes
pentru aplicaŃie
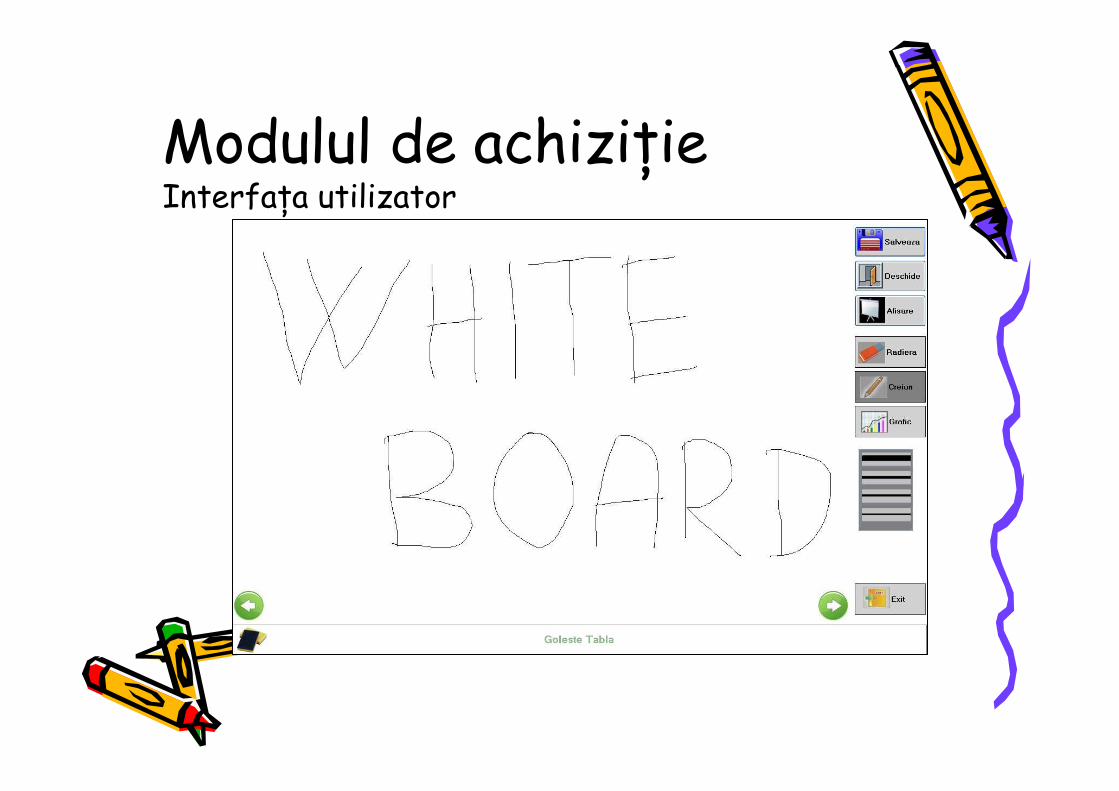
Modulul de achiziŃieInterfaŃa utilizator
Modulul de achiziŃieScriere/Ştergere
• Selectare Creion/Radieră• Alege din listă dimensiuni• Desenare Grafic• Goleşte Grafic
Modul AchiziŃieDeschidere/Salvare
• Deschide orice formate standardizate de documente
ce pot fi utilizate într-o prezentare
• După prelucrarea informaŃiei, rezultatul poate fi
salvat fie sub forma unei prezentări Power Point, fie
sub forma unei secvenŃe de poze
Modul de AchiziŃieGoleşte Tablă/Grafic
• Ştergere conŃinut tablă• Transmitere informaŃii spre prelucrare
» Imaginea cu text este trimis spre modulul de recunoaştere (thread nou)
» Graficele sunt salvate ca imagini
Modul AchiziŃieÎnainte/Înapoi
• Facilitate a digitizării informaŃiei
• Navigarea printre tablele scrise
• Modificarea conŃinutului acestora
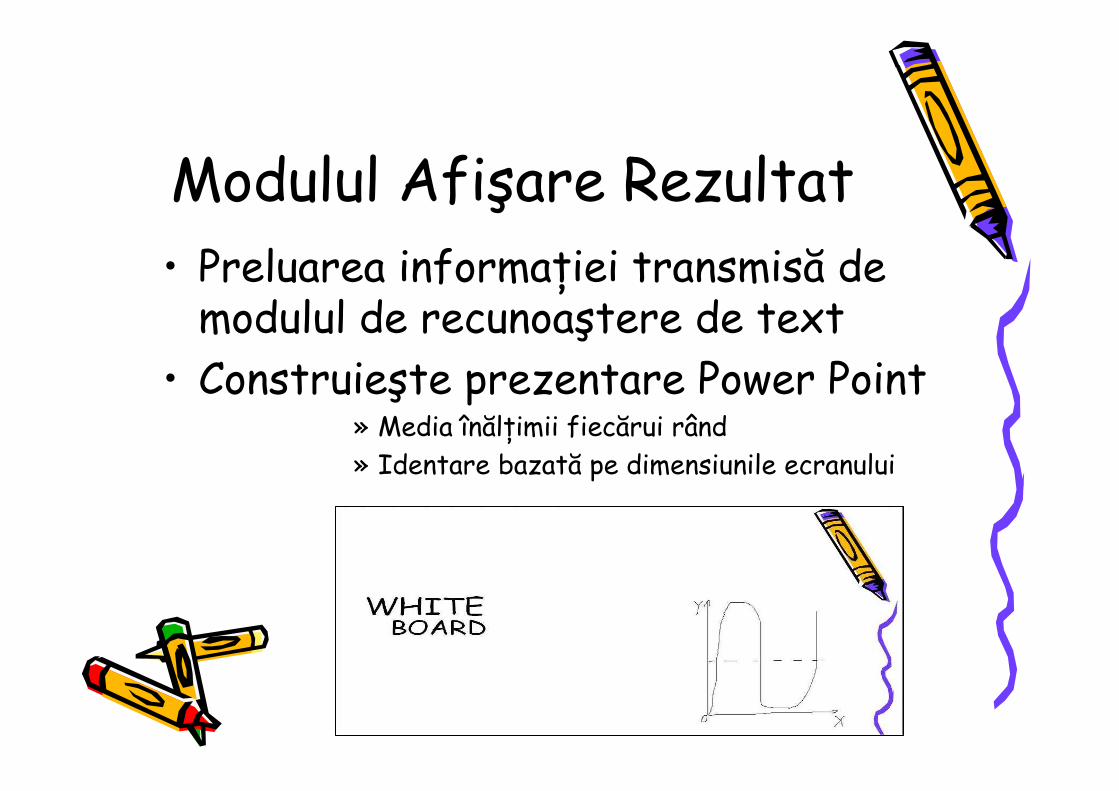
Modulul Afişare Rezultat• Preluarea informaŃiei transmisă de
modulul de recunoaştere de text• Construieşte prezentare Power Point
» Media înălŃimii fiecărui rând» Identare bazată pe dimensiunile ecranului
Rezultate şi EvaluareProbleme întâmpinate
• Detectarea IR-pen , comandă cu impulsuri
• Ecran» Reflexie» SuprafaŃă fixă
• Transmitere imagini spre prelucrare» Thread-uri» Lock()
Rezultate şi EvaluareRezultate
• AplicaŃia şi-a îndeplinit toate obiectivele, fucŃionalităŃile interfeŃei
•Scriere/Ştergere
•Desene
•Prelucrare informaŃii
•Afişare rezultat
• Perioada de răspuns a sistemului este redusă
• Oferă utilizatorului o utilizare naturală
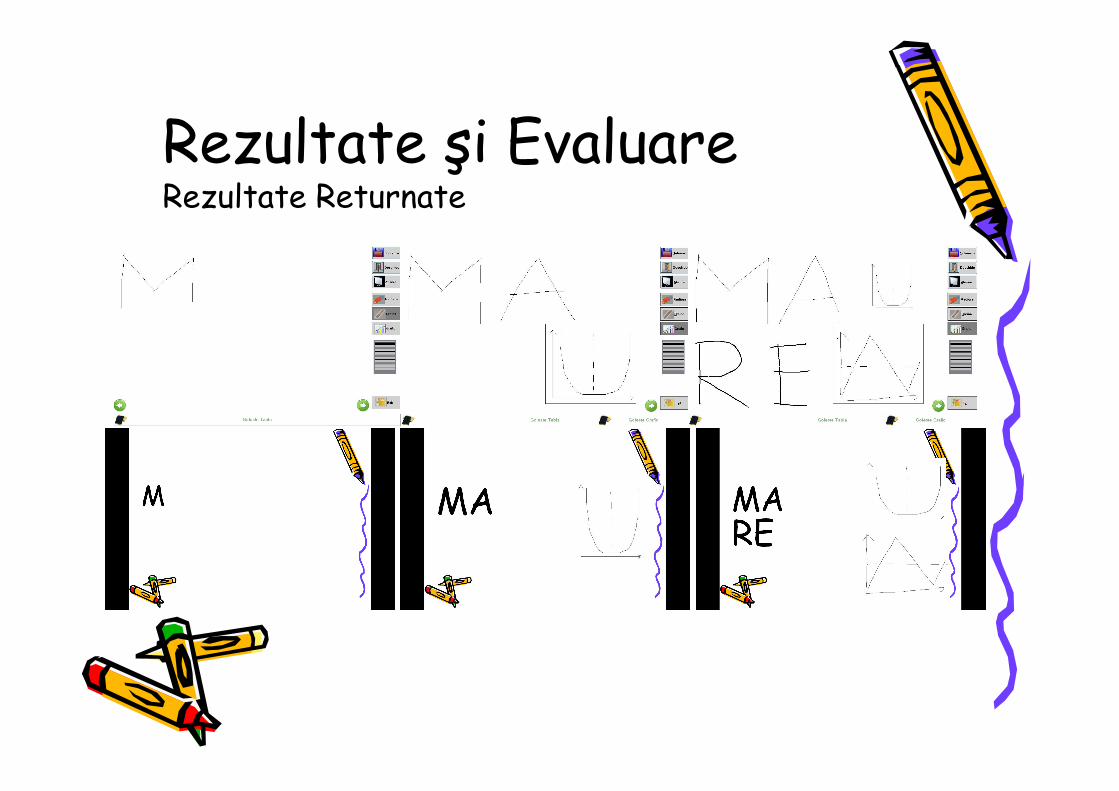
Rezultate şi EvaluareRezultate Returnate
ConcluziiRealizări
• Aduce îmbunătăŃiri faŃa de sistemele whitebaord existente
• posibilitatea utilizării sistemului pe orice suprafaŃă plana şi rigidă
• modul de recunoaştere a scrisului
• afişarea rezultatului într-un format standardizat
• costurile foarte reduse.
• InovaŃia adusă de acest sistem este că rezultatul final este returnat
utilizatorului într-un format standard
• Realizare este faptul că acest whiteboard a fost conceput pe baza
tehnologiei Wii, încă neimplementată pe sisteme cu aceleaşi funcŃii.
ConcluziiDezvoltări Ulterioare
• Utilizarea unei camere mai puternice • Sistemul ar putea fi adaptat pentru
un proiector 3D, permiŃându-se manipularea obiectelor
• Integrarea tuturor modulelor (hardware) într-o singură entitate
SISTEM DE RECUNOAŞTERE A
CARACTERELOR PENTRU WHITEBOARD-URI
VIRTUALE
SISTEM DE SISTEM DE RECUNOARECUNOAŞŞTERE A TERE A
CARACTERELOR PENTRU CARACTERELOR PENTRU WHITEBOARDWHITEBOARD--URI URI
VIRTUALEVIRTUALEAntonia Corina BoŃoiu
Coordonator:
S.l.dr.ing. Tiberiu MariŃa
Cuprins• Obiective• Arhitectura sistemului• Modulul de recunoaştere a
caracterelor• Rezultate şi evaluare• Concluzii
Obiective• Sistemul propus încearcă să ofere posibilitatea de a recunoaşte
text scris cu litere mari de tipar, provenit de la un sistem de tip whiteboard.
• Pentru ca sistemul să obŃină o recunoaştere cât mai eficientă, imaginile date spre procesare trebuie să îndeplineasca urmatoarelecondiŃii
- textul să aibă cuvintele bine despărŃite - literele să nu fie suprapuse - rândurile de text sunt despărŃite de cel puŃin un rând de
pixeli de fundal.
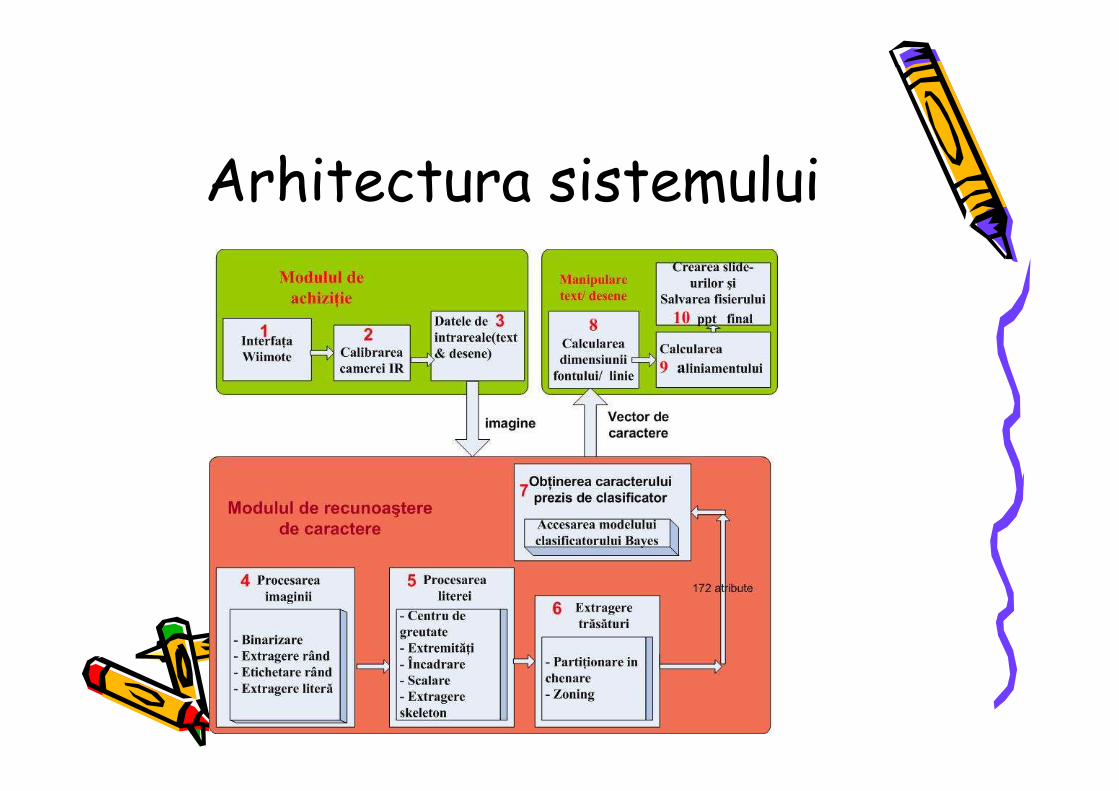
Arhitectura sistemului
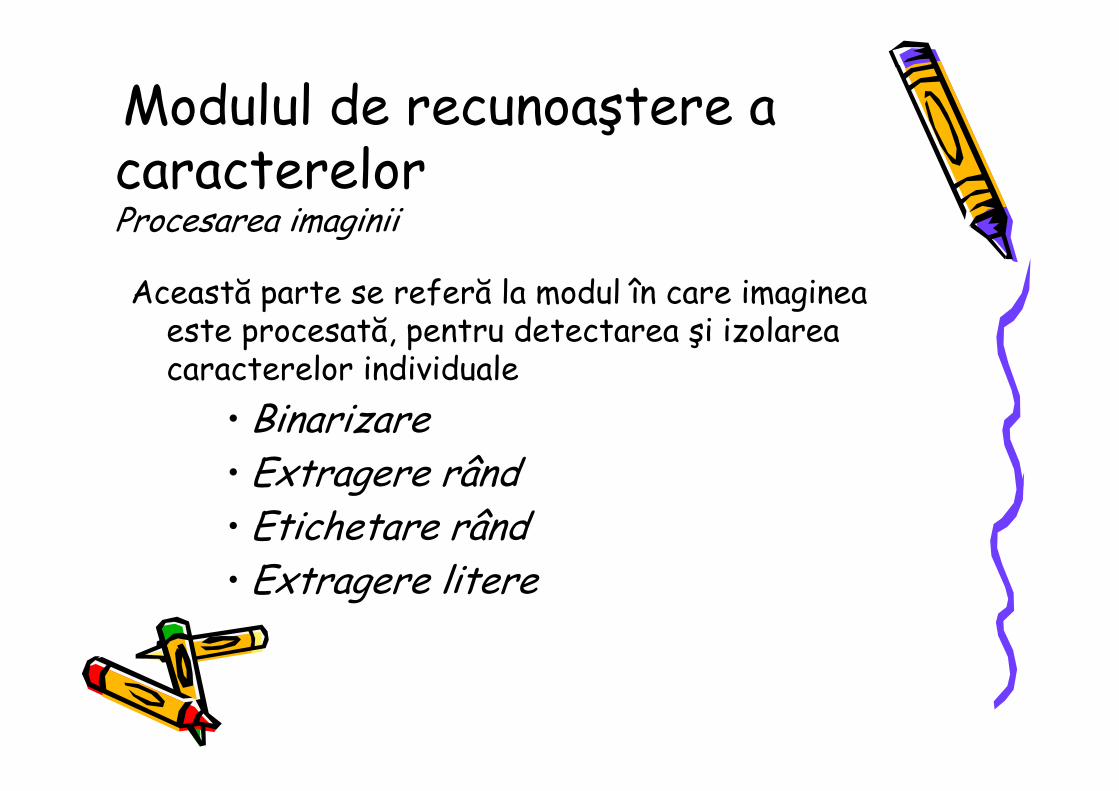
Modulul de recunoaştere a caracterelorProcesarea imaginii
Această parte se referă la modul în care imaginea este procesată, pentru detectarea şi izolarea caracterelor individuale
• Binarizare• Extragere rând• Etichetare rând• Extragere litere
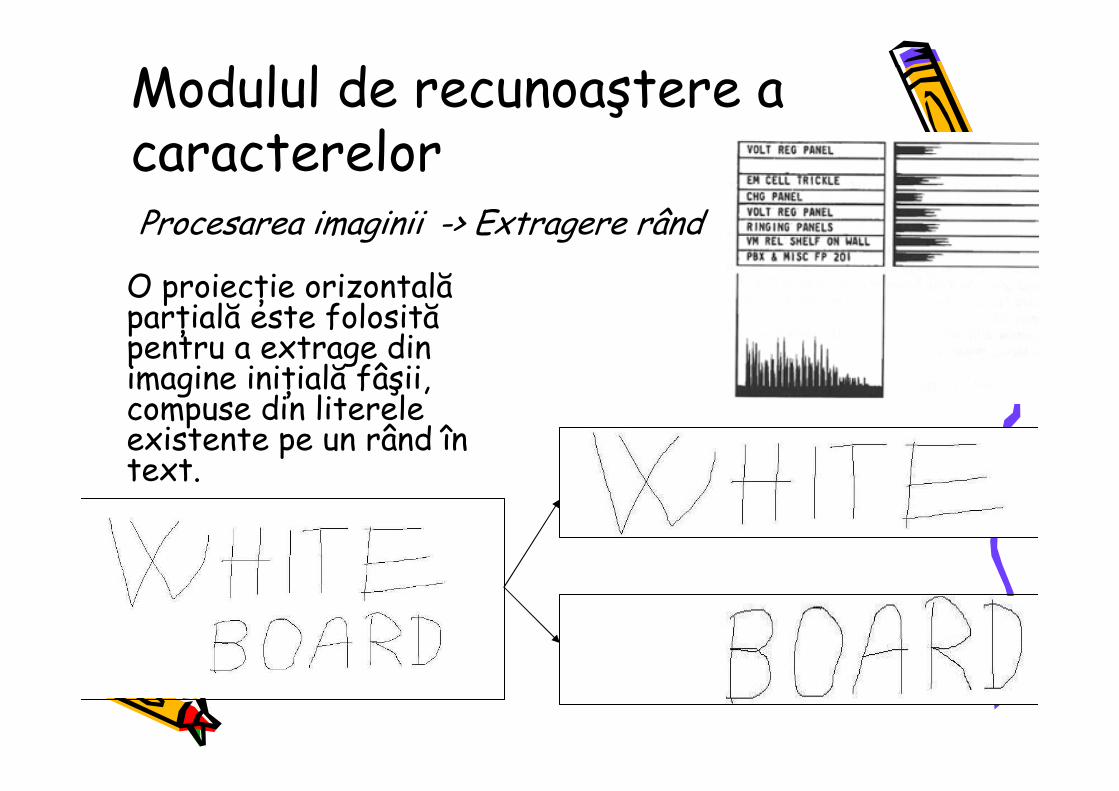
Modulul de recunoaştere a caracterelorProcesarea imaginii -> Extragere rând
O proiecŃie orizontală parŃială este folosită pentru a extrage din imagine iniŃială fâşii, compuse din literele existente pe un rând în text.
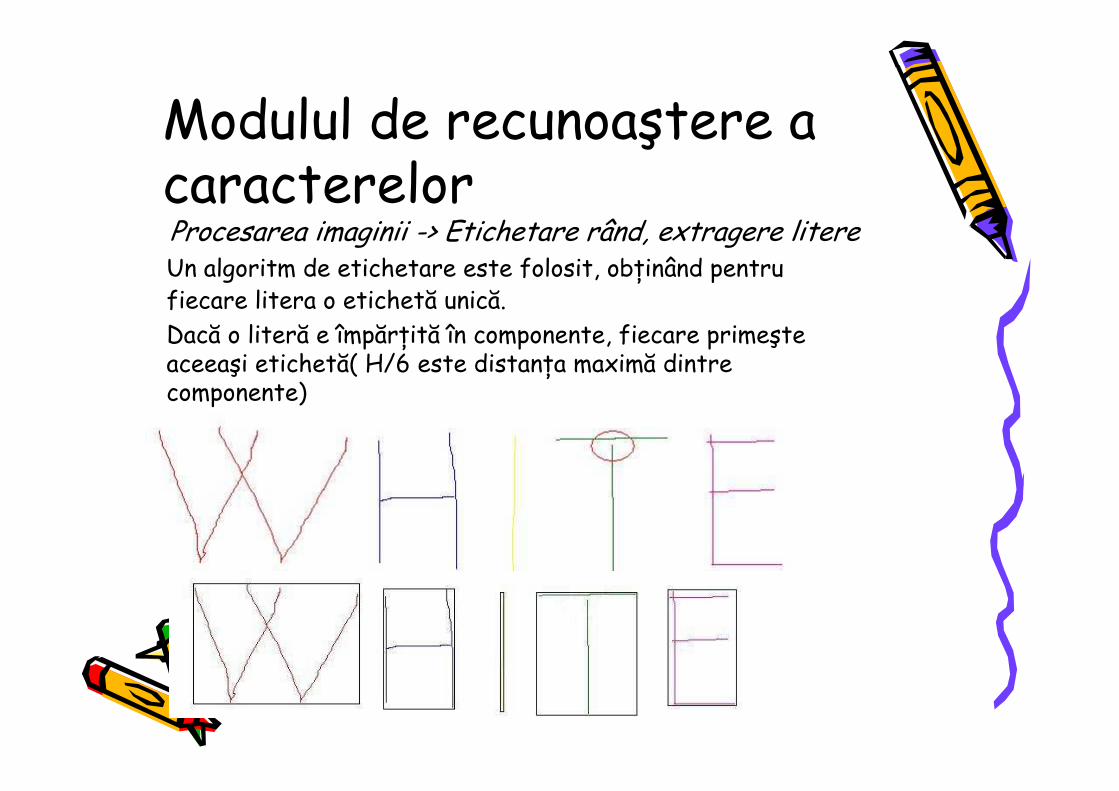
Modulul de recunoaştere a caracterelorProcesarea imaginii -> Etichetare rând, extragere litereUn algoritm de etichetare este folosit, obŃinând pentru fiecare litera o etichetă unică.Dacă o literă e împărŃită în componente, fiecare primeşte aceeaşi etichetă( H/6 este distanŃa maximă dintre componente)
Modulul de recunoaştere a caracterelorProcesarea literelor
• Centrul de greutate• ExtremităŃi• Încadrare• Scalare• Extragerea skeleton-ului
caracterelorProcesarea literelor -> Centrul de greutate,
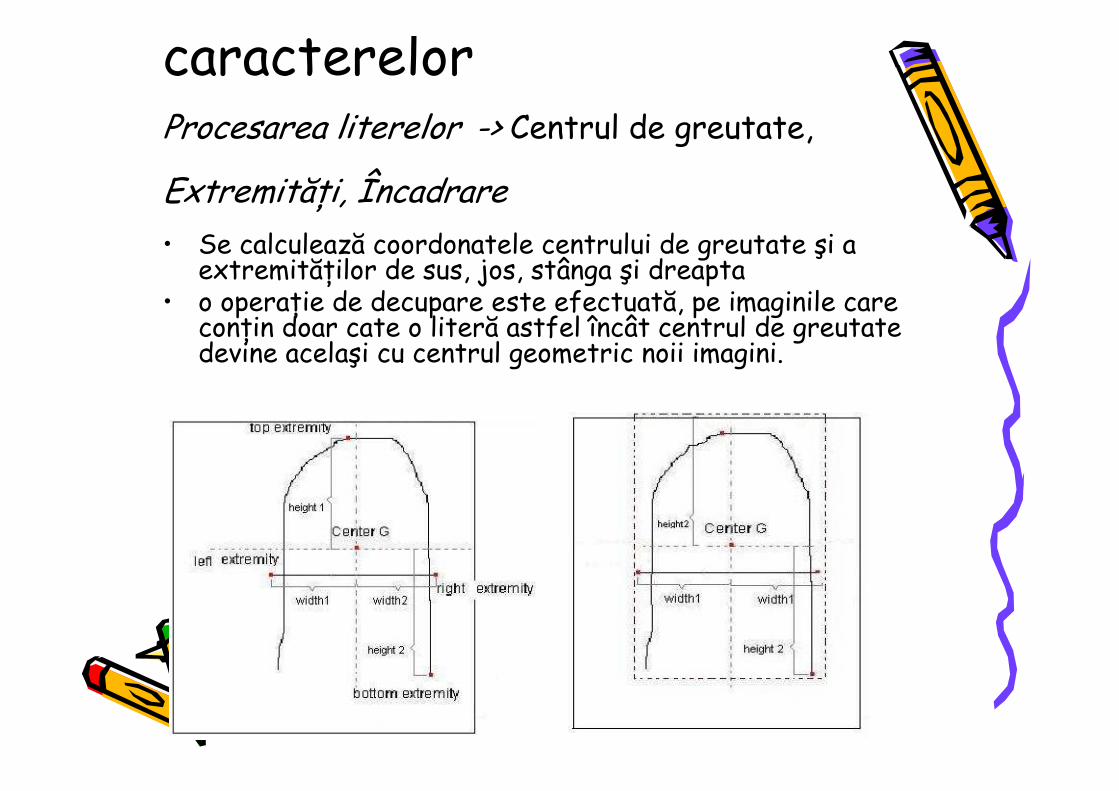
ExtremităŃi, Încadrare• Se calculează coordonatele centrului de greutate şi a
extremităŃilor de sus, jos, stânga şi dreapta• o operaŃie de decupare este efectuată, pe imaginile care
conŃin doar cate o literă astfel încât centrul de greutate devine acelaşi cu centrul geometric noii imagini.
Modulul de recunoaştere a caracterelorProcesarea literelor -> Scalare, Extragere Skeleton
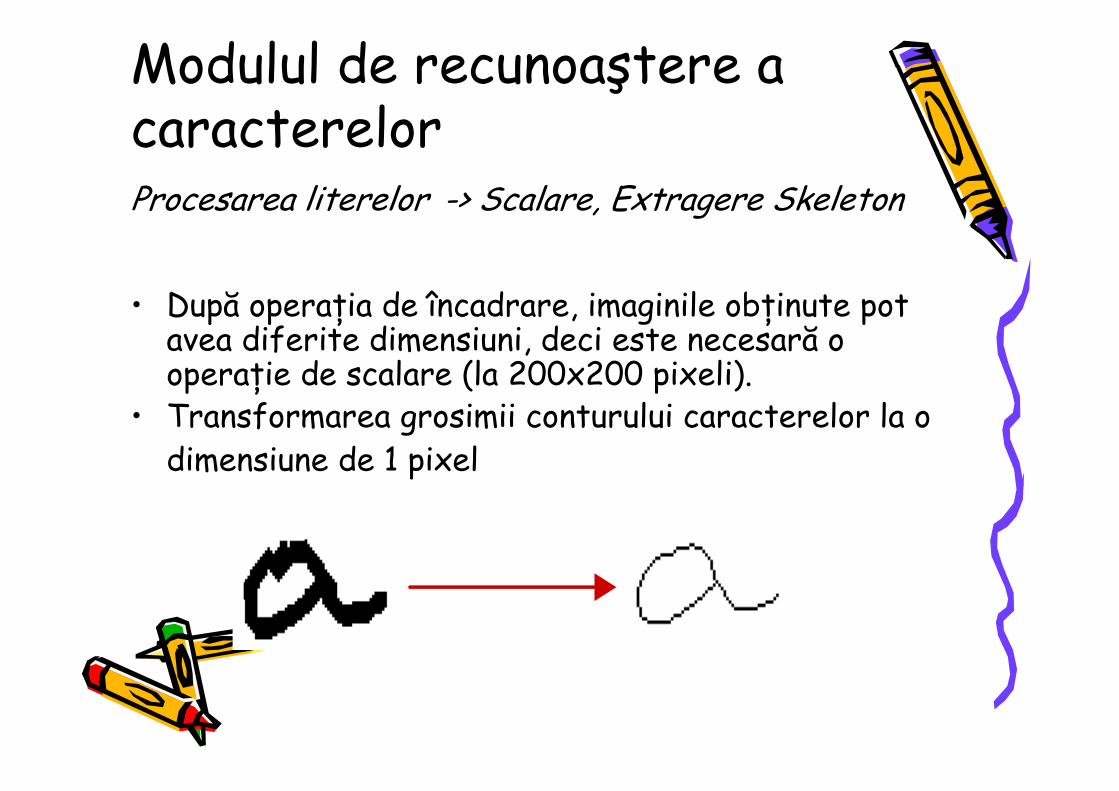
• După operaŃia de încadrare, imaginile obŃinute pot avea diferite dimensiuni, deci este necesară o operaŃie de scalare (la 200x200 pixeli).
• Transformarea grosimii conturului caracterelor la o dimensiune de 1 pixel
Modulul de recunoaştere a caracterelorExtragerea/detectrea trăsăturilor
• ÎmpărŃirea în chenare• Zoning
Modulul de recunoaştere a caracterelorExtragerea/detectrea trăsăturilor ->
ÎmpărŃirea în chenare
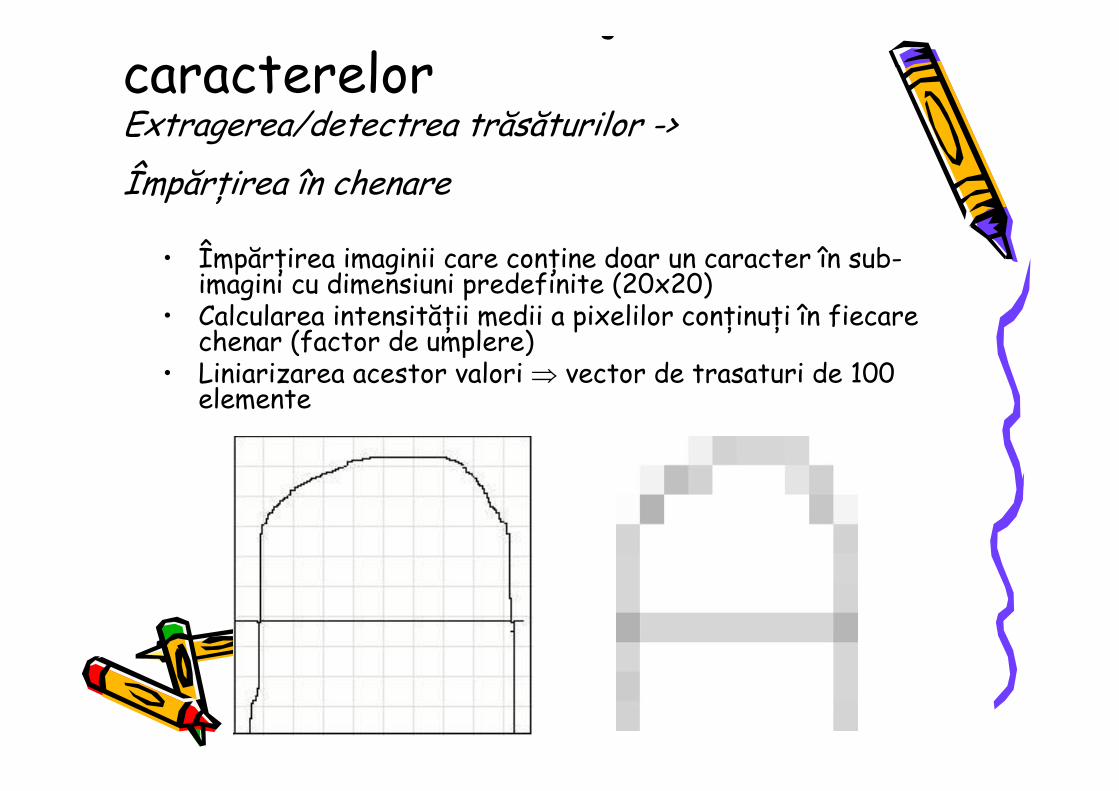
• ÎmpărŃirea imaginii care conŃine doar un caracter în sub-imagini cu dimensiuni predefinite (20x20)
• Calcularea intensităŃii medii a pixelilor conŃinuŃi în fiecare chenar (factor de umplere)
• Liniarizarea acestor valori ⇒ vector de trasaturi de 100 elemente
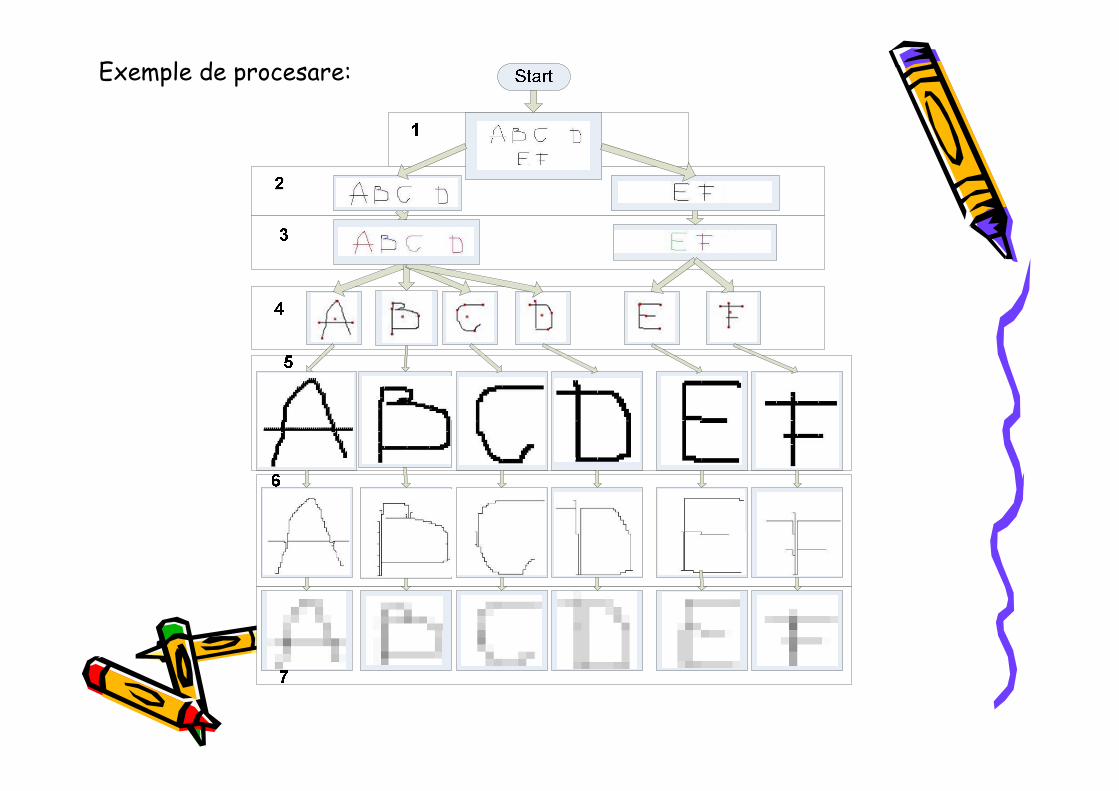
Exemple de procesare:
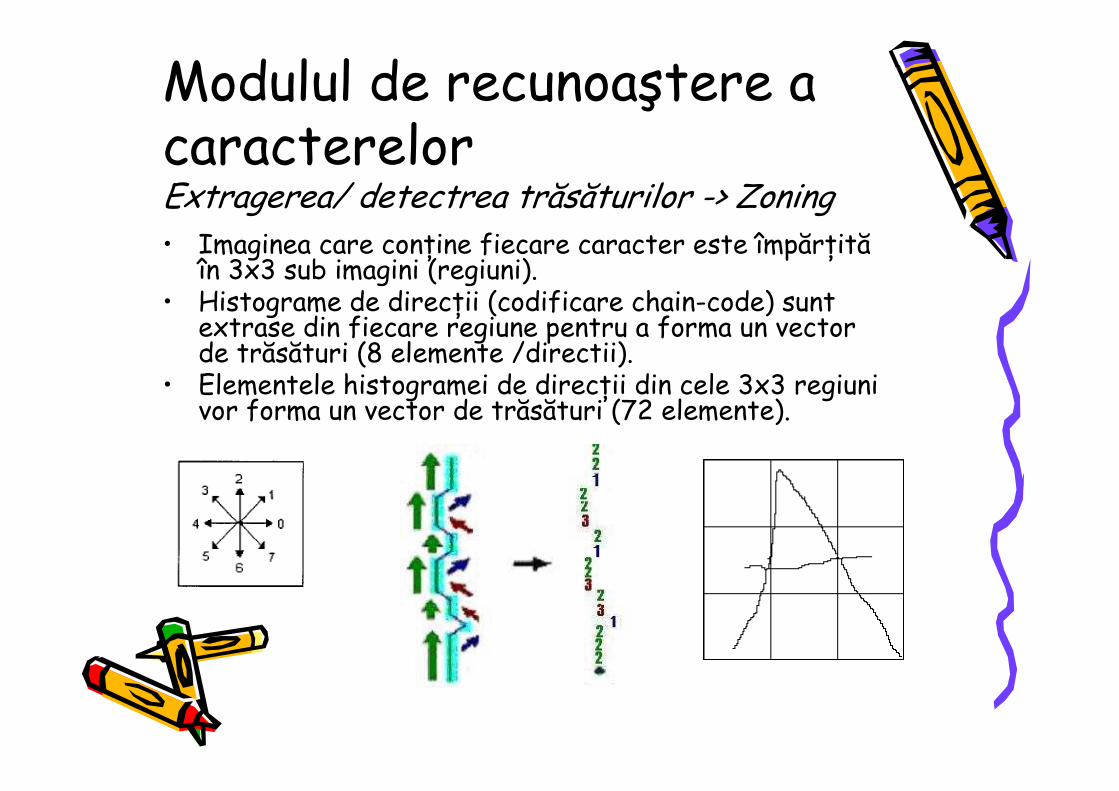
Modulul de recunoaştere a caracterelorExtragerea/ detectrea trăsăturilor -> Zoning• Imaginea care conŃine fiecare caracter este împărŃită
în 3x3 sub imagini (regiuni).• Histograme de direcŃii (codificare chain-code) sunt
extrase din fiecare regiune pentru a forma un vector de trăsături (8 elemente /directii).
• Elementele histogramei de direcŃii din cele 3x3 regiuni vor forma un vector de trăsături (72 elemente).
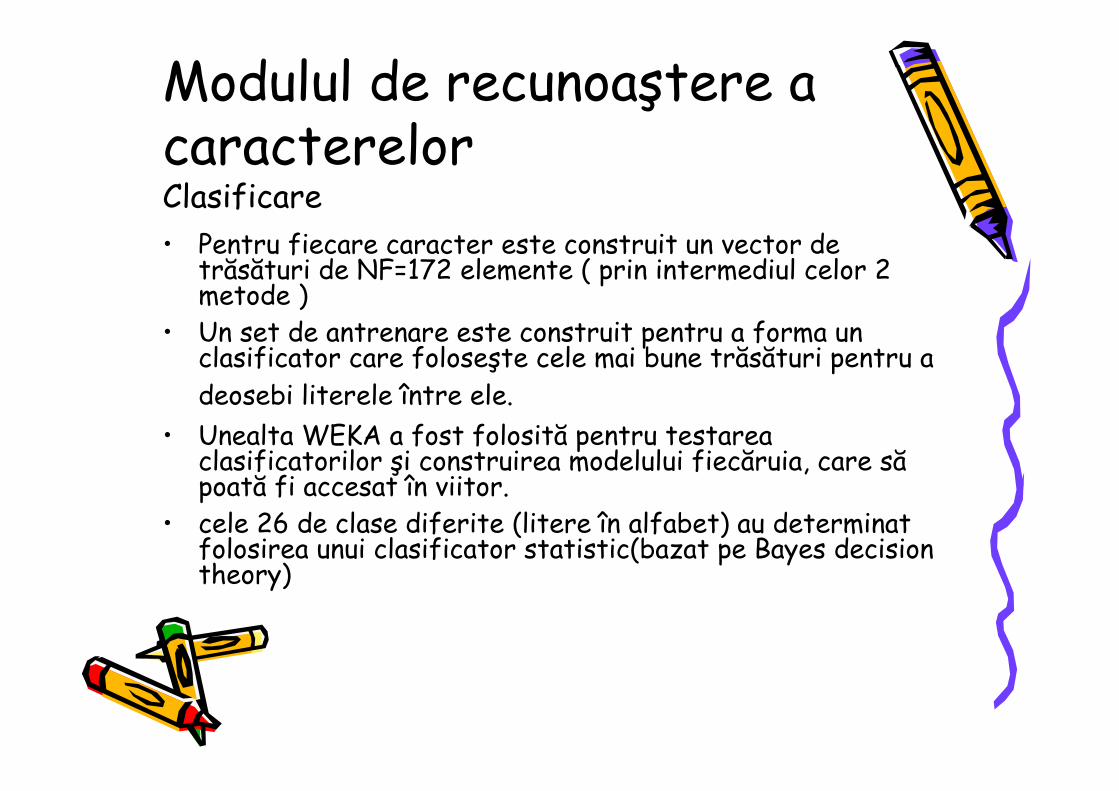
Modulul de recunoaştere a caracterelorClasificare• Pentru fiecare caracter este construit un vector de
trăsături de NF=172 elemente ( prin intermediul celor 2 metode )
• Un set de antrenare este construit pentru a forma un clasificator care foloseşte cele mai bune trăsături pentru a deosebi literele între ele.
• Unealta WEKA a fost folosită pentru testareaclasificatorilor şi construirea modelului fiecăruia, care să poată fi accesat în viitor.
• cele 26 de clase diferite (litere în alfabet) au determinat folosirea unui clasificator statistic(bazat pe Bayes decision theory)
Rezultate şi evaluare• s-a ales un set de antrenare de 200
şabloane pentru fiecare literă din alfabet(26 letters) (pentru 2 clasificatori)
• Pentru acelaşi set de şabloane de testclasificatorul Bayes s-a dovedit mai eficient; având procentajul de clasificare corectă mai mare decât clasificatorul IBK (99.359).
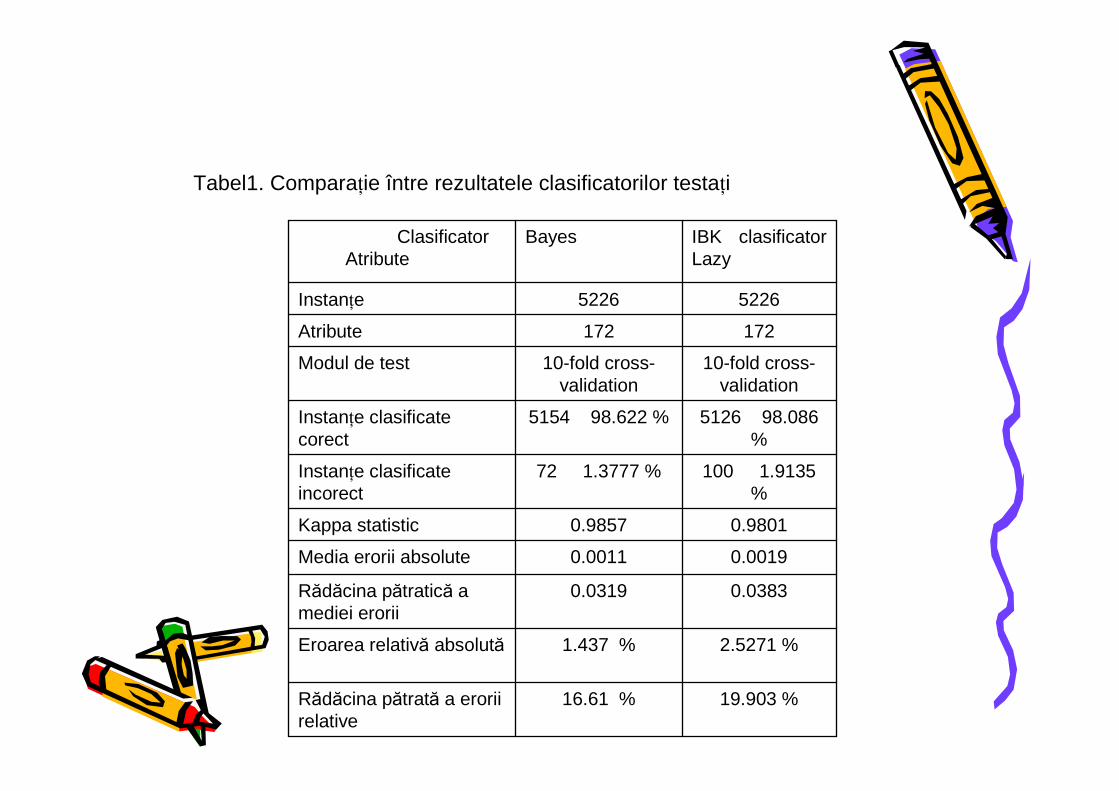
Tabel1. ComparaŃie între rezultatele clasificatorilor testaŃi
19.903 %16.61 %Rădăcina pătrată a erorii relative
2.5271 %1.437 %Eroarea relativă absolută
0.03830.0319Rădăcina pătratică a mediei erorii
0.00190.0011Media erorii absolute
0.98010.9857Kappa statistic
100 1.9135 %
72 1.3777 %InstanŃe clasificate incorect
5126 98.086 %
5154 98.622 %InstanŃe clasificate corect
10-fold cross-validation
10-fold cross-validation
Modul de test
172172Atribute
52265226InstanŃe
IBK clasificator Lazy
BayesClasificator Atribute
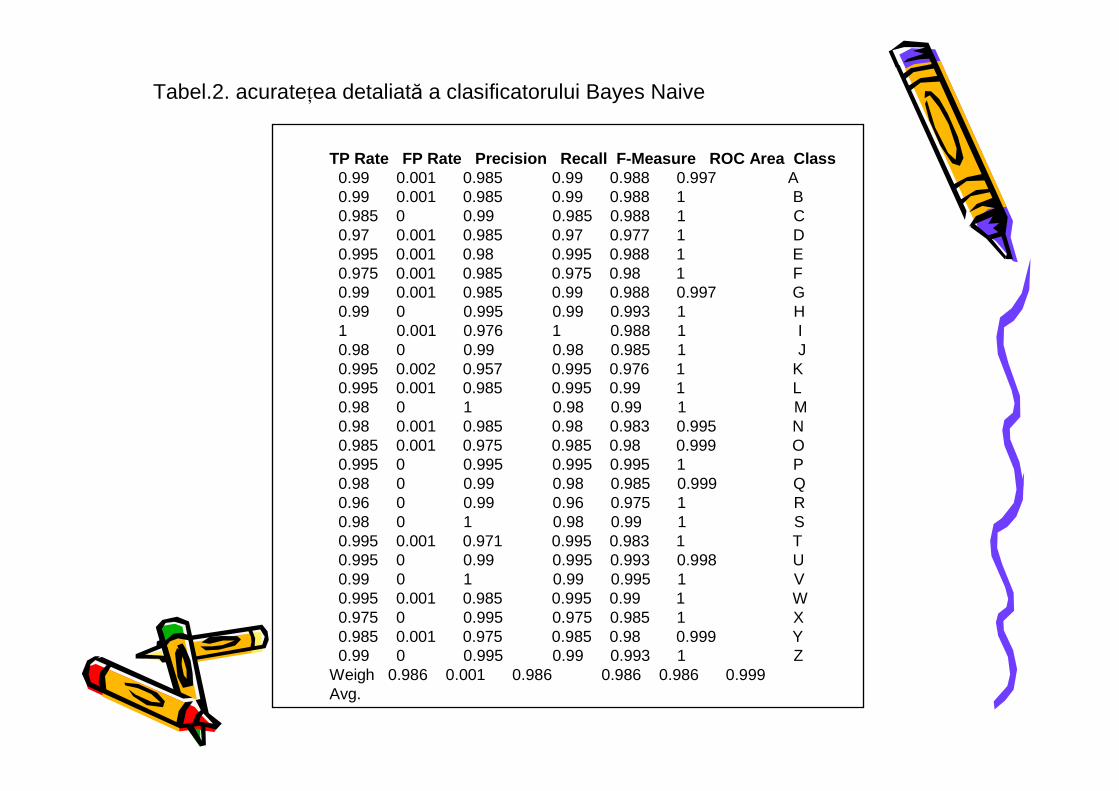
Tabel.2. acurateŃea detaliată a clasificatorului Bayes Naive
TP Rate FP Rate Precision Recall F-Measure ROC Area Class0.99 0.001 0.985 0.99 0.988 0.997 A0.99 0.001 0.985 0.99 0.988 1 B0.985 0 0.99 0.985 0.988 1 C0.97 0.001 0.985 0.97 0.977 1 D0.995 0.001 0.98 0.995 0.988 1 E0.975 0.001 0.985 0.975 0.98 1 F0.99 0.001 0.985 0.99 0.988 0.997 G0.99 0 0.995 0.99 0.993 1 H1 0.001 0.976 1 0.988 1 I0.98 0 0.99 0.98 0.985 1 J0.995 0.002 0.957 0.995 0.976 1 K0.995 0.001 0.985 0.995 0.99 1 L0.98 0 1 0.98 0.99 1 M0.98 0.001 0.985 0.98 0.983 0.995 N0.985 0.001 0.975 0.985 0.98 0.999 O0.995 0 0.995 0.995 0.995 1 P0.98 0 0.99 0.98 0.985 0.999 Q0.96 0 0.99 0.96 0.975 1 R0.98 0 1 0.98 0.99 1 S0.995 0.001 0.971 0.995 0.983 1 T0.995 0 0.99 0.995 0.993 0.998 U0.99 0 1 0.99 0.995 1 V0.995 0.001 0.985 0.995 0.99 1 W0.975 0 0.995 0.975 0.985 1 X0.985 0.001 0.975 0.985 0.98 0.999 Y0.99 0 0.995 0.99 0.993 1 Z
Weigh 0.986 0.001 0.986 0.986 0.986 0.999Avg.
Rezultate şi evaluare(continuare)
Pentru o imagine care conŃine text, provenită de la un sistem de tip whiteboard aplicaŃia returnează, cu o precizie de aprox 99% (pentru litere introduse individual), şirul de litere din imagine, având pentru fiecare informaŃii: -poziŃie -mărime, -identare. -spaŃiere
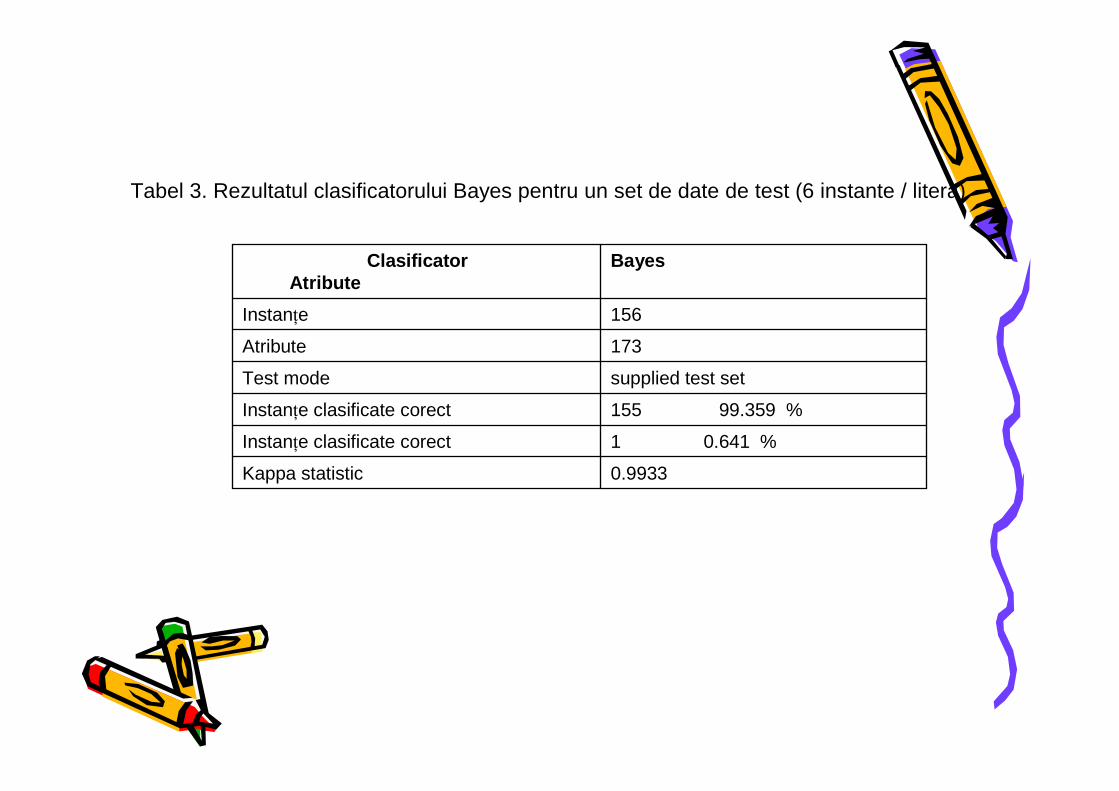
Tabel 3. Rezultatul clasificatorului Bayes pentru un set de date de test (6 instante / litera)
0.9933Kappa statistic
1 0.641 %InstanŃe clasificate corect
155 99.359 %InstanŃe clasificate corect
supplied test setTest mode
173Atribute
156InstanŃe
BayesClasificatorAtribute
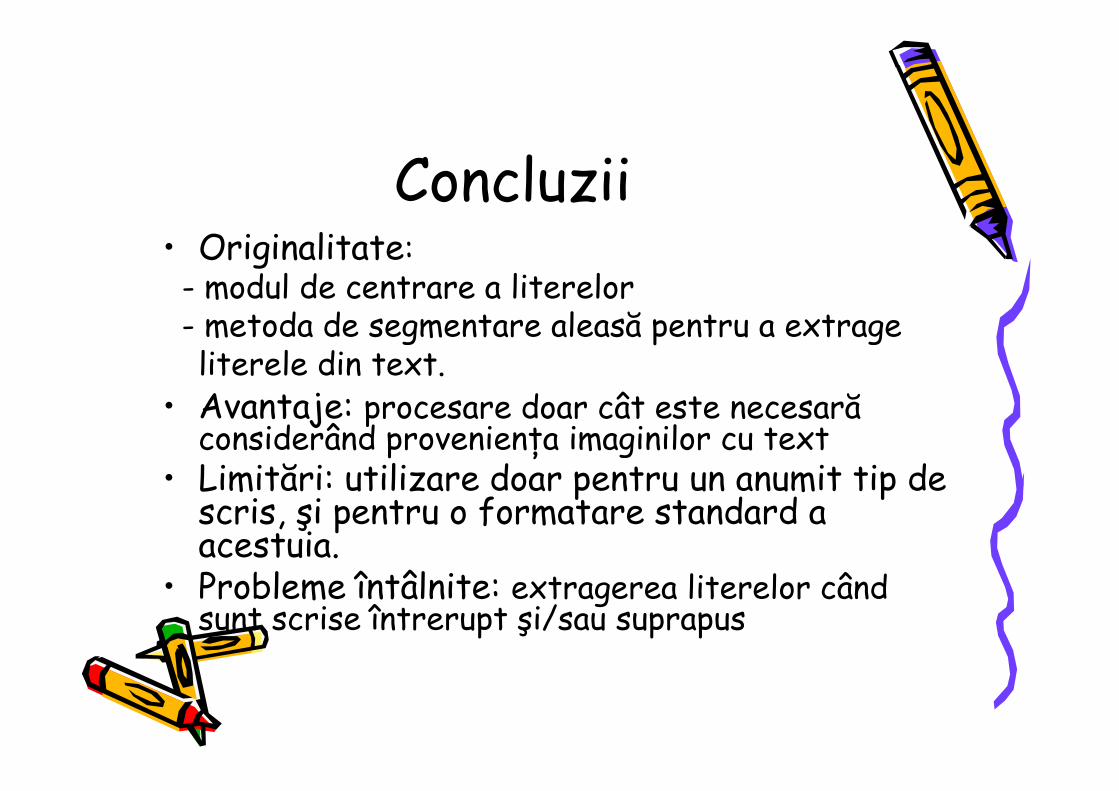
Concluzii• Originalitate:
- modul de centrare a literelor - metoda de segmentare aleasă pentru a extrage
literele din text.• Avantaje: procesare doar cât este necesară
considerând provenienŃa imaginilor cu text• Limitări: utilizare doar pentru un anumit tip de
scris, şi pentru o formatare standard a acestuia.
• Probleme întâlnite: extragerea literelor când sunt scrise întrerupt şi/sau suprapus
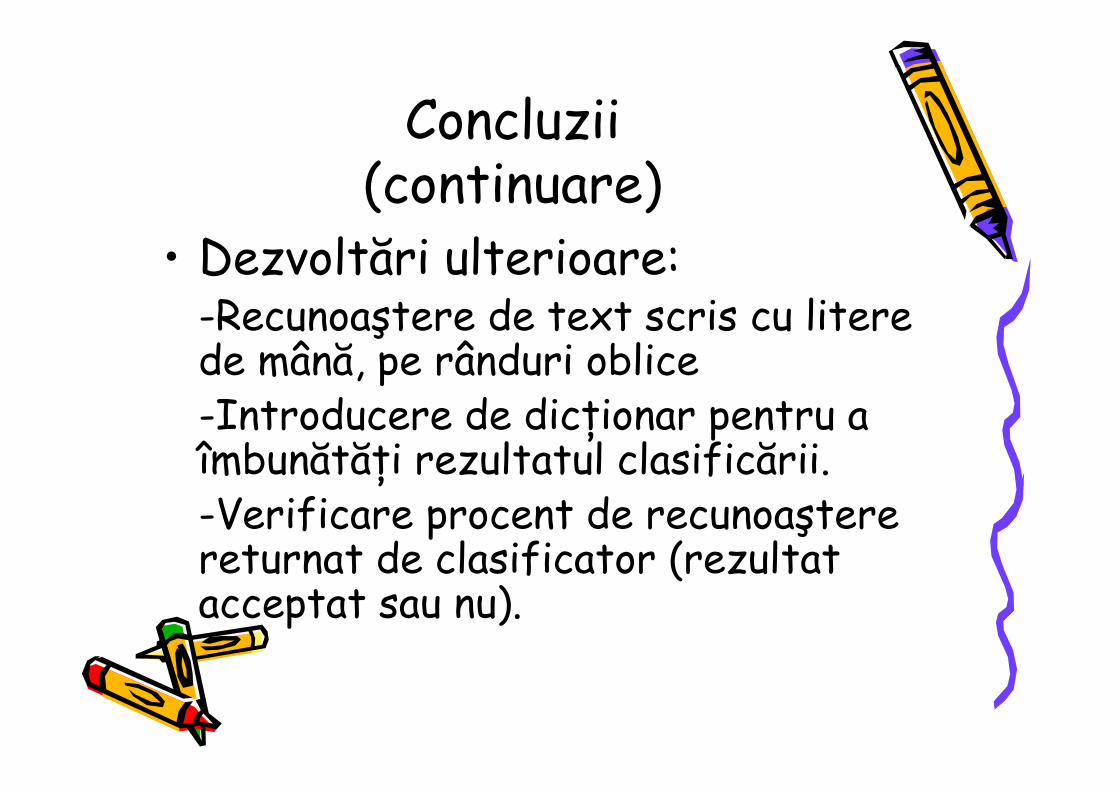
Concluzii(continuare)
• Dezvoltări ulterioare:-Recunoaştere de text scris cu litere de mână, pe rânduri oblice -Introducere de dicŃionar pentru a îmbunătăŃi rezultatul clasificării.-Verificare procent de recunoaştere returnat de clasificator (rezultat acceptat sau nu).
Tema de studiu individualFRANK Y. SHIH, IMAGE
PROCESSING AND PATTERN RECOGNITION - Fundamentals and Techniques, John Wiley & Sons, Inc., Hoboken, New Jersey, 2010.
Cap. 9.2 BAYES CLASSIFIER
Virtual Whiteboard with Text Recognition and Manipulation
Corina BoŃoiu, Lupou Marius Technical University of Cluj-Napoca
E-mail:[email protected],[email protected]
Abstract
Although the technical capabilities advanced a lot in education, the traditional blackboard is still in use. As a substitute whiteboards or flipcharts [1] have become a fixture in many offices, meeting rooms, school classrooms, and other work environments. One of their major disadvantages is their high cost and lack of portability. This paper describes a system which implements a virtual-whiteboard. The physical whiteboard is replaced by the projected image of a video-projector or any kind of display (PC, Notebook etc.). The user is allowed to interact (write, draw or issue commands) with the virtual whiteboard image through an IR-LED pointer. The actions of the user are captured through the IR camera which monitors the virtual whiteboard area and are merged with the content of the displayed image. The system integrates an application for character recognition and one for text and drawings manipulation allowing an easy on-line generation of PowerPoint-like presentation
1. Introduction According to the newest statistics [2] referring to the number of computers in the world, one can find out that 30 of 100 persons owns a personal computer at home. Information digitalization in all domains imposes new methods of capturing, processing and displaying the information. Traditional blackboards used in schools and also in presentations for adding additional information, tend to be replaced with a more digitalized method and why not more “clean”. Interactive whiteboards, which vary in size and are mounted in the front of classrooms, are connected to computers. A projector shows the image from a
desktop computer on a screen or board. Using an electronic pen or pointer, a teacher or student can interact with the images there, highlight or write notes on the screen, and incorporate graphics, sound, and video, the same way a desktop computer can [3]. Many different technologies can be employed by interactive whiteboards. One of the more common is infrared technology. Using infrared technology, an interactive whiteboard does not need a stylus. A finger or marker sees the infrared light projected toward the interactive whiteboard. Infrared technology can be combined with ultrasonic technology in creating interactive whiteboards. When the marker or stylus is places on the interactive whiteboard, small sound detectors use ultrasonic technology to locate the marker's position. This technology can be used on interactive whiteboards made of any material [4]. Existing Wiimote (remote IR camera) systems [5] are offering only interfacing functionalities, without any post-processing or data recognition/manipulation functionalities. Touch-screen whiteboards do not provide a complete affordable functionality, the current Smart-board designers being used only as a HID whit no processing modules. The proposed system tries to integrate most of the functionalities needed for whiteboard-like presentations: non-standard user interaction, handwriting recognition, text and drawing manipulation. The text recognition tool is introduced to avoid circular rewritings of information (e.g. something that is presented/ written can be provided to the auditors in electronic format). The image acquisition is done by a system containing: a low-cost monochrome camera with an IR-pass filter in front of it, a standard Bluetooth technology (used to link the computer and the camera) and an IR pointer used as pen. The first two elements of the system are included in the Wiimote [6].
The text recognition part is realized by training a classifier with test templates, which contain images representing handwritten letter specimens for the entire alphabet. This classifier is used to recognize each hand-written character which will be used to recompose the whole text written by the user. The text recognition part is used to create a PowerPoint-like presentation containing the interpreted text and images drawn by the user.
2. System architecture The system requires the following components:
- NintentoWii Remote IR camera [6] - Laptop/PC with a Bluetooth bundle
- IR Pen - VideoProjector (optional)
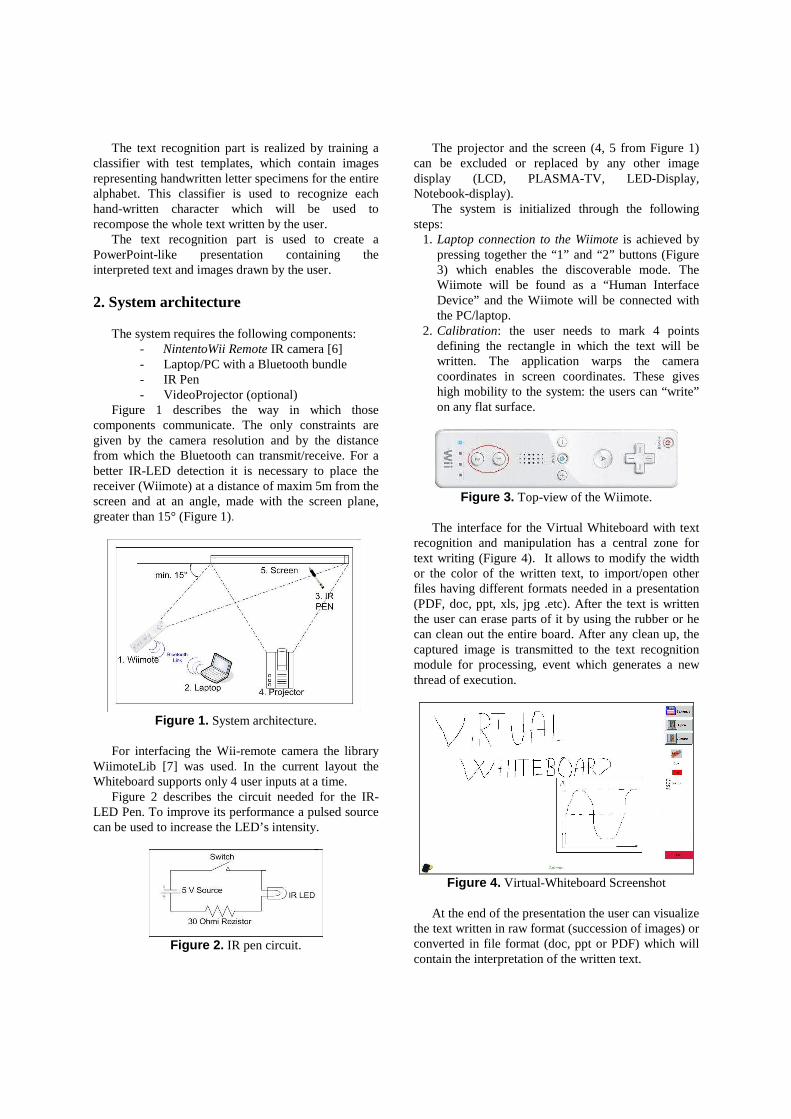
Figure 1 describes the way in which those components communicate. The only constraints are given by the camera resolution and by the distance from which the Bluetooth can transmit/receive. For a better IR-LED detection it is necessary to place the receiver (Wiimote) at a distance of maxim 5m from the screen and at an angle, made with the screen plane, greater than 15° (Figure 1).
Figure 1. System architecture.
For interfacing the Wii-remote camera the library WiimoteLib [7] was used. In the current layout the Whiteboard supports only 4 user inputs at a time. Figure 2 describes the circuit needed for the IR-LED Pen. To improve its performance a pulsed source can be used to increase the LED’s intensity.
Figure 2. IR pen circuit.
The projector and the screen (4, 5 from Figure 1) can be excluded or replaced by any other image display (LCD, PLASMA-TV, LED-Display, Notebook-display). The system is initialized through the following steps:
1. Laptop connection to the Wiimote is achieved by pressing together the “1” and “2” buttons (Figure 3) which enables the discoverable mode. The Wiimote will be found as a “Human Interface Device” and the Wiimote will be connected with the PC/laptop.
2. Calibration: the user needs to mark 4 points defining the rectangle in which the text will be written. The application warps the camera coordinates in screen coordinates. These gives high mobility to the system: the users can “write” on any flat surface.
Figure 3. Top-view of the Wiimote.
The interface for the Virtual Whiteboard with text recognition and manipulation has a central zone for text writing (Figure 4). It allows to modify the width or the color of the written text, to import/open other files having different formats needed in a presentation (PDF, doc, ppt, xls, jpg .etc). After the text is written the user can erase parts of it by using the rubber or he can clean out the entire board. After any clean up, the captured image is transmitted to the text recognition module for processing, event which generates a new thread of execution.
Figure 4. Virtual-Whiteboard Screenshot
At the end of the presentation the user can visualize
the text written in raw format (succession of images) or converted in file format (doc, ppt or PDF) which will contain the interpretation of the written text.
3. Text recognition Text recognition is an extensive domain which depends on many factors, each bringing a different difficulty level to the problem. Some of that are:
− The way the text is written (e.g. handwritten or capital);
− The text background (e.g. color, overlapping with other images);
− The language in which the text is written; − The direction of the writing (horizontal/vertical); − Width of character stroke (1px or many) − Different (variable) font sizes;
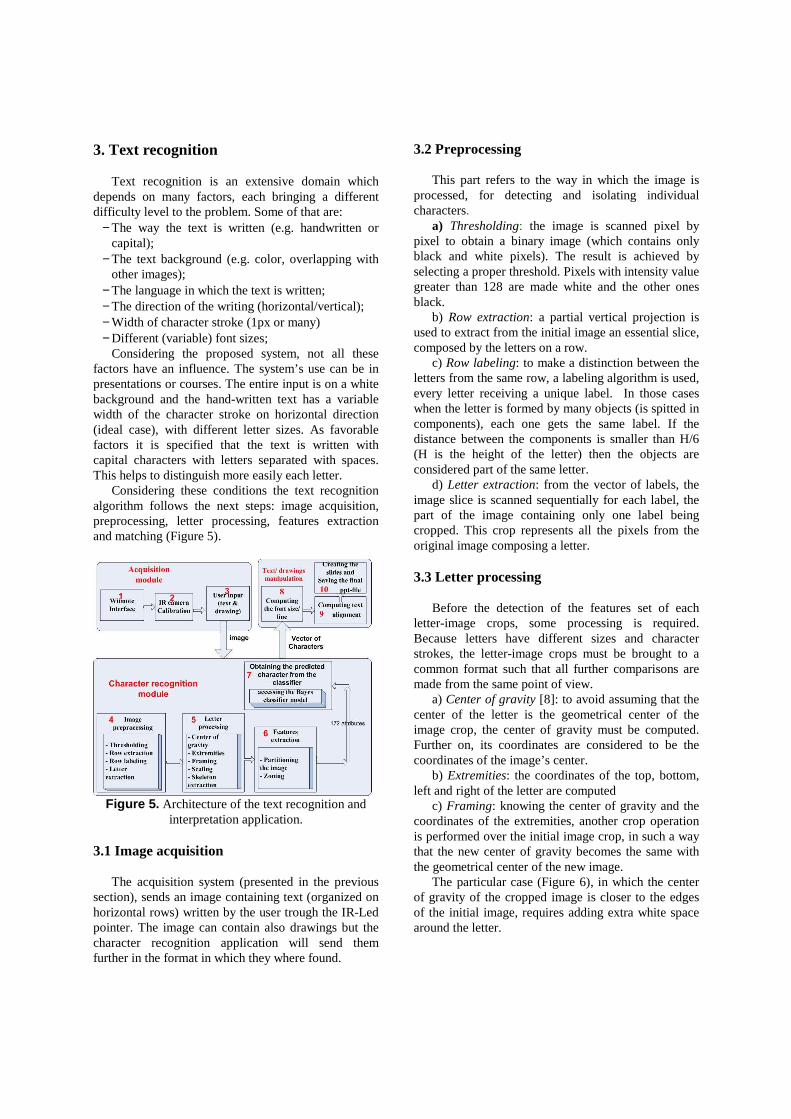
Considering the proposed system, not all these factors have an influence. The system’s use can be in presentations or courses. The entire input is on a white background and the hand-written text has a variable width of the character stroke on horizontal direction (ideal case), with different letter sizes. As favorable factors it is specified that the text is written with capital characters with letters separated with spaces. This helps to distinguish more easily each letter. Considering these conditions the text recognition algorithm follows the next steps: image acquisition, preprocessing, letter processing, features extraction and matching (Figure 5).
Figure 5. Architecture of the text recognition and
interpretation application. 3.1 Image acquisition The acquisition system (presented in the previous section), sends an image containing text (organized on horizontal rows) written by the user trough the IR-Led pointer. The image can contain also drawings but the character recognition application will send them further in the format in which they where found.
3.2 Preprocessing This part refers to the way in which the image is processed, for detecting and isolating individual characters. a) Thresholding: the image is scanned pixel by pixel to obtain a binary image (which contains only black and white pixels). The result is achieved by selecting a proper threshold. Pixels with intensity value greater than 128 are made white and the other ones black. b) Row extraction: a partial vertical projection is used to extract from the initial image an essential slice, composed by the letters on a row. c) Row labeling: to make a distinction between the letters from the same row, a labeling algorithm is used, every letter receiving a unique label. In those cases when the letter is formed by many objects (is spitted in components), each one gets the same label. If the distance between the components is smaller than H/6 (H is the height of the letter) then the objects are considered part of the same letter. d) Letter extraction: from the vector of labels, the image slice is scanned sequentially for each label, the part of the image containing only one label being cropped. This crop represents all the pixels from the original image composing a letter. 3.3 Letter processing Before the detection of the features set of each letter-image crops, some processing is required. Because letters have different sizes and character strokes, the letter-image crops must be brought to a common format such that all further comparisons are made from the same point of view. a) Center of gravity [8]: to avoid assuming that the center of the letter is the geometrical center of the image crop, the center of gravity must be computed. Further on, its coordinates are considered to be the coordinates of the image’s center. b) Extremities: the coordinates of the top, bottom, left and right of the letter are computed c) Framing: knowing the center of gravity and the coordinates of the extremities, another crop operation is performed over the initial image crop, in such a way that the new center of gravity becomes the same with the geometrical center of the new image. The particular case (Figure 6), in which the center of gravity of the cropped image is closer to the edges of the initial image, requires adding extra white space around the letter.
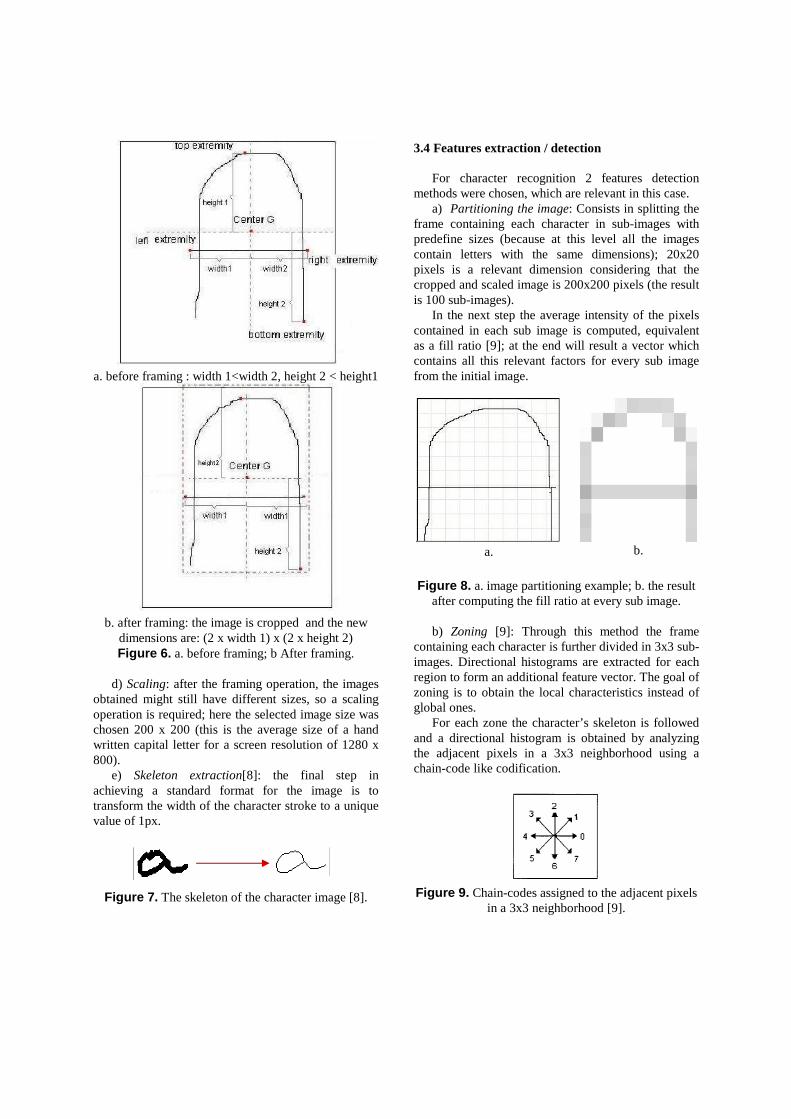
a. before framing : width 1<width 2, height 2 < height1
b. after framing: the image is cropped and the new
dimensions are: (2 x width 1) x (2 x height 2) Figure 6. a. before framing; b After framing.
d) Scaling: after the framing operation, the images obtained might still have different sizes, so a scaling operation is required; here the selected image size was chosen 200 x 200 (this is the average size of a hand written capital letter for a screen resolution of 1280 x 800). e) Skeleton extraction[8]: the final step in achieving a standard format for the image is to transform the width of the character stroke to a unique value of 1px.
Figure 7. The skeleton of the character image [8].
3.4 Features extraction / detection For character recognition 2 features detection methods were chosen, which are relevant in this case. a) Partitioning the image: Consists in splitting the frame containing each character in sub-images with predefine sizes (because at this level all the images contain letters with the same dimensions); 20x20 pixels is a relevant dimension considering that the cropped and scaled image is 200x200 pixels (the result is 100 sub-images). In the next step the average intensity of the pixels contained in each sub image is computed, equivalent as a fill ratio [9]; at the end will result a vector which contains all this relevant factors for every sub image from the initial image.
a.
b.
Figure 8. a. image partitioning example; b. the result
after computing the fill ratio at every sub image. b) Zoning [9]: Through this method the frame containing each character is further divided in 3x3 sub-images. Directional histograms are extracted for each region to form an additional feature vector. The goal of zoning is to obtain the local characteristics instead of global ones. For each zone the character’s skeleton is followed and a directional histogram is obtained by analyzing the adjacent pixels in a 3x3 neighborhood using a chain-code like codification.
Figure 9. Chain-codes assigned to the adjacent pixels in a 3x3 neighborhood [9].
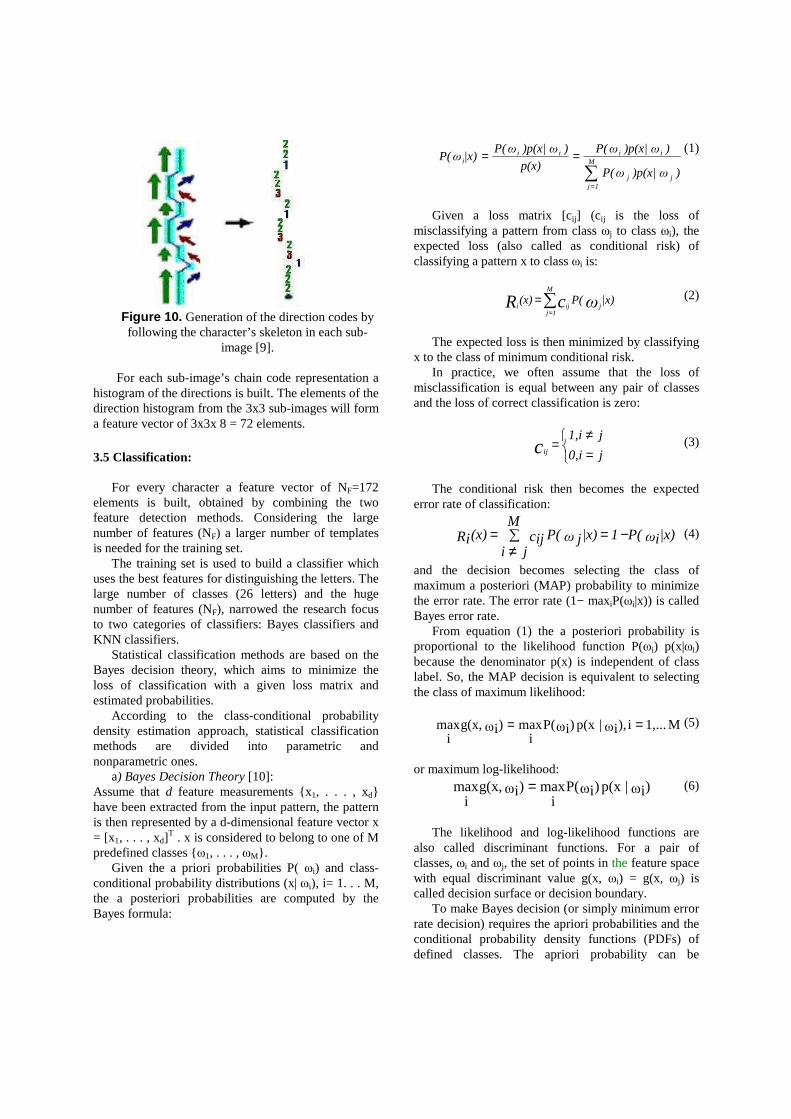
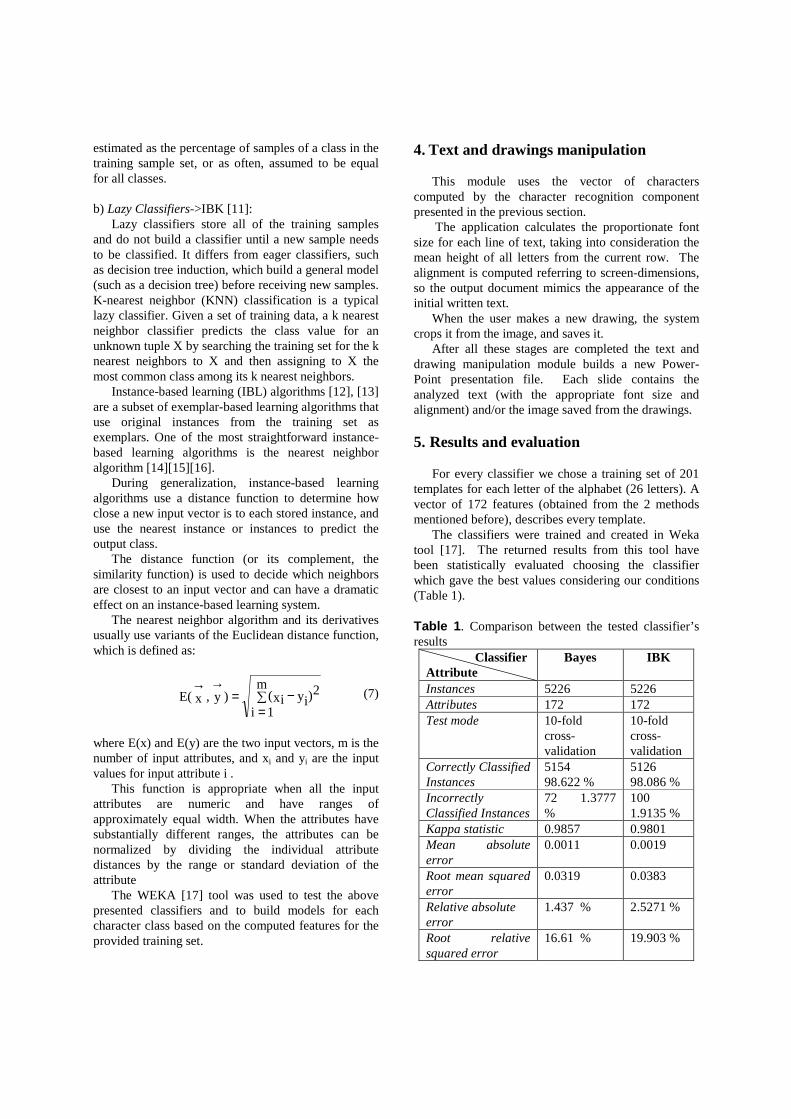
Figure 10. Generation of the direction codes by following the character’s skeleton in each sub-
image [9].
For each sub-image’s chain code representation a histogram of the directions is built. The elements of the direction histogram from the 3x3 sub-images will form a feature vector of 3x3x 8 = 72 elements.
3.5 Classification: For every character a feature vector of NF=172 elements is built, obtained by combining the two feature detection methods. Considering the large number of features (NF) a larger number of templates is needed for the training set. The training set is used to build a classifier which uses the best features for distinguishing the letters. The large number of classes (26 letters) and the huge number of features (NF), narrowed the research focus to two categories of classifiers: Bayes classifiers and KNN classifiers. Statistical classification methods are based on the Bayes decision theory, which aims to minimize the loss of classification with a given loss matrix and estimated probabilities. According to the class-conditional probability density estimation approach, statistical classification methods are divided into parametric and nonparametric ones. a) Bayes Decision Theory [10]: Assume that d feature measurements {x1, . . . , xd} have been extracted from the input pattern, the pattern is then represented by a d-dimensional feature vector x = [x1, . . . , xd]
T . x is considered to belong to one of M predefined classes {ω1, . . . , ωM}. Given the a priori probabilities P( ωi) and class-conditional probability distributions (x| ωi), i= 1. . . M, the a posteriori probabilities are computed by the Bayes formula:
∑=
== M
1jjj
iiiii
))p(x|ωP(ω
))p(x|ωP(ω
p(x)
))p(x|ωP(ω|x)P(ω
(1)
Given a loss matrix [cij] (cij is the loss of misclassifying a pattern from class ωj to class ωi), the expected loss (also called as conditional risk) of classifying a pattern x to class ωi is:
∑=
=M
1jjiji|x)P((x) ωcR (2)
The expected loss is then minimized by classifying x to the class of minimum conditional risk. In practice, we often assume that the loss of misclassification is equal between any pair of classes and the loss of correct classification is zero:
=≠
=j0,i
j1,icij
(3)
The conditional risk then becomes the expected error rate of classification:
|x)ωiP(M
ji1|x)ω jP(cij(x)Ri ∑
≠−== (4)
and the decision becomes selecting the class of maximum a posteriori (MAP) probability to minimize the error rate. The error rate (1− maxiP(ωi|x)) is called Bayes error rate. From equation (1) the a posteriori probability is proportional to the likelihood function P(ωi) p(x|ωi) because the denominator p(x) is independent of class label. So, the MAP decision is equivalent to selecting the class of maximum likelihood:
M1,...i),ωi|p(x)ωiP(i
max)ωig(x,i
max == (5)
or maximum log-likelihood:
)ωi|p(x)ωiP(i
max)ωig(x,i
max = (6)
The likelihood and log-likelihood functions are also called discriminant functions. For a pair of classes, ωi and ωj, the set of points in the feature space with equal discriminant value g(x, ωi) = g(x, ωj) is called decision surface or decision boundary. To make Bayes decision (or simply minimum error rate decision) requires the apriori probabilities and the conditional probability density functions (PDFs) of defined classes. The apriori probability can be
estimated as the percentage of samples of a class in the training sample set, or as often, assumed to be equal for all classes. b) Lazy Classifiers->IBK [11]: Lazy classifiers store all of the training samples and do not build a classifier until a new sample needs to be classified. It differs from eager classifiers, such as decision tree induction, which build a general model (such as a decision tree) before receiving new samples. K-nearest neighbor (KNN) classification is a typical lazy classifier. Given a set of training data, a k nearest neighbor classifier predicts the class value for an unknown tuple X by searching the training set for the k nearest neighbors to X and then assigning to X the most common class among its k nearest neighbors. Instance-based learning (IBL) algorithms [12], [13] are a subset of exemplar-based learning algorithms that use original instances from the training set as exemplars. One of the most straightforward instance-based learning algorithms is the nearest neighbor algorithm [14][15][16]. During generalization, instance-based learning algorithms use a distance function to determine how close a new input vector is to each stored instance, and use the nearest instance or instances to predict the output class. The distance function (or its complement, the similarity function) is used to decide which neighbors are closest to an input vector and can have a dramatic effect on an instance-based learning system. The nearest neighbor algorithm and its derivatives usually use variants of the Euclidean distance function, which is defined as:
∑=
−=→→ m
1i)yixi( 2)y,xE( (7)
where E(x) and E(y) are the two input vectors, m is the number of input attributes, and xi and yi are the input values for input attribute i . This function is appropriate when all the input attributes are numeric and have ranges of approximately equal width. When the attributes have substantially different ranges, the attributes can be normalized by dividing the individual attribute distances by the range or standard deviation of the attribute The WEKA [17] tool was used to test the above presented classifiers and to build models for each character class based on the computed features for the provided training set.
4. Text and drawings manipulation This module uses the vector of characters computed by the character recognition component presented in the previous section. The application calculates the proportionate font size for each line of text, taking into consideration the mean height of all letters from the current row. The alignment is computed referring to screen-dimensions, so the output document mimics the appearance of the initial written text. When the user makes a new drawing, the system crops it from the image, and saves it. After all these stages are completed the text and drawing manipulation module builds a new Power-Point presentation file. Each slide contains the analyzed text (with the appropriate font size and alignment) and/or the image saved from the drawings.
5. Results and evaluation For every classifier we chose a training set of 201 templates for each letter of the alphabet (26 letters). A vector of 172 features (obtained from the 2 methods mentioned before), describes every template. The classifiers were trained and created in Weka tool [17]. The returned results from this tool have been statistically evaluated choosing the classifier which gave the best values considering our conditions (Table 1). Table 1. Comparison between the tested classifier’s results
Classifier Attribute
Bayes IBK
Instances 5226 5226 Attributes 172 172 Test mode 10-fold
cross-validation
10-fold cross-validation
Correctly Classified Instances
5154 98.622 %
5126 98.086 %
Incorrectly Classified Instances
72 1.3777 %
100 1.9135 %
Kappa statistic 0.9857 0.9801 Mean absolute error
0.0011 0.0019
Root mean squared error
0.0319 0.0383
Relative absolute error
1.437 % 2.5271 %
Root relative squared error
16.61 % 19.903 %
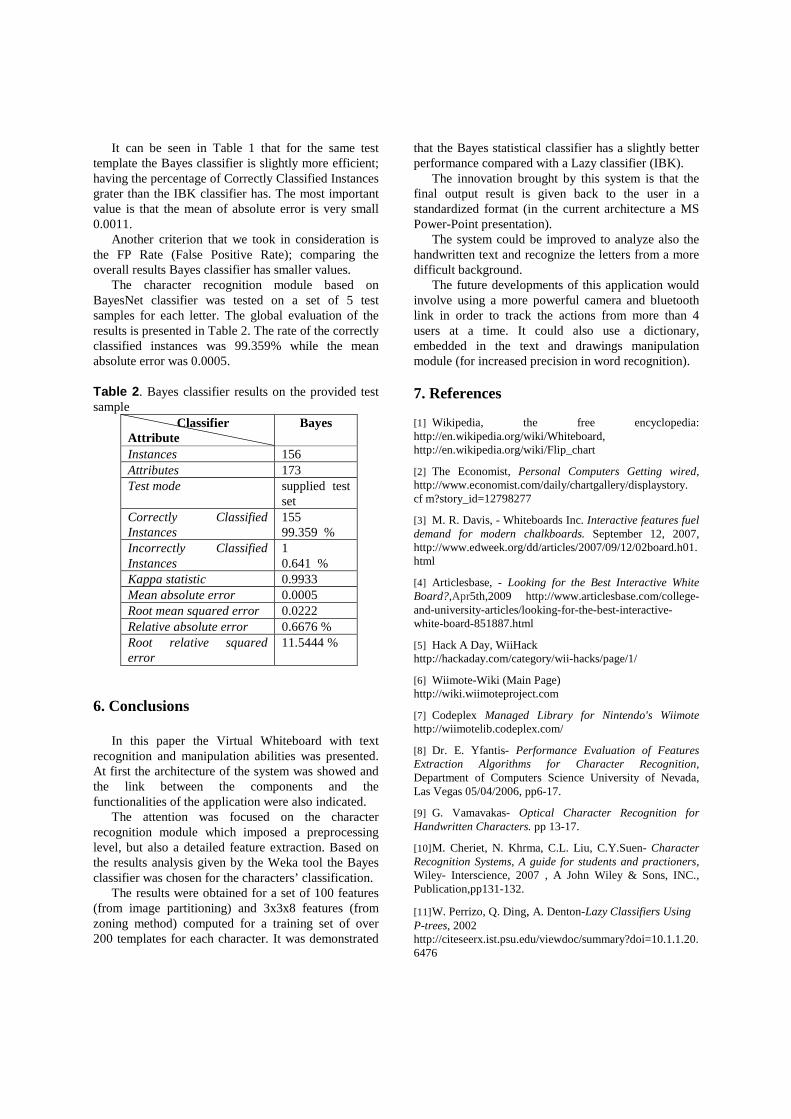
It can be seen in Table 1 that for the same test template the Bayes classifier is slightly more efficient; having the percentage of Correctly Classified Instances grater than the IBK classifier has. The most important value is that the mean of absolute error is very small 0.0011. Another criterion that we took in consideration is the FP Rate (False Positive Rate); comparing the overall results Bayes classifier has smaller values. The character recognition module based on BayesNet classifier was tested on a set of 5 test samples for each letter. The global evaluation of the results is presented in Table 2. The rate of the correctly classified instances was 99.359% while the mean absolute error was 0.0005. Table 2. Bayes classifier results on the provided test sample
Classifier Attribute
Bayes
Instances 156 Attributes 173 Test mode supplied test
set Correctly Classified Instances
155 99.359 %
Incorrectly Classified Instances
1 0.641 %
Kappa statistic 0.9933 Mean absolute error 0.0005 Root mean squared error 0.0222 Relative absolute error 0.6676 % Root relative squared error
11.5444 %
6. Conclusions
In this paper the Virtual Whiteboard with text recognition and manipulation abilities was presented. At first the architecture of the system was showed and the link between the components and the functionalities of the application were also indicated. The attention was focused on the character recognition module which imposed a preprocessing level, but also a detailed feature extraction. Based on the results analysis given by the Weka tool the Bayes classifier was chosen for the characters’ classification. The results were obtained for a set of 100 features (from image partitioning) and 3x3x8 features (from zoning method) computed for a training set of over 200 templates for each character. It was demonstrated
that the Bayes statistical classifier has a slightly better performance compared with a Lazy classifier (IBK). The innovation brought by this system is that the final output result is given back to the user in a standardized format (in the current architecture a MS Power-Point presentation). The system could be improved to analyze also the handwritten text and recognize the letters from a more difficult background. The future developments of this application would involve using a more powerful camera and bluetooth link in order to track the actions from more than 4 users at a time. It could also use a dictionary, embedded in the text and drawings manipulation module (for increased precision in word recognition). 7. References [1] Wikipedia, the free encyclopedia: http://en.wikipedia.org/wiki/Whiteboard, http://en.wikipedia.org/wiki/Flip_chart
[2] The Economist, Personal Computers Getting wired, http://www.economist.com/daily/chartgallery/displaystory. cf m?story_id=12798277
[3] M. R. Davis, - Whiteboards Inc. Interactive features fuel demand for modern chalkboards. September 12, 2007, http://www.edweek.org/dd/articles/2007/09/12/02board.h01.html
[4] Articlesbase, - Looking for the Best Interactive White Board?,Apr5th,2009 http://www.articlesbase.com/college-and-university-articles/looking-for-the-best-interactive-white-board-851887.html
[5] Hack A Day, WiiHack http://hackaday.com/category/wii-hacks/page/1/
[6] Wiimote-Wiki (Main Page) http://wiki.wiimoteproject.com
[7] Codeplex Managed Library for Nintendo's Wiimote http://wiimotelib.codeplex.com/
[8] Dr. E. Yfantis- Performance Evaluation of Features Extraction Algorithms for Character Recognition, Department of Computers Science University of Nevada, Las Vegas 05/04/2006, pp6-17.
[9] G. Vamavakas- Optical Character Recognition for Handwritten Characters. pp 13-17.
[10] M. Cheriet, N. Khrma, C.L. Liu, C.Y.Suen- Character Recognition Systems, A guide for students and practioners, Wiley- Interscience, 2007 , A John Wiley & Sons, INC., Publication,pp131-132.
[11] W. Perrizo, Q. Ding, A. Denton-Lazy Classifiers Using P-trees, 2002 http://citeseerx.ist.psu.edu/viewdoc/summary?doi=10.1.1.20.6476
[12] D. R. Wilson, T. R. Martinez - Reduction Techniques for Instance-Based Learning Algorithms, 2000 Kluwer Academic Publishers, pp 1-2
[13] Aha, D.W., Kibler, D., & Albert, M. K. (1991). Instance-based learning algorithms. Machine Learning
[14] Cover, T. M. & Hart, P. E. (1967). Nearest neighbor pattern classification. Institute of Electrical and Electronics Engineers Transactions on Information Theory, pp13 (1), pp21–27.
[15] Hart, P. E. (1968). The condensed nearest neighbor rule. IEEE Transactions on Information Theory, 14, 515–516.
[16] Dasarathy, B. V. (1991). Nearest neighbor (NN) norms: NN pattern classification techniques. Los Alamitos, CA: IEEE Computer Society Press.
[17] Weka 3: Data Mining Software http://www.cs.waikato.ac.nz/ml/weka/