industria textila 6 2018revistaindustriatextila.ro/images/2018/06/1/textila nr 6_2018 web_1.pdf ·...
TRANSCRIPT

IndustriaTextila
ISSN 1222–5347
6/2018
COLEGIULDE REDACTIE:
Dr. ing. CARMEN GHIŢULEASACS I – DIRECTOR GENERAL
Institutul Naţional de Cercetare-Dezvoltare pentru Textile şi Pielărie – Bucureşti
Dr. ing. EMILIA VISILEANUCS I – EDITOR ŞEF
Institutul Naţional de Cercetare-Dezvoltare pentru Textile şi Pielărie – Bucureşti
Conf. univ. dr. ing. MARIANA URSACHEDECAN
Facultatea de Textile-Pielărieşi Management Industrial, Universitatea
Tehnică „Ghe. Asachi“ – Iaşi
Prof. dr. GELU ONOSECS I
Universitatea de Medicină şi Farmacie„Carol Davila“ – Bucureşti
Prof. dr. ing. ERHAN ÖNERMarmara University – Turcia
Prof. dr. S. MUGE YUKSELOGLUMarmara University – Turcia
Prof. univ. dr. DOINA I. POPESCUAcademia de Studii Economice – Bucureşti
Prof. univ. dr. ing. CARMEN LOGHINPRO-RECTOR
Universitatea Tehnică „Ghe. Asachi“ – Iaşi
Prof. univ. dr. MARGARETA STELEA FLORESCUAcademia de Studii Economice – Bucureşti
Prof. dr. ing. LUIS ALMEIDAUniversity of Minho – Portugal
Prof. dr. LUCIAN CONSTANTIN HANGANUUniversitatea Tehnică „Ghe. Asachi“ – Iaşi
Dr. AMINODDIN HAJI PhD, MSc, BSc, Textile Chemistry
and Fiber ScienceASSISTANT PROFESSOR
Textile Engineering DepartmentYazd University
Yazd, Iran
Dr. ADNAN MAZARIASSISTANT PROFESSOR
Department of Textile Clothing Faculty of Textile Engineering
Technical University of LiberecCzech Republic
429–433
434–439
440–445
446–450
451–457
458–465
466–471
472–477
ÖZGÜN CAN, GABİL ABDULLAProiectarea unui nou mecanism de țesere cu ratieră rotativă
RODICA HARPA, EMILIA VISILEANUDe la designul țesăturii la fabricarea rochiei, având în vedere adecvanța țesăturii la utilizarea finală
MOHAMED TAHER HALIMI, MOHAMED BEN HASSEN, BECHIR WANNASSIOptimizarea și valorificarea fibrelor reciclate din nețesute
SAOUSSEN ZANNEN, RIADH ZOUARI, MOHAMED BEN HASSEN, LAURENCE JEANMICHEL, STEPHANE MOLINAProiectarea compozitelor cu rezistență mecanică și termică ridicată
IULIANA DUMITRESCU, ELENA-CORNELIA MITRAN, ELENA VARZARU, RODICA CONSTANTINESCU, OVIDIU GEORGE IORDACHE, DANA STEFANESCU, MARIANA PISLARU Efectele multifuncționale ale textilelor vopsite cu extract din rădăcină de roibă (Rubiatinctoria)
JAWAD NAEEM, ADNAN MAZARI, ZDENE KUS, ENGIN AKCAGUN, ANTONIN HAVELKAAnaliza proprietăților termice, rezistența la vapori de apă și transmisia căldurii radiante prin diferite combinații de îmbrăcăminte de protecție pentru pompieri
LING JIE YU, RONG WU WANG, JIN FENG ZHOUO abordare nouă pentru identificarea pilingului pe baza metodei Depth From Focus (adâncime de focalizare)
RAJA FAHAD QURESHI, KHADIJA QURESHI, ZEESHAN KHATRI, SAMANDER ALI MALIK, A. WAQAR RAJPUT, INAMULLAH BHATTI Eliminarea eficientă a colorantului Indigo din soluția apoasă printr-o metodă inovatoare cu membrană lichidă de emulsie
IOANA CORINA MOGA, MIHAI GABRIEL MATACHE, ILEANA CRISTINA COVALIUEtapa avansată de tratare a apelor reziduale pentru industria textilă 478–482
SABINA OLARU, CATALIN GROSU, EFTALEA CĂRPUȘ, PYERINA CARMEN GHIȚULEASA, MIRELA GRETI PUIU, SANDA-MIRELA BOGYO, SORINA LUMINIȚA BUCURAȘClustere din domeniul textile-confecții – motor de dezvoltare sustenabilă a economiei românești 483–488
DARJAN KARABASEVIC, DRAGISA STANUJKIC, MIODRAG BRZAKOVIC, MLADJAN MAKSIMOVIC, PAVLE BRZAKOVICEvaluarea site-urilor web din industria textilă prin aplicarea standardului ISO/IEC 9126-4 și a metodei EDAS 489–494
IYAN HONG, XUECHUN CAO, YAN CHEN, XIANYI ZENG, YU CHEN, ZHIJUAN PANCadrul valoric perceput de consumator asupra articolelor de modă pentru studentele din Franța 495–501
SEHER KANAT, MAZHAR HUSSAIN PEERZADA, SADAF AFTAB ABBASI, TURAN ATILGANAnaliza SWOT a industriei textile și de îmbrăcăminte din Pakistan 502–510
AMINODDIN HAJI, MAJID NASIRIBOROUMANDStudiul statistic al efectului mordantului metallic asupra rezistenței la tracțiune a lânii 511–518
NEZLA ÜNAL, EMİNE UTKUNImpactul formelor corpului feminine asupra creării tiparelor 519–523
Editatã în 6 nr./an, indexatã ºi recenzatã în:Edited in 6 issues per year, indexed and abstracted in:
Science Citation Index Expanded (SciSearch®), Materials ScienceCitation Index®, Journal Citation Reports/Science Edition, World Textile
Abstracts, Chemical Abstracts, VINITI, Scopus, Toga FIZ technikProQuest Central
Editatã cu sprijinul Ministerului Cercetãrii ºi Inovãrii
Revistã cotatã ISI ºi inclusã în Master Journal List a Institutului pentruªtiinþa Informãrii din Philadelphia – S.U.A., începând cu vol. 58, nr. 1/2007/ISI rated magazine, included in the ISI Master Journal List of the Instituteof Science Information, Philadelphia, USA, starting with vol. 58, no. 1/2007
¸
˘
427industria textila 2018, vol. 69, nr. 6˘
Recunoscutã în România, în domeniul ªtiinþelor inginereºti, de cãtre
Consiliul Naþional al Cercetãrii ªtiinþifice din Învãþãmântul Superior(C.N.C.S.I.S.), în grupa A /
Aknowledged in Romania, in the engineering sciences domain,
by the National Council of the Scientific Research from the Higher Education
(CNCSIS), in group A
428industria textila 2018, vol. 69, nr. 6˘
429
434
440
446
451
458
466
472
478
483
489
495
502
511
519
Design of a new rotary dobby mechanism
From fabric design to the dress manufacturing considering the fabric’s suitabilitywith the end use
Optimization and valorization of recycled fiber in non-woven fabric
Design of high mechanical and thermal resistant composites using marine plant waste
Multi-functional effects of textiles dyed with madder roots powder (Rubiatinctoria)
Analysis of thermal properties, water vapor resistance and radiant heat transmissionthrough different combinations of firefighter protective clothing
A novel approach for identification of pills based on the method of Depth From Focus
Efficient removal of Indigo dye from aqueous solution by an innovative method ofemulsion liquid membrane
Advanced wastewater treatment stage for textile industry
Textile & clothing clusters – sustainable development drive of the Romanian economy
The evaluation of websites in the textile industry by applying ISO/IEC 9126-4 standard andthe EDAS method
A framework of consumer perceived value on fashion products for female collegestudents of France
SWOT analysis of Pakistan’s textile and clothing industry
Statistical study of the effect of metallic mordants on tensile strength of wool
Impacts of female body shapes on patternmaking
EDITORIAL STAFF
Editor-in-chief: Dr. eng. Emilia Visileanu
Graphic designer: Florin Prisecaru
e-mail: [email protected]
Scientific reviewers for the papers published in this number :
The INDUSTRIA TEXTILA magazine, edited by INCDTP BUCHAREST, implements and respects Regulation 2016/679/EU on the protection of individuals with
regard to the processing of personal data and on the free movement of such data (“RGPD”). For information, please visit the Personal Data Processing Protection
Policy link: E-mail DPO [email protected]
Contents
Journal edited in colaboration with Editura AGIR , 118 Calea Victoriei, sector 1, Bucharest, tel./fax: 021-316.89.92; 021-316.89.93;
e-mail: [email protected], www.edituraagir.ro
PhD Assistant Professor M. Naveed, Department of Organic and Nano Engineering. Smart Organic Materials Research Lab.Hanyang University, Seoul, S. Korea
PhD Assistant Professor Khairul Sozana, Faculty of Chemical and Energy Engineering University Technology, MalaysiaPhD Assistant Professor Chiranjib Patra, Information Technology Calcutta Institute of Engineering and Management, India
PhD Melissa Wagner, University of Lille, FrancePhD Yuyang Wang, Internation Center for Numerical Methods in Engineering, Universitat Politècnica de Catalunya, Spain
PhD Associate Professor Kedafi Belkhir, GEMTEX - ENSAIT RoubaixPhD Mehdi Keshavarz Ghorabaee, Department of Industrial Management Allameh Tabataba’i University (ATU), Iran
PhD Komeil Nasouri, Textile Engineering Department, Isfahan University of Technology, Isfahan, Iran
ÖZGÜN CAN, GABİL ABDULLA
RODICA HARPA, EMILIA VISILEANU
MOHAMED TAHER HALIMI, MOHAMED BEN HASSEN, BECHIR WANNASSI
SAOUSSEN ZANNEN, RIADH ZOUARI, MOHAMED BEN HASSEN, LAURENCE JEANMICHEL, STEPHANE MOLINA
IULIANA DUMITRESCU, ELENA-CORNELIA MITRAN, ELENA VARZARU, RODICA CONSTANTINESCU, OVIDIU GEORGE IORDACHE, DANA STEFANESCU, MARIANA PISLARU
JAWAD NAEEM, ADNAN MAZARI, ZDENE KUS, ENGIN AKCAGUN, ANTONIN HAVELKA
LING JIE YU, RONG WU WANG, JIN FENG ZHOU
RAJA FAHAD QURESHI, KHADIJA QURESHI, ZEESHAN KHATRI, SAMANDER ALI MALIK, A. WAQAR RAJPUT, INAMULLAH BHATTI
IOANA CORINA MOGA, MIHAI GABRIEL MATACHE, ILEANA CRISTINA COVALIU
SABINA OLARU, CATALIN GROSU,EFTALEA CĂRPUȘ, PYERINA CARMEN GHIȚULEASA, MIRELA GRETI PUIU, SANDA-MIRELA BOGYO, SORINA LUMINIȚA BUCURAȘ
DARJAN KARABASEVIC, DRAGISA STANUJKIC, MIODRAG BRZAKOVIC, MLADJAN MAKSIMOVIC, PAVLE BRZAKOVIC
YAN HONG, XUECHUN CAO, YAN CHEN, XIANYI ZENG, YU CHEN, ZHIJUAN PAN
SEHER KANAT, MAZHAR HUSSAIN PEERZADA, SADAF AFTAB ABBASI, TURAN ATILGAN
AMINODDIN HAJI, MAJID NASIRIBOROUMAND
NEZLA ÜNAL, EMİNE UTKUN
INTRODUCTIONWoven fabrics are formed by crossing of weft andwarp yarn groups under and over each other. In orderfor the weft yarns to be connected to the warpthreads, it is necessary to separate the warp yarngroups into two different layers. This layer with a tri-angular section is called the shed [1–3]. The shed types are classified in three groups:1. According to the geometric form of the shed; sym-
metrical opening sheds at the top, bottom and bothsides [4–5].
2. According to the layout of the weft yarns in theshed; regular (clean), irregular (dirty) and semi-regular (semi-clean) sheds [6–8].
3. According to shape of shed closing; open, semi-open, bottom and middle position closed sheds[7–8].
Shedding process directly affects the weaving perfor-mance and speed. Many different shedding mecha-
nisms have been developed for the shed openingsystems. These are cam, dobby and jacquard shedopening mechanisms. Nowadays, rotary dobbieshave been developed for the shedding operations inhigh-speed modern weaving machines. The rotarydobbies are the dobby mechanisms that convert therotational motion of the main shaft of the weavingmachine into a up-down motion of the frames bymeans of various gears-arms and eccentrics (cam).
Working principle of the classic rotary dobby
A classic rotary dobby consists of three main parts:1. Drive mechanism with eccentrics (cams);2. Selection mechanism for determining the position
of the frames by cutting the connection betweenthe eccentric shaft and the eccentric according tothe weave pattern;
3. The part that generates the variable dobby shaftmotion (modulator) [9].
Design of a new rotary dobby mechanism
ÖZGÜN CAN GABİL ABDULLA
REZUMAT – ABSTRACT
Proiectarea unui nou mecanism de țesere cu ratieră rotativă
Mecanisme speciale cu camă care necesită o tehnologie avansată au fost utilizate în dispozitivul de acționare a noilorratiere rotative. Electromagneții sunt în general preferați în mecanismele de selecție, dar aceștia măresc costurile deproducție și fac mai dificilă întreținerea. Această lucrare își propune să conceapă un nou tip de ratieră rotativă, diferităde celelalte ratiere. În primul rând, au fost elaborate proiectarea și sinteza unui nou mecanism de acționare cu opt poziții,la același nivel și la nivel dublu pentru mișcarea oscilantă de 180°. Rezultatele cercetării au arătat că atât valorileteoretice, cât și cele experimentale ale unghiurilor de staționare ale mecanismului de acționare sunt compatibile una cucealaltă. Astfel, s-a propus ca mecanismele proiectate să poată fi utilizate în locul mecanismelor speciale cu came laratierele rotative. Pistoanele pneumatice și elementele de blocare au fost utilizate în mecanismul de selecție a ratiereirotative dezvoltate în acest studiu. În timpul testelor de performanță, s-a observat că pistonul pneumatic și elementelede blocare pot fi utilizate în locul electromagneților, acționând în armonie unul cu celălalt. Ca o concluzie, atunci când afost testată performanța de lucru a ratierei, s-a confirmat că aceasta a funcționat cu o performanță ridicată și în moddurabil, cu toate mecanismele componente. În plus, procesul de formare a rostului a fost efectuat cu precizie. În celedin urmă, a fost proiectată și produsă o nouă ratieră rotativă, care a fost ușor de construit cu costuri reduse.
Cuvinte-cheie: țesere, formare a rostului, ratieră, proiectarea mecanismului, ratieră rotativă
Design of a new rotary dobby mechanism
Special cam mechanisms which require advanced technology are used in the drive mechanism of nowadays rotarydobbies. Electromagnets are generally preferred in the selection mechanisms which increase the cost of production andmake the maintenance more difficult. This work aims to design a new rotary dobby different from the other dobbies. Firstof all, the design and synthesis of a new drive mechanism with eight members, equal and double standby at 180°oscillating motion was developed. The results of the research revealed that both the theoretical and the experimentalvalues of the waiting angles of drive mechanism are compatible with each other. Thus, it has been proposed thatdesigned mechanism can be used instead of the special cams mechanisms in the rotary dobbies. Pneumatic pistonsand locks have been used in the selection mechanism of rotating dobby developed in the study. During the performencetests, it has been observed that the pneumatic piston and locks can be used instead of the electromagnets by providingthat they work in harmony with each other. As a conclusion, when the working performance of dobby was observed, itwas confirmed that dobby worked with a high performance and durably with all of its mechanisms. Additionally theshedding process was precisely carried out. Finally a new rotary dobby which was easy to construct with low cost hasbeen designed and produced.
Keywords: weaving, shedding, dobby, design of mechanism, rotary dobby
429industria textila 2018, vol. 69, nr. 6˘
In recent years it has been observedthat the speed of rotary armatures hasreached 1000 rpm and above. Thus, itis possible to operate the rotary dob-bies at high speeds in air-jet andwater-jet weaving machines [10].Nowadays electronically controlledrotary dobbies are used. In rotary doobies, the one-way rotarymotion obtained from the drive mech-anism must be transmitted to the mainshaft of the machine. In order toachieve this kind of movement, thecam mechanism with the specialstructure rotating in the constantvelocity is used in the drive mecha-nism of the rotary dobbies. In additionto the cam mechanisms in the dobbydrive mechanism, servo-motor, armand gear-arm mechanisms have alsobeen used [11].New dobby designs have beenreached in research on rotary dob-bies. Some of these are listed below:• Shape enclosed cam pair has been used and pro-
posed in the developed new rotary dobby’s drivemechanism [5].
• New methods have been proposed using theADAMS® program in the design of the rotary dobbydrive mechanism cams [12].
• New cam profile design and synthesis are pro-posed for the regulation of the motion profiles of thecam mechanisms used in the dobbies and reducingthe residual vibrations of the frames [13].
• Special eight-arms mechanism has been synthe-sized and proposed instead of the cams used in thedrive mechanism of the dobbies [14].
• New electronic selection mechanism is proposedinstead of the electronic selection mechanism usedin rotary dobbies. In this mechanism, the number ofmoving members is reduced and the test set is runsmoothly [15].
Furthermore, studies have been carried out related tothe subject and it has been concluded that negativecontrol dobbies managed by micro processors will bereplaced by nowaday’s positive dobbies and informa-tion has been obtained that the shedding mecha-nisms driven by the servo motors may be widespreadin the near future [9, 16]. The prominent feature aboutthe new rotary dobby mechanism developed for thestudy and is the drive mechanism and the selectionmechanism which makes it different from the beforedeveloped rotary dobby mechanisms.
NEW DESIGNED ROTARY DOBBY
Designing drive mechanism of new rotary dobby
This study includes the design and synthesis of themechanism proposed as an alternative to the specialcam mechanisms has been developed in the drivemechanism of the rotary dobbies used today. Themechanism is designed and produced to have 8 mem-bers, to make equal and double standby swing motion
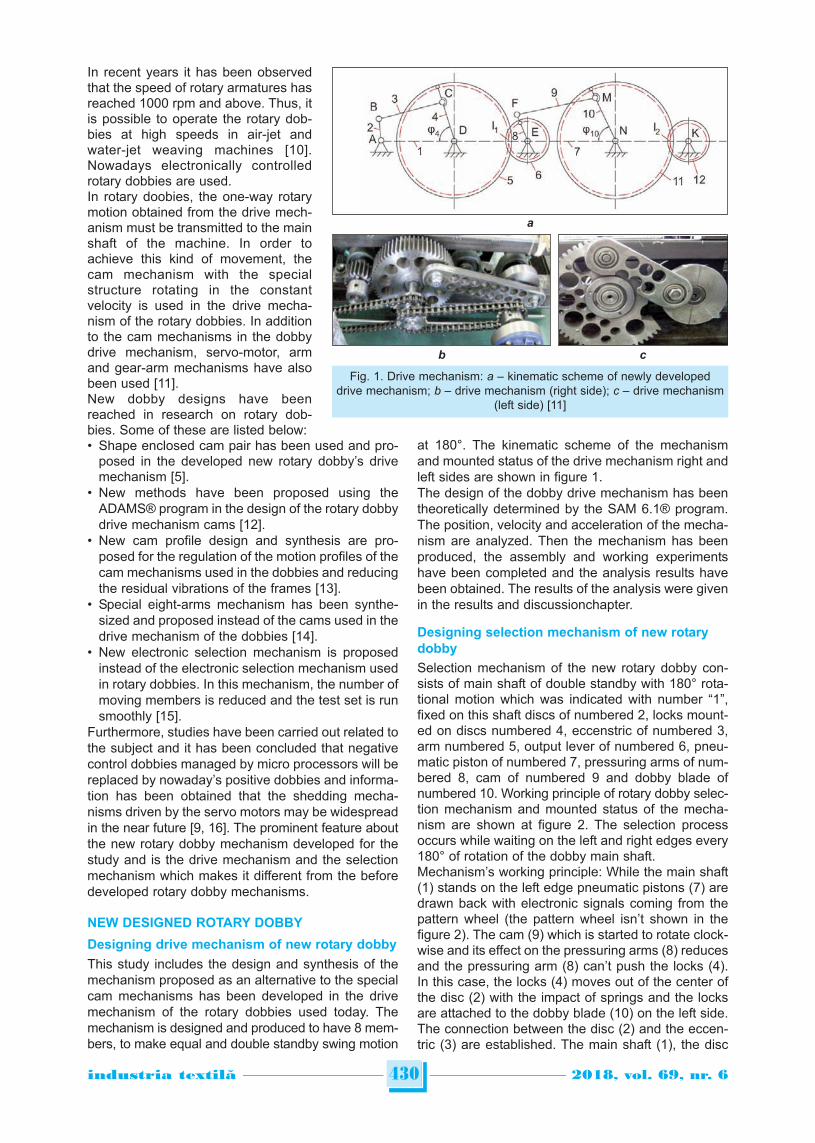
at 180°. The kinematic scheme of the mechanismand mounted status of the drive mechanism right andleft sides are shown in figure 1.The design of the dobby drive mechanism has beentheoretically determined by the SAM 6.1® program.The position, velocity and acceleration of the mecha-nism are analyzed. Then the mechanism has beenproduced, the assembly and working experimentshave been completed and the analysis results havebeen obtained. The results of the analysis were givenin the results and discussionchapter.
Designing selection mechanism of new rotarydobby
Selection mechanism of the new rotary dobby con-sists of main shaft of double standby with 180° rota-tional motion which was indicated with number “1”,fixed on this shaft discs of numbered 2, locks mount-ed on discs numbered 4, eccenstric of numbered 3,arm numbered 5, output lever of numbered 6, pneu-matic piston of numbered 7, pressuring arms of num-bered 8, cam of numbered 9 and dobby blade ofnumbered 10. Working principle of rotary dobby selec-tion mechanism and mounted status of the mecha-nism are shown at figure 2. The selection processoccurs while waiting on the left and right edges every180° of rotation of the dobby main shaft.Mechanism’s working principle: While the main shaft(1) stands on the left edge pneumatic pistons (7) aredrawn back with electronic signals coming from thepattern wheel (the pattern wheel isn’t shown in thefigure 2). The cam (9) which is started to rotate clock-wise and its effect on the pressuring arms (8) reducesand the pressuring arm (8) can’t push the locks (4).In this case, the locks (4) moves out of the center ofthe disc (2) with the impact of springs and the locksare attached to the dobby blade (10) on the left side.The connection between the disc (2) and the eccen-tric (3) are established. The main shaft (1), the disc
430industria textila 2018, vol. 69, nr. 6˘
Fig. 1. Drive mechanism: a – kinematic scheme of newly developeddrive mechanism; b – drive mechanism (right side); c – drive mechanism
(left side) [11]
b c
a

(2), the eccentric (3) and the dobby blade (10) rotate180° at the counterclockwise together. Arm (5) con-nected to eccentric (3) makes the output lever (6)rotate from the right edge to the left edge position.Thus, the frame connected to the output lever (6) isalso moved.Re-selection process is performed when main shaft(1) of the dobby has been rotated 180° and waitingon the right side. If the pneumatic piston (7) is pushed
forward, the piston (7) and cam (9)compresses the pressuring arms (8)and pushes locks (4). In this case,locks (4) can’t be attached to thedobby blade (10) on the right sideand connection can’t be madebetween disc (2) and cam (3) too.Thus, the eccentric (3) connected tothe arm (5) and the arm (5) con-nected to the output lever (6) can’tmove. As a result, the frame con-nected to the output lever (6) doesn’tmove. Proposed rotary dobby selec-tion process takes place twice every180° of rotation of the main shaft. Inthis case selection process hasbeen two times faster than the one-way stand-up rotary dobbies. Thetechnical drawing of the designednew rotary dobby and its mountedstatus are shown in figure 3.
RESULTS AND DISCUSSION
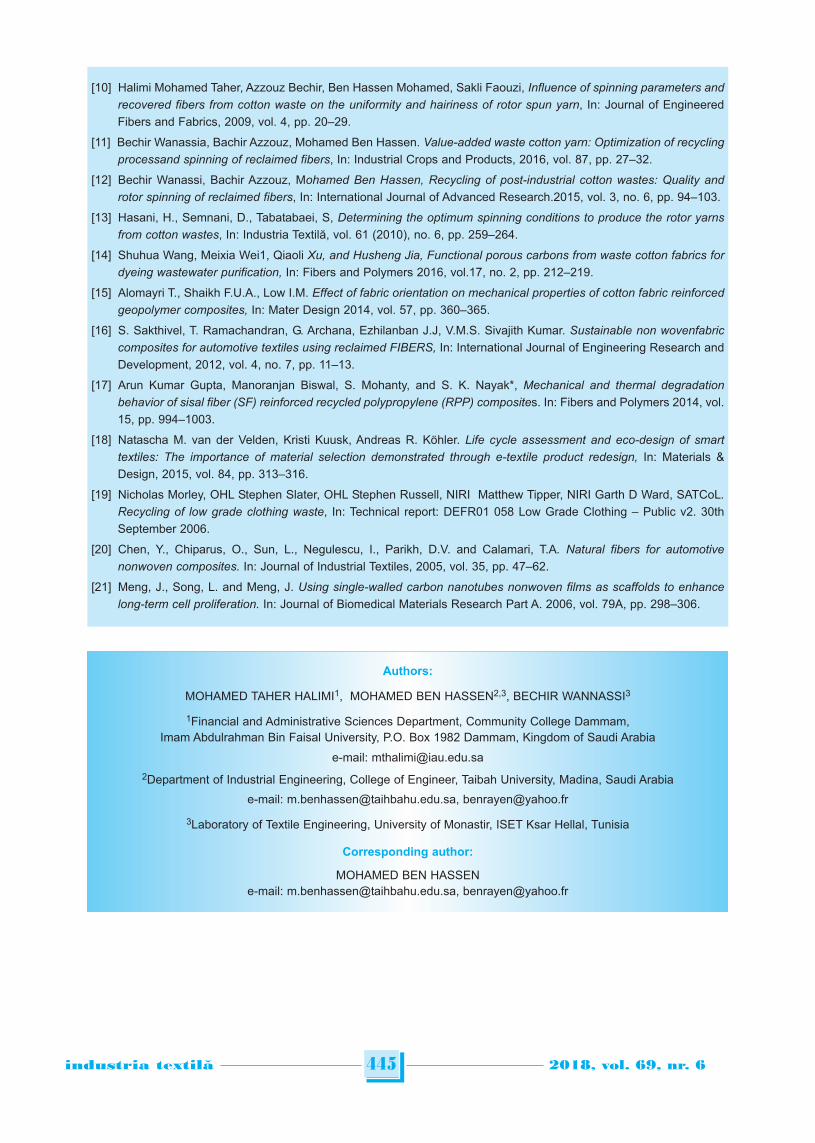
After the settings of the drive mech-anism have been completed, themovements of the mechanism havebeen calculated by the SAM 6.1®program. Coordinate, velocity andacceleration analyses have beenconducted. The analysis graphsobtained in the SAM 6.1® programof the proposed mechanism areshown in figure 4.When the figure 4 has been exam-ined it is seen that from the diagram(1), the waiting angles of the outputshaft in edge condition are 63° inthe right edge and 60° in the left
edge. These values, which are equal to 126 and 120°of rotation of the main shaft of the weaving machine,are approximately equal to the values required for thereading and application of the dobby program. Theangular displacement of the output shaft and theworking speed were investigated in order to be ableto perform the workability tests of the drive mecha-nism. Angle measuring devices with a measurementaccuracy equal to 1° has been installed to the input
431industria textila 2018, vol. 69, nr. 6˘
Fig. 3. Rotary dobby: a – technical drawing of new dobby; b – mounted status of new rotary dobby [11]
Fig. 2. Selection mechanism: a – output lever (6) on the right; b – outputlever (6) on the left; c – mounted status of selection mechanism [11]
c
a b
a b

and output shafts of the mechanism for determiningthe angular displacement of the output shaft. Theangle measuring devices are shown in figure 5.The angle of rotation of the output shaft was mea-sured at every 5° rotation angle of the input shaft forthe workability experiments of the mechanism inpractice. According to the obtained data, an angulardisplacement graph of the output shaft is plotted inthe Excel® program. This graph is given in figure 6.According to figure 6, it is observed that, the outputshaft draws a waiting motion curve at 360° rotationof the input shaft. When this movement curve isexamined, it is observed that the output shaft’s waitswhile the input shaft of the mechanism is movingbetween the range of 25°–80°and 205°–260°. Thismeans that the output shaft is waiting approximately55° in both right and left edge positions. When theboth graphs are analysed, the motion curve of thedobby drive mechanism and the motion curveobtained from the SAM 6.1® program are similar. It isalso seen that the difference between the theoreticalvalues of the waiting angle of the mechanism andthe experimental values is slightly less than 5°. It isthought that this deviation between theoretical and
practical values may be due to the spaces betweenthe machine elements. In this way, it has been pro-posed that the newly designed mechanism can beused instead of the cam mechanisms used in thedobby machines.
CONCLUSIONS
Special cams are used to ensure the standby rotationof the dobby main shaft in the drive mechanism ofclassic rotary dobby. In this study, the design andsynthesis of a new drive mechanism with eight mem-bers, equal and double standby 180° oscillating motionis obtained. The results of the research revealed thatboth theoretical and the experimental values of thewaiting angles are compatible with each other. Thus,it is proposed that the eight members’ synthesizedmechanism can be used instead of the special cammechanisms in the rotary dobbies.Additionally, pneumatic pistons working with elec-tronic signals coming from pattern wheel is used inrotary dobby’s selection mechanism has been devel-oped in the study. As a result, the rotary dobby’sselection mechanism developed in the study, differsfrom the classic rotary dobbies that work with elec-
432industria textila 2018, vol. 69, nr. 6˘
Fig. 4. The angular position (1), velocity (2) and acceleration (3) plots of the output shaft drawn in SAM 6.1® [11]
Fig. 5. Gunner’s quadrants: a – input shaft gunner’squadrant; b – output shaft gunner’s quadrant [11]
a b
Fig. 6. Angular displacement diagramof the mechanism output shaft [11]
tromagnets. Afterwards, the dobby has been runnedat different speeds in order to observe the states ofthe mechanisms. In the conducted experiments, ithas been observed that, the standby angles of thedrive mechanism have been consistent with the the-oretical angles. Also the locks in the selection mech-anism have been worked with the cams and thepneumatic pistons on time. It has also been foundthat, at all working speeds, the dobby mechanismshave been worked together durably. As a result, the
basic constructional dobby drive mechanism andselection mechanism have been produced by using astandard machine element. Thus, the cost of therotary dobby production has been reduced furtherand the maintenance has been made easier.
ACKNOWLEDGEMENT
We would like to express our appreciation to ScientificResearch Projects Coordination Unit of SuleymanDemirel University (Turkey), (Project no: 2126-D-10) for thefinancial support.
433industria textila 2018, vol. 69, nr. 6˘
Authors:
ÖZGÜN CAN1, GABİL ABDULLA2
1Suleyman Demirel University, Faculty of Fine Arts Department of Fashion and Design32300, Çunur, Isparta, Turkiye
2Suleyman Demirel University, Faculty of Engineering Department of Textile Engineering32300, Çunur, Isparta, Turkiye
e-mail: [email protected]; [email protected]
Corresponding author:
ÖZGÜN CAN
e-mail: [email protected]
BIBLIOGRAPHY
[1] Eren, R., Özkan, G., Karahan, M. Comparison of heald frame motion generated by rotary dobby and crank and camshedding motions, In: Fibre Textile Eastern Europa. 2005, vol. 13, no. 4, pp. 78–83.
[2] Başer, G. DokumaTekniğiveSanatı. In: Cilt 1 (Technology and Art of Weaving) vol.1, Punto Publishing, 2004,pp. 1–150, İzmir, Turkey.
[3] Adanur, S. Handbook of Weaving, In: PA Lancaster: Technomic Publishing Company, 2001, pp. 1–429, USA.
[4] Lord, P., R., Mohammed, M.H. Weaving: Conversion of Yarn to Fabric, In: Merrow Publishing Co. Ltd., 1982,pp. 1–408, Manchester, England.
[5] Abdulla, G., Palamutçu, S., Hasçelik B., Soydan, S.A. Research and modernization of shedding mechanisms inweaving machines, In: DPT Project report, report no: 2003K120950, 2006, pp. 1–138, Ankara, Turkey.
[6] Talavasek, O., Svyatıy, V. Besçelnoçnie tkatskiye stanki. In: Legpromizdat, 1985, pp. 1–320. Moskow, Russia.
[7] Alpay, R. Dokumamakineleri. (Weaving machines), In: Uludağ Üniversitesi Yayınları (Bursa: Publication of UludagUniversity), vol.1, 1985, pp. 1–291, Bursa, Turkey.
[8] Eren, R. Design of shedding mechanisms, In: Uludag University, Institute of Science and Technology, Master’sThesis, 1987, pp. 1–132, Bursa.
[9] Eren, R. Dobby shedding mechanisms, In: Tekstil Maraton, 2000, pp. 46–55.
[10] Eren, R., Özkan, G., Turhan, Y. Kinematics of rotary dobby and analysis of heald frame motion in weaving process,In: Textile Research Journal, 2008, vol. 78, no. 12, pp. 1070–1079.
[11] Can, Ö. Investigation of the working performance of dobby shedding mechanism and a new dobby design, In:Suleyman Demirel University, Institute of Science and Technology, Ph.D. Thesis, 2012, pp. 1–190, Isparta.
[12] Lee, S., Shin, J., Lee, S.,D., Kim, D. Analysis and design of a driving mechanism for the cam type dobby system,In: Journal of Korean Fiber Society, vol. 41, no. 1, pp. 56–58.
[13] Kapucu, S., Bayseç S., Yarbasan M. Reduction of frame residual vibration by the shedding mechanism cammovement profile regulation. In: MakineTek, 2007, pp. 78–82.
[14] Abdulla, G., Yürik D. Synthesis of lever mechanism which makes an oscillation movement below 180° for rotarydobby machine. In: The 12th International Conference on Machine Design and Production, September 5–8, 2006,Muğla, Turkey, pp. 81–90.
[15] Abdulla, G., Palamutçu, S. Constructional Synthesis of RA-14 Rotational Dobby Programming – Locking Unit,In: 1. International Istanbul Textile and Textile Machinery Congress, 01–02 June 2006, İstanbul, Turkey, pp. 85–89.
[16] Gokarneshan, N., Jegadeesan, N., Dhanapal, P. Recent innovations in loom shedding mechanisms. In: IndianJournal of Fibre&Textile Research, 2010, vol. 35, no. 1, pp. 85–94.
INTRODUCTION
Considered a specific niche, women’s clothing isstrongly influenced by trends in colors, pattern andfashion but also by the feelings about an adequatedurability, a satisfactory degree of comfort in wearingand finally, yet importantly, a great aesthetic appear-ance, no matter what the end use is [1–4]. When thegarment quality for women is defined from the weav-ing companies’ perspective, there is a focus on theoverall features that can be measured in a laboratory[5–6]. Nevertheless, a perspective acknowledged asthe market feedback for textile value chain, was theawareness on the women’s perspective on quality, asthe consumer’s viewpoint [1–6]. Therefore, predictingthe overall suitability for designed end use and theproducts success on the market can be a hard topic
for fabrics and clothing manufacturers and for retail-ers, thus, the improving of the fabric design strategyshould be the main mandatory task in textile compa-nies [3, 6–8]. Earlier papers investigated the relationship betweenthe lifestyle and assessment criteria for clothing pur-chase [1, 4, 7]. The need for manufacturers and retail-ers to be aware of consumers perceptions when pre-dicting the garment’ overall quality and on the gar-ment end-use was highlighted, and this approachshould be mandatory at an early stage of the devel-opment of the textile value chain. A permanent con-cern of weaving companies is that even though thecompliance with customers’ quality specifications isbeneficial, this does not guarantee achieving the con-sumer’s idea of the overall quality. One reason is the
434industria textila 2018, vol. 69, nr. 6˘
From fabric design to the dress manufacturing considering the fabric’ssuitability with the end use
RODICA HARPA EMILIA VISILEANU
REZUMAT – ABSTRACT
De la designul țesăturii la fabricarea rochiei, având în vedere adecvanța țesăturii la utilizarea finală
Acest studiu investighează două țesături tip lână selectate ca fiind adecvate confecționării rochiilor pentru sezonul rece.De la început, era de așteptat ca cele două țesături să contribuie cu caracteristici diferite la fabricarea rochiilor datoritămodelului și structurii diferite, fiind însă potrivite pentru utilizarea finală. Țesăturile au fost testate conform standardelorspecifice pentru ansamblul proprietăților legate de purtarea reală a rochiei, unele dintre caracteristici fiind legate și deîmbunătățirea aspectului general dorit de către orice clientă, indiferent de modalitatea de cumpărare a produsului(comerț cu amănuntul sau comerț electronic). Acest fapt a fost evidențiat prin intermediul unui sondaj despre preferințelefemeilor cu privire la cumpărarea articolelor de îmbrăcăminte. S-a efectuat simularea 3D a produsului, datorită facili -tăților de vizualizare în ansamblu a rochiei create pentru sezonul rece, prin combinarea elementelor specifice schiței,materialelor (prin materia primă, model, culori și caracteristici generale preconizate la purtare) și, nu în ultimul rând, acorpului utilizatorului. Această abordare a permis trecerea de la rezultatele experimentale obținute pentru profilul calitativestimat după testarea țesăturilor în laborator, la simularea rochiei, facilitând percepțiile virtuale ale utilizatorilor privindadecvanța țesăturilor pentru anumite creații de îmbrăcăminte. Prin urmare, în lanțul valoric textil, țesătoriile ar trebuisă-și îmbunătățescă procesul de proiectare prin includerea beneficiilor simulării 3D a îmbrăcămintei. Această strategies-ar îndrepta spre atingerea perspectivei consumatorului privind adecvanța țesăturilor pentru fabricarea articolelor deîmbrăcăminte ca produse de succes pe piață.
Cuvinte-cheie: design țesături, fabricare, confecții, destinație finală țesături, consumatori, comerț electronic
From fabric design to the dress manufacturing considering the fabric’s suitability with the end use
This study covers an investigation on two wool-type fabrics selected as suitable for cold season dresses. From thebeginning, it was expected that the two fabrics will bear out diverse features in dresses due to the different patterns andstructures, yet suitable for the end use. The fabrics were tested following the standards for the properties linked to theactual wearing of dresses, some of the features being related also to the general appearance expected by any clothingcustomer, regardless of the purchasing way (retailing or e-commerce). This opinion was pointed out by a survey ofwomen’s preferences about buying clothing items. Next, it was achieved the 3D clothing simulation to visualize the coldseason dress, by combining the sketch, the fabric (with raw material, pattern, colours, and overall features expected forwearing) and finally, the wearer’s body. This approach allowed stepping forward from the experimental results reachedfor fabrics’ overall quality after the laboratory testing to the dress simulation, to give customers virtual perceptions on thefabrics’ suitability for particular outfits. Therefore, within the textile value chain, the weaving companies should upgradethe design process by including the benefits of the 3D clothing simulation. This strategy would move towards thereaching of the consumer’s perspective on the fabrics suitability for manufacturing items of clothing as successfulproducts on the market.
Keywords: fabric design, manufacturing, clothing, fabric end use, consumers, e-commerce
435industria textila 2018, vol. 69, nr. 6˘
“feeling” the consumer has when buying an item ofclothing, starting with the unambiguous expectationsabout the product. It is worth mentioning that the con-sumer’s impression of a woven fabric and/or clothingitem is strongly influenced by the aesthetic propertiesperceived visually [1–2, 6–8]. The situation becomesmore complex when it comes to a successful productfor e-commerce and online shopping [1, 4, 9–10]. A positive effect of the globalized market is the “con-sumer market without frontiers”, hence, in the cloth-ing manufacturing sector, several changes came out[3, 8]. One of these is e-commerce, the most com-mon form of distance shopping, which added anoth-er dimension to the textile value chain. At the begin-ning, the e-commerce strategy aim was to bypassretailers and reach the consumers directly, but thistrend affected the clothing sector, where online salesincreased more and more in the last decade. All overthe world, online sellers seek to offer items of cloth-ing in larger assortments and, generally, at betterprices than traditional retailers (and not only duringthe sales season) so, the consumers are more likelyto buy apparels items online from sellers/brands,regardless of the country the products are made in.The main actors engaged in the e-commerce andonline clothing sales were e-retailers, textile special-ists, and non-specialists with a web store. In this con-text, a lot of clothing companies choose to launchtheir websites just like the other online fashion chains,targeting as many consumer niches or even just adedicated niche [9, 10]. In 2017, 64 % of internetusers (aged 16 to 74) in the EU-28, with a share of50.1% female users, reported the use of e-commerceand preference for online purchases of clothes andsports goods. Due to ongoing differences in compar-ison to the offline retail, the global e-fashion shopping
is expected to get an average annual growth rate of14.2% by 2019 [11]. In this context, the virtual prototyping appeared as animportant achievement within the manufacturingchain of garments or other textile products, to createmodels adapted to customers’ needs. In addition, theassistance of 3D CAD systems for the virtual proto-typing of garments by means of simulation helps elim-inate expensive physical prototypes, being providedas an effective design tool for the apparel industry[12–14]. Therefore, this raises a new challenge forthe weaving companies, given that there is a big dif-ference between providing static images of fabrics tocustomers and providing them with a simulation ofthe material embedded in the selected item of cloth-ing [11, 15].This paper aims to investigate the possibilities ofupgrading the fabric design strategy by including the3D clothing simulation, in pursuing the reaching ofthe consumer’s point of view on the wool-type fabricssuitability for manufacturing cold season dresses asa successful product on the market, also includinge-commerce.
MATERIALS AND METHODS
Fabrics design
Two wool-type fabrics were chosen for this study fortheir suitability in the end use, which is creatingdresses for the cold season (autumn to winter). Table 1summarizes the basics of the selected fabrics, withcodifications F1 and F2.
Fabrics testing
The two wool-type fabrics were tested in accordancewith standards [5, 6] and in a conditioned atmosphere,
Fabrics F1 F2
Pattern and Sample sight
Weave typeCrêpe weave (produced by adding anddeleting binding points in a plain weave)
Crêpe weave(produced by reversing)
Datasheet specifications
Fibre content Wool 45% / PES 55% Wool 45% / PES 55%
Width (without selvedge), (cm) 150 ± 2.5 150 ± 2.5
Weight, g/m2 240 ± 12 217 ± 11
Yarn linear density, tex (warp and weft) 15 × 2 (warp); 42 × 2 (weft) 16 × 2 (warp and weft)
Warp Weft Warp Weft
Yarn density / 10 cm 206± 10 180± 10 338 ± 10 288 ± 10
Breaking force Fr (N) min. 40 min. 30 min. 70 min. 60
Elongation, Er (%) min. 30 min. 25 min. 35 min. 35
Dimensional stability changes (%) max. 1.5 max. 1.2 max. 1.5 max. 1.2
Recovery angle, a30min (°) min. 145 min. 145
Table 1
436industria textila 2018, vol. 69, nr. 6˘
for the properties linked to the actual wearing ofdresses: physiological characteristics (weight/massper unit area, thickness, apparent density and watervapour permeability), aesthetic features (crease recov-ery, stiffness, flexibility, and dimensional stability afterwashing-ironing) and durability (abrasion resistance,slippage resistance of yarns at a seam in woven fab-rics).For the selected fabrics as coating materials in thecold season dresses, a consistent sampling was car-ried out and, when necessary (for durability and aes-thetics features) the sampling on the warp and theweft directions were considered. Two of the per-formed tests for the assessment of fabrics’ durability,need some punctual explanations about the set upand, due to the specific aspects, they are givenbelow: • Regarding the fabric’s abrasion resistance: a con-
trolled amount of abrasion with the same number ofcycles for both fabrics (2000 cc) was performedwith the Martindale abrasion tester. The abrasiontest assessed the fabric’s loss of mass and thechange in appearance, with inspection interval atevery 1000 cc; in table 4, the abrasion resistancewas assessed by the loss of fabric’s mass.
• Regarding the slippage resistance of yarns at aseam in woven fabrics performed with the MesdanTensolab 3: after the preparation of test specimens,the standardized testing conditions were assuredfor fabrics with mass ≤ 320g/m2, designed forapparel (applied load 60 N) and measuring theseam opening after returning to 5 N.
A survey of women’s preferences when buyingitems of clothing
Previously, an online consumer survey aimed at col-lecting information on women’s behaviour when buy-ing items of clothing was carried out betweenNovember 2016 and May 2017. The survey covereda total of 231 respondents spread over eleven EUMember States, namely: Belgium, Bulgaria, CzechRepublic, Germany, Italy, Latvia, Lithuania, NorthernIreland, Poland, Romania, Serbia, Slovenia, andTurkey. The survey was launched online (http://www.isondaje.ro/surveys), had eighteen questions and the resultsallowed finding some key trends that are also rele-vant for this paper.
Dress manufacturing and consumersexpectations
The usual procedure for manufacturing fabrics for aready-to-wear collection of clothing items includes inprinciple the following steps: market research on con-sumer niches and fashion trend analysis; productdesign including the 2D pattern sketches; acquisitionof raw materials suitable for the final destination (fab-ric as coating/lining in the clothing item); sample pro-duction (“zero series”); evaluation and approval ofthe sample product; manufacturing of the assortmentrange of fabrics and finally, the distribution/sale with-in the textile supply chain (for garment companies)/
on the consumer market (for store retailing ande-commerce).This textile value chain could be perfected if the fab-ric design would include the 3D garment virtual sim-ulation. Therefore, the characteristics of the materialsselected for the final product can be translated into avirtual product alternative, and a range of differentitems of clothing from the same fabric or a range ofone item of clothing from different fabrics can beachieved. Obviously, in this manner, one can also beton both, the fabric’s success on the market and sat-isfying the expectations/needs of a consumer nicheon a higher level.For this paper, a 30-day free trial CLO/3D FashionDesign software [15] was downloaded and the 3D vir-tual simulation of a cold season dress was achieved,by including each of the two wool-type fabrics.
RESULTS AND DISCUSSION
On the fabrics features for the designed end-use
In this part, it is important to keep in mind that the twowool-type fabrics chosen for the cold season dresseshave identical raw material (Wool 45%/ PES 55%)but are quite different in terms of pattern, yarn countsize and yarn density, so, it was expected to bear outdistinctive features for the dresses during wearing(table 1).Tables 2, 3 and 4 show the average values of thestructural and physiological features, of the aestheticfeatures and of the durability features, for each wool-type fabric indented for manufacturing the cold sea-son dresses.It should be noted that the values obtained for themass per square meter, for the crease recoveryangle, for the dimensional stability changes and forthe tensile properties are proper and meet the allow-able limits imposed by the specifications.
In table 2, fabric F1 is slightly heavier and thicker, hasa lower apparent density than fabric F2 and also hashigher water vapor permeability than F2. Therefore,fabric F1 is expected to give a better comfort whenwearing the dress.As shown in table 3 and in figure 1 also, in terms ofaesthetics features, fabric F2 performs a better creaserecovery and has lower stiffness values than fabricF1, also providing a better dimensional stability afterwashing-ironing. Fabric F1 has a greater stiffness value and almostsimilar values for flexibility compared to fabric F2. Asa result, it is expected that fabric F2 will provide
FABRICS STRUCTURAL AND PHYSICAL PROPERTIES
FabricCharacteristics
F1 F2
Mass per square meter, M (g/m2) 242 207
Thickness, gP (mm) 0.82 0.57
Apparent density, da (g/cm3) 0.295 0.363
Water vapor permeability, Pv (mg/24h) 880 860
Table 2
better aesthetic features when wearing the dress. Inaddition, figure 1 shows that in terms of durability,fabric F2 performs better tensile properties than fab-ric F1, assuring a better resistance to abrasion (table 4).
The results from the abrasion tests highlighted that achange in the mass after 1000 cc /2000 cc was onlyobserved for fabric F1; before reaching 2000 cc, theappearance of the fabrics changed very little by thefibers out of the flat surface but without producing thepilling. In addition, the slippage resistance of yarns at
the seam has smaller values for fabric F2, regardlessof the testing direction (figure 1). For fabric F1, a big-ger weft slippage that the warp slippage wasobtained, so was the seam opening value. Therefore,fabric F2 is expected to assure a better durabilitywhen wearing the dress.Altogether, on the wool-type fabrics features for thedesigned end-use, it can be expected that fabric F1will give a better comfort, and fabric F2 will providebetter durability and aesthetic features when wearingthe cold season dresses.It remains to be seen whether dresses made fromthese fabrics will respond to a larger extent towomen’s needs as consumers and whether they willbe successful for the textile supply chain.
On the survey of women’s preferences whenpurchasing clothing
Regarding the survey, only the results that allowednaming some key trends that are relevant for the pur-pose of this work will be discussed, to better under-stand the behaviour and choices of women as cloth-ing shoppers. The sample of consumers consisted ofwomen aged between 18 and 60 years (with an aver-age age of 36 years), 93.1 % of them having a back-ground in the textile field (by education in textile andprofessional activity).The respondents were asked to indicate the mostimportant factor among the nine factors considered,when deciding to purchase a clothing item and a hier-archy was obtained, as shown in figure 2. The gen-eral appearance (94.81%) and the quality of fabrics
437industria textila 2018, vol. 69, nr. 6˘
FABRICS AESTHETICS PROPERTIES
FabricCharacteristics
F1 F2
Sampling direction Warp Weft Warp Weft
Crease recovery Recovery angle, a0min (°); a30min (°) 140;148 152;163 132;169 141;168
Average coefficient l (%) 80 87.5 83.6 85.8
Stiffness R (mg cm)Axial 224.1 153.2 88.9 96.8
Total 185.3 92.8
Flexibility H (%)Axial 53.9 62 56.9 55
Total 57.9 55.95
Dimensional stability changes after washing-ironing, MD (%) 0.6 0.8 0.4 0.4
Table 3
Fig. 1. Selected wool fabrics: aesthetic and durability andfeatures depending on the threads’ sampling direction
(warp and weft)
FABRICS DURABILITY PROPERTIES
FabricCharacteristics
F1 F2
Sampling direction Warp Weft Warp Weft
Breaking force, Fr (N) 72.3 69.6 98 82.3
Elongation, Er (%) 33 40 39 37
Loss of fabric’smass, MMF(%)
1000cc;2000cc
0.8; 0.85 0; 0
Sampling direction Warp Weft Warp Weft
Seam opening, S0 (mm) 6 5 3 3
Table 4
Fig. 2. Respondents sharing on the most important factorof the decision to buy clothing
(91.34%) were clearly ranked first among the mostimportant factor for which respondents would be will-ing to buy a clothing item, followed by price (84% ofrespondents) and by fashion (44.16% of respon-dents) which had an intermediate position. A lowershare of respondents is willing to purchase a clothingitem considering the other factors like nationalbrand/producer (28.57%), foreign brand/producer(19.05%), unknown producer (10.39%) and recom-mended by others/seller (8.23%). The lowest shareof respondents (3.90%) is willing to buy a clothingitem considering the advertising strategies. Given the basic training of respondents and theanswers’ relevance (with a 6.4% survey error), theranking made by the 231 participating in the surveyas potential buyers of clothes can be consideredalmost conclusive: the clothing appearance and thefabrics’ quality could be the key factors for womenwilling to purchase a clothing item.As mentioned before, the use of e-commerce and theonline clothes purchases have become increasinglypopular for a large segment of shoppers and, in thiscontext, a lot of apparels companies choose to launchtheir websites just like the other online fashion chains. The question is whether or not the involvement ine-commerce should be a strategy also addressed bythe fabrics manufacturers, which are facing a marketglobalization, not only within the textile value chainbut as separate players too.
On the dress design and consumers’ niche
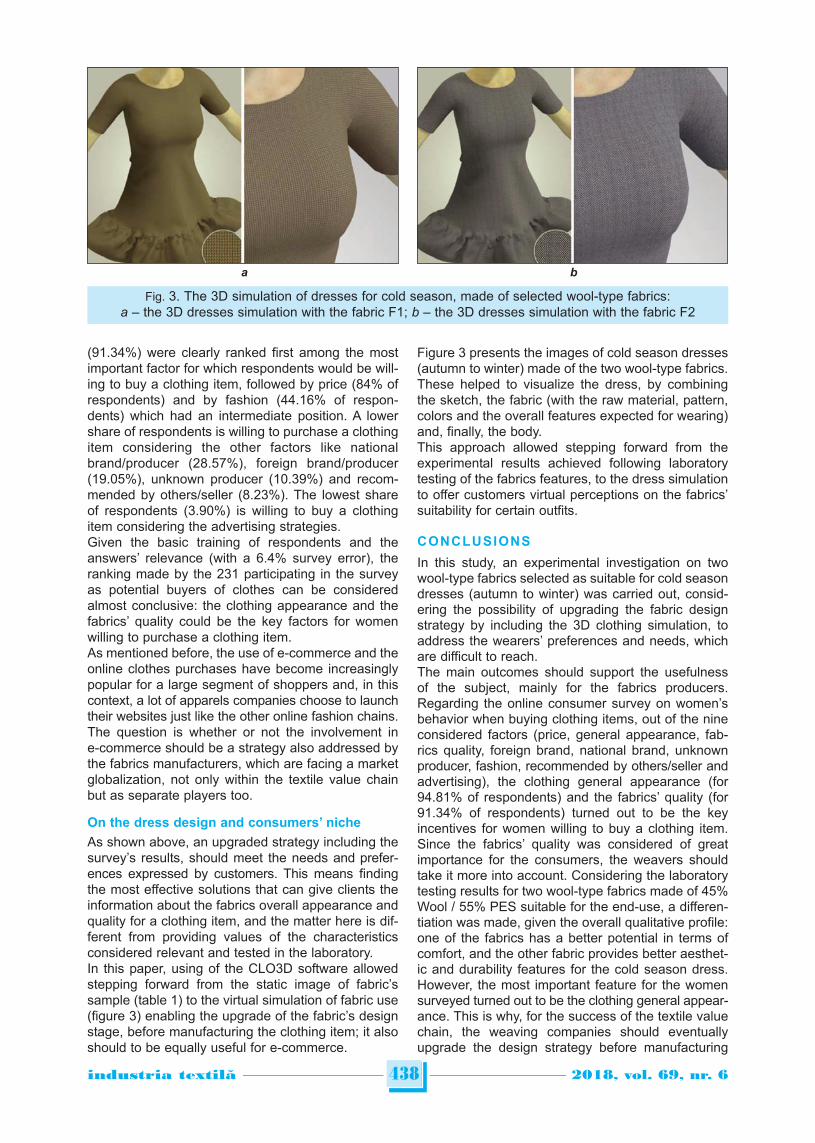
As shown above, an upgraded strategy including thesurvey’s results, should meet the needs and prefer-ences expressed by customers. This means findingthe most effective solutions that can give clients theinformation about the fabrics overall appearance andquality for a clothing item, and the matter here is dif-ferent from providing values of the characteristicsconsidered relevant and tested in the laboratory.In this paper, using of the CLO3D software allowedstepping forward from the static image of fabric’ssample (table 1) to the virtual simulation of fabric use(figure 3) enabling the upgrade of the fabric’s designstage, before manufacturing the clothing item; it alsoshould to be equally useful for e-commerce.
Figure 3 presents the images of cold season dresses(autumn to winter) made of the two wool-type fabrics.These helped to visualize the dress, by combiningthe sketch, the fabric (with the raw material, pattern,colors and the overall features expected for wearing)and, finally, the body.This approach allowed stepping forward from theexperimental results achieved following laboratorytesting of the fabrics features, to the dress simulationto offer customers virtual perceptions on the fabrics’suitability for certain outfits.
CONCLUSIONS
In this study, an experimental investigation on twowool-type fabrics selected as suitable for cold seasondresses (autumn to winter) was carried out, consid-ering the possibility of upgrading the fabric designstrategy by including the 3D clothing simulation, toaddress the wearers’ preferences and needs, whichare difficult to reach. The main outcomes should support the usefulnessof the subject, mainly for the fabrics producers.Regarding the online consumer survey on women’sbehavior when buying clothing items, out of the nineconsidered factors (price, general appearance, fab-rics quality, foreign brand, national brand, unknownproducer, fashion, recommended by others/seller andadvertising), the clothing general appearance (for94.81% of respondents) and the fabrics’ quality (for91.34% of respondents) turned out to be the keyincentives for women willing to buy a clothing item.Since the fabrics’ quality was considered of greatimportance for the consumers, the weavers shouldtake it more into account. Considering the laboratorytesting results for two wool-type fabrics made of 45%Wool / 55% PES suitable for the end-use, a differen-tiation was made, given the overall qualitative profile:one of the fabrics has a better potential in terms ofcomfort, and the other fabric provides better aesthet-ic and durability features for the cold season dress.However, the most important feature for the womensurveyed turned out to be the clothing general appear-ance. This is why, for the success of the textile valuechain, the weaving companies should eventuallyupgrade the design strategy before manufacturing
438industria textila 2018, vol. 69, nr. 6˘
Fig. 3. The 3D simulation of dresses for cold season, made of selected wool-type fabrics:a – the 3D dresses simulation with the fabric F1; b – the 3D dresses simulation with the fabric F2
a b

fabrics, by including the benefits of the 3D garmentsimulation, if they want to keep in mind the con-sumers' preferences on the fabrics' suitability for theend use. Actually, this method allowed the visualiza-tion of the dress, advancing from the static picture ofa fabric’s sample by combining the sketch, the fabric,and the body, in order to assess the general appear-ance. This approach can be useful and have greatbenefits in terms of efficiency all the more so today,when commerce is heavily made online. Hence, alongwith garment producers, the fabrics manufacturersshould also consider the 3D clothing simulation whenfocusing on the consumer nice and want to increasethe wearer’s satisfaction and by default, the sales.This work is an attempt to advance from laboratorytesting of the fabrics’ quality profile to reaching theclients' virtual perceptions on the fabrics’ suitabilityfor the end use, enabling them to obtain an overallappearance of two cold season dresses made from
the above designed fabrics. The feedback on the fab-rics suitability will consist of the preferential buying ofone of the two dresses.It is important, however, to find out if this upgradedstrategy is worth the efforts, considering the overalladditional costs for the fabrics producers. As a futurework, the authors are considering making studies onthe subjective evaluation by visualization and han-dling of both, fabrics and dresses made of the select-ed fabrics, by a panel of assessors.
ACKNOWLEDGEMENT
The authors would like to acknowledge the support of theEC Programme Erasmus+, project TexMatrix (Contract no.2016-1-RO01-KA202-024498), as well as the financial sup-port of Romanian Ministry of Research and Innovation,through Program 1-Development of the National R&D System,Subprogram 1.2-Institutional Performance-ExcellenceFunding Projects in RDI (Contract no. 6PFE /16.10.2018).
439industria textila 2018, vol. 69, nr. 6˘
BIBLIOGRAPHY
[1] Murali, A.L., Littrell, M.A. Consumers’ perceptions of apparel quality over time: an exploratory study, In: CTRJ, 1995,vol. 13, no. 3, pp. 149–158.
[2] Tester, D., McGregor, B.A., Staynes, L. Ultrafine wools: comfort and handle properties for next-to-skin knitwear andmanufacturing performance, In: Text. Res. J., 2014, vol. 85, no. 11, pp. 1181–1189.
[3] Harpa, R., Selecting wool-type fabrics for sensorial comfort in women office clothing for the cold season, using themulti-criteria decision analysis, In: IOP Conf. Ser.: Mater. Sci. Eng. 254 142009, 2017.
[4] Castelo, J.S.F., Cabral, J.E.O. Consumers in a social network: the perception of clothing quality per gender, In: Rev.Bras. Gest. Neg. – Review of Business Management, 2017, vol. 20, no. 1, p. 22–36.
[5] Saville, B.P. Physical testing of textiles, In: Woodhead Publishing Limited in association with The Textile Institute,Cambridge England, 1999.
[6] Majumdar, A. et all, Process Control in Textile Manufacturing, In: Woodhead Publishing Series in Textiles, 2013.[7] Kanai H., Morishima M. et all, Identification of principal factors of fabric aesthetics by the evaluation from experts
on textiles and from untrained consumers, In: Text. Res. J., 2011, vol. 81, no.12, pp. 1216–1225.[8] Cassill, N., Drake, M.F. Apparel selection criteria related to female consumers’ lifestyle, In: CTRJ, 1987, vol. 6, no. 1,
pp. 20–28.[9] Scheffer, M.R. Synthesis Report for the European Textile and Clothing Sector: in-depth assessment of the situation
of the T&C Sector in the EU and Prospects, 2012, European Commission.[10] *** EUROSTAT, E-commerce statistics for individuals, http://ec.europa.eu/Eurostat, 2017.[11] *** STATISTA, E-commerce: fashion worldwide, https://cdn.statcdn.com, 2018.[12] Mandi, V., Ćosić, P. Integrated product and process development in collaborative virtual engineering environment,
In: Technical Gazette, 2011, vol. 18, no. 3, pp. 369–378.[13] Zhang, D., Wang, J. and Yang, Y. Design 3D garments for scanned human bodies, In: J Mech Sci Technol, 2014,
vol. 28, no. 7, pp. 2479–2487.[14] Jevšnik, S., Stjepanović, Z., Rudolf, A. 3D Virtual prototyping of garments: approaches, developments and
challenges, In: JFBI, 2017, vol. 10, no. 1, pp. 51–63.[15] *** CLO/3D Fashion Design Software – CLO Virtual Fashion, https://www.clo3d.com/, 2018.
Authors:
RODICA HARPA1, EMILIA VISILEANU2
1“Gheorghe Asachi” Technical University of Iasi, Faculty of Textiles, Leather and Industrial Management,Textile Engineering and Design Department, 29 D. Mangeron Blvd., 700050, Iasi, Romania
e-mail: [email protected] Research-Development National Institute for Textile and Leather, Textile Division,
16 Lucretiu Patrascanu Street, 030508, Bucharest, Romaniae-mail: [email protected]
Corresponding author:
RODICA HARPAe-mail: [email protected]

INTRODUCTION
Several challenges related to environmental protec-tion and economic benefitsmake recycling a pre-ferred option for solid waste management.Therefore,recycling and reuse of industrial wastes became ofgreat interest either by developed and developingcountries [1–3]. The textile industry is characterized by many dispos-able products that create multiple environmentalissues over its entire life cycle. Textile recycling is themethod of reusing or reprocessing used clothing,fibrous material and clothing scraps from the manu-facturing process. Clothing textile waste can be recy-cled and re-fiberized [4–5]. Youjiang Young presentedan overview on textile waste recycling, focusing onthe case of carpet [6]. This study contained a gener-al assessment of fibrous waste, sources and materi-al properties. A. Bartl et al. presented the state-of-theart in recycling fibers and the available tech nologiesfor textiles, carpets, composites and end-of life vehi-cles [7]. They demonstrate that fibers recycled fromwaste can be converted to a valuable raw material ifprocessed properly. The quantitative and qualitativeassessment of textile fiber waste is often linked withwaste management and valorization. HALIMI et al.evaluated the waste percentage and the good fiberfraction for two cleaning machines and a card beforethe weaving step [8–10]. After this, the quality ofrecovered fibers was reviewed and confronted to
other virgin material. These fibers can be blended ina good proportion without noticeable changes in finalproduct quality. In addition, many studies have demon-strated that the reclaimed fibers can be reused andinserted with different proportion in different productswith higher added value. Recently, nonwoven andfiber reinforced composites got considerable atten-tion in numerous applications that can support theuse of these recycled fiber. Bechir Wannassi et al. worked to give an added valueto cotton wastes by producing a new low cost yarnbased on recycled yarn fibers [11]. Hence he investi-gated the effect of the raw material and the recyclingprocess on the final quality of reclaimed fibers.Finally, DoE method was used to find the optimumconditions for recycling process [12–13]. Related stud-ies are achieved in order to develop new or alterna-tive materials that aim to attain fuel efficiency, costeffectiveness, increased safety, and always with atarget on capability to recycle or biodegrade [14]. In addition to a set of other investigated uses ofreclaimed fibers on composites materials [15–17],Natascha M. van et al., after a life cycle assessmentand eco-design of smart textiles, have demonstratedthe importance of material selection through e-textileproduct redesign [18]. Results suggest several prior-ity areas for environmental improvement of fibers[19].
Optimization and valorization of recycled fiber in non-woven fabric
MOHAMED TAHER HALIMI BECHIR WANNASSI
MOHAMED BEN HASSEN
REZUMAT – ABSTRACT
Optimizarea și valorificarea fibrelor reciclate din nețesute
Gama și volumul produselor textile utilizate zilnic cresc exponențial în întreaga lume, atât în țările dezvoltate, cât și încele în curs de dezvoltare. Prin urmare, problemele legate de gestionarea și valorificarea deșeurilor devin o provocarecare necesită studii economice și tehnice aprofundate. În acest context, ne-am propus în această lucrare să prezentămvaloarea adăugată a două tipuri de deșeuri textile ale firelor și confecțiilor textile colectate de la producătorii de denimalbastru. O evaluare a calității fibrelor regenerate prezintă proprietăți fizice și mecanice satisfăcătoare care le permit săfie utilizate pentru producerea materialelor textile nețesute. S-a investigat un set de proprietăți, iar rezultatele au arătatcă structurile nețesute pot fi considerate o alternativă bună pentru exploatarea firelor și fibrelor de țesături reciclate.
Cuvinte-cheie: reciclare, fibră de bumbac, nețesut, industria textilă
Optimization and valorization of recycled fiber in non-woven fabric
The range and volume of textile products used every day is growing exponentiallythroughout the world, in bothdeveloped and developing countries. Therefore, the issues of waste Management and valorization become a challengethat requires depth economic and technical studies. In this setting, we aimed in this paper to give an added value of twokinds of textile wastes: yarns and textiles garments wastes collected from Blue denim manufacturer. A qualityassessment of the reclaimed fibers shows satisfying physical and mechanical properties that allow them to be used toproduce nonwoven textiles materials. A set of properties are investigated and results revealed that nonwoven structurescan be considered as a good alternative for yarn and woven recycled fibers exploitation.
Keywords: recycling, cotton fiber, nonwoven, textile industry
440industria textila 2018, vol. 69, nr. 6˘
In this study, we are interested inexploiting at thesame time two kinds of wastes: yarns and fabricwastes collected from Blue denim manufacturers.The quality of recycled fibers is assessed then usedto make a dry nonwoven. As a second part, themechanical characteristics of these nonwovens wereoptimized to orientate their exploitation.
MATERIALS AND METHODS
Fibre recycling and characteristics
Waste characteristics
Yarn wastes used in this work are collected at theend of an Open-end process.Fabricwastes were col-lected from the end of the weaving process of Societyof Textile Industries (SITEX). All tests in this study areconducted in the laboratory of SITEX Company whilerespecting ISO 139 standard. This standard describesthe conditions of ambient that are 20 ± 2°C and 65%± 4% air relative humidity. 24 h of conditioning of thematerialis carried out before each test.
Wastes recycling process
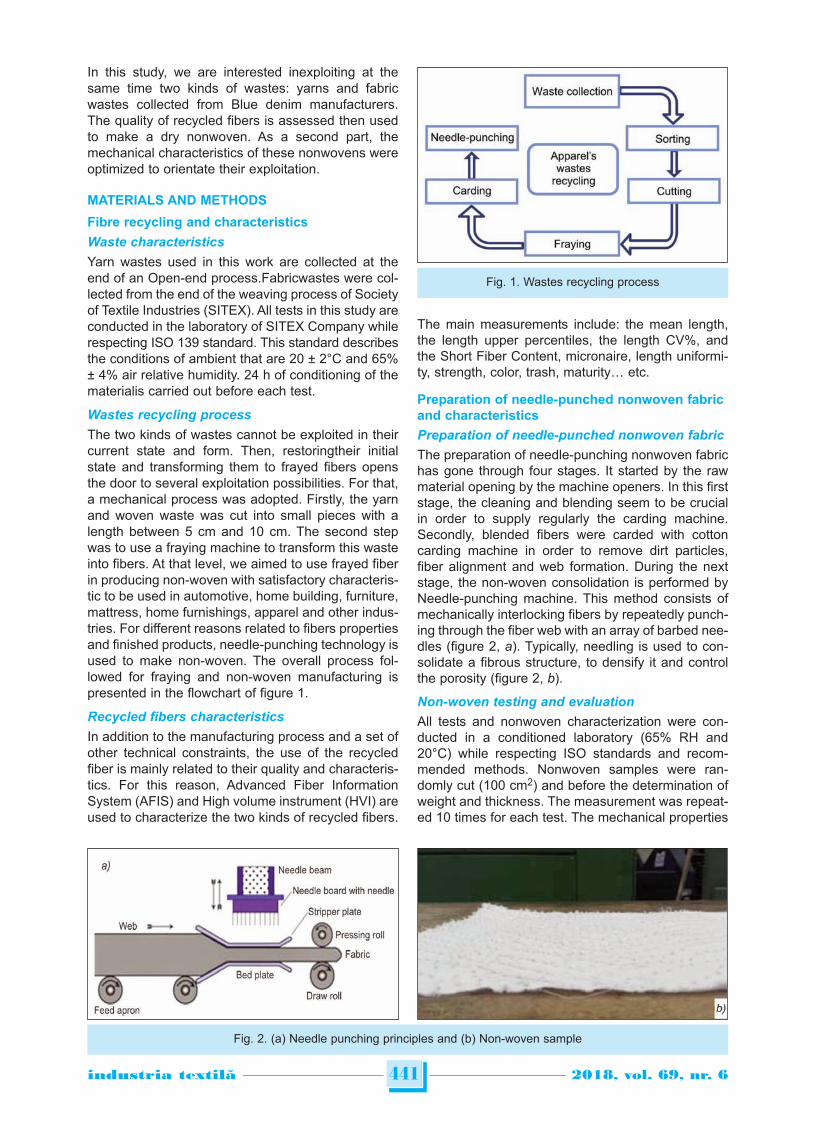
The two kinds of wastes cannot be exploited in theircurrent state and form. Then, restoringtheir initialstate and transforming them to frayed fibers opensthe door to several exploitation possibilities. For that,a mechanical process was adopted. Firstly, the yarnand woven waste was cut into small pieces with alength between 5 cm and 10 cm. The second stepwas to use a fraying machine to transform this wasteinto fibers. At that level, we aimed to use frayed fiberin producing non-woven with satisfactory characteris-tic to be used in automotive, home building, furniture,mattress, home furnishings, apparel and other indus-tries. For different reasons related to fibers propertiesand finished products, needle-punching technology isused to make non-woven. The overall process fol-lowed for fraying and non-woven manufacturing ispresented in the flowchart of figure 1.
Recycled fibers characteristics
In addition to the manufacturing process and a set ofother technical constraints, the use of the recycledfiber is mainly related to their quality and characteris-tics. For this reason, Advanced Fiber InformationSystem (AFIS) and High volume instrument (HVI) areused to characterize the two kinds of recycled fibers.
The main measurements include: the mean length,the length upper percentiles, the length CV%, andthe Short Fiber Content, micronaire, length uniformi-ty, strength, color, trash, maturity… etc.
Preparation of needle-punched nonwoven fabricand characteristics
Preparation of needle-punched nonwoven fabric
The preparation of needle-punching nonwoven fabrichas gone through four stages. It started by the rawmaterial opening by the machine openers. In this firststage, the cleaning and blending seem to be crucialin order to supply regularly the carding machine.Secondly, blended fibers were carded with cottoncarding machine in order to remove dirt particles,fiber alignment and web formation. During the nextstage, the non-woven consolidation is performed byNeedle-punching machine. This method consists ofmechanically interlocking fibers by repeatedly punch-ing through the fiber web with an array of barbed nee-dles (figure 2, a). Typically, needling is used to con-solidate a fibrous structure, to densify it and controlthe porosity (figure 2, b).
Non-woven testing and evaluation
All tests and nonwoven characterization were con-ducted in a conditioned laboratory (65% RH and20°C) while respecting ISO standards and recom-mended methods. Nonwoven samples were ran-domly cut (100 cm2) and before the determination ofweight and thickness. The measurement was repeat-ed 10 times for each test. The mechanical properties
441industria textila 2018, vol. 69, nr. 6˘
Fig. 1. Wastes recycling process
Fig. 2. (a) Needle punching principles and (b) Non-woven sample

including breaking strength and elongation weredetermined using ISO 13934-1(1999) standard.
DESIGN OF EXPERIMENTS
The overall properties of non-woven produced fromfrayed fibers are mainly related toraw material prop-erties and the needle punching process. A prelimi-nary and literature study consultation show that thefactors: fiber type (FT, YRF: fibers from frayed yarn;WRF: fibers from frayed fabric) needle punching pas-sage (NPN) and layer number (LN), were influentialon the quality of nonwoven. Table 1 show the levelsof each factor considered in DoE. Therefore, L09orthogonal array (table 2) was selected for the exper-imentation and each experiment was performedthree times and the average in each experiment wasconsidered as the response variable.
RESULTS AND DISCUSSION
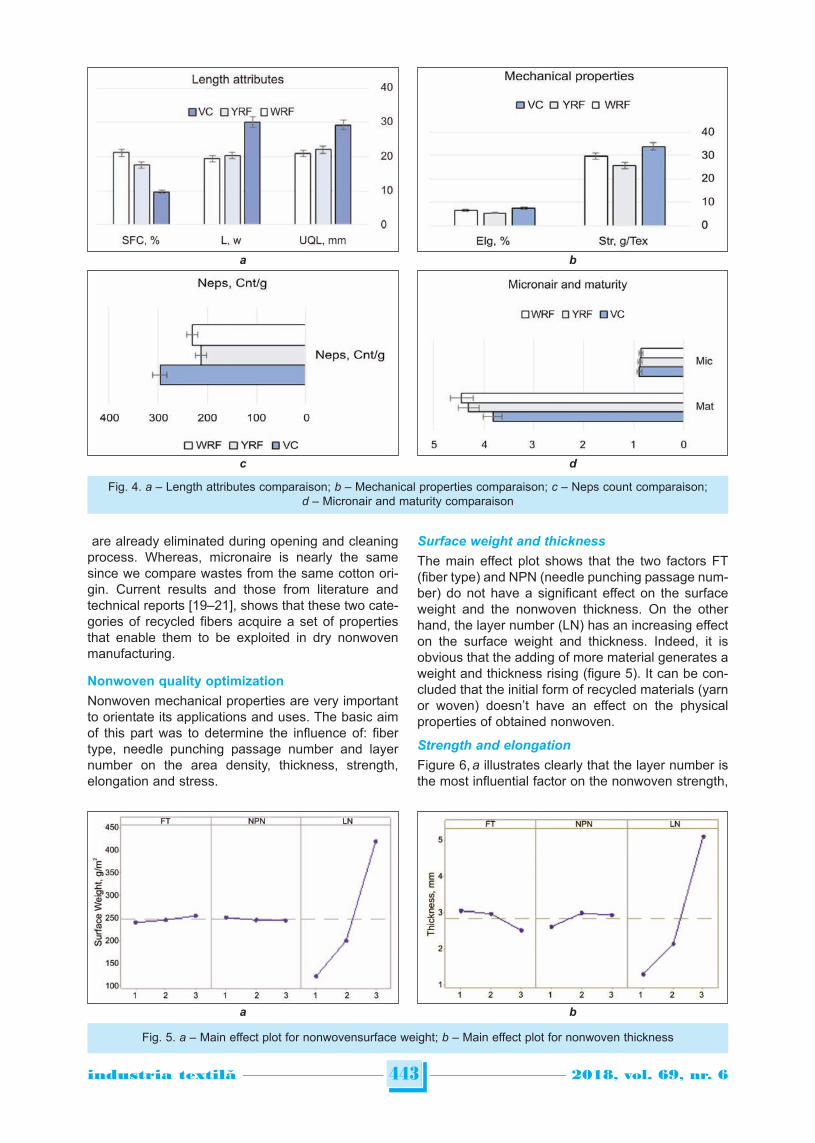
Comparison of virgin and recycled fibers
Recycled fiber characterization seems to be crucial tosteer this material valorization. The testing of fiberswas always of importance to the manufacturer whodesires its exploitation. For this reason, the quality ofrecycled fiber will be compared to that of virgin cottonfiber.
Morphological comparison
The SEM micrographs of virgin and recycled fiber areillustrated in figure 3. It can be seen that the virginfiber present regular cut section (figure 3, a). On theother hand, and do to repeated constraints duringtreatments from spinning to finishing, recycled fiberpresent irregular cut section (figure 3, b).
Mechanical and physical comparison
Figure 4, a presents three attributes which describethe length distribution in the cotton samples: SFC(short fiber content), L(W) (Mean length) and UQL(Upper Quarter Mean Length). It seems clear that thevirgin cotton has the lowest short fiber content andlonger fiber distribution. On the other side, wovenrecycled fibers contain the highest short fiber contentand lower mean length and UQL. These results canbe explained by the yarn interweaving in wovenwastes which need higher mechanical constraints tobe frayed. Despite these mechanical constraints inwaste fraying, the mechanical properties of wovenrecycled fiber, elongation and strength, are slightlybetter than recycled yarn fiber figure 4, b. In addition,the warp threads which run vertically through thelength of the fabric, present high mechanical proper-ties than weft threads run horizontally across thewidth of the cloth. It is very important to mention inthis stage that this comparison does not take intoaccount the effect of cotton origin since yarns andwoven are made from the same virgin cotton blend.Contrary to the length attributes and mechanicalproperties; which are relatively affected by recyclingprocess, a set of advantages come out with physicalcharacteristics such as: neps count, micronaire andmaturity figure 4, c and d. In addition, woven and yarnrecycled fibers present less neps, higher maturity andequal micronaire compared to virgin cotton (VC).These results can be explained by the fact that foryarn and woven wastes, neps and immature fibers
442industria textila 2018, vol. 69, nr. 6˘
Level
Fiber type(FT%)
Needle punchingpassage number
Layernumber
YRF WRF NPN LN
1 75 25 1 2
2 50 50 2 4
3 25 75 3 8
Table 1
SampleFT
NPNLN
YRF WRF n
1 25 75 2 1
2 25 75 3 2
3 25 75 4 3
4 50 50 2 2
5 50 50 3 3
6 50 50 4 1
7 75 25 2 3
8 75 25 3 1
9 75 25 4 2
Table 2
YRF – recycled yarn fibers.WRF – recycled woven fibers.
Fig. 3. SEM microographs of fracture surfaceof: a – virgin cotton fiber, b – recycled fiber
b
a
are already eliminated during opening and cleaningprocess. Whereas, micronaire is nearly the samesince we compare wastes from the same cotton ori-gin. Current results and those from literature andtechnical reports [19–21], shows that these two cate-gories of recycled fibers acquire a set of propertiesthat enable them to be exploited in dry nonwovenmanufacturing.
Nonwoven quality optimization
Nonwoven mechanical properties are very importantto orientate its applications and uses. The basic aimof this part was to determine the influence of: fibertype, needle punching passage number and layernumber on the area density, thickness, strength,elongation and stress.
Surface weight and thickness
The main effect plot shows that the two factors FT(fiber type) and NPN (needle punching passage num-ber) do not have a significant effect on the surfaceweight and the nonwoven thickness. On the otherhand, the layer number (LN) has an increasing effecton the surface weight and thickness. Indeed, it isobvious that the adding of more material generates aweight and thickness rising (figure 5). It can be con-cluded that the initial form of recycled materials (yarnor woven) doesn’t have an effect on the physicalproperties of obtained nonwoven.
Strength and elongation
Figure 6, a illustrates clearly that the layer number isthe most influential factor on the nonwoven strength,
443industria textila 2018, vol. 69, nr. 6˘
Fig. 4. a – Length attributes comparaison; b – Mechanical properties comparaison; c – Neps count comparaison; d – Micronair and maturity comparaison
a b
c d
Fig. 5. a – Main effect plot for nonwovensurface weight; b – Main effect plot for nonwoven thickness
a b
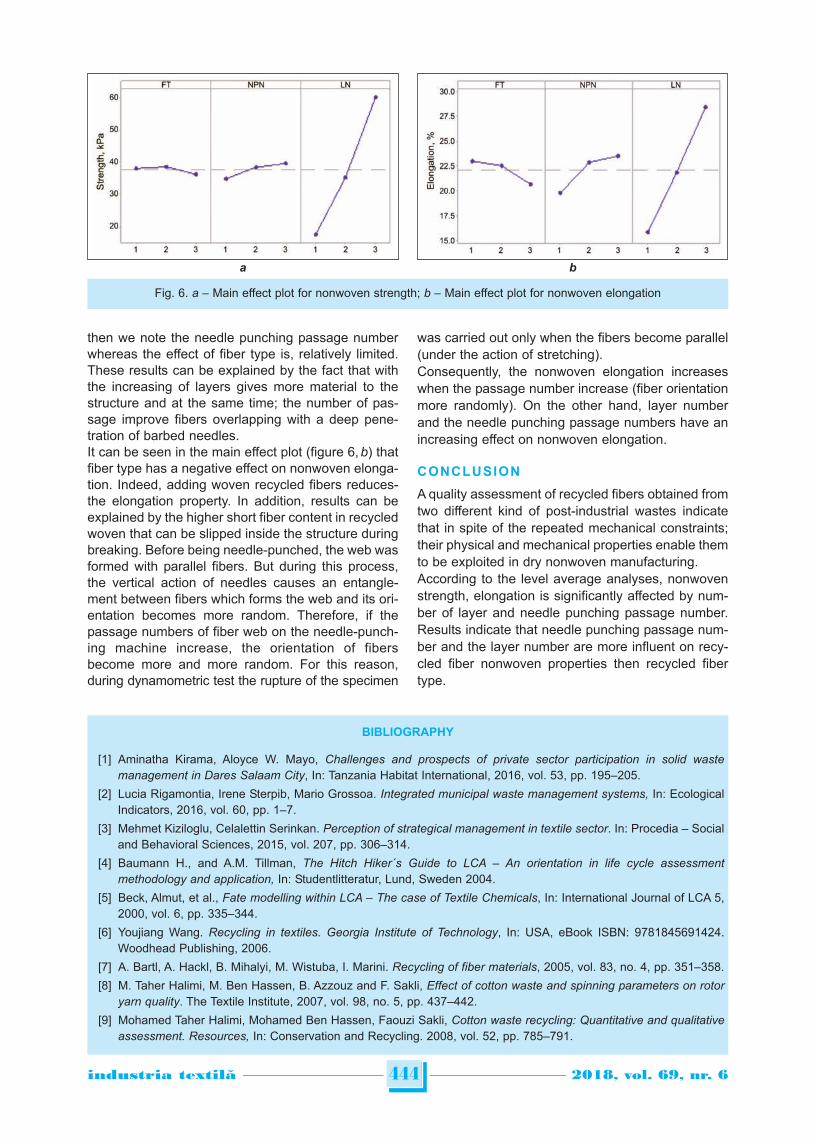
then we note the needle punching passage numberwhereas the effect of fiber type is, relatively limited.These results can be explained by the fact that withthe increasing of layers gives more material to thestructure and at the same time; the number of pas-sage improve fibers overlapping with a deep pene-tration of barbed needles. It can be seen in the main effect plot (figure 6, b) thatfiber type has a negative effect on nonwoven elonga-tion. Indeed, adding woven recycled fibers reduces-the elongation property. In addition, results can beexplained by the higher short fiber content in recycledwoven that can be slipped inside the structure duringbreaking. Before being needle-punched, the web wasformed with parallel fibers. But during this process,the vertical action of needles causes an entangle-ment between fibers which forms the web and its ori-entation becomes more random. Therefore, if thepassage numbers of fiber web on the needle-punch-ing machine increase, the orientation of fibersbecome more and more random. For this reason,during dynamometric test the rupture of the specimen
was carried out only when the fibers become parallel(under the action of stretching). Consequently, the nonwoven elongation increaseswhen the passage number increase (fiber orientationmore randomly). On the other hand, layer numberand the needle punching passage numbers have anincreasing effect on nonwoven elongation.
CONCLUSION
A quality assessment of recycled fibers obtained fromtwo different kind of post-industrial wastes indicatethat in spite of the repeated mechanical constraints;their physical and mechanical properties enable themto be exploited in dry nonwoven manufacturing.According to the level average analyses, nonwovenstrength, elongation is significantly affected by num-ber of layer and needle punching passage number.Results indicate that needle punching passage num-ber and the layer number are more influent on recy-cled fiber nonwoven properties then recycled fibertype.
444industria textila 2018, vol. 69, nr. 6˘
Fig. 6. a – Main effect plot for nonwoven strength; b – Main effect plot for nonwoven elongation
a b
BIBLIOGRAPHY
[1] Aminatha Kirama, Aloyce W. Mayo, Challenges and prospects of private sector participation in solid wastemanagement in Dares Salaam City, In: Tanzania Habitat International, 2016, vol. 53, pp. 195–205.
[2] Lucia Rigamontia, Irene Sterpib, Mario Grossoa. Integrated municipal waste management systems, In: EcologicalIndicators, 2016, vol. 60, pp. 1–7.
[3] Mehmet Kiziloglu, Celalettin Serinkan. Perception of strategical management in textile sector. In: Procedia – Socialand Behavioral Sciences, 2015, vol. 207, pp. 306–314.
[4] Baumann H., and A.M. Tillman, The Hitch Hiker´s Guide to LCA – An orientation in life cycle assessmentmethodology and application, In: Studentlitteratur, Lund, Sweden 2004.
[5] Beck, Almut, et al., Fate modelling within LCA – The case of Textile Chemicals, In: International Journal of LCA 5,2000, vol. 6, pp. 335–344.
[6] Youjiang Wang. Recycling in textiles. Georgia Institute of Technology, In: USA, eBook ISBN: 9781845691424.Woodhead Publishing, 2006.
[7] A. Bartl, A. Hackl, B. Mihalyi, M. Wistuba, I. Marini. Recycling of fiber materials, 2005, vol. 83, no. 4, pp. 351–358.
[8] M. Taher Halimi, M. Ben Hassen, B. Azzouz and F. Sakli, Effect of cotton waste and spinning parameters on rotoryarn quality. The Textile Institute, 2007, vol. 98, no. 5, pp. 437–442.
[9] Mohamed Taher Halimi, Mohamed Ben Hassen, Faouzi Sakli, Cotton waste recycling: Quantitative and qualitativeassessment. Resources, In: Conservation and Recycling. 2008, vol. 52, pp. 785–791.
445industria textila 2018, vol. 69, nr. 6˘
[10] Halimi Mohamed Taher, Azzouz Bechir, Ben Hassen Mohamed, Sakli Faouzi, Influence of spinning parameters andrecovered fibers from cotton waste on the uniformity and hairiness of rotor spun yarn, In: Journal of Engineered
Fibers and Fabrics, 2009, vol. 4, pp. 20–29.
[11] Bechir Wanassia, Bachir Azzouz, Mohamed Ben Hassen. Value-added waste cotton yarn: Optimization of recyclingprocessand spinning of reclaimed fibers, In: Industrial Crops and Products, 2016, vol. 87, pp. 27–32.
[12] Bechir Wanassi, Bachir Azzouz, Mohamed Ben Hassen, Recycling of post-industrial cotton wastes: Quality androtor spinning of reclaimed fibers, In: International Journal of Advanced Research.2015, vol. 3, no. 6, pp. 94–103.
[13] Hasani, H., Semnani, D., Tabatabaei, S, Determining the optimum spinning conditions to produce the rotor yarnsfrom cotton wastes, In: Industria Textilă, vol. 61 (2010), no. 6, pp. 259–264.
[14] Shuhua Wang, Meixia Wei1, Qiaoli Xu, and Husheng Jia, Functional porous carbons from waste cotton fabrics fordyeing wastewater purification, In: Fibers and Polymers 2016, vol.17, no. 2, pp. 212–219.
[15] Alomayri T., Shaikh F.U.A., Low I.M. Effect of fabric orientation on mechanical properties of cotton fabric reinforcedgeopolymer composites, In: Mater Design 2014, vol. 57, pp. 360–365.
[16] S. Sakthivel, T. Ramachandran, G. Archana, Ezhilanban J.J, V.M.S. Sivajith Kumar. Sustainable non wovenfabriccomposites for automotive textiles using reclaimed FIBERS, In: International Journal of Engineering Research and
Development, 2012, vol. 4, no. 7, pp. 11–13.
[17] Arun Kumar Gupta, Manoranjan Biswal, S. Mohanty, and S. K. Nayak*, Mechanical and thermal degradationbehavior of sisal fiber (SF) reinforced recycled polypropylene (RPP) composites. In: Fibers and Polymers 2014, vol.
15, pp. 994–1003.
[18] Natascha M. van der Velden, Kristi Kuusk, Andreas R. Köhler. Life cycle assessment and eco-design of smarttextiles: The importance of material selection demonstrated through e-textile product redesign, In: Materials &
Design, 2015, vol. 84, pp. 313–316.
[19] Nicholas Morley, OHL Stephen Slater, OHL Stephen Russell, NIRI Matthew Tipper, NIRI Garth D Ward, SATCoL.Recycling of low grade clothing waste, In: Technical report: DEFR01 058 Low Grade Clothing – Public v2. 30th
September 2006.
[20] Chen, Y., Chiparus, O., Sun, L., Negulescu, I., Parikh, D.V. and Calamari, T.A. Natural fibers for automotivenonwoven composites. In: Journal of Industrial Textiles, 2005, vol. 35, pp. 47–62.
[21] Meng, J., Song, L. and Meng, J. Using single-walled carbon nanotubes nonwoven films as scaffolds to enhancelong-term cell proliferation. In: Journal of Biomedical Materials Research Part A. 2006, vol. 79A, pp. 298–306.
Authors:
MOHAMED TAHER HALIMI1, MOHAMED BEN HASSEN2,3, BECHIR WANNASSI3
1Financial and Administrative Sciences Department, Community College Dammam, Imam Abdulrahman Bin Faisal University, P.O. Box 1982 Dammam, Kingdom of Saudi Arabia
e-mail: [email protected]
2Department of Industrial Engineering, College of Engineer, Taibah University, Madina, Saudi Arabia
e-mail: [email protected], [email protected]
3Laboratory of Textile Engineering, University of Monastir, ISET Ksar Hellal, Tunisia
Corresponding author:
MOHAMED BEN HASSENe-mail: [email protected], [email protected]
INTRODUCTION
The use of natural cellulosic fibers as reinforcementsin composite materials has increased thanks to thebenefits of these fibers such as ecological aspects,low cost, light weight and high specific modulus [1].Moreover, compared to high performance fibers suchas glass and carbon ones, natural cellulosic fiberspresent no health risks for manufacture employees orend users. Markets associated to these compositesare touching a wide range of applications in manyindustrial fields like transport and buildings. The ther-moplastic polymeric matrices are preferred to ther-mosets due to their low production cycle and lowercosts of processing. Several natural fibers such ashemp, jute and flax have been studied as a rein-forcement and filler in thermoplastic polypropylene(PP) matrix to prepare composites [2]. Those studieswere performed to investigate and improve themechanical and thermal performances such as ten-sile strength, impact strength, young’s modulus, ther-mal stability, etc. Researchers have shown that thecompatibility between matrix and fillers is crucialparameter to obtain a low cost with high perfor-mances composites as it avoids chemical compat-ibilization. In this work, we use Mediterranean
Posidonia (Posidonia oceanica) fibers as filler. That isa marine plant which loses leaves in autumn, and itswaste deposits can be found mainly along sandycoasts, forming wedge structures, from a few cen-timeters to several meters thick, denominated “aega-gropiles” [3]. These sea wastes are not appreciatedby the swimmers because of their bad smell emittedgazes and the pollution caused to beaches.Furthermore, the government incurs significant finan-cial losses to remove that dirt and these wastes areburned or re-immersed in the sea [4]. The valorisa-tion of this available, low price and renewablebiomass for the production of environmentally friend-ly industrial products is an important economic andecological challenge [5]. Some researches were con-ducted to explore the use of Posidonia fiber, as a lowcost and renewable adsorbent for removing dyes, oras fiber production of cellulosic derivatives [6–7].Other research works studied the performances ofPosidonia fibers as reinforcement for compositematerials [8]. They focused on the effects of addingPosidonia fiber on the mechanical and thermal prop-erties of the obtained material using twin screwextruders which damage the fiber structure. In thepresent work, we propose to study the influence of
Design of high mechanical and thermal resistant compositesusing marine plant waste
SAOUSSEN ZANNEN LAURENCE JEANMICHEL
RIADH ZOUARI STEPHANE MOLINA
MOHAMED BEN HASSEN
REZUMAT – ABSTRACT
Proiectarea compozitelor cu rezistență mecanică și termică ridicată
Au fost investigate proprietățile mecanice și termice ale unei structuri compozite fabricate din matrice de polipropilenăranforsată cu fibre de deșeuri marine, Posidonia oceanica. Am demonstrat că această fibră disponibilă în mare parte pecoasta mediteraneană prezintă multe avantaje în comparație cu alte fibre naturale utilizate în mod convențional caarmătură. De fapt, fibra Posidonia este extrasă cu ușurință numai prin acțiune mecanică. În plus, aceasta îmbunătățeșteproprietățile mecanice ale întregului compozit, fără a fi nevoie de compatibilizatori datorită hidrofobiei sale. În cele dinurmă, în afară de performanțele mecanice, s-a demonstrat că încorporarea fibrei cu un raport ridicat nu-și degradeazăproprietățile termice care sunt o specificitate a fibrelor rezistente termic, care ar putea avea ca rezultat producerea uneigame variate de aplicații.
Cuvinte-cheie: compozite, fibra Posidonia, performanțe termice și mecanice, tratament pe bază de silan
Design of high mechanical and thermal resistant composites using marine plant waste
We investigate the mechanical and thermal properties of a composite structure manufactured from polypropylene matrixreinforced with marine waste fibers, Posidonia oceanica. We show that this fiber largely available on Mediterraneancoasts presents many advantages compared to other natural fibers conventionally used as reinforcement. In fact,Posidonia fiber is extracted easily with only mechanical action. Moreover, it enhances the mechanical properties of thewhole composite without any need of compatibilizers due to its hydrophobicity. Finally, apart from the mechanicalperformances, we demonstrate that the incorporation of the fiber with high ratio does not degrade its thermal propertieswhich are a specificity of thermally resistant fibers that could open a wide range of applications.
Keywords: composites, Posidonia fiber, thermal and mechanical performances, silane treatment
446industria textila 2018, vol. 69, nr. 6˘

chemical treatment of fibre on thermal and mechani-cal properties of a composite manufactured frompolypropylene (PP) matrix and Posidonia oceanicawaste fibers reinforcement. The ecological aspectassociated to this fiber does not come only from thevalorisation of this natural resource, but also from theecological extraction method of the fiber itself basedon one step mechanical process. Single screwextruder is used to avoid excessive damage of fibersstructure.
MATERIALS AND METHODS
Fibers extraction and composite preparation
The balls of Posidonia were harvested from thecoasts of Tunisia. They were manually frayed andplaced on a horizontal opener. The balls openedmanually are driven by a rolling lurking and then theyare engaged in a threshing cylinder. Subsequently,they are driven by means of a toothed roller in orderto separate fibers. By centrifugal force and aspiration,fibers are driven upwardly and the waste falls down.The fiber obtained after this mechanical treatment willbe considered as raw fibers. To apply chemical treat-ment, Posidonia fibers were soaked in aqueous solu-tion containing 1% by weight of silane coupling agent(aminosilane) and initiator 0.05%, which converts thealkoxysilane groups to silanol. The pH was adjustedto 3.5 with acetic acid in order to prevent polymeriza-tion of silane into polysiloxane. After continuous stir-ring of the whole mixture for 10 minutes, the fiberswere immersed in the solution and the mixture wasstirred for one hour. The fibers were subsequentlydried in an oven at 60 °C for 24 hours [9].To prepare the composite structures, the thermoplas-tic polymer used as matrix is homopolymer poly -propylene (PP). It was in the form of pellets of 3 to 4mm in diameter. The treated and non treated fiberswere crushed using a crusher RETSCH SK100. Aftergrinding, we carried out a sifting with a sieve of 200microns and therefore the length of the fibers usedfor extrusion is between 200 µm and 2 mm. The max-imum proportion used in fiber was 30%. Beyond thisratio, extrusion was impossible. Then, mixtures of twomass proportions (20 % and 30 %) were prepared byweighing. The fibers are conditioned at a temperatureof 105 °C before preparing such mixtures. The abovemixtures will feed a single screw extruder. The screwis divided to three temperature regions of 190 °C,200 °C and 210 °C. To mold our samples, we usedthermo-compression. It consists of two parallel plateswith controlled temperatures which could be separat-ed in controlled distance allowing inserting a mold.The mold used in this study is a brass one leading tocomposite plate of 120 × 120 mm2 with a thickness of
4 mm. Then, the molding of the composites is carriedout as follow: Once the mold has been filled withcomposite extracted from the extruder, it is placed onthe lower plate of the heating press and receives itscover. The upper plate is then slowly lowered untilclosed and maintained under pressure for 30 sec-onds. Then, the mold is removed from the press andthen cooled by means of a cooling system main-tained at the temperature of fresh water. Once themold is cooled, disassembly and extraction of thecomposite specimen is carried out.
Mechanical analysis of composites
The tensile test of the specimen were determinedusing universal testing machine (Instron), accordingto ISO 527, with a traveling speed of 0,8 mm/min anda cell of 30 kN. The distance between clamps for trac-tion is fixed to 60 mm.
Thermal analysis of fiber and composites
A thermobalance SETARAM SETSYS TG12 wasused to study the thermal stability (TGA) of the com-posite and its components. Samples (m ≈ 70 mg) areplaced in a nacelle, and were subjected to a temper-ature scan from 20 to 700 °C with a rate of 10 °C/minunder nitrogen flow (55 ml / min). A combustion stepis necessary between two analyzes to remove resid-ual particles in the device. The derivative of TGAcurves (DTG) was obtained using TA analysis soft-ware.
Fourier transform infrared spectroscopy ofPosidonia fibers
The FTIR spectra of raw and surface treated naturalfibers were recorded in a Perkin-Elmer FT-IR spec-trometer Frontier which is connected to an ATRaccessory. In the ATR technique, the fiber sample ispressed against a crystal (Diamond) and the infraredbeam interacts with the sample at the interface.Absorbance was measured over a range from 4000to 400 cm–1.
RESULTS AND DISCUSSIONS
Effect of fiber treatment on mechanicalproperties of composites
Table 1 summarizes the mechanical properties asso-ciated to the matrix and the composites reinforcedwith 30% of raw and treated fibers. These samplesare denominated PP, Comp RPF-PP and Comp TPF-PP, respectively. It demonstrates that addition of fiberincreases the Young modulus of the reinforced mate-rial and reduces its elongation at break: the plasticityzone of the material is restricted. Therefore, the rigid-ity of the material increases due to the interaction
447industria textila 2018, vol. 69, nr. 6˘
Specimen Fiber weight ratio (%) E (Gpa) s (Mpa) e (%)
PP 0 0.88 ± 0.03 20.34 ± 0.93 10.53 ± 0.27
Comp RPF-PP 30 1.34 ± 0.07 17.70 ± 0.66 2.84 ± 0.34
Comp TPF-PP 30 1.39 ± 0.07 19.22 ± 0.56 2.25 ± 0.14
Table 1

between fibers and matrix. Many researchers haveobserved the same behavior for natural fibers rein-forced thermoplastic matrix and have attributed theimproved mechanical properties to increased disper-sive interactions [10]. It can be noted also that the reinforcement of poly -propylene matrix with Posidonia fibers changes thetensile properties of composite material. Indeed,whatever the nature of the fiber reinforcement (raw ortreated) added to the matrix, the Young’s modulusincreases. Thus, the rate of increase of this mechan-ical parameter is about 52 % for the raw Posidoniafibers and 58 % for the fibers treated with silane(Comp TPF-PP) compared to pure polypropylene.This affirms well the trend widely illustrated in the lit-erature: the incorporation of compatibilized reinforce-ments within the matrix contributes to an improve-ment of the mechanical response of the system [1, 5].This enhancement could be attributed to a better dis-persion of the fibers within the matrix and that wasconfirmed with scanning electron microscope imagesassociated to breakage faces of composites shownon figure 1. In fact, we observe more fibers for treat-ed sample attributed to better dispersion within thematrix. Moreover, for both composites, it is clear thatslippage between matrix and reinforcements occurduring tensile measurements leading to holes or tofibers coming out of the polymer. This result could beexplained by the fact that the matrix and fibers adhe-sion is not based on chemical interaction but on phys-ical affinity. To investigate the treated and untreatedfibers surface state, they were submitted to FTIRexperiments, which spectra are presented in figure2, a. Both bands at 1166 cm–1 and 940 cm–1 repre-sent respectively the Si-O-C and Si-OH connections.This proves that the hydroxyl groups of the cellulosewere blocked with the silane. Then the fiber’s surfacebecomes more hydrophobic.This result explains the enhancement of the mechan-ical properties of composites reinforced with treatedfibers. Thus, when the Posidonia fibers were treatedwith silane, physical affinity occurs leading to betterinteraction and sticking between matrix and fibers.Nevertheless, even the raw Posidonia fibers contributeto a large increase of the mechanical performances
under tensile stress of the composite which consti-tutes a big advantage of the Posidonia fiber as it doesnot need any chemical operation neither to be extract-ed, nor to be dispersed within the hydrophobic matrix.This is due to the hydrophobic character associatedto this natural reinforcement experimentally approved[11]. Moreover, comparison between the mechanicalproperties under tensile stress of polypropylene rein-forced with a widely used natural fiber which is rawhemp under the same forming conditions show thatPosidonia fibers lead largely to a better Young mod-ulus. In fact, this modulus increases from 1.013 GPafor hemp [10] to 1.34 GPa for Posidonia. This couldbe attributed to the more hydro phobic character ofPosidonia compared to hemp fibers confirmed by thelower content of humidity of 2.1 % for Posidonia fiberversus 10 % for hemp fiber [11–12].
Effect of fiber weight ratio and treatment onthermal properties of composites
Figure 2, b shows the thermogravimetric behaviorDTG of neat polypropylene (Neat PP), raw Posidoniafiber (RPF) and polypropylene matrix reinforced with30 % of raw Posidonia fiber (Comp RPF-PP (30%)).We observe that matrix decomposition begins atabout 390 °C and continued until the maximum decom-position temperature at 453.66 °C. At this tempera-ture, the polymer chains are degraded completely.The decomposition is totally completed over 500 °Cand the residual mass is only 3.5 % of the originalmass. For Posidonia fibers, there are three mass lossregions: 51–105 °C, 225–400 °C and temperaturehigher than 400 °C. The first region corresponds tothe observed dehydration of the fiber at 105 °C.Beyond this area, and up to 225 °C, the mass varieslittle which shows good thermal stability. Beyond thistemperature, there is a loss of mass resulting in ashoulder on the DTG curve and which is related tothe decomposition of the fibers by depolymerizinghemicellulose and pectins at about 277 °C. Maximumdegradation occurs at about 322.81 °C (about 130 °Clower than the matrix), which reflects the degradationof cellulose. In the case of composite with 30 % ofreinforcements, the DTG curves do not correspond towhat would be obtained by summing the contribu-tions of each partial component (Posidonia and PP).
448industria textila 2018, vol. 69, nr. 6˘
Fig. 1. SEM micrographs of fracture surfaces associated to composites with (a) raw and (b) treated Posidonia fibers
In contrary, we observe a low intensity peak atT = 323.7 °C, which reflects the degradation of thefiber. This slight shift associated to the decompositiontemperature of fibers suggests that the thermal sta-bility of Posidonia oceanica inside the PP matrix isslightly increased. In fact, the matrix that has moreresistance to high temperature enrobes the fibersthus having some protecting effect leading to a slightincrease of the fiber degradation temperature. Alsoanother peak of high intensity at 452.28 °C could beobserved, which corresponds to the degradation ofthe polypropylene chains. This peak corresponds towhat we observe for neat polymer. From these obser-vations, it is clear that the incorporation of fibers donot affect the overall thermal stability of polypropy-lene. This characteristic of conserving the thermalstability of composites reinforced with Posidoniafibers is an asset for these natural resources in par-ticular for thermal insulation applications. In fact,most researchers concluded that thermal stability ofpolypropylene reinforced with other natural fibersdecreases once adding fibrous reinforcement.Jakab et al. noted that the maximum rate of PPdecomposition decreases by about 10 % when mixedwith wood fibers [13]. Ragoubi et al. reported thatadding 20 % of raw miscanthus fibers reduces themaximum temperature of composite degradation by6 °C [10]. It was detected at 470 °C for reinforcedcomposite versus 476 °C for neat PP matrix. Tajvidiand Takemura found that the overall thermal degra-dation of the composites obtained by adding of woodflour, kenaf fiber and rice hulls to polypropyleneseemed to be an average of the thermal behaviorof the component [14]. This asset associated toPosidonia comes from intrinsic properties of thisfiber: the surface hydrophobicity and the chemicalconstitution. In fact, hydrophobicity enhances adhe-sion between polypropylene matrix and fibers. Thisphysico-chemical affinity is proved to improve thethermal stability of the material [15]. In that latterwork, Joseph et al. reported that the thermal stabilityof the sisal/PP composite was higher than that of thefibre and the neat matrix, due to better fibre–matrixadhesion after alkaline treatment. In addition,
Rahmoune et al. found that soda and silane treat-ment improve the thermal stability thanks to the fiberstructure modification after these chemical and phys-ical treatments [16]. Moreover, the presence of phe-nolic groups constituting the fiber cells induces a flameretardant character to the fibers, therefore explainingimproved thermal stability [17]. This is also confirmedby the important calorific power of Posidonia fiber. Infact, Ntalos G. and Sideras A. reported that Posidoniaoceanica has more calorific values than the conven-tional biomass like bagasse, rice husks and corncobs [18]. This important calorific value means thatthis biomass traps more heat which explains theirimportant thermal properties.
CONCLUSIONS
The use of Posidonia oceanica as reinforcement ofthermoplastic polymers is an interesting solution forupgrading this natural waste in beaches and entailingan elevated economical cost for local governments.Polypropylene reinforced with Posidonia oceanicacould be used in multiple applications replacing woodand wood like products. Then, in this study we inves-tigated the influence of silane treatment applied toPosidonia fibers on the tensile and thermal proper-ties of reinforced polypropylene composites. Resultsprove that the young modulus of Posidonia rein-forced PP was enhanced and better elastic moduluswas obtained when composites were reinforced withfibers treated with silane, compared to raw fibers.Reinforcement with Posidonia oceanica fibers doesnot induce any degradation to the thermal stability ofthe matrix which constitutes a great asset relativelyto conventional natural cellulosic fibers. This assetcomes from intrinsic properties associated to the fiber:surface hydrophobicity and chemical constitution ofthe fiber containing phenolic groups. In fact, hydro -phobicity enhances adhesion between poly propy lenematrix and fibers that has a synergistic effect onthermal stability of the material. The presence of phe-nolic groups induces a flame retardant character tothe fibers which improves thermal stability. This workoffers environmental friendly materials for a widerange of industrial applications due to its coupling tohigh mechanical and thermal performances.
449industria textila 2018, vol. 69, nr. 6˘
a b
Fig. 2. a – FT-IR spectra of untreated (RPF) and treated (TPF) Posidonia fibers; b –DTG curves for neat PP matrix,Raw Posidonia Fiber and composite reinforced with 30 % of raw Posidonia fiber (Comp RPF-PP (30 %))
450industria textila 2018, vol. 69, nr. 6˘
BIBLIOGRAPHY
[1] Tudose, V., Coterlici, R. F., Tudosege, D., Gheorghiu, H., Dan Pasrama, S. Study regarding the use of cotton fiberreinforced composite for obtaining protection helmets, In: Industria Textila, 2016, vol. 67, pp 135–140.
[2] Deepak, V. and Siddharth, J. Effect of natural fibers surface treatment and their reinforcement in thermo-plasticpolymer composites: A review, In: Current Organic Synthesis, 2017, vol. 14, pp.186–199.
[3] Chessa, L. A., Fustier, V., Fernandez, C., Mura, F., Pais, A., Pergent, G., Serra S. and Vitale, L. Contribution to theknowledge of ‘Banquettes’ of Posidonia oceanic (L.) Delile in Sardinia Island. In: Proceedings of the 4thInternational Seagrass Biology Workshop, Biologia Marina Mediterranea, Corsica, France, 2000, vol. 7, pp. 35–38.
[4] Mohamed Ali Wahab, Salah Jellali, Naceur Jedidi, Effect of temperature and pH on the biosorption of ammoniumonto Posidonia oceanica fibers: Equilibrium, and kinetic modeling studies, In: Bioresource Technology, 2010,vol. 101, pp. 8606–8615.
[5] Dural, M.U., Cavas, L., Papageorgiou, S.K., Katsaros, F.K. Methylene blue absorption on activated carbon preparedfrom Posidonia oceanica (L.) dead leaves: kinetics and equilibrium studies, In: Chemical Engineering Journal, 2011,vol. 168, pp. 77–85.
[6] Ncibi, M.C., Mahjoub, B., Seffen, M. Investigation of the sorption mechanisms of metal-complexed dye ontoPosidonia oceanica (L.) fibres through kinetic modelling analysis, In: Bioresource Technology, 2008, vol. 99,pp. 5582–5589.
[7] Aguir, C. and Mhenni, M.F. Experimental study on carboxymethylation of cellulose extracted from Posidoniaoceanic, In: Journal of Applied Polymer Science, 2006, vol. 98, pp. 1808–1816.
[8] Zannen, S., Ghali, L., Halimi, M.T. and Hassen, M.B. Effect of fiber weight ratio and fiber modification on flexuralproperties of posidonia-polyester composites. In: Open Journal of Composite Materials, 2016, vol. 6, pp. 69–77.
[9] Valadez-Gonzalez, A., Cervantes-Uc, J.M., Olayo, R. and Franco, P.J.H. Effect of fiber surface treatment on thefiber–matrix bond strength of natural fiber reinforced composites, In: Composites Part B: Engineering, 1999, vol. 39,pp. 309–320.
[10] Ragoubi, M., George, B., Molina, S., Bienaimé, D., Merlin, A., Hiver, J.-M., Dahoun, A. Effect of corona dischargetreatment on mechanical and thermal properties of composites based on miscanthus fibres and polylactic acid orpolypropylene matrix, In: Composites: Part A, 2012, vol. 43, pp. 675–685.
[11] Aguir, C. and M’henni Mohamed Farouk, Chemical modification of Posidonia with cyclic anhydrides: effect onthermal stability, In: Carbohydrate Research, 2010, vol. 345, pp. 264–269.
[12] Alexander, B., Ibon Aranberri-A., and Jürgen, S. Surface characterization of flax, hemp and cellulose fibers; surfaceproperties and the water uptake behavior, In: Polymer Composites, October 2002, vol. 23, no. 5, pp. 872–894.
[13] Jakab, E., Varhegyi, G. and Faix, O. Thermal decomposition of polypropylene in the presence of wood-derivedmaterials, In: Journal of Analytical and Applied Pyrolysis, 2000, vol. 56, pp. 273–285.
[14] Mehdi, T. and Akio, T. Thermal degradation of natural fiber-reinforced polypropylene composites, In: Journal ofthermoplastic composite materials, 2010, vol. 23.
[15] Joseph, P.V., Joseph, K., Thomas, S., Pillai, C.K.S., Prasad, V.S., Groeninckx, G., Sarkissova, M. The thermal andcrystallisation studies of short sisal fibre reinforced polypropylene composites, In: Composites: Part A, 2003, vol. 34,pp. 253–266.
[16] Rahmoune, M.A., Benhamou, A., Fernane, F., Joumana, T. Effect of treatment with soda and dimethoxy -dimethylsilane on water absorption and thermal stability of olive pomace flour and date stone, In: Journal ofmaterials and environmental science, 2015, vol. 6, no. 9, pp. 2655–2664.
[17] Castellano, G., Tena, J. and Torrens, F. Classification of phenolic compounds by chemical structural indicators andits relation to antioxidant properties of Posidonia oceanica (L.) delile. In: MATCH Communications in Mathematicaland in Computer Chemistry, 2012, vol. 67, pp. 231–250.
[18] Ntalos, G., Sideras, A. The usage of Posidonia oceanica as a raw material for wood composite and thermal energyproduction, In: Journal of International Scientific Publications: Materials, Methods and Technologies, 2014, vol. 8,pp. 605–611.
Authors:
SAOUSSEN ZANNEN1, RIADH ZOUARI1, MOHAMED BEN HASSEN2, 1,
LAURENCE JEANMICHEL3, STEPHANE MOLINA4
1Textile Engineering Laboratory, Monastir University, Monastir, Tunisiae-mail: [email protected], [email protected]
2College of Engineering: Industrial Engineering Department, Taibah University Saudi Arabiae-mail: [email protected]; [email protected]
3CETELOR Centre d’Essais Textile Lorraine, Université of Lorraine, Epinal, Francee-mail: [email protected]
4LERMAB Laboratoire d’Etudes et de Recherche sur le Matériau Bois, Université of Lorraine, Nancy, France
e-mail: [email protected]
Corresponding authors:
MOHAMED BEN HASSENe-mail: [email protected]; [email protected]

INTRODUCTION
Rubiatinctorum also called madderis one of the old-est dye used in paintings, for textiles and leather dye-ing [1–2]. The extract of madder roots contains up36 anthraquinone compounds [3]. The main 15 colorcomponents extracted from the root of RubiaTinctoria are grouped together in the Colour Index asC. I. Natural Red 8, among which the most importantones are alizarin, purpurin, xanthopurpurin, rubiadin,pseudopurpurin, munjistin, lucidin and, the glycosidiccompounds ruberythric acid and lucidinprimevero-side [4–5].The main issues raised by the use of natural dyedtextiles are the effects on human health and the envi-ronment and coloristic resistance to wearing andmaintenance.In Ayurvedic medicine, Indian madder is used as animmune regulator, blood purifying herb, antioxidant,to regulates blood pressure and blood vessel con-striction, treatment of kidney and bladder stones, lax-ative, mild sedative [6]. Rubiatinctorum is used as
antifungal [7] and antimicrobial [8] medicine and hasantioxidant capacity superior to 1 m MTrolox equiva-lent (hydrosoluble form of vitamin E) [9]. Even former studies reported a mutagenic potentialof RubiaTinctorium [10–11] due to 1,3-dihydroxyan-thraquinones which bear a methyl orhydroxymethylgroup on carbon-2 such as lucidin [12], new scientif-ic researches demonstrate the lack of dye’cytotoxicactivity [9].More than that the, absorbing in UV region, the mate-rials dyed with madder could provide an effective andcommon mean to protect the human body against theharmful effects of UV rays, such as premature agingand skin cancers [13–14]. Along the time different recipes were used to dye cot-ton with madder roots, the most renown being theTurkey red process involving 7 up to 20 stages [15].Being a so complex process, different others syn-thetic and natural mordants are used to increase thefixation of the dye and to improve the light/wash fast-ness of the dyestuff compounds.
451industria textila 2018, vol. 69, nr. 6˘
Multi-functional effects of textiles dyed with madder roots powder(Rubiatinctoria)
OVIDIU GEORGE IORDACHE
DANA STEFANESCU
MARIANA PISLARU
IULIANA DUMITRESCU ELENA-CORNELIA MITRAN ELENA VARZARU RODICA CONSTANTINESCU
REZUMAT – ABSTRACT
Efectele multifuncționale ale textilelor vopsite cu extract din rădăcină de roibă (Rubiatinctoria)
În acest studiu, tricotul de 100% bumbac a fost supus tratamentului preliminar de mordansare cu tanin de mimoză șitanin de mimoză/alaun și vopsit cu un colorant extras din rădăcină de roibă. Gradul de epuizare a fost realizat prinspectroscopie UV-Vis. Rezistența culorii la lumină, spălare, frecare (umedă și uscată) și transpirația țesăturilormordansate și vopsite au fost evaluate conform standardului ISO specific.Probele au fost testate la protecția împotriva radiațiilor ultraviolet și activitatea antibacteriană împotriva tulpinilor deStaphylococcus aureus. Rezistența culorii la spălare și lumină sunt slabe, iar rezistența la transpirație și frecare estemoderată. Țesăturile vopsite demonstrează un efect excelent de protecție UV și o bună activitate antibacteriană. Chiarși subțiri, materialele utilizate pentru hainele de vară vopsite cu roibă ar putea oferi un mijloc eficient și comun de aproteja corpul uman împotriva efectelor nocive ale radiațiilor ultraviolete.
Cuvinte-cheie: colorant natural, tanin de mimoză, alaun, protecție UV, activitateantimicrobiană
Multi-functional effects of textiles dyed with madder roots powder (Rubiatinctoria)
In this study, 100% cotton knit was premordanted with mimosa tannin and mimosa tannin/alum and dyed with a dyestuffextracted from Madder root. The degree of exhaustion was carry out by UV-Vis spectroscopy. The color fastness to light,wash, rubbing (wet and dry) and perspiration of the mordanted and dyed fabrics were evaluated according to specificISO standard.The samples were tested for ultraviolet protection and antibacterial activity against Staphylococcus aureus strains. Thecolor fastness to washing and light are poor and the fastness to perspiration and rubbing is moderate. The dyed fabricsdemonstrate an excellent UV protective effect and a good antibacterial activity. Even thin, the materials used for summerclothes dyed with madder could provide an effective and common mean to protect the human body against the harmfuleffects of UV rays.
Keywords: natural dye; mimosa tannin; alum, UV protection; antimicrobial activity
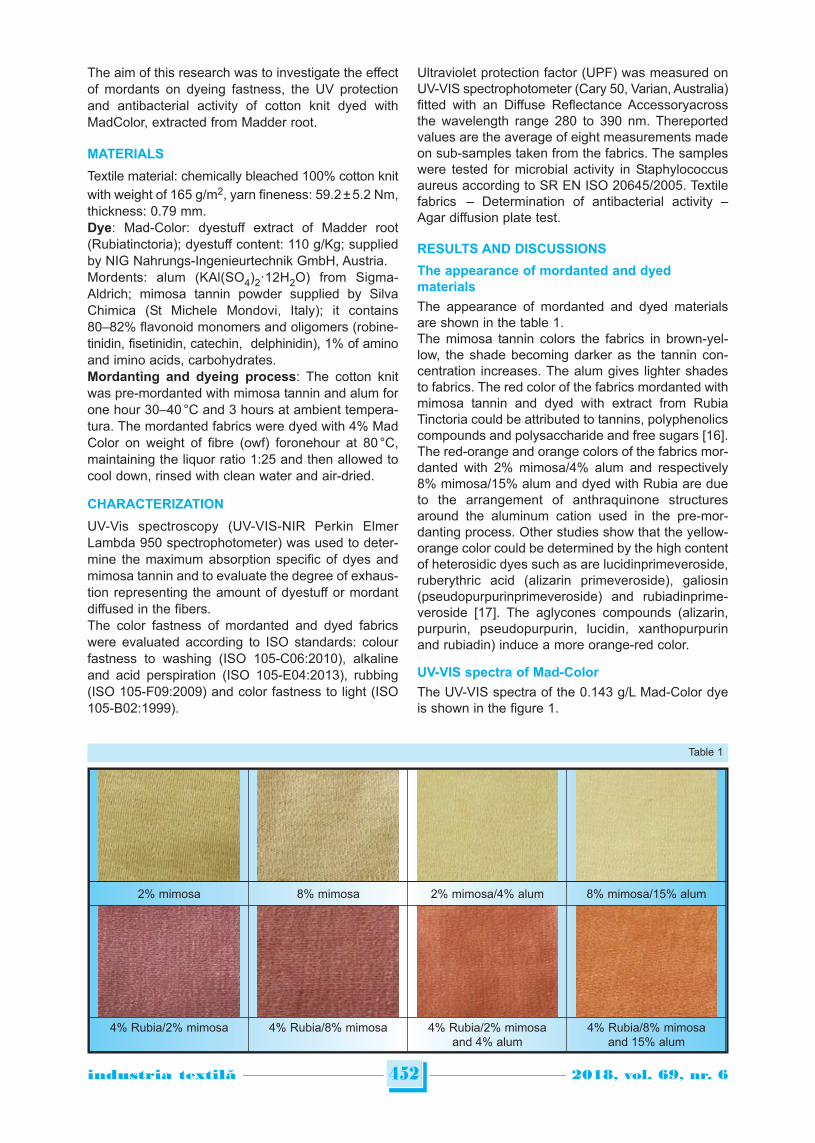
The aim of this research was to investigate the effectof mordants on dyeing fastness, the UV protectionand antibacterial activity of cotton knit dyed withMadColor, extracted from Madder root.
MATERIALS
Textile material: chemically bleached 100% cotton knit
with weight of 165 g/m2, yarn fineness: 59.2 ± 5.2 Nm,thickness: 0.79 mm.Dye: Mad-Color: dyestuff extract of Madder root(Rubiatinctoria); dyestuff content: 110 g/Kg; suppliedby NIG Nahrungs-Ingenieurtechnik GmbH, Austria.Mordents: alum (KAl(SO4)2·12H2O) from Sigma-Aldrich; mimosa tannin powder supplied by SilvaChimica (St Michele Mondovi, Italy); it contains80–82% flavonoid monomers and oligomers (robine-tinidin, fisetinidin, catechin, delphinidin), 1% of aminoand imino acids, carbohydrates.Mordanting and dyeing process: The cotton knitwas pre-mordanted with mimosa tannin and alum forone hour 30–40 °C and 3 hours at ambient tempera-tura. The mordanted fabrics were dyed with 4% MadColor on weight of fibre (owf) foronehour at 80 °C,maintaining the liquor ratio 1:25 and then allowed tocool down, rinsed with clean water and air-dried.
CHARACTERIZATION
UV-Vis spectroscopy (UV-VIS-NIR Perkin ElmerLambda 950 spectrophotometer) was used to deter-mine the maximum absorption specific of dyes andmimosa tannin and to evaluate the degree of exhaus-tion representing the amount of dyestuff or mordantdiffused in the fibers. The color fastness of mordanted and dyed fabricswere evaluated according to ISO standards: colourfastness to washing (ISO 105-C06:2010), alkalineand acid perspiration (ISO 105-E04:2013), rubbing(ISO 105-F09:2009) and color fastness to light (ISO105-B02:1999).
Ultraviolet protection factor (UPF) was measured onUV-VIS spectrophotometer (Cary 50, Varian, Australia)fitted with an Diffuse Reflectance Accessoryacrossthe wavelength range 280 to 390 nm. Thereportedvalues are the average of eight measurements madeon sub-samples taken from the fabrics. The sampleswere tested for microbial activity in Staphylococcusaureus according to SR EN ISO 20645/2005. Textilefabrics – Determination of antibacterial activity –Agar diffusion plate test.
RESULTS AND DISCUSSIONS
The appearance of mordanted and dyedmaterials
The appearance of mordanted and dyed materialsare shown in the table 1.The mimosa tannin colors the fabrics in brown-yel-low, the shade becoming darker as the tannin con-centration increases. The alum gives lighter shadesto fabrics. The red color of the fabrics mordanted withmimosa tannin and dyed with extract from RubiaTinctoria could be attributed to tannins, polyphenolicscompounds and polysaccharide and free sugars [16].The red-orange and orange colors of the fabrics mor-danted with 2% mimosa/4% alum and respectively8% mimosa/15% alum and dyed with Rubia are dueto the arrangement of anthraquinone structuresaround the aluminum cation used in the pre-mor-danting process. Other studies show that the yellow-orange color could be determined by the high contentof heterosidic dyes such as are lucidinprimeveroside,ruberythric acid (alizarin primeveroside), galiosin(pseudopurpurinprimeveroside) and rubiadinprime -veroside [17]. The aglycones compounds (alizarin,purpurin, pseudopurpurin, lucidin, xanthopurpurinand rubiadin) induce a more orange-red color.
UV-VIS spectra of Mad-Color
The UV-VIS spectra of the 0.143 g/L Mad-Color dyeis shown in the figure 1.
452industria textila 2018, vol. 69, nr. 6˘
2% mimosa 8% mimosa 2% mimosa/4% alum 8% mimosa/15% alum
4% Rubia/2% mimosa 4% Rubia/8% mimosa 4% Rubia/2% mimosaand 4% alum
4% Rubia/8% mimosaand 15% alum
Table 1
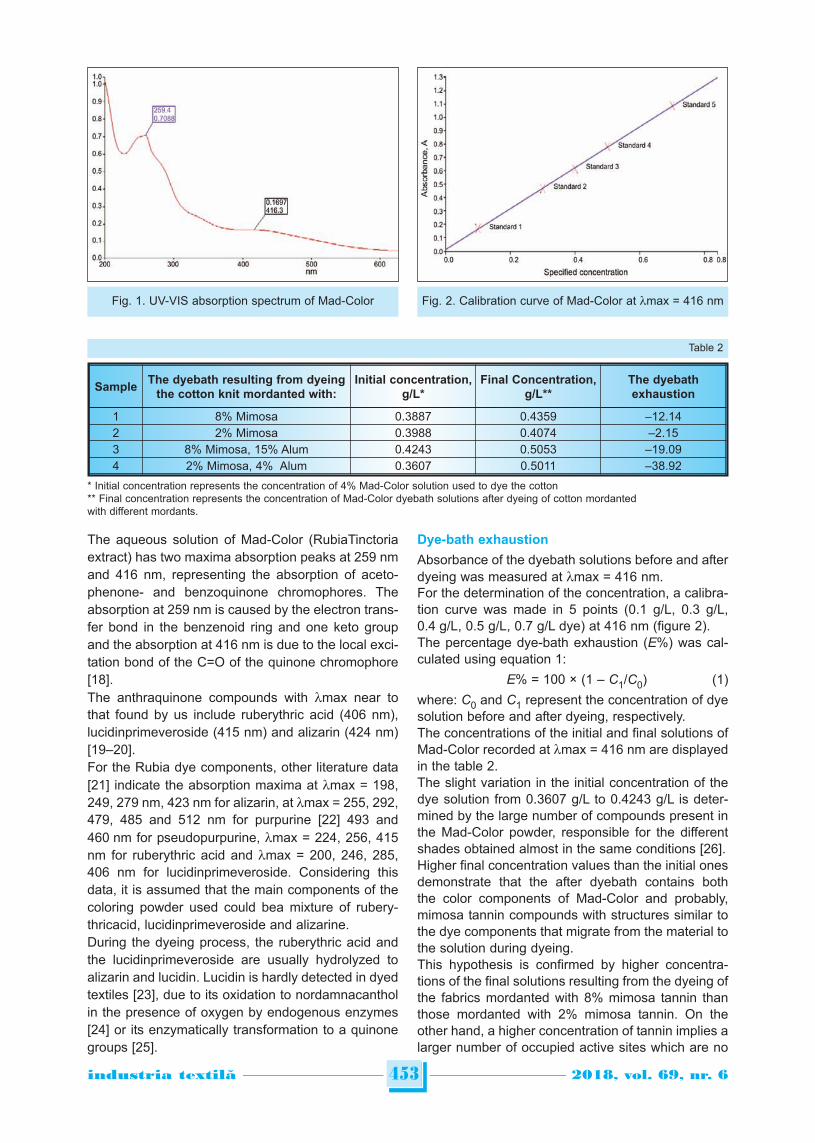
The aqueous solution of Mad-Color (RubiaTinctoriaextract) has two maxima absorption peaks at 259 nmand 416 nm, representing the absorption of aceto -phenone- and benzoquinone chromophores. Theabsorption at 259 nm is caused by the electron trans-fer bond in the benzenoid ring and one keto groupand the absorption at 416 nm is due to the local exci-tation bond of the C=O of the quinone chromophore[18].The anthraquinone compounds with lmax near tothat found by us include ruberythric acid (406 nm),lucidinprimeveroside (415 nm) and alizarin (424 nm)[19–20].For the Rubia dye components, other literature data[21] indicate the absorption maxima at lmax = 198,249, 279 nm, 423 nm for alizarin, at lmax = 255, 292,479, 485 and 512 nm for purpurine [22] 493 and460 nm for pseudopurpurine, lmax = 224, 256, 415nm for ruberythric acid and lmax = 200, 246, 285,406 nm for lucidinprimeveroside. Considering thisdata, it is assumed that the main components of thecoloring powder used could bea mixture of rubery-thricacid, lucidinprimeveroside and alizarine.During the dyeing process, the ruberythric acid andthe lucidinprimeveroside are usually hydrolyzed toalizarin and lucidin. Lucidin is hardly detected in dyedtextiles [23], due to its oxidation to nordamnacantholin the presence of oxygen by endogenous enzymes[24] or its enzymatically transformation to a quinonegroups [25].
Dye-bath exhaustion
Absorbance of the dyebath solutions before and afterdyeing was measured at lmax = 416 nm. For the determination of the concentration, a calibra-tion curve was made in 5 points (0.1 g/L, 0.3 g/L,0.4 g/L, 0.5 g/L, 0.7 g/L dye) at 416 nm (figure 2).The percentage dye-bath exhaustion (E%) was cal-culated using equation 1:
E% = 100 × (1 – C1/C0) (1)
where: C0 and C1 represent the concentration of dyesolution before and after dyeing, respectively. The concentrations of the initial and final solutions ofMad-Color recorded at lmax = 416 nm are displayedin the table 2.The slight variation in the initial concentration of thedye solution from 0.3607 g/L to 0.4243 g/L is deter-mined by the large number of compounds present inthe Mad-Color powder, responsible for the differentshades obtained almost in the same conditions [26]. Higher final concentration values than the initial onesdemonstrate that the after dyebath contains boththe color components of Mad-Color and probably,mimosa tannin compounds with structures similar tothe dye components that migrate from the material tothe solution during dyeing.This hypothesis is confirmed by higher concentra-tions of the final solutions resulting from the dyeing ofthe fabrics mordanted with 8% mimosa tannin thanthose mordanted with 2% mimosa tannin. On theother hand, a higher concentration of tannin implies alarger number of occupied active sites which are no
453industria textila 2018, vol. 69, nr. 6˘
Fig. 1. UV-VIS absorption spectrum of Mad-Color Fig. 2. Calibration curve of Mad-Color at lmax = 416 nm
SampleThe dyebath resulting from dyeing
the cotton knit mordanted with:Initial concentration,
g/L*Final Concentration,
g/L**The dyebathexhaustion
1 8% Mimosa 0.3887 0.4359 –12.14
2 2% Mimosa 0.3988 0.4074 –2.15
3 8% Mimosa, 15% Alum 0.4243 0.5053 –19.09
4 2% Mimosa, 4% Alum 0.3607 0.5011 –38.92
Table 2
* Initial concentration represents the concentration of 4% Mad-Color solution used to dye the cotton** Final concentration represents the concentration of Mad-Color dyebath solutions after dyeing of cotton mordantedwith different mordants.
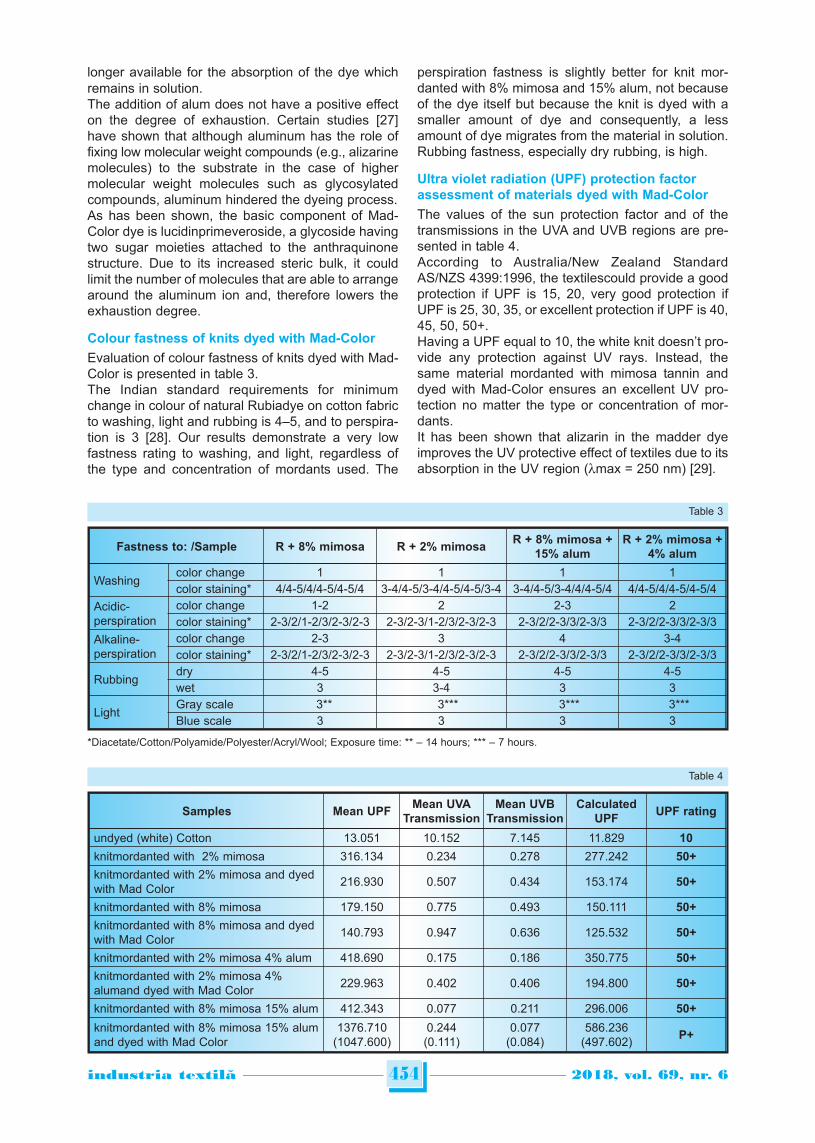
longer available for the absorption of the dye whichremains in solution.The addition of alum does not have a positive effecton the degree of exhaustion. Certain studies [27]have shown that although aluminum has the role offixing low molecular weight compounds (e.g., alizarinemolecules) to the substrate in the case of highermolecular weight molecules such as glycosylatedcompounds, aluminum hindered the dyeing process.As has been shown, the basic component of Mad-Color dye is lucidinprimeveroside, a glycoside havingtwo sugar moieties attached to the anthraquinonestructure. Due to its increased steric bulk, it couldlimit the number of molecules that are able to arrangearound the aluminum ion and, therefore lowers theexhaustion degree.
Colour fastness of knits dyed with Mad-Color
Evaluation of colour fastness of knits dyed with Mad-Color is presented in table 3.The Indian standard requirements for minimumchange in colour of natural Rubiadye on cotton fabricto washing, light and rubbing is 4–5, and to perspira-tion is 3 [28]. Our results demonstrate a very lowfastness rating to washing, and light, regardless ofthe type and concentration of mordants used. The
perspiration fastness is slightly better for knit mor-danted with 8% mimosa and 15% alum, not becauseof the dye itself but because the knit is dyed with asmaller amount of dye and consequently, a lessamount of dye migrates from the material in solution.Rubbing fastness, especially dry rubbing, is high.
Ultra violet radiation (UPF) protection factorassessment of materials dyed with Mad-Color
The values of the sun protection factor and of thetransmissions in the UVA and UVB regions are pre-sented in table 4.According to Australia/New Zealand StandardAS/NZS 4399:1996, the textilescould provide a goodprotection if UPF is 15, 20, very good protection ifUPF is 25, 30, 35, or excellent protection if UPF is 40,45, 50, 50+.Having a UPF equal to 10, the white knit doesn’t pro-vide any protection against UV rays. Instead, thesame material mordanted with mimosa tannin anddyed with Mad-Color ensures an excellent UV pro-tection no matter the type or concentration of mor-dants. It has been shown that alizarin in the madder dyeimproves the UV protective effect of textiles due to itsabsorption in the UV region (lmax = 250 nm) [29].
454industria textila 2018, vol. 69, nr. 6˘
*Diacetate/Cotton/Polyamide/Polyester/Acryl/Wool; Exposure time: ** – 14 hours; *** – 7 hours.
Fastness to: /Sample R + 8% mimosa R + 2% mimosaR + 8% mimosa +
15% alumR + 2% mimosa +
4% alum
Washing color change 1 1 1 1
color staining* 4/4-5/4/4-5/4-5/4 3-4/4-5/3-4/4-5/4-5/3-4 3-4/4-5/3-4/4/4-5/4 4/4-5/4/4-5/4-5/4
Acidic -perspiration
color change 1-2 2 2-3 2
color staining* 2-3/2/1-2/3/2-3/2-3 2-3/2-3/1-2/3/2-3/2-3 2-3/2/2-3/3/2-3/3 2-3/2/2-3/3/2-3/3
Alkaline-perspiration
color change 2-3 3 4 3-4
color staining* 2-3/2/1-2/3/2-3/2-3 2-3/2-3/1-2/3/2-3/2-3 2-3/2/2-3/3/2-3/3 2-3/2/2-3/3/2-3/3
Rubbingdry 4-5 4-5 4-5 4-5
wet 3 3-4 3 3
LightGray scale 3** 3*** 3*** 3***
Blue scale 3 3 3 3
Table 3
Samples Mean UPFMean UVA
TransmissionMean UVB
TransmissionCalculated
UPFUPF rating
undyed (white) Cotton 13.051 10.152 7.145 11.829 10
knitmordanted with 2% mimosa 316.134 0.234 0.278 277.242 50+
knitmordanted with 2% mimosa and dyedwith Mad Color
216.930 0.507 0.434 153.174 50+
knitmordanted with 8% mimosa 179.150 0.775 0.493 150.111 50+
knitmordanted with 8% mimosa and dyedwith Mad Color
140.793 0.947 0.636 125.532 50+
knitmordanted with 2% mimosa 4% alum 418.690 0.175 0.186 350.775 50+
knitmordanted with 2% mimosa 4%alumand dyed with Mad Color
229.963 0.402 0.406 194.800 50+
knitmordanted with 8% mimosa 15% alum 412.343 0.077 0.211 296.006 50+
knitmordanted with 8% mimosa 15% alumand dyed with Mad Color
1376.710(1047.600)
0.244(0.111)
0.077(0.084)
586.236(497.602)
P+
Table 4
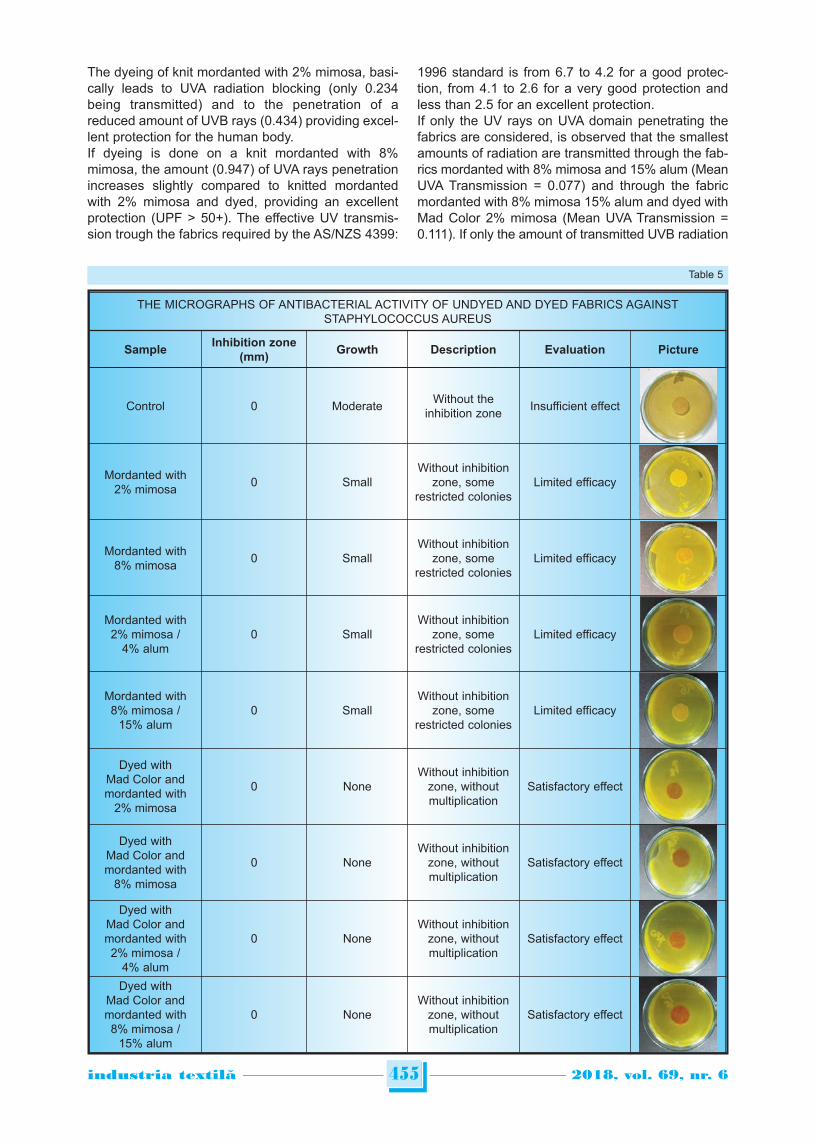
455industria textila 2018, vol. 69, nr. 6˘
THE MICROGRAPHS OF ANTIBACTERIAL ACTIVITY OF UNDYED AND DYED FABRICS AGAINSTSTAPHYLOCOCCUS AUREUS
SampleInhibition zone
(mm)Growth Description Evaluation Picture
Control 0 ModerateWithout the
inhibition zoneInsufficient effect
Mordanted with2% mimosa
0 SmallWithout inhibition
zone, somerestricted colonies
Limited efficacy
Mordanted with8% mimosa
0 SmallWithout inhibition
zone, somerestricted colonies
Limited efficacy
Mordanted with2% mimosa /
4% alum0 Small
Without inhibitionzone, some
restricted coloniesLimited efficacy
Mordanted with8% mimosa /
15% alum0 Small
Without inhibitionzone, some
restricted coloniesLimited efficacy
Dyed withMad Color andmordanted with
2% mimosa
0 NoneWithout inhibition
zone, withoutmultiplication
Satisfactory effect
Dyed withMad Color andmordanted with
8% mimosa
0 NoneWithout inhibition
zone, withoutmultiplication
Satisfactory effect
Dyed withMad Color andmordanted with2% mimosa /
4% alum
0 NoneWithout inhibition
zone, withoutmultiplication
Satisfactory effect
Dyed withMad Color andmordanted with8% mimosa /
15% alum
0 NoneWithout inhibition
zone, withoutmultiplication
Satisfactory effect
Table 5
The dyeing of knit mordanted with 2% mimosa, basi-cally leads to UVA radiation blocking (only 0.234being transmitted) and to the penetration of areduced amount of UVB rays (0.434) providing excel-lent protection for the human body.If dyeing is done on a knit mordanted with 8%mimosa, the amount (0.947) of UVA rays penetrationincreases slightly compared to knitted mordantedwith 2% mimosa and dyed, providing an excellentprotection (UPF > 50+). The effective UV transmis-sion trough the fabrics required by the AS/NZS 4399:
1996 standard is from 6.7 to 4.2 for a good protec-tion, from 4.1 to 2.6 for a very good protection andless than 2.5 for an excellent protection.If only the UV rays on UVA domain penetrating thefabrics are considered, is observed that the smallestamounts of radiation are transmitted through the fab-rics mordanted with 8% mimosa and 15% alum (MeanUVA Transmission = 0.077) and through the fabricmordanted with 8% mimosa 15% alum and dyed withMad Color 2% mimosa (Mean UVA Transmission =0.111). If only the amount of transmitted UVB radiation
456industria textila 2018, vol. 69, nr. 6˘
BIBLIOGRAPHY
[1] Schweppe, H., Winter, J. Madder and alizarin artist’ pigments: a handbook of their history and characteristics, In:E. West FitzhHugh, Washington and Oxford, 1997.
[2] Sukenik, N., Iluz, D., Amar, Z., Varvak, A., Workman, V., Shamir, O., et al. (2017) Early evidence (late 2nd millenniumBCE) of plant-based dyeing of textiles from Timna, In: Israel. PLoS ONE 12(6): e0179014. https://doi.org/10.1371.
[3] Derksen, G.C.H., Niederländer, H.A.G., van Beek, T.A. Analysis of anthraquinones in Rubiatinctorum L. by liquidchromatography coupled with diode-array UV and mass spectrometric detection, In: J. Chromatogr., A 978 (2002),pp. 119–127.
[4] Rafaëlly, L., Héron, S., Nowik, W., Tchapla, A. (2008) Optimisation of ESI-MS detection for the HPLC ofanthraquinone dyes. In: Dyes Pigm., 77, pp. 191–203.
[5] Chenciner, R. (2000) Madder Red: A history of luxury and trade. In: Caucasus World, Curzon Press;[6] Perumal Samy, Peter Natesan Pushparaj and Ponnampalam Gopalakrishnakone, A compilation of bioactive
compounds from Ayurveda, In: Bioinformation 3(3), pp. 100–110 (2008) http://www.bioinformation.net/003/002100032008.pdf.
[7] Manojlovic, N.T., Solujic, S., Sukdolak, S. & Milosev, M. (2005) Antifungal activity of Rubiatinctorum,Rhamnusfrangula and Caloplacacerina. In: Fitoterapia, 76, pp. 244–246.
is taken into account, the smallest values of the meanUVB transmission and consequently, the best protec-tion against UVB radiationare obtained for knittedfabrics with Mad Color, previously mordanted with8% mimosa, 15% alum and for the knitmordantedwith 2% mimosa and 4% alum.
Antibacterial activity evaluation
SR EN ISO 20645/2005 standard (Determination ofantibacterial activity-agar diffusion plate test): themanitolsalt Aagar gel is prepared for the lower layerwithout bacteria. (10 ± 0,1) mL gel is placed into eachsterilized Petri dish and allow gel to solidify. Anotheramount of gel is prepared for the upper layer andcooled to 45 °C in a water bath. 150 ml of gel is inoc-ulated with 1 mL of Staphylococcus aureus bacterial
working solution (1–5 × 10⁸ μg/mL). The container isvigorously stirred for the uniform distribution of bac-teria. (5 ± 0,1) mL are introduced in each Petri platesand allow the gel to solidify. The textile specimens(2 cm diameter) are placed on the surface of thenutrient medium and then incubated at 37°C for 18 h– 24 h. The antibacterial evaluation is based on theabsence or presence of bacterial multiplication in thecontact area between the agar and the test specimenand on the occurrence of a possible inhibition areaaround the specimens. Inhibition zones were calcu-lated using the following formula: H = (D – d)/2,where: H is the inhibition zone in mm; D – the totaldiameter of specimen and inhibition zone in mm;d – the diameter of specimen in mm.Table 5 shows the micrographs of antibacterial activ-ity of undyed and dyed fabrics against Staphylococcusaureus.Hier the data about methodic that you have used forantibacterial activity determining must be described.According to EN ISO 20645:2004 standard, the treat-ment is considered effective if the inhibition zone is≥ 1–0 mm and no growth under specimen is detect-ed, whereas 0 mm inhibition zone and slight growthis evaluated as limited effect and without coloniesmultiplication is evaluated as satisfactory effect.The inhibition zone is zero mm for all the tested sam-ples. The untreated cotton knit doesn’t have any
antibacterial activity. The efficacy of the fabrics mor-danted with mimosa tannin and mimosa tannin/alumis limited, a small growth of bacteria colonies isobserved on the materials. The dyed fabrics have a“satisfactory effect” as long as any bacterial growth isdetected on their surface. Different studies [8] report-ed the antibacterial activity of the madder dye, theresponsible compounds for this effect being consid-ered alizarin, purpurin and quinizarin [30–32] wichaffect the bacterial cell wall. Due to their redox poten-tial, these molecules form complexes with aminoacids, inhibiting the synthesis of proteins and thebacterial growth [33].
CONCLUSIONS
Knit cotton fabric was premordanted with mimosatannin and mimosa/alum and then dyed with MadColor powder extracted from Rubia Tinctoria. Being acomplex mixture, it is very difficult to identify theexact components responsible for dyeing of textiles,the UV-Vis spectra suggesting as main componentsruberythricacid, lucidinprimeveroside and alizarine. The exhaustion degree, spectrophotometrically eval-uated, has demonstrated the presence of dye andmimosa tannin in the after dye bath. Colour fastnessto washing and light is poor while the fastness to per-spiration and rubbing is moderate. The mordantedand dyed knitted fabrics highly improve the UV pro-tection ability by lowering the penetration of UV raysthrough the materials. Moreover, the dyed fabricsinhibit the bacterial growth, probably due to presenceof madder specific molecules on the material surfaceof the fiber.
ACKNOWLEDGMENTS
This study was supported by the Executive Unit forFinancing Higher Education, Research, Development andInnovation (UEFISCDI) through the project No. 55/2017 –UV-SHIELD in the frame of PN III Program, EUREKATraditional projects. Publishing has been funded also by Ministry of Researchand Innovation, by Program 1 – Development of the nation-al system for research-development, Subprogram 1.2 –Institutional performance – Projects for funding excellencein RDI, Contract no. 6PFE from 16.10.2018.

457industria textila 2018, vol. 69, nr. 6˘
[8] Kalyoncu, F., Cetin, B. & Saglam, H. (2006) Antimicrobial activity of common madder (Rubiatinctorum L.). In:Phytother. Res., 20, pp. 490–492
[9] Guinot, P., Lemoine, A., Joos, M.-É., Pélegrin, S., Gargadennec, A., Rapior, S., & Poucheret, P. (2010) Evaluationof antioxidant and antiproliferative activities of dyeing plants, In: Acta Botanica Gallica, 157:1, 37-43, DOI:10.1080/12538078.2010.10516187.
[10] Yasui, Y. & Takeda, N. (1983) Identification of a mutagenic substance in Rubiatinctorum L. (madder) root, as lucidin.In: Mut. Res. Lett., 121, pp. 185–190.
[11] Kawasaki, Y., Goda, Y. & Yoshihira, K. (1992) The mutagenic constituents of Rubiatinctorum. In: Chem. Pharm.Bull., 40, pp. 1504–1509.
[12] Bechtold, T. (2009) Natural colorants – quinoid, naphthaquinoid and anthraquinoid dyes. In: Bechtold T., Mussak R.(eds) Handbook of natural colorants. In: John Wiley & Sons, Ltd., pp. 151–182.
[13] Grifoni, D., Bacci, L., Lonardo, S.D. et al. (2014) UV protective properties of cotton and flaxfabrics dyed withmultifunctional plant extracts. In: Dyes and Pigments, 105, pp. 89–96.
[14] Hupel, M., Poupart, N., Gall, E.A. (2011) Development of a new in vitro method to evaluatethe photoprotectivesunscreen activity of plant extracts against high UV-B radiation. In: Talanta, 86, pp. 362–371;
[15] https://www.nms.ac.uk/turkey_red/colouring_the_nation/research/dyeing_and_printing_techniques/the_turkey_red_process.aspx date accessed 21/01/14.
[16] Chenciner, R., Madder Red: A history of luxury and trade, In: Curzon Press, 2000.[17] Mathe, C., Mazzitelli, J.-B., Vieillescazes, C. Madder: from the plant to the museum objects, In: e-conservation
Journal 5, 2017, accesed on 27 January 2018, http://e-conservation.org/65-madder-from-the-plant-to-museum-objects.
[18] Bioactive Natural Products (Part G) By Atta-ur-Rahman, Elsevier, Mar 1, 2002 – Science.[19] Zhang, X., Good, I. and Laursen, R. Characterization of dyes in ancient textiles from Xinjiang, In: J. Arch. Sci. 35,
pp. 1095–1103 (2008).[20] Zhang, X. and Laursen, R.A. Development of mild extraction methods for the analysis of natural dyes in textiles of
historical interest using LC-Diode Array Detector-MS, In: Anal. Chem. 77, pp. 2022–2025 (2005).[21] Daniels, V., Devièse, T., Hacke, M. and Higgitt, C. http://www.britishmuseum.org/pdf/BMTRB_8_Daniels_et_al.pdf.[22] http://sites.northwestern.edu/vanduyne/files/2012/10/2007_Whitney.pdf.[23] Mouri, C., Laursen, R. (2012) Identification of anthraquinone markers for distinguishing Rubia species in madder-
dyed textiles by HPLC. In: Microchim. Acta, 179, pp. 105–113.[24] Derksen, G.C.H., Naayer, M., van Beek, T.A., Capelle, A., Haaksman, I.K., van Doren, H.A., de Groot, Æ. (2003)
Chemical and enzymatic hydrolysis of anthraquinone glycosides from madder roots. In: Phytochem Anal, 14,pp. 137–144.
[25] Ishii, Y., Okamura, T., Inoue, T., Fukuhara, K., Umemura, T., Nishikawa, A. (2010). Chemical structure determinationof DNA bases modified by active metabolites of lucidin-3-Oprimeveroside. In: Chem Res Toxicol, 23, pp. 134–141.
[26] Hofenk de Graaff, J.H., The colourful past: Origins, chemistry and identification of natural dyestuffs, In: Abegg-Stiftung and Archetype Publications Ltd., Riggisberg and London, 2004.
[27] Henderson, R.L., Rayner, C.M., Blackburn, R.S. (2013) Isolation and extraction of lucidin primeveroside from Rubiatinctorum L. and crystal structure elucidation. In: Phytochemistry 95, pp. 105–108.
[28] Draft Indian Standard Textiles dyestuff – rubia dye (madder) – specification http://www.bis.org.in/sf/txd/TXD07(11694)_21072017.pdf.
[29] De Reguardati, S., Lemonnier, A. (2012) La garance des teinturiers. Proposition d’activitésautour des molécules dela garance. Museum national d´histoirenaturelle. In: Eco-designed functionalization of polyester fabric Doctoraldissertation by Tove Agnhage, https://hb.diva-portal.org/smash/get/diva2:1128277/FULLTEXT01.pdf.
[30] Dzoyem, J.P., Melong, R., Tsamo, A. et al. (2017) Cytotoxicity, antioxidant and antibacterial activity of fourcompounds produced by an endophytic fungus Epicoccumnigrum associated with Entadaabyssinica. In: BrazilianJournal of Pharmacognosy, 27, pp. 251–251 East A J (2009).
[31] Lee, J.-H., Kim, Y.-G., Yong Ryo, S. et al. (2016) Calcium-chelating alizarin and other anthraquinones inhibit biofilmformation and the hemolytic activity of Staphylococcus Aureus. In: Scientific Reports, 6(19267), pp. 1–11.
[32] Yen, G.C., Duh, P.D., Chuang, D.Y. (2000) Antioxidant activity of anthraquinones and anthrone. In: Food Chemistry,70, pp. 437–441.
[33] Alihosseini, F. (2016) Plant-based compounds for antimicrobial textiles. In: Sun G (ed) Antimicrobial textiles.Elsevier, Ltd., pp. 155–195.
Authors:
IULIANA DUMITRESCU1, OVIDIU GEORGE IORDACHE1, ELENA-CORNELIA MITRAN1, DANA
STEFANESCU2, ELENA VARZARU1, MARIANA PISLARU2, RODICA CONSTANTINESCU2
1The National Research Development Institute for Textiles and Leather, Bucharest, Romania 2SC Tanex SRL, Bucharest, Romania
Corresponding author:
IULIANA DUMITRESCUe-mail: [email protected]
INTRODUCTION
Firefighter protective clothing is multi-layer garmentwhich secures the firefighter from threats like externalradiant heat flux, chemical spillage, flame and deliv-ers thermal equilibrium to human body [1]. Firefighterprotective clothing comprises of exterior shell, mois-ture barrier and thermal barrier [1–3]. The exteriorshell comprises of those substrates which are devel-oped to have contact with flame and heat withoutdegenerating or burning i.e. they prevent ignitionwhen have direct contact with flame and must haveproperty of water repellence and good thermal insu-lation. Mostly fibers like meta-aramids (Nomex), com-bination of meta-aramid and paramid (Nomex III A),polybenzimidazole (PBI), Zylon and some fibers withflame resistant finishes like Proban and Pyrovatexare utilized in outer layers. The moisture barrier islocated between exterior layer and thermal barrier.
This layer is impermeable to water but permeable towater vapors. Its primary objective is to shield thebody of firefighters from blood pathogens and lique-fied chemicals. Moisture barrier is micrporous mem-brane available in the market as Goretex, Proline,Cross tech, Action, Neo Guard. The thermal barrierprotects human body by blocking the environmentalheat and utilizes flame retardant fibers and theirblends. It can be nonwoven, quilted batting, laminat-ed woven, lining fabric and knitted fabric and spunlaced [3–6]. In terms of protective performance offirefighters, time is the main factor. Enhancement inthermal protection increases the time period for fire-fighter to carry out their activities without any sig-nificant injuries. As a result, firefighters can spendmore time in hazardous environment saving preciouslives and damages caused by fire without injuringthemselves [7–9]. Thermal protective performance is
458industria textila 2018, vol. 69, nr. 6˘
Analysis of thermal properties, water vapor resistance and radiant heattransmission through different combinations of firefighter protective clothing
JAWAD NAEEM ENGIN AKCAGUN
ADNAN MAZARI ANTONIN HAVELKA
ZDENE KUS
REZUMAT – ABSTRACT
Analiza proprietăților termice, rezistența la vapori de apă și transmisia căldurii radiante prin diferitecombinații de îmbrăcăminte de protecție pentru pompieri
Această lucrare experimentală este un efort de a identifica posibilitatea îmbunătățirii performanței de protecție termicăa îmbrăcămintei de protecție pentru pompieri la diferite niveluri de densitate a fluxului de căldură. Îmbunătățireaperformanțelor de protecție termică înseamnă îmbunătățirea timpului de expunere la fluxul de căldură, ceea ce va oferiun timp suplimentar pompierilor pentru a-și îndeplini sarcinile, fără să sufere leziuni grave. Au fost investigate patrucombinații multistrat diferite de îmbrăcăminte de protecție pentru pompieri. Fiecare combinație constă dintr-o carcasăexterioară, barieră împotriva umidității și căptușeală termică. De asemenea, a fost utilizată foaie de aerogel ca înlocuitoral barierei termice. Inițial, s-au investigat proprietăți cum ar fi rezistența termică, conductivitatea termică și rezistența lavapori de apă ale ansamblurilor de țesături multistrat. Ulterior, aceste combinații au fost expuse unor niveluri diferite dedensitate a fluxului de căldură radiantă, de exemplu la 10, 20 și 30 kW/m2 conform standardului ISO 6942. S-a observatcă acele combinații în care pătura de aerogel a fost utilizată ca barieră termică dobândesc o rezistență termică maimare, rezistență la vapori de apă și valori mai reduse ale densității fluxului de căldură transmisă.
Cuvinte-cheie: îmbrăcăminte de protecție pentru pompieri, rezistență termică, performanța de protecție termică,densitatea fluxului de căldură
Analysis of thermal properties, water vapor resistance and radiant heat transmission through differentcombinations of firefighter protective clothing
This experimental work is an effort to seek the possibility of improvement in thermal protective performance of firefighterprotective clothing at different levels of heat flux density. Improvement in thermal protective performance meansenhancement in the time of exposure against the heat flux, which will provide extra time to firefighters to perform theirduties without suffering from severe injuries. Four different multilayer combinations of firefighter protective clothing wereinvestigated. Each combination consists of outer shell, moisture barrier and thermal liner. Aerogel sheet was alsoemployed as a substitute to thermal barrier. Initially, properties like thermal resistance, thermal conductivity, and watervapor resistance of multilayer fabric assemblies were investigated. Later on these combinations were exposed todifferent levels of radiant heat flux density i.e. at 10, 20 and 30 kW/m2 as per ISO 6942 standard. It was noted that thosecombinations in which aerogel blanket was used as thermal barrier acquire greater thermal resistance, water vaporresistance and have less transmitted heat flux density values.
Keywords: firefighter protective clothing, thermal resistance, thermal protective performance, heat flux density
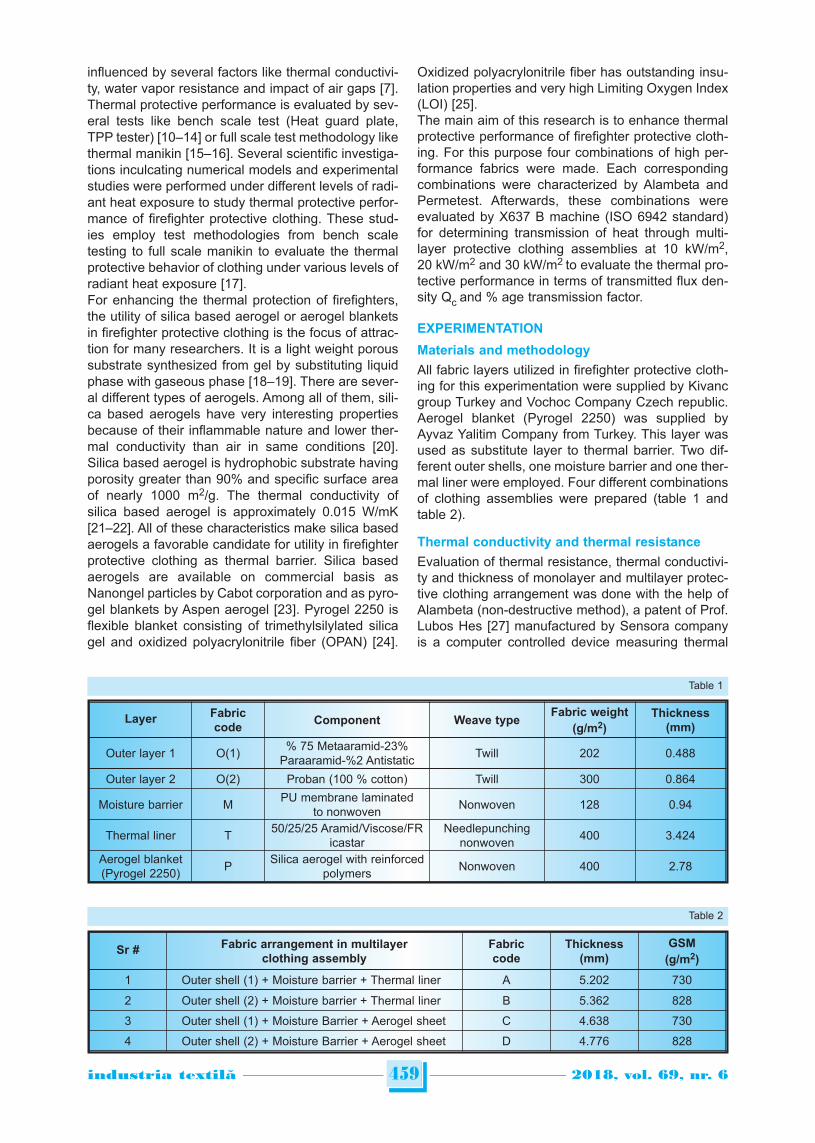
influenced by several factors like thermal conductivi-ty, water vapor resistance and impact of air gaps [7].Thermal protective performance is evaluated by sev-eral tests like bench scale test (Heat guard plate,TPP tester) [10–14] or full scale test methodology likethermal manikin [15–16]. Several scientific investiga-tions inculcating numerical models and experimentalstudies were performed under different levels of radi-ant heat exposure to study thermal protective perfor-mance of firefighter protective clothing. These stud-ies employ test methodologies from bench scaletesting to full scale manikin to evaluate the thermalprotective behavior of clothing under various levels ofradiant heat exposure [17].For enhancing the thermal protection of firefighters,the utility of silica based aerogel or aerogel blanketsin firefighter protective clothing is the focus of attrac-tion for many researchers. It is a light weight poroussubstrate synthesized from gel by substituting liquidphase with gaseous phase [18–19]. There are sever-al different types of aerogels. Among all of them, sili-ca based aerogels have very interesting propertiesbecause of their inflammable nature and lower ther-mal conductivity than air in same conditions [20].Silica based aerogel is hydrophobic substrate havingporosity greater than 90% and specific surface areaof nearly 1000 m2/g. The thermal conductivity ofsilica based aerogel is approximately 0.015 W/mK[21–22]. All of these characteristics make silica basedaerogels a favorable candidate for utility in firefighterprotective clothing as thermal barrier. Silica basedaerogels are available on commercial basis asNanongel particles by Cabot corporation and as pyro-gel blankets by Aspen aerogel [23]. Pyrogel 2250 isflexible blanket consisting of trimethylsilylated silicagel and oxidized polyacrylonitrile fiber (OPAN) [24].
Oxidized polyacrylonitrile fiber has outstanding insu-lation properties and very high Limiting Oxygen Index(LOI) [25]. The main aim of this research is to enhance thermalprotective performance of firefighter protective cloth-ing. For this purpose four combinations of high per-formance fabrics were made. Each correspondingcombinations were characterized by Alambeta andPermetest. Afterwards, these combinations wereevaluated by X637 B machine (ISO 6942 standard)for determining transmission of heat through multi-layer protective clothing assemblies at 10 kW/m2,20 kW/m2 and 30 kW/m2 to evaluate the thermal pro-tective performance in terms of transmitted flux den-sity Qc and % age transmission factor.
EXPERIMENTATION
Materials and methodology
All fabric layers utilized in firefighter protective cloth-ing for this experimentation were supplied by Kivancgroup Turkey and Vochoc Company Czech republic.Aerogel blanket (Pyrogel 2250) was supplied byAyvaz Yalitim Company from Turkey. This layer wasused as substitute layer to thermal barrier. Two dif-ferent outer shells, one moisture barrier and one ther-mal liner were employed. Four different combinationsof clothing assemblies were prepared (table 1 andtable 2).
Thermal conductivity and thermal resistance
Evaluation of thermal resistance, thermal conductivi-ty and thickness of monolayer and multilayer protec-tive clothing arrangement was done with the help ofAlambeta (non-destructive method), a patent of Prof.Lubos Hes [27] manufactured by Sensora companyis a computer controlled device measuring thermal
459industria textila 2018, vol. 69, nr. 6˘
Sr # Fabric arrangement in multilayerclothing assembly
Fabriccode
Thickness(mm)
GSM
(g/m2)
1 Outer shell (1) + Moisture barrier + Thermal liner A 5.202 730
2 Outer shell (2) + Moisture barrier + Thermal liner B 5.362 828
3 Outer shell (1) + Moisture Barrier + Aerogel sheet C 4.638 730
4 Outer shell (2) + Moisture Barrier + Aerogel sheet D 4.776 828
Table 2
Layer Fabriccode
Component Weave typeFabric weight
(g/m2)
Thickness(mm)
Outer layer 1 O(1)% 75 Metaaramid-23%
Paraaramid-%2 AntistaticTwill 202 0.488
Outer layer 2 O(2) Proban (100 % cotton) Twill 300 0.864
Moisture barrier MPU membrane laminated
to nonwovenNonwoven 128 0.94
Thermal liner T50/25/25 Aramid/Viscose/FR
icastarNeedlepunching
nonwoven400 3.424
Aerogel blanket(Pyrogel 2250)
PSilica aerogel with reinforced
polymersNonwoven 400 2.78
Table 1

characteristics of monolayer and multilayer protectivelayers as per EN 31092 standard [26–27]. Five mea-surements were taken for each sample.
Relative water vapor permeability (RWVP %age)and water vapor resistance (Ret)
Water vapor resistance Ret (m2Pa/W) and relativewater vapor permeability (RWVP% age) understeady state conditions was evaluated by PERME-TEST (non-destructive method) which is also patentof Prof. Lubos Hes and was developed by Sensoracompany as per ISO 11092 standard [28]. The high-er the value of relative water vapor permeability, thelesser will be the water vapor resistance and therewill be better thermal comfort [29]. Five measure-ments were taken for each specimen.
The radiant heat testing equipment
The radiant heat testing equipment X637 BProtective clothing was used to measure radiant heattransmission through material or material assemblyaccording to ISO 6942 standard. This equipmentconsists of small curved copper plate calorimeter witharea of (50 mm × 50.3 mm) with mass of 35.9 to36 grams. A radiation heat source consisting of sixcarbide heating rods along with moveable test framehaving cooling device and specimen holders isshown in figure 1. The size of the sample was 230mm × 80 mm which is placed on the face side ofcalorimeter and subjected to a specific level of radi-ant heat and time for temperature escalation of 12°Cand 24°C (RHTI12 and RHTI24) in the calorimeterwas noted and outcomes are articulated as radiantheat transmission index and the % age heat trans-mission factor [30]. Five specimens are required fortesting at each level of heat flux density.
RESULTS AND DISCUSSION
Evaluation of thermal conductivity and thermalresistance
Thermal conductivity, thermal resistance and thick-ness were evaluated by Alambeta for monolayer andmultilayer protective fabric assemblies and their cor-responding values were mentioned in figure 2 respec-tively. Thermal resistance, Rth, of textile substrate is
a function of the actual thickness of the textile fabricand its thermal conductivity. This relationship is givenby following equation:
hRth = (1)l
Rth is thermal resistance (m2K/W), h – thickness oftextile substrate. This thermal resistance is inverselyproportional to thermal conductivity. Thermal conduc-tivity and thermal resistance are not only contingenton thickness of the fabric assemblies and but also onphysical and chemical properties of textile substrate.Greater the thickness, greater will be the thermalresistance of the material. However, this is not onlythe whole scenario, the porosity and density of thetextile substrate also plays a vital role in thermalbehavior of the medium. Textile substrate with closedand small pores is able to trap air inside the sub-strate. The illustration of this phenomenon is the dueto fact that air has a lower thermal conductivity thanmaterials constituting the sample [31]. On the otherhand, thermal conductivity enhances with the relativehumidity absorbed by the material [32]. Consequently,the thermal conductivity of highly hygroscopic mate-rial is more as compared to less hygroscopic sub-strate. From figure 2, it can be noted that a high valueof thermal resistance was witnessed in arrangementof multilayer protective clothing having aerogel layeras an alternate to thermal liner (sample C and D).There might be several reasons. One reason mightbe that this substitute layer encloses silica basedaerogel which has very less thermal conductivity evenlower than still air. Because of porosity and nanome-ter pore size, silica based aerogels are highly insu-lating materials [30].
By means of mass, Aerogel is 96% of air making itleast dense man-made substrate [30]. Because ofgaseous structure of aerogel and low thermal con-ductivity of gas, there might be blockage of conduc-tive heat transfer [34]. The porous architecture ofaerogel is responsible for gaseous structure of aero-gel [35–36]. In addition to that, convective heat trans-fer is deterred because construction of aerogel doesnot allow circulation of air [34]. The other reason isthat this aerogel blanket also contains oxidized poly-acrylonitrile (OPAN) fiber which has very low thermalconductivity (0.030 W/mK) and very high limiting
460industria textila 2018, vol. 69, nr. 6˘
Fig. 2. Thermal conductivity and thermal resistance val-ues of multilayer protective clothing
Fig. 1. Radiation heat testing equipment
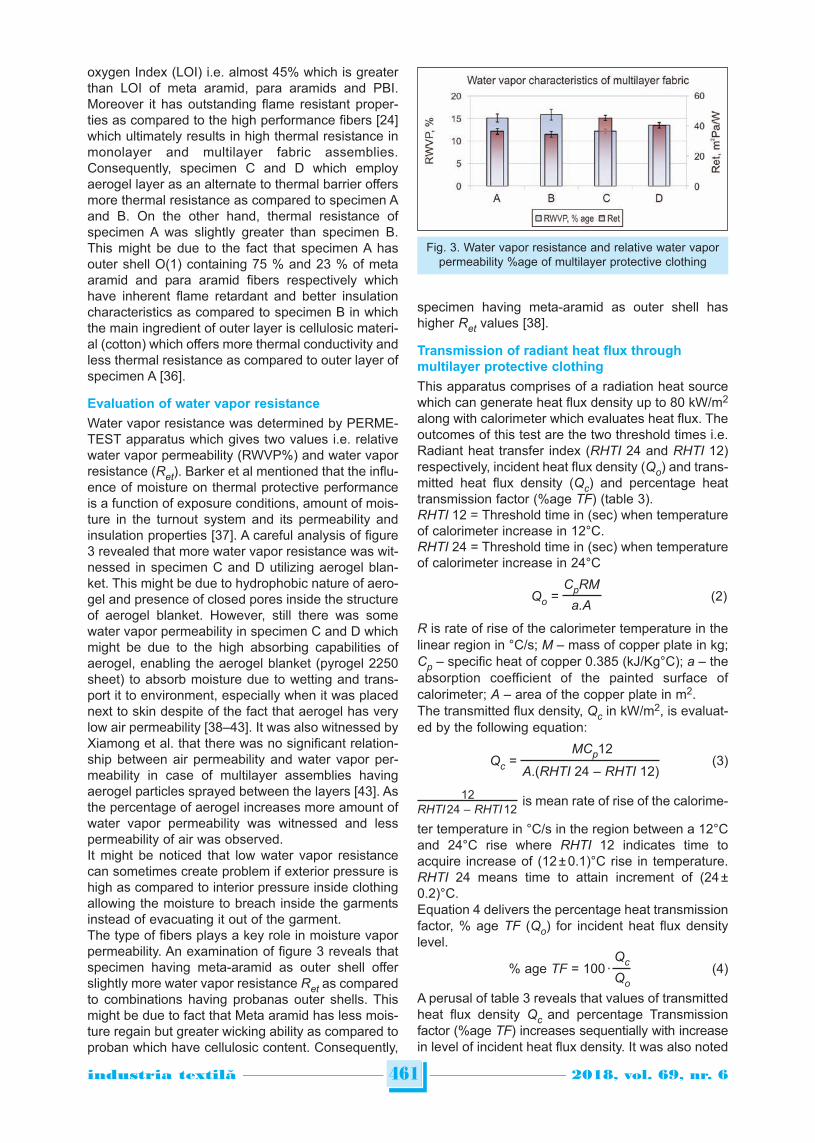
oxygen Index (LOI) i.e. almost 45% which is greaterthan LOI of meta aramid, para aramids and PBI.Moreover it has outstanding flame resistant proper-ties as compared to the high performance fibers [24]which ultimately results in high thermal resistance inmonolayer and multilayer fabric assemblies.Consequently, specimen C and D which employaerogel layer as an alternate to thermal barrier offersmore thermal resistance as compared to specimen Aand B. On the other hand, thermal resistance ofspecimen A was slightly greater than specimen B.This might be due to the fact that specimen A hasouter shell O(1) containing 75 % and 23 % of metaaramid and para aramid fibers respectively whichhave inherent flame retardant and better insulationcharacteristics as compared to specimen B in whichthe main ingredient of outer layer is cellulosic materi-al (cotton) which offers more thermal conductivity andless thermal resistance as compared to outer layer ofspecimen A [36].
Evaluation of water vapor resistance
Water vapor resistance was determined by PERME-TEST apparatus which gives two values i.e. relativewater vapor permeability (RWVP%) and water vaporresistance (Ret). Barker et al mentioned that the influ-ence of moisture on thermal protective performanceis a function of exposure conditions, amount of mois-ture in the turnout system and its permeability andinsulation properties [37]. A careful analysis of figure3 revealed that more water vapor resistance was wit-nessed in specimen C and D utilizing aerogel blan-ket. This might be due to hydrophobic nature of aero-gel and presence of closed pores inside the structureof aerogel blanket. However, still there was somewater vapor permeability in specimen C and D whichmight be due to the high absorbing capabilities ofaerogel, enabling the aerogel blanket (pyrogel 2250sheet) to absorb moisture due to wetting and trans-port it to environment, especially when it was placednext to skin despite of the fact that aerogel has verylow air permeability [38–43]. It was also witnessed byXiamong et al. that there was no significant relation-ship between air permeability and water vapor per-meability in case of multilayer assemblies havingaerogel particles sprayed between the layers [43]. Asthe percentage of aerogel increases more amount ofwater vapor permeability was witnessed and lesspermeability of air was observed. It might be noticed that low water vapor resistancecan sometimes create problem if exterior pressure ishigh as compared to interior pressure inside clothingallowing the moisture to breach inside the garmentsinstead of evacuating it out of the garment.The type of fibers plays a key role in moisture vaporpermeability. An examination of figure 3 reveals thatspecimen having meta-aramid as outer shell offerslightly more water vapor resistance Ret as comparedto combinations having probanas outer shells. Thismight be due to fact that Meta aramid has less mois-ture regain but greater wicking ability as compared toproban which have cellulosic content. Consequently,
specimen having meta-aramid as outer shell hashigher Ret values [38].
Transmission of radiant heat flux throughmultilayer protective clothing
This apparatus comprises of a radiation heat sourcewhich can generate heat flux density up to 80 kW/m2
along with calorimeter which evaluates heat flux. Theoutcomes of this test are the two threshold times i.e.Radiant heat transfer index (RHTI 24 and RHTI 12)respectively, incident heat flux density (Qo) and trans-mitted heat flux density (Qc) and percentage heattransmission factor (%age TF) (table 3).RHTI 12 = Threshold time in (sec) when temperatureof calorimeter increase in 12°C.RHTI 24 = Threshold time in (sec) when temperatureof calorimeter increase in 24°C
CpRMQo = (2)
a.A
R is rate of rise of the calorimeter temperature in thelinear region in °C/s; M – mass of copper plate in kg;Cp – specific heat of copper 0.385 (kJ/Kg°C); a – theabsorption coefficient of the painted surface ofcalorime ter; A – area of the copper plate in m2.The transmitted flux density, Qc in kW/m2, is evaluat-ed by the following equation:
MCp12Qc = (3)
A.(RHTI 24 – RHTI 12)
12 is mean rate of rise of the calorime-RHTI 24 – RHTI12
ter temperature in °C/s in the region between a 12°Cand 24°C rise where RHTI 12 indicates time toacquire increase of (12 ± 0.1)°C rise in temperature.RHTI 24 means time to attain increment of (24 ±0.2)°C.Equation 4 delivers the percentage heat transmissionfactor, % age TF (Qo) for incident heat flux densitylevel.
Qc% age TF = 100 ∙ (4)
Qo
A perusal of table 3 reveals that values of transmittedheat flux density Qc and percentage Transmissionfactor (%age TF) increases sequentially with increasein level of incident heat flux density. It was also noted
461industria textila 2018, vol. 69, nr. 6˘
Fig. 3. Water vapor resistance and relative water vaporpermeability %age of multilayer protective clothing

that minimum values of transmitted flux density Qc(kW/m2) were observed for the samples having aero-gel blanket as thermal liner. A similar pattern was alsonoted in %age TF values for the specimen havingaerogel sheet [41]. This might be due to fact that sili-ca based aerogel blanket contains almost 96% of airand air is a good insulator blocking the amount ofheat passed through the specimen. Moreover, theseaerogel samples consist of oxidized polyacrylonitrilepolymer which have very good thermal stability andcan withstand higher amount of heat flux and hasvery high limiting oxygen index (LOI) of almost 45 %[40]. The lower the value of transmitted heat flux den-sity, the lesser will be amount of heat passed throughfabric assemblies towards calorimeter allowing moretime to firefighter to perform their duties before acquir-ing burn injuries. Table 3 also depicts that greater dif-ference between RHTI 24 and RHTI 12, lesser will bethe value of transmitted flux density Qc (kW/m2) and%age TF respectively, which indicates that specimencan withstand respected heat flux for longer timeperiod allowing firefighters to perform their duties forlonger duration before getting burn injuries. At10 kW/m2, the lowest values of Qc and %age TF werewitnessed for specimen C, D. These values were high-er for specimen A and B having no aerogel blanket. Itwas also noted that there was minor difference in thevalues of Qc and %age TF values for aerogel sheet,sample A and specimen B respectively. At 20 kW/m2,the situation was slightly different i.e. the Qc and%age TF values of specimen B is significantly higherthan rest of the samples and negligible difference forthe values of Qc and %age TF was witnessed for
aerogel sheet, specimen A and specimen D. Thelowest value of %age TF and Qc for 20 kW/m2 wasobserved for specimen C. At 30 kW/m2, a trend sim-ilar to that of 20 kW/m2 was noted i.e. the least valueof Qc and %age TF was observed for sample C andhighest value was observed sample B. However, thistime there was significant difference in values Qc and% age TF for specimen A and aerogel sheet.A glance at figure 4 reveals that at 10 kW/m2 thecurve of specimen D and specimen C are much flat-ter as compared to the curves of specimen B, speci-men A and aerogel layer (P) respectively. The flatterthe curve, the slower will be rate of increase in tem-perature, which will give more time of exposure tospecimen when subjected to radiant heat flux. Theflatter curve also indicates less damage to the corre-sponding fabric layers of the specimen. However,there were no gaps in the curves of aerogel blanketand specimen A, which have very close values of Qc
462industria textila 2018, vol. 69, nr. 6˘
Sr # Name ofmaterial
*Qo
(kW/m2)RHTI12 RHTI24 RHTI24 – RHTI12 Qc (kW/m2) %age TF
1 P 10 54.55 ± 2.828 102.6 ± 2.969 48.05 1.36 ± 0.006 0.136
2 A 10 58.2 ± 0.424 101.0 ±, 0.015 42.8 1.55 ± 0.014 0.155
3 B 10 74.1 ±.707 128.65 ± 2.757 54.55 1.212 ± 0.045 0.121
4 C 10 84.55 ± 0.777 163.35 ± 3.181 78.8 0.839 ± 0.026 0.083
5 D 10 97.4 ± 6.929 195 ± 2.5738 97.6 0.677 ± 0.132 0.067
1 P 20 33.25 ± 5.727 54.15 ± 8.273 20.9 3.164 ± 0.390 0.158
2 A 20 36.7 ± 0.989 57.05 ± 1.343 20.35 3.249 ± 0.056 0.162
3 B 20 46.7 ± 6.081 58.55 ± 6.293 11.85 5.580 ± 0.100 0.279
4 C 20 44.6 ± 0.457 70.8 ± 2.596 26.2 2.524 ± 0.050 0.126
5 D 20 58.15 ± 0.919 79.956 ± 1.484 21.806 3.033 ± 0.079 0.151
1 P 30 33.3 ± 0.141 48.75 ± 0.353 15.45 4.280 ± 0.058 0.142
2 A 30 27.85 ± 0.070 40.35 ± 0.494 12.5 5.290 ± 0.181 0.176
3 B 30 31.4 ± 2.121 38.15 ± 2.474 6.75 9.79 ± 0.516 0.326
4 C 30 41.5 ± 1.272 61 ± 2.969 19.5 3.391 ± 0.297 0.113
5 D 30 44.15 ± 1.626 59.8 ± 1.272 15.65 4.225 ± 0.096 0.140
Table 3
* RHTI = Radiant heat transfer index.
Fig. 4. Heat transmission at 10 kW/m2
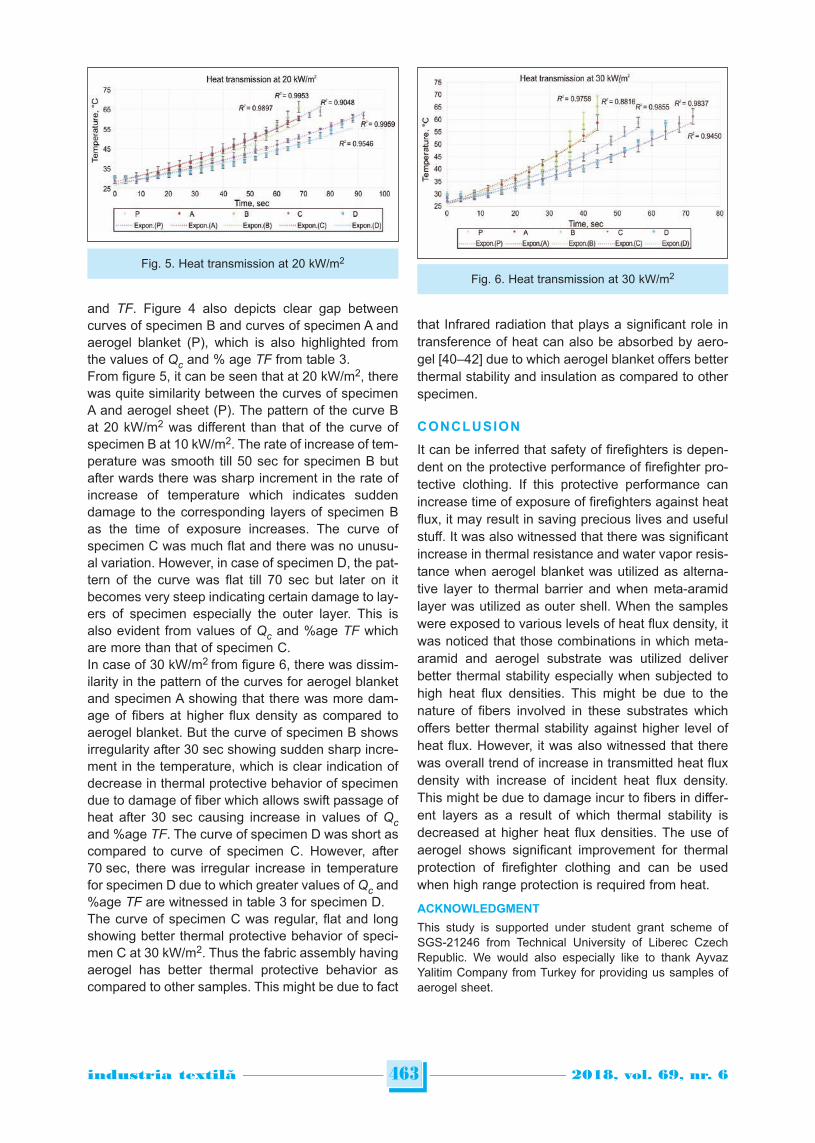
and TF. Figure 4 also depicts clear gap betweencurves of specimen B and curves of specimen A andaerogel blanket (P), which is also highlighted fromthe values of Qc and % age TF from table 3.From figure 5, it can be seen that at 20 kW/m2, therewas quite similarity between the curves of specimenA and aerogel sheet (P). The pattern of the curve Bat 20 kW/m2 was different than that of the curve ofspecimen B at 10 kW/m2. The rate of increase of tem-perature was smooth till 50 sec for specimen B butafter wards there was sharp increment in the rate ofincrease of temperature which indicates suddendamage to the corresponding layers of specimen Bas the time of exposure increases. The curve ofspecimen C was much flat and there was no unusu-al variation. However, in case of specimen D, the pat-tern of the curve was flat till 70 sec but later on itbecomes very steep indicating certain damage to lay-ers of specimen especially the outer layer. This isalso evident from values of Qc and %age TF whichare more than that of specimen C.In case of 30 kW/m2 from figure 6, there was dissim-ilarity in the pattern of the curves for aerogel blanketand specimen A showing that there was more dam-age of fibers at higher flux density as compared toaerogel blanket. But the curve of specimen B showsirregularity after 30 sec showing sudden sharp incre-ment in the temperature, which is clear indication ofdecrease in thermal protective behavior of specimendue to damage of fiber which allows swift passage ofheat after 30 sec causing increase in values of Qcand %age TF. The curve of specimen D was short ascompared to curve of specimen C. However, after70 sec, there was irregular increase in temperaturefor specimen D due to which greater values of Qc and%age TF are witnessed in table 3 for specimen D.The curve of specimen C was regular, flat and longshowing better thermal protective behavior of speci-men C at 30 kW/m2. Thus the fabric assembly havingaerogel has better thermal protective behavior ascompared to other samples. This might be due to fact
that Infrared radiation that plays a significant role intransference of heat can also be absorbed by aero-gel [40–42] due to which aerogel blanket offers betterthermal stability and insulation as compared to otherspecimen.
CONCLUSION
It can be inferred that safety of firefighters is depen-dent on the protective performance of firefighter pro-tective clothing. If this protective performance canincrease time of exposure of firefighters against heatflux, it may result in saving precious lives and usefulstuff. It was also witnessed that there was significantincrease in thermal resistance and water vapor resis-tance when aerogel blanket was utilized as alterna-tive layer to thermal barrier and when meta-aramidlayer was utilized as outer shell. When the sampleswere exposed to various levels of heat flux density, itwas noticed that those combinations in which meta-aramid and aerogel substrate was utilized deliverbetter thermal stability especially when subjected tohigh heat flux densities. This might be due to thenature of fibers involved in these substrates whichoffers better thermal stability against higher level ofheat flux. However, it was also witnessed that therewas overall trend of increase in transmitted heat fluxdensity with increase of incident heat flux density.This might be due to damage incur to fibers in differ-ent layers as a result of which thermal stability isdecreased at higher heat flux densities. The use ofaerogel shows significant improvement for thermalprotection of firefighter clothing and can be usedwhen high range protection is required from heat.
ACKNOWLEDGMENT
This study is supported under student grant scheme ofSGS-21246 from Technical University of Liberec CzechRepublic. We would also especially like to thank AyvazYalitim Company from Turkey for providing us samples ofaerogel sheet.
463industria textila 2018, vol. 69, nr. 6˘
Fig. 5. Heat transmission at 20 kW/m2
Fig. 6. Heat transmission at 30 kW/m2

464industria textila 2018, vol. 69, nr. 6˘
BIBLIOGRAPHY
[1] Lawson, J.R. Fire fighters protective clothing and thermal environments of structural fire-fighting. In: ASTM SpecTech Publ, 1997, vol. 1273, pp. 334–335.
[2] Rajkishore, N., Shadi, H., Padhye, P. Recent trends and future scope in protection and comfort of fire-fighter’spersonal protective clothing. In: Fire Science Reviews, 2014, vol. 3, p. 4.
[3] Lu, J., Kyounga, H., Keejong, Y., Effect of aerogel on thermal protective performance of firefighter clothing. In:Journal of Fiber Bioengineering and Informatics, 2013, vol. 6, pp. 315–324.
[4] Song, G., Paskaluk, S., Sati, R. Thermal protective performance of protective clothingused for low radiant heatprotection. In: Text Res J, 2011, vol. 81, pp. 311–323.
[5] Kinen, H.M. Firefighter’s protective clothing. In: Scott R.A. (ed.) Textiles for protection, 2005, Woodhead Cambridge,UK, pp. 622–647.
[6] Tolera, A.N., Master thesis, Department of Textile Engineering, Istanbul Technical University, 2015.
[7] Holcombe B.V. The heat related properties of fire fighters protective clothing fabrics. In: Fire Safety Journal, 1983,vol. 6, pp. 129–141.
[8] NFPA, Protective clothing ensemble for structural fire fighting, In: National Fire Protection Association, 1997,Quincy, MA.
[9] Schacher, D.A., Drean, C.Y. Comparison between thermal insulation and thermal properties of classical andmicrofibres polyester fabrics. In: International Journal of Clothing Science and Technology, 2000, vol. 12(2), pp.84–95.
[10] Salmon, D. Thermal conductivity of insulations using guarded hot plates, including recent developments andsources of reference materials. In: Measurement Science and Technology, 2001, vol. 12, pp. 1–89.
[11] Huang, J.H. Thermal parameters for assessing thermal properties of clothing. In: Journal of Thermal Biology, 2006,vol. 31, pp. 461–466.
[12] ISO 11092, Textiles – Physiological Effects – Measurement of Thermal and Water Vapour Resistance UnderSteady-State Conditions (Sweating Guarded Hotplate Test). In: International Organization for Standardization,1993, Geneva.
[13] ASTM 1868, Standard Test Method for Thermal and Evaporative Resistance of Clothing Materials Using a SweatingHot Plate. In: American Society for Testing and Materials, 2005, West Conshohocken, PA.
[14] Chen, Y.S., Fan, J.T., Zhang, W. Clothing thermal insulation during sweating. In: Textile Research Journal, 2003,vol. 73, pp. 152–157.
[15] Celcar, D., Meinander, H., Jelka, G. Heat and moisture transmission properties of clothing systems evaluated byusing a sweating thermal manikin under different environmental conditions. In: International Journal of ClothingScience and Technology, 2008, vol. 20, pp. 240–252.
[16] Lee, J., Ko, E., Lee, H., Kim, J., Choi, J. Validation of clothing insulation estimated by global and serial methods.In: International Journal of Clothing Science and Technology, 2011, vol. 23, pp. 184–198.
[17] ISO 6942, Protective clothing – Protection against heat and fire – evaluation of materials and material assemblieswhen exposed to a source of radiant heat, 2002.
[18] Thapliyaland, P.C., Singh, K. Aerogels as promising thermal insulating materials: An overview. In: Journal ofMaterial, 2014, vol. 10, pp. 1–10.
[19] Pierre, A.C. and Rigacci, A. SiO2 Aerogels, In: Aegerter M.A., Leventis N., Koebel M.M. (eds) Aerogels handbook.
New York: Springer, 2011, pp. 21-45.
[20] Bheekhun, N., Abu Talib, A.R., Hassan, M.R. Aerogels in aerospace: An overview. In: Ad MaterSciEng, 2013, vol.2013, pp. 1–18.
[21] Mulder, C., Lierop, J.V. Preparation, densification and characterization of autoclavedried SiO2 gels, In: Fircke J.
(ed.) Aerogels, 1986, New York: Springer, pp. 68–75.
[22] Pierre, A.C., Pajonk, G.M. Chemistry of aerogels and their applications. In: Chem Rev, 2002, vol. 102,pp. 4243–4265.
[23] Hrubesh, L.W. Aerogel applications. In: J Non-cryst Solids, 1998, vol. 225, pp. 335–342.
[24] Aspen aerogels, Safety data sheet, pyrogel 2250, 2008.
[25] Handermann, Z., Zoltek Corporation, oxidized polyacrylonitrile fiber properties, products and applications, In: Zoltekwhitepaper, 2014.
[26] Matusiak, M. Thermal Insulation Properties of Single and Multilayer. In: Textiles Fibres & Textiles in Eastern Europe,2006, vol. 14, pp. 98–112.
[27] Matusiak, M., Sikorski, K. Influence of structure of woven fabrics on their thermal insulation properties. In: Fibres &Textiles in Eastern Europe, 2011, vol. 19, p. 5.
[28] Hes, L., Araujo, M. Effect of mutual bonding of textile layers on thermal insulation and thermal contact properties offabric assemblies. In: Textile Research Journal, 1996, vol. 66, p. 245.
[29] Matusiak, M., Kowalczyk, S. Thermal-insulation properties of multilayer textile packages. In: AUTEX ResearchJournal, 2014, vol. 14.

465industria textila 2018, vol. 69, nr. 6˘
[30] Bogusławska-bączek, M., Hes, L. Effective water vapour permeability of wet wool fabric and blended fabrics. In:Fibres & Textiles in Eastern Europe, 2013, vol. 1, pp. 67–71.
[31] Oğlakcioğlu, N., Marmarali, A. Thermal comfort properties of some knitted structures. In: Fibres & Textiles in EasternEurope, 2007, vol. 15(5-6), pp. 64–65.
[32] Hes, L., Loghin, C. Heat, moisture and air transfer properties of selected woven fabrics in wet state. In: Journal ofFiber Bioengineering and Informatics, 2009, vol. 2(3), pp. 141–149.
[33] Venkataraman, M., Mishra, R., Kotresh, T.M., Sakoi, T., Militky, J. Effect of compressibility on heat transportphenomena in aerogel-treated nonwoven fabrics. In: The Journal of Textile Institute, 2015, vol. 107, pp. 1150–1158.
[34] Meb, G.W., Gmb, H.P. Combustion behavior Test equipment, In: Keplerstraße Berlin, 2002.
[35] XU, B. An improved method for preparing monolithic aerogels based on methyltrimethoxysilane at ambient pressurePart I: Process development and macrostructures of the aerogels. In: Microporous and Mesoporous Materials,2012, vol. 148(1), pp. 145–151.
[36] http://www.dupont.com/products-and-services/electronic-electrical-materials/electrical-insulation/brands/nomex-electrical-insulation/articles/nomex-410.html, Assessed on: 30-07-2017
[37] Barker, R.L., Heniford, R.C. Factors affecting the thermal insulation and abrasion resistance of heat resistant hydro-entangled nonwoven batting materials for use in firefighter turnout suit thermal liner systems. In: J Eng Fibers Fabr,2011, vol. 6, pp. 1–10.
[38] Baetens, R., Jelle, B.P., Gustavsen, A. Aerogel insulation for building applications: a state-of-the-art review, In:Energy and Buildings, 2011, 43(4), pp. 761–769.
[39] Shahid, A., Furgusson, M., Wang, L. Thermophysiological comfort analysis ofaerogel nanoparticle incorporatedfabric for fire fighter’s protective clothing. In: Chemicals and Materials Engineering, 2014, vol. 2, p. 4.
[40] Fricke, J. The pore structure determination of Aerogels. In: Springer-Verlag 1998, vol. 4, pp. 187–195.
[41] Lee, D. Thermal characterization of carbon-opacified silica aerogels. In: Journal of Non-Crystalline Solids, 1995, vol.186, pp. 285–290.
[42] Fricke, J. Thermal properties of silica aerogels. In: Le Journal de Physique Colloques, 1989, vol. 50, p. 4.
[43] Xiong, X., Yang, T., Mishra, R., Militky, J. Transport properties of aerogel-based nanofibrous nonwoven fabrics. In:Fibers and Polymer, 2016, vol. 17, no. 10, pp. 1709–1714.
Authors:
JAWAD NAEEM1, ADNAN MAZARI1, ENGIN AKCAGUN2, ANTONIN HAVELKA1, ZDENEK KUS1
1Technical University of Liberec, Faculty of Textile Engineering, Department of Clothing,Studentska 2, Husova, 1402/2, Liberec, Czech Republic
e-mail: [email protected], [email protected],[email protected], [email protected]
2Mimar Sinan Fine Arts University, Istanbul, Turkey
e-mail: [email protected]
Corresponding author:
JAWAD NAEEM
e-mail: [email protected]
INTRODUCTION
Pilling is defined as the entangling of fibers duringwashing, dry cleaning, testing, or wear to form ballsor pills that stand proud of the surface of a fabric [1].To examine pilling, the fabrics are treated to form typ-ical pills by tumbling, brushing, or rubbing specimenswith abrasive materials in a machine and then com-paring the processed fabrics with visual standards todetermine the degree of pilling on a scale rangingfrom 1 (very severe pilling) to 5 (no pilling) [2]. Suchevaluations are mainly dependent on expertsinvolved and therefore low-efficient and subject.Testing pilling performance of the fabric has been aproblem for a long time. Since image analysis wasintroduced into fabric-testing industry, pilling evalua-tion has been made a great improvement. Previousvaluable works have made lots of efforts to extract
pills on the fabric surface [3]. Many researchers havetried to separate the pills from the background byimage threshold [4]. Some researchers performedFast Fourier Transform (FFT) and wavelet transform[5] to the pilled fabric image with a regular pattern.However, these works encounter with the interfer-ence from fabric color and pattern. Laser 3D scannercan acquire the depth information of fabrics to avoidthe interference. Due to the high cost and low effi-ciency of this kind of scanning system, researchersbelieve that a video camera, together with an effec-tive algorithm to identify pills is still of great researchand practical value.In this paper, we attempt to introduce the concept ofdepth from focus (DFF) to reconstruct a depth imagefor pilling analysis. In 1990, E. Ens put forward theconcept of depth from focus [6]. Due to the limited
466industria textila 2018, vol. 69, nr. 6˘
A novel approach for identification of pills based on the methodof Depth from Focus
LING JIE YU JIN FENG ZHOU
RONG WU WANG
REZUMAT – ABSTRACT
O abordare nouă pentru identificarea pilingului pe baza metodei Depth From Focus (adâncime de focalizare)
Pentru evaluarea automată a pilingului materialelor textile, informațiile despre adâncimea de focalizare reprezintă unadintre caracteristicile cele mai importante și mai eficiente în extragerea pilingului din imaginea țesăturii. Tehnicile descanare cu laser sunt adesea folosite pentru a obține imagini 3D cu adâncime de focalizare. Cu toate acestea, din cauzacostului ridicat și eficienței scăzute a sistemului de scanare cu laser, cercetatorii au descoperit că tehnica nu esteadecvată pentru analiza țesăturilor. Acest studiu prezintă o nouă abordare pentru obținerea imaginii cu adâncime defocalizare folosită pentru a extrage pilingul prin introducerea metodei Depth From Focus (DF). Această abordarecaptează, în primul rând, o secvență de imagini cu aceeași viziune la diferite poziții de focalizare la microscopul opticautomat. Poziția cu cea mai bună focalizare (z) a fiecărui pixel (x, y) a fost determinată prin alegerea stratului de imaginecare arată claritatea maximă și s-a format imaginea cu adâncime de focalizare. Acest studiu propune un nou criteriu deevaluare a clarității, care se bazează pe variația gradienților. Ulterior, câteva puncte de bază care indică suprafața defundal au fost selectate din imaginea cu adâncime de focalizare, iar coordonatele de adâncime (x, y, z) în aceste punctede bază au fost utilizate pentru a calcula un plan de fundal preconizat. Prin intermediul planului de fundal, a fost extraspilingul deasupra fundalului. O probă de țesătură cu o singură fibră a fost prezentată pentru a ilustra procesul șirezultatul abordării.
Cuvinte-cheie: adâncime de focalizare, detectarea pilingului, evaluarea clarității imaginii
A novel approach for identification of pills based on the method of Depth From Focus
For automatic pilling evaluation of textiles, the depth information is one of the most critical and effective features inextracting pills from fabric image. Laser-scanning techniques are often used for acquiring 3D depth images. However,due to the high-cost and low-efficiency of Laser-scanning system, researchers have found it unsuitable for fabricanalysis. This paper illustrates a new approach for acquiring the depth image used to extract pills by introducing themethod of Depth From Focus (DFF). This approach firstly captures a sequence of images of the same view at differentfocal positions under the automatic optical microscope. Then the best-focused position (z) of each pixel (x, y) wasdetermined by choosing the layer of image declaring the max sharpness and formed the depth image. This paperproposed a new sharpness-evaluation criterion which was based on the variance of gradients. Afterwards, a few basicpoints indicating the background area was selected from the depth image, and then the depth coordinates (x, y, z) atthese basic points were used to calculate a predicted background plane. Via the background plane, pills above thebackground were extracted. A fabric sample with a single fiber upon it was presented to illustrate the process and resultof the approach.
Keywords: Depth from Focus, pill detection, sharpness evaluation
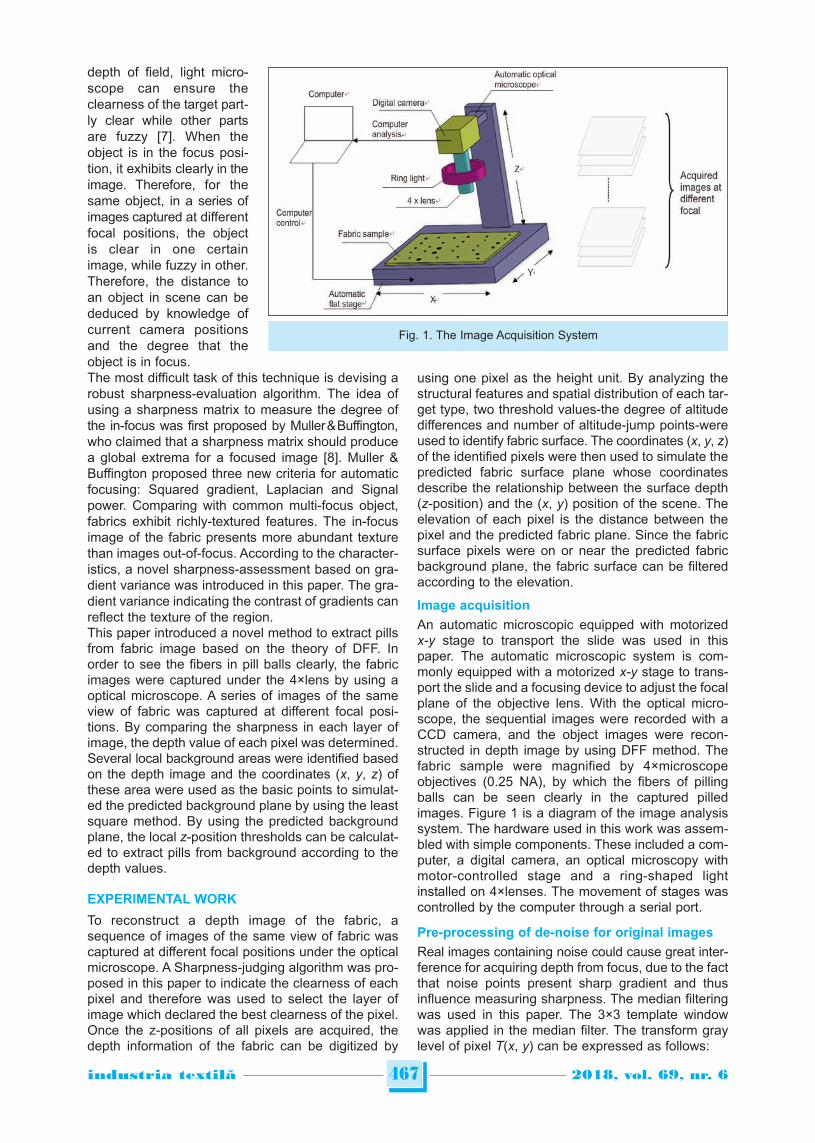
depth of field, light micro-scope can ensure theclearness of the target part-ly clear while other partsare fuzzy [7]. When theobject is in the focus posi-tion, it exhibits clearly in theimage. Therefore, for thesame object, in a series ofimages captured at differentfocal positions, the objectis clear in one certainimage, while fuzzy in other.Therefore, the distance toan object in scene can bededuced by knowledge ofcurrent camera positionsand the degree that theobject is in focus. The most difficult task of this technique is devising arobust sharpness-evaluation algorithm. The idea ofusing a sharpness matrix to measure the degree ofthe in-focus was first proposed by Muller & Buffington,who claimed that a sharpness matrix should producea global extrema for a focused image [8]. Muller &Buffington proposed three new criteria for automaticfocusing: Squared gradient, Laplacian and Signalpower. Comparing with common multi-focus object,fabrics exhibit richly-textured features. The in-focusimage of the fabric presents more abundant texturethan images out-of-focus. According to the character-istics, a novel sharpness-assessment based on gra-dient variance was introduced in this paper. The gra-dient variance indicating the contrast of gradients canreflect the texture of the region.This paper introduced a novel method to extract pillsfrom fabric image based on the theory of DFF. Inorder to see the fibers in pill balls clearly, the fabricimages were captured under the 4×lens by using aoptical microscope. A series of images of the sameview of fabric was captured at different focal posi-tions. By comparing the sharpness in each layer ofimage, the depth value of each pixel was determined.Several local background areas were identified basedon the depth image and the coordinates (x, y, z) ofthese area were used as the basic points to simulat-ed the predicted background plane by using the leastsquare method. By using the predicted backgroundplane, the local z-position thresholds can be calculat-ed to extract pills from background according to thedepth values.
EXPERIMENTAL WORK
To reconstruct a depth image of the fabric, asequence of images of the same view of fabric wascaptured at different focal positions under the opticalmicroscope. A Sharpness-judging algorithm was pro-posed in this paper to indicate the clearness of eachpixel and therefore was used to select the layer ofimage which declared the best clearness of the pixel.Once the z-positions of all pixels are acquired, thedepth information of the fabric can be digitized by
using one pixel as the height unit. By analyzing thestructural features and spatial distribution of each tar-get type, two threshold values-the degree of altitudedifferences and number of altitude-jump points-wereused to identify fabric surface. The coordinates (x, y, z)of the identified pixels were then used to simulate thepredicted fabric surface plane whose coordinatesdescribe the relationship between the surface depth(z-position) and the (x, y) position of the scene. Theelevation of each pixel is the distance between thepixel and the predicted fabric plane. Since the fabricsurface pixels were on or near the predicted fabricbackground plane, the fabric surface can be filteredaccording to the elevation.
Image acquisition
An automatic microscopic equipped with motorizedx-y stage to transport the slide was used in thispaper. The automatic microscopic system is com-monly equipped with a motorized x-y stage to trans-port the slide and a focusing device to adjust the focalplane of the objective lens. With the optical micro-scope, the sequential images were recorded with aCCD camera, and the object images were recon-structed in depth image by using DFF method. Thefabric sample were magnified by 4×microscopeobjectives (0.25 NA), by which the fibers of pillingballs can be seen clearly in the captured pilledimages. Figure 1 is a diagram of the image analysissystem. The hardware used in this work was assem-bled with simple components. These included a com-puter, a digital camera, an optical microscopy withmotor-controlled stage and a ring-shaped lightinstalled on 4×lenses. The movement of stages wascontrolled by the computer through a serial port.
Pre-processing of de-noise for original images
Real images containing noise could cause great inter-ference for acquiring depth from focus, due to the factthat noise points present sharp gradient and thusinfluence measuring sharpness. The median filteringwas used in this paper. The 3×3 template windowwas applied in the median filter. The transform graylevel of pixel T(x, y) can be expressed as follows:
467industria textila 2018, vol. 69, nr. 6˘
Fig. 1. The Image Acquisition System

G(x–1, y–1), G(x, y–1), G(x+1, y–1),
T(x, y) = median G(x–1, y), G(x, y), G(x+1, y),
G(x–1, y+1), G(x, y+1), G(x+1, y+1)
(1)
where G(x, y) refers to the gray value of pixel (x, y).The contrast of depth images when median filteringalgorithm was processed (figure 2, b) and not pro-cessed (figure 2, a).
Sharpness-judging algorithm
Many reaches have been studies several section-judging functions. Theses judge algorithms are basedon the indicators such as Variance, max frequencyand LBP-transformation. However, these algorithmsdid not work out well in our studies for pills fabricswhich exhibit multi-textured and multi-focus phe-nomenon. When humans observe a texture image, theborders which exhibits high gradient evoke their inter-ests first. The gradients are high on the border of twotargets and low in the body of one target. Therefore,the gradients are fluctuant when the image is in-focus. For the de-focused image or the de-focusedarea of an image, the border between two targets isnot conspicuous; resulting in the gradients varies lit-tle among the image or the area. In this paper, a 7×7 sharpness matrix centered withthe pixel whose sharpness was to be measured wasused to assess the clearness of a certain pixel.Based on the theory above, the sharpness of thematrix was expressed by the variance of the gradientin the area. The algorithm was realized by following steps: The first step was to record the gradient of each pixelin the matrix. The gradient was defined as Eq.5.Assuming Pi (x, y) refers to the pixel in i-th layer ofimages at the pixel coordinate (x, y), and Si (x, y) isthe gradient of Pi (x, y), the following three-dimen-sional Gradient Matrix (GM) recorded the gradient ofeach pixel in the Pi (x, y)-centered region.
GMi (m,n) = arg Si (m,n) (2)
The second step was to calculate the sharpness ofthe matrix. Assuming Ci (x, y), (i =1, 2,…, 41) is theclearness of the P(x, y)-centered matrix, and Ui (x,y)is the average gradient value in GMi, then
Ci (x, y) = [GMi (m, n) – Ui (x, y)]2 (3)
As discussed before, the sharpness of a pixel can beexpressed by the sharpness of matrix centralizing in
the pixel. We can build the clearness matrix DCM inwhich the sharpness of a pixel can be calculated byEq.4
DCM (i, x, y) = arg Gi (x, y) (4)
Calculating the depth value of each pixel
From figure 3 we can see that the sharpness of apixel exhibit unimodal distribution. The sharpnessreaches a extreme point when the pixel is in-focus atthe corresponding layer of image. The depth value ofthe pixel can be deduced by the lens position wherethe focused image was captured.
Predicting the fabric background plane
After the z-positions of all the pixels were obtained,the depth image was constructed (figure 4). Since therange of gray value is 0 to 255, all the z-positionswere normalized to 256 degrees. In the constructedimage, pixels with higher intensity of gray value are ata lower depth value.From the pilled fabric depth image, it was noticed thatthe pills have a distinct difference with background indepth. Thus, once the depth of the fabric surfacebackground is acknowledged, pixels above the fabricsurface can be extracted.The most difficult part is that the z-position of fabricsurface in the area covered by pills is uncertain, dueto the interference of the pills. However, the z-posi-tions of fabric surface in these areas could be pre-dicted according to the “flat areas” which were not
468industria textila 2018, vol. 69, nr. 6˘
Fig. 2. a – The depth image without de-noiseprocessing; b – the depth image with de-noise
processing
Fig. 3. Sharpness of a pixel in different image layers
a b
Fig. 4. The depth image
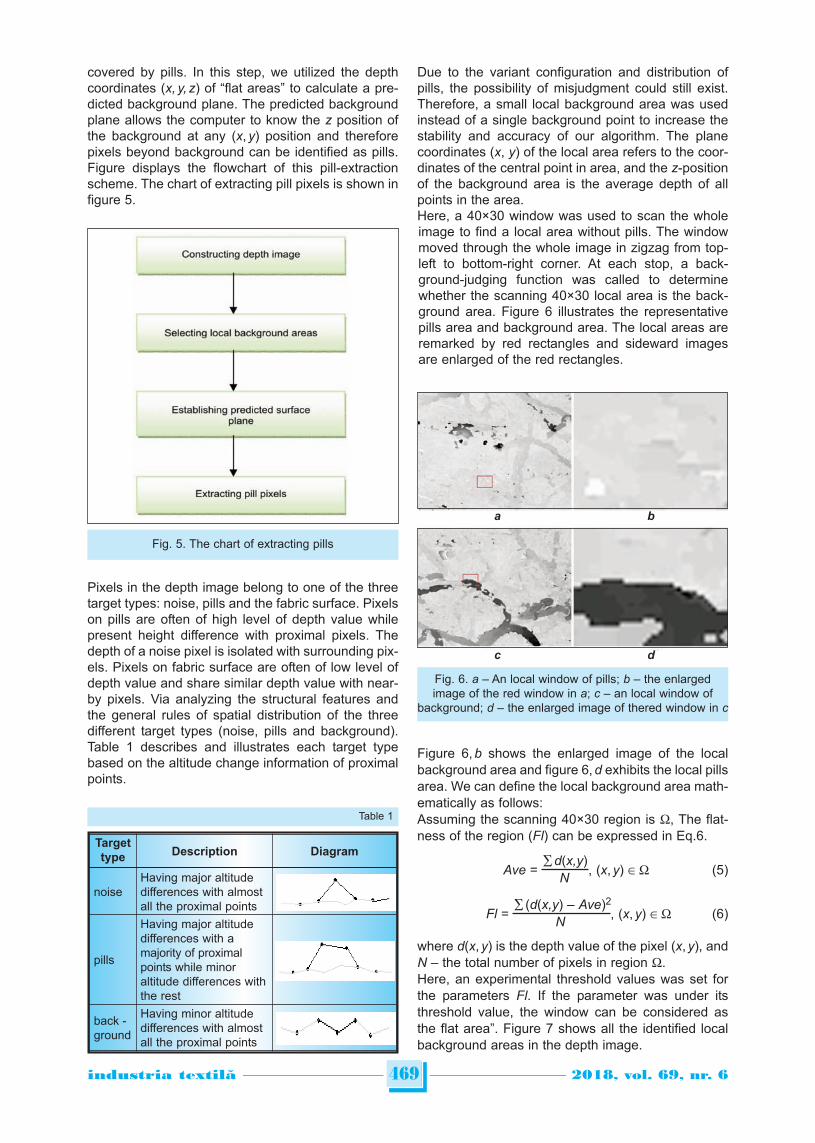
covered by pills. In this step, we utilized the depthcoordinates (x, y, z) of “flat areas” to calculate a pre-dicted background plane. The predicted backgroundplane allows the computer to know the z position ofthe background at any (x, y) position and thereforepixels beyond background can be identified as pills.Figure displays the flowchart of this pill-extractionscheme. The chart of extracting pill pixels is shown infigure 5.
Pixels in the depth image belong to one of the threetarget types: noise, pills and the fabric surface. Pixelson pills are often of high level of depth value whilepresent height difference with proximal pixels. Thedepth of a noise pixel is isolated with surrounding pix-els. Pixels on fabric surface are often of low level ofdepth value and share similar depth value with near-by pixels. Via analyzing the structural features andthe general rules of spatial distribution of the threedifferent target types (noise, pills and background).Table 1 describes and illustrates each target typebased on the altitude change information of proximalpoints.
Due to the variant configuration and distribution ofpills, the possibility of misjudgment could still exist.Therefore, a small local background area was usedinstead of a single background point to increase thestability and accuracy of our algorithm. The planecoordinates (x, y) of the local area refers to the coor-dinates of the central point in area, and the z-positionof the background area is the average depth of allpoints in the area. Here, a 40×30 window was used to scan the wholeimage to find a local area without pills. The windowmoved through the whole image in zigzag from top-left to bottom-right corner. At each stop, a back-ground-judging function was called to determinewhether the scanning 40×30 local area is the back-ground area. Figure 6 illustrates the representativepills area and background area. The local areas areremarked by red rectangles and sideward imagesare enlarged of the red rectangles.
Figure 6, b shows the enlarged image of the localbackground area and figure 6, d exhibits the local pillsarea. We can define the local background area math-ematically as follows:Assuming the scanning 40×30 region is W, The flat-ness of the region (Fl) can be expressed in Eq.6.
d(x,y)Ave = , (x, y) W (5)
N
(d(x,y) – Ave)2
Fl = , (x, y) W (6)N
where d(x, y) is the depth value of the pixel (x, y), andN – the total number of pixels in region W. Here, an experimental threshold values was set forthe parameters Fl. If the parameter was under itsthreshold value, the window can be considered asthe flat area”. Figure 7 shows all the identified localbackground areas in the depth image.
469industria textila 2018, vol. 69, nr. 6˘
Fig. 6. a – An local window of pills; b – the enlargedimage of the red window in a; c – an local window of
background; d – the enlarged image of thered window in c
Fig. 5. The chart of extracting pills
Targettype Description Diagram
noiseHaving major altitudedifferences with almostall the proximal points
pills
Having major altitudedifferences with amajority of proximalpoints while minoraltitude differences withthe rest
back -ground
Having minor altitudedifferences with almostall the proximal points
Table 1
a b
c d
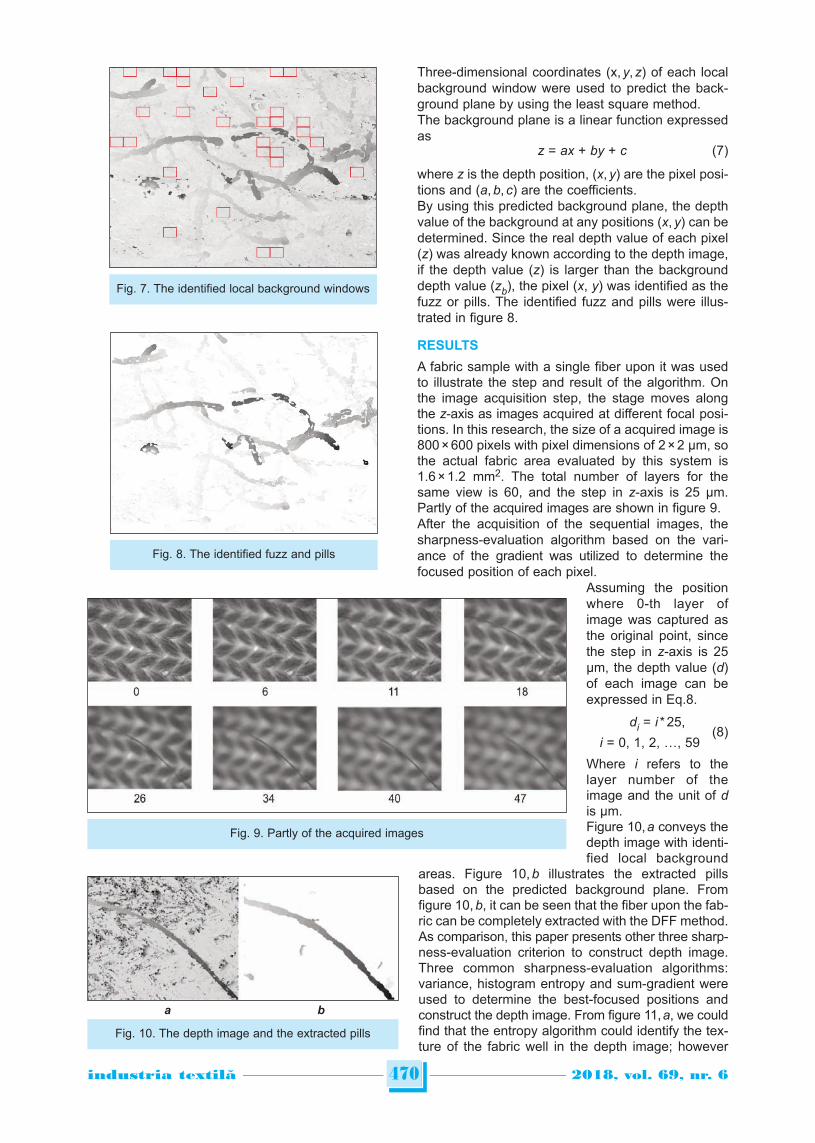
Three-dimensional coordinates (x, y, z) of each localbackground window were used to predict the back-ground plane by using the least square method.The background plane is a linear function expressedas
z = ax + by + c (7)
where z is the depth position, (x, y) are the pixel posi -tions and (a, b, c) are the coefficients. By using this predicted background plane, the depthvalue of the background at any positions (x, y) can bedetermined. Since the real depth value of each pixel(z) was already known according to the depth image,if the depth value (z) is larger than the backgrounddepth value (zb), the pixel (x, y) was identified as thefuzz or pills. The identified fuzz and pills were illus-trated in figure 8.
RESULTS
A fabric sample with a single fiber upon it was usedto illustrate the step and result of the algorithm. Onthe image acquisition step, the stage moves alongthe z-axis as images acquired at different focal posi-tions. In this research, the size of a acquired image is800 × 600 pixels with pixel dimensions of 2 × 2 µm, sothe actual fabric area evaluated by this system is1.6 × 1.2 mm2. The total number of layers for thesame view is 60, and the step in z-axis is 25 µm.Partly of the acquired images are shown in figure 9.After the acquisition of the sequential images, thesharpness-evaluation algorithm based on the vari-ance of the gradient was utilized to determine thefocused position of each pixel.
Assuming the positionwhere 0-th layer ofimage was captured asthe original point, sincethe step in z-axis is 25µm, the depth value (d)of each image can beexpressed in Eq.8.
di = i * 25,
i = 0, 1, 2, …, 59 (8)
Where i refers to thelayer number of theimage and the unit of dis µm.Figure 10, a conveys thedepth image with identi-fied local back ground
areas. Figure 10, b illustrates the extracted pillsbased on the predicted background plane. Fromfigure 10, b, it can be seen that the fiber upon the fab-ric can be completely extracted with the DFF method. As comparison, this paper presents other three sharp -ness-evaluation criterion to construct depth image.Three common sharpness-evaluation algorithms:variance, histogram entropy and sum-gradient wereused to determine the best-focused positions andconstruct the depth image. From figure 11, a, we couldfind that the entropy algorithm could identify the tex-ture of the fabric well in the depth image; however
470industria textila 2018, vol. 69, nr. 6˘
Fig. 7. The identified local background windows
Fig. 9. Partly of the acquired images
Fig. 8. The identified fuzz and pills
Fig. 10. The depth image and the extracted pills
a b

the fiber upon the fabric was missing. Both the vari-ance and the sum-gradient sharpness-evaluation cri-terion lost parts of the fiber information, as Shown infigure 11, b and figure 11, c.
CONCLUSION
This work has described the pill identified methodbased on DFF. This method requires for an automat-ic microscope, a digital camera and a computer withpill identification algorithm embedded, which is moreconvenient and much cheaper than Laser-scanningsystem. With the method of DFF, the best focusedposition of each pixel can be located and a depthmap of the whole image can be estimated. Severallocal background areas were identified as basicpoints to calculate a predicted background plane.Pills whose depth values were upon the background
were extracted according to the predicted back-ground plane. The sample fabric with a fiber put uponit was used to illustrate the process of this method.By comparing the depth image constructed by otherthree common sharpness-evaluation criterion, thesharpness-evaluation algorithm based on the vari-ance of the gradients was verified to maintain morecomplete pill information.
ACKNOWLEDGEMENTS
The authors would like to express their appreciation for theNatural Science Foundation of China (Grant No.61172119),the Program for New Century Excellent Talents in University(Grant No. NCET-12-0825), the Foundation for the Authorof National Excellent Doctoral Dissertation of PR China(Grant No. 201168), the Fundamental Research Funds forthe Central Universities of China, and the SubsidizationProject (14JS039) of Shaanxi Province EducationDepartment Science and Technology Research Plan.
471industria textila 2018, vol. 69, nr. 6˘
Fig. 11. The depth image with other sharpness-evaluation algorithms
a b c
BIBLIOGRAPHY
[1] Binjie, X., Hu, J., Yan, H. Objective evaluation of fabric pilling using image analysis techniques. In: Textile ResearchJournal, 2002, vol. 72, issue 12, pp. 1057–1064.
[2] Goktepe, O. Fabric pilling performance and sensitivity of several pilling testers. In: Textile Research Journal, 2002,vol. 72, issue 7, pp. 625-630.
[3] C.D., M. T. Integrated visual-smart inspection system for the textile fabrics developed by image virtual processingmethods. In: IndustriaTextila, 2009, vol. 60, pp. 134–145.
[4] Kim, S. C., Kang, T. J. Fabric surface roughness evaluation using wavelet-fractal method – Part II: Fabric pillingevaluation. In: Textile Research Journal, 2005, vol. 75, issue 11, pp. 764–770.
[5] Izabela, J., Zbigniew, S. An alternative instrumental method for fabric pilling evaluation based on computer imageanalysis. In: Textile Research Journal, 2014, vol. 84, issue 5, pp. 488–499.
[6] John, E.Ens. An investigation of methods for determining Depth from Focus. In: Britain, University of BritishColumbia, 1990, pp. 977-981.
[7] Michael, M., Martin, B., Carola, Schonlieb., Daniel, C. Variational Depth from Focus reconstruction. In: ImageProcessing IEEE Transaction On, 2015, vol. 24, issue 12, pp. 5369–5378.
[8] Muller, R.A., Buffington, A. Real-time correction of atmospherically degraded telescope images through imagesharpening. In: Journal of the Optical Society of America. 1974, vol. 64, issue 9, pp. 1200–1210.
Authors:
LING JIE YU1, RONG WU WANG1,2, JIN FENG ZHOU1
1Donghua University, Department of Textile Engineering2Xi’an Polytechnic University, Functional apparel fabric Key Laboratory of Shaanxi Province
e-mail: [email protected]
Corresponding author:
RONG WU WANG
e-mail: [email protected]
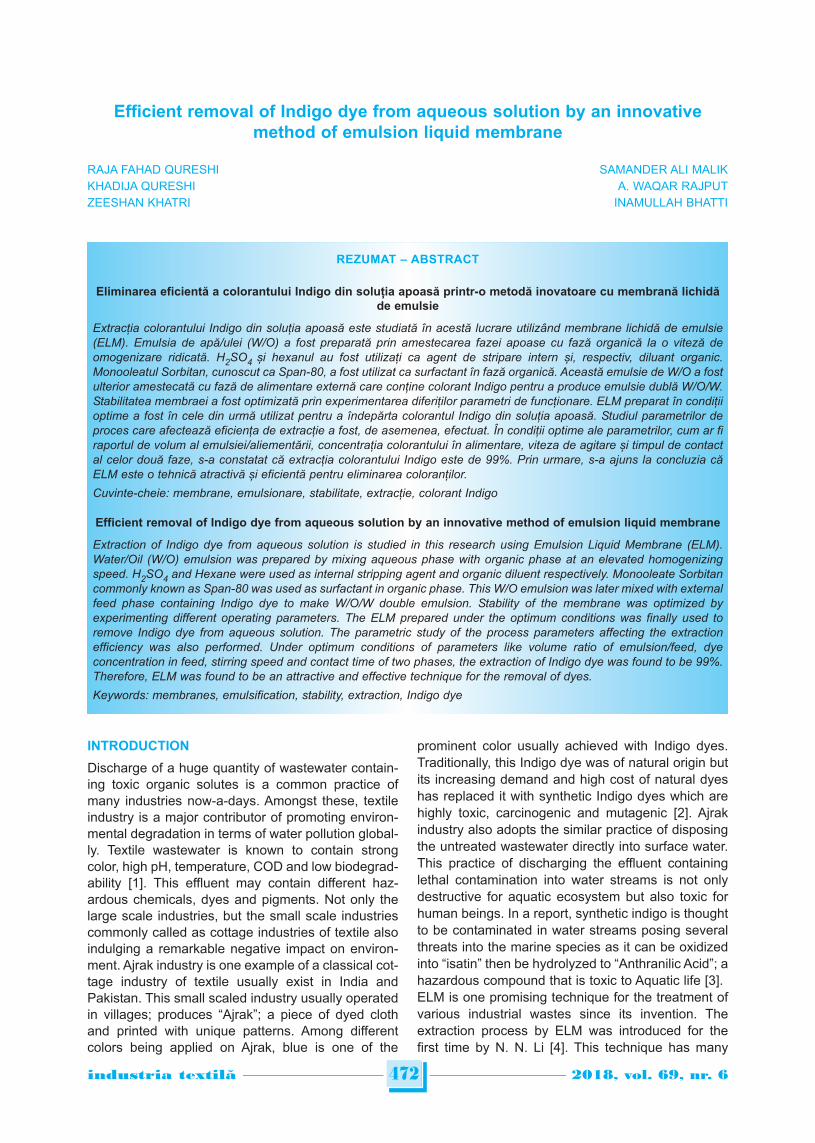
INTRODUCTION
Discharge of a huge quantity of wastewater contain-ing toxic organic solutes is a common practice ofmany industries now-a-days. Amongst these, textileindustry is a major contributor of promoting environ-mental degradation in terms of water pollution global-ly. Textile wastewater is known to contain strongcolor, high pH, temperature, COD and low biodegrad-ability [1]. This effluent may contain different haz-ardous chemicals, dyes and pigments. Not only thelarge scale industries, but the small scale industriescommonly called as cottage industries of textile alsoindulging a remarkable negative impact on environ-ment. Ajrak industry is one example of a classical cot-tage industry of textile usually exist in India andPakistan. This small scaled industry usually operatedin villages; produces “Ajrak”; a piece of dyed clothand printed with unique patterns. Among differentcolors being applied on Ajrak, blue is one of the
prominent color usually achieved with Indigo dyes.Traditionally, this Indigo dye was of natural origin butits increasing demand and high cost of natural dyeshas replaced it with synthetic Indigo dyes which arehighly toxic, carcinogenic and mutagenic [2]. Ajrakindustry also adopts the similar practice of disposingthe untreated wastewater directly into surface water.This practice of discharging the effluent containinglethal contamination into water streams is not onlydestructive for aquatic ecosystem but also toxic forhuman beings. In a report, synthetic indigo is thoughtto be contaminated in water streams posing severalthreats into the marine species as it can be oxidizedinto “isatin” then be hydrolyzed to “Anthranilic Acid”; ahazardous compound that is toxic to Aquatic life [3]. ELM is one promising technique for the treatment ofvarious industrial wastes since its invention. Theextraction process by ELM was introduced for thefirst time by N. N. Li [4]. This technique has many
Efficient removal of Indigo dye from aqueous solution by an innovativemethod of emulsion liquid membrane
RAJA FAHAD QURESHI SAMANDER ALI MALIKKHADIJA QURESHI A. WAQAR RAJPUTZEESHAN KHATRI INAMULLAH BHATTI
REZUMAT – ABSTRACT
Eliminarea eficientă a colorantului Indigo din soluția apoasă printr-o metodă inovatoare cu membrană lichidăde emulsie
Extracția colorantului Indigo din soluția apoasă este studiată în acestă lucrare utilizând membrane lichidă de emulsie(ELM). Emulsia de apă/ulei (W/O) a fost preparată prin amestecarea fazei apoase cu fază organică la o viteză deomogenizare ridicată. H2SO4 și hexanul au fost utilizați ca agent de stripare intern și, respectiv, diluant organic.Monooleatul Sorbitan, cunoscut ca Span-80, a fost utilizat ca surfactant în fază organică. Această emulsie de W/O a fostulterior amestecată cu fază de alimentare externă care conține colorant Indigo pentru a produce emulsie dublă W/O/W.Stabilitatea membraei a fost optimizată prin experimentarea diferiților parametri de funcționare. ELM preparat în condițiioptime a fost în cele din urmă utilizat pentru a îndepărta colorantul Indigo din soluția apoasă. Studiul parametrilor deproces care afectează eficiența de extracție a fost, de asemenea, efectuat. În condiții optime ale parametrilor, cum ar firaportul de volum al emulsiei/aliementării, concentrația colorantului în alimentare, viteza de agitare și timpul de contactal celor două faze, s-a constatat că extracția colorantului Indigo este de 99%. Prin urmare, s-a ajuns la concluzia căELM este o tehnică atractivă și eficientă pentru eliminarea coloranților.
Cuvinte-cheie: membrane, emulsionare, stabilitate, extracție, colorant Indigo
Efficient removal of Indigo dye from aqueous solution by an innovative method of emulsion liquid membrane
Extraction of Indigo dye from aqueous solution is studied in this research using Emulsion Liquid Membrane (ELM).Water/Oil (W/O) emulsion was prepared by mixing aqueous phase with organic phase at an elevated homogenizingspeed. H2SO4 and Hexane were used as internal stripping agent and organic diluent respectively. Monooleate Sorbitancommonly known as Span-80 was used as surfactant in organic phase. This W/O emulsion was later mixed with externalfeed phase containing Indigo dye to make W/O/W double emulsion. Stability of the membrane was optimized byexperimenting different operating parameters. The ELM prepared under the optimum conditions was finally used toremove Indigo dye from aqueous solution. The parametric study of the process parameters affecting the extractionefficiency was also performed. Under optimum conditions of parameters like volume ratio of emulsion/feed, dyeconcentration in feed, stirring speed and contact time of two phases, the extraction of Indigo dye was found to be 99%.Therefore, ELM was found to be an attractive and effective technique for the removal of dyes.
Keywords: membranes, emulsification, stability, extraction, Indigo dye
472industria textila 2018, vol. 69, nr. 6˘
advantages over the other treatments methods whichhas made this process more significant and highlyprospective. Many studies have been carried out forthe extraction of different species from water by usingELM technique like heavy metals [5, 6], precious met-als [7], phenol [8], organic acids [9–10], aniline [11],bioactive material [12]. Removal of different classesof dyes through ELM process with extraction efficien-cy above 99% is reported in different studies. An effi-cient removal of acid dyes [13–14], Anionic dyes[15–16], cationic dyes [17–18], reactive dyes [19],crystal violet and methylene blue dyes [20] is report-ed in literature. To the best of our knowledge, no workhas been done on the extraction of Indigo dyes byELM process. The present study is aimed to removeIndigo dye from the aqueous solution by using ELMtechnology considered as one highly hazardous con-taminant present in the effluent of “Ajrak” Cottageindustry.
EXPERIMENTAL
Material
Sorbitanmonooleate commercially known as Span-80and sulfuric acid (97% purity) used in this study wasobtained from Merck. Hexane fraction from petroleumused in this research was also a laboratory reagentgrade manufactured by Fisher Scientific (UK). Indigodye was courteously collected from the local textilecottage industry of Ajrak. ULTRA-Turax T-25Homogenizer was used for the emulsification ofaqueous internal phase and organic phase, whereasthe mixing of W/O emulsion with external phase wasachieved with ADVANTEC MIDGET mechanical stir-rer attached with a four bladed propeller type shaft.UV-1800 SHIMADZU UV-Spectrophotometer wasused for measuring the absorption intensity of theIndigo dye before and after the treatment (figure1).
Procedure
Stability analysis
Before emulsification of the W/O emulsion, both theaqueous and organic phases were separately pre-pared. Aqueous phase was prepared by dissolvingan appropriate amount of H2SO4 in distilled water tomake solutions of different molar strengths. Measuredquantities of Hexane were mixed with Span-80 tomake the organic phase. Hexane was used as organ-ic diluent whereas Span-80 assurfactant. The solu-tion was stirred and heated on WISE-STIR magneticstirrer for 10 minutes at 30°C for a fixed stirring veloc-ity of 700 rpm. To determine the emulsion stability,both these phases were initially mixed to make W/Oemulsion under the varying speeds of ULTRA-TurraxT-25 Homogenizer from 3,000 to 10,000 rpm andthen the prepared emulsion was filled in scaled testtubes. The test tubes were placed in test tube holderand kept for 24-hours at normal room temperature(25–30°C). After 24-hours, the phase separation ratioof the aqueous and oil was calculated using the fol-lowing expression:
Vt – VwStability % = × 100
VtWhere Vt is the total volume of the emulsion in thetest tube, Vw – the separated volume of the aqueousphase in the test tube after 24 hours.
Extraction of Indigo dye
External feed phase was prepared by dissolving dif-ferent quantities of Indigo dye in distilled water tomake required dye concentrations. The preparedexternal phase contained in a PYREX glass beakerwas placed under shaft of ADVANTEC MIDGETmechanical stirrer while pouring the W/O emulsionslowly into the beaker. The mechanical stirrer wasrotated at different mixing speeds resulting in aWater/Oil/Water (W/O/W) double emulsion. Aftersome definite time, contains of the beaker weretransferred into a separating funnel and allowed forphase separation. The treated water was finally col-lected in a fresh beaker from the bottom of the funnelwhile the remainder in the funnel was collected sep-arately for reuse of membrane after demulsificationprocess.
RESULTS AND DISCUSSION
Parametric study
Parametric study on the behavior of formulated ELMwith respect to stability and extraction efficiency wasconducted by using conventional single factor designmethod. According to this method, all the parameterswere initially set on one constant value except oneparameter which was varied. Later this parameterwas fixed at an optimum level varying the otherparameter. This process continued till all the workingparameters were individually optimized.
Effects of operational parameters on membranestability
Effect of aqueous phase concentration
Concentration of the stripping agent in aqueous phaseplays very vital role in the stability analysis of anyELM system. Experiments were conducted to deter-mine the optimal concentration of aqueous phase to
473industria textila 2018, vol. 69, nr. 6˘
a b c d f
Fig. 1. Extraction process of Indigo dye by ELM process:a – preparation of W/O emulsion; b – stable emulsion;
c – mixing of dye phase with W/O emulsion;d – separation of phases in separating funnel;
e – dye extracted from aqueous solution
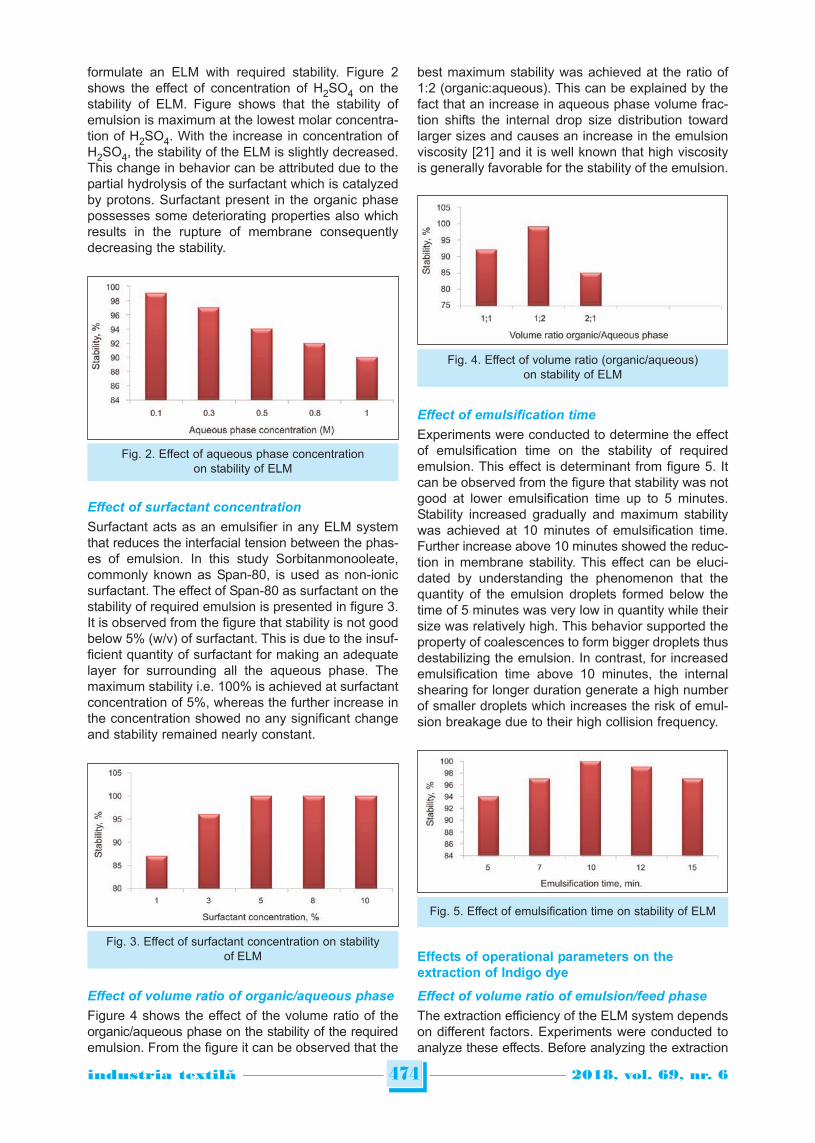
formulate an ELM with required stability. Figure 2shows the effect of concentration of H2SO4 on thestability of ELM. Figure shows that the stability ofemulsion is maximum at the lowest molar concentra-tion of H2SO4. With the increase in concentration ofH2SO4, the stability of the ELM is slightly decreased.This change in behavior can be attributed due to thepartial hydrolysis of the surfactant which is catalyzedby protons. Surfactant present in the organic phasepossesses some deteriorating properties also whichresults in the rupture of membrane consequentlydecreasing the stability.
Effect of surfactant concentration
Surfactant acts as an emulsifier in any ELM systemthat reduces the interfacial tension between the phas-es of emulsion. In this study Sorbitanmonooleate,commonly known as Span-80, is used as non-ionicsurfactant. The effect of Span-80 as surfactant on thestability of required emulsion is presented in figure 3.It is observed from the figure that stability is not goodbelow 5% (w/v) of surfactant. This is due to the insuf-ficient quantity of surfactant for making an adequatelayer for surrounding all the aqueous phase. Themaximum stability i.e. 100% is achieved at surfactantconcentration of 5%, whereas the further increase inthe concentration showed no any significant changeand stability remained nearly constant.
Effect of volume ratio of organic/aqueous phase
Figure 4 shows the effect of the volume ratio of theorganic/aqueous phase on the stability of the requiredemulsion. From the figure it can be observed that the
best maximum stability was achieved at the ratio of1:2 (organic:aqueous). This can be explained by thefact that an increase in aqueous phase volume frac-tion shifts the internal drop size distribution towardlarger sizes and causes an increase in the emulsionviscosity [21] and it is well known that high viscosityis generally favorable for the stability of the emulsion.
Effect of emulsification time
Experiments were conducted to determine the effectof emulsification time on the stability of requiredemulsion. This effect is determinant from figure 5. Itcan be observed from the figure that stability was notgood at lower emulsification time up to 5 minutes.Stability increased gradually and maximum stabilitywas achieved at 10 minutes of emulsification time.Further increase above 10 minutes showed the reduc-tion in membrane stability. This effect can be eluci-dated by understanding the phenomenon that thequantity of the emulsion droplets formed below thetime of 5 minutes was very low in quantity while theirsize was relatively high. This behavior supported theproperty of coalescences to form bigger droplets thusdestabilizing the emulsion. In contrast, for increasedemulsification time above 10 minutes, the internalshearing for longer duration generate a high numberof smaller droplets which increases the risk of emul-sion breakage due to their high collision frequency.
Effects of operational parameters on theextraction of Indigo dye
Effect of volume ratio of emulsion/feed phase
The extraction efficiency of the ELM system dependson different factors. Experiments were conducted toanalyze these effects. Before analyzing the extraction
474industria textila 2018, vol. 69, nr. 6˘
Fig. 2. Effect of aqueous phase concentrationon stability of ELM
Fig. 4. Effect of volume ratio (organic/aqueous)on stability of ELM
Fig. 5. Effect of emulsification time on stability of ELM
Fig. 3. Effect of surfactant concentration on stabilityof ELM

efficiency, the stable membrane was developedaccording to optimized values of parameters previ-ously observed. These optimum values include0.1 M concentration of H2SO4 in aqueous phase, 5%Span-80 as concentration of surfactant, 8000 rpmemulsification speed and 10 minutes homogenizationtime.For optimum extraction, volume ratio of emulsion tofeed phase was experimented and analyzed. Fromfigure 6 we can conclude the result by observing thatthe maximum extraction efficiency is achieved at theratio of 1:5. Further increase in the ratio decreasesthe efficiency. This can be explained by the phenom-ena of swelling (water passage from external feedphase to internal aqueous phase), thereby decreas-ing the membrane film thickness resulting the emul-sion become unstable, which intern decreasing theextraction of target solute.
Effect of dye concentration in feed phase
In separation processes, the quantity of the target isalso one important factor to be considered. In thisstudy, the effect of Indigo dye concentration in external
feed phase was also observed by varying its concen-tration. Figure 7 shows that the maximum extractionefficiency is achieved at dye concentration of 50 ppm.For concentrations above 50 ppm, the extraction yielddecrease which is due to the saturation of internalphase droplets by the target dye particles.
Effect of stirring speed for mixing the emulsion
and feed phases
The stirring speed plays a major role in the rate ofextraction of any solute through emulsion liquidmembrane. The effect of stirring/mixing speed in thisstudy was also observed and produced in figure 9.From the graph in figure 8, it is observed that increas-ing the speed from 50 to 100 rpm, an increase inextraction efficiency is noticed. However, furtherincrease in speed above 100 rpm gradually decreas-es the extraction efficiency. This can be attributed aslower stirring speed below 100 rpm is not adequate toform smaller sized emulsion droplets in maximumnumber for trapping the maximum quantity of dyeparticles. At optimal speed of 100 rpm, a good num-ber of smaller sized emulsion droplets are formedleading to more surface area provided for bettermass transfer. Further increase in speed increases
475industria textila 2018, vol. 69, nr. 6˘
Fig. 6. Effect of volume ratio (emulsion/feed)on extraction of Indigo dye
Fig. 7. Effect of dye concentration in feed on extractionof Indigo dye
Fig. 8. Images showing difference in absorbance curves at same wavelength (left) absorbance of dye solutionat 670 nm before ELM treatment 1.754% (right) absorbance of dye solution at 670 nm after ELM treatment 0.025%
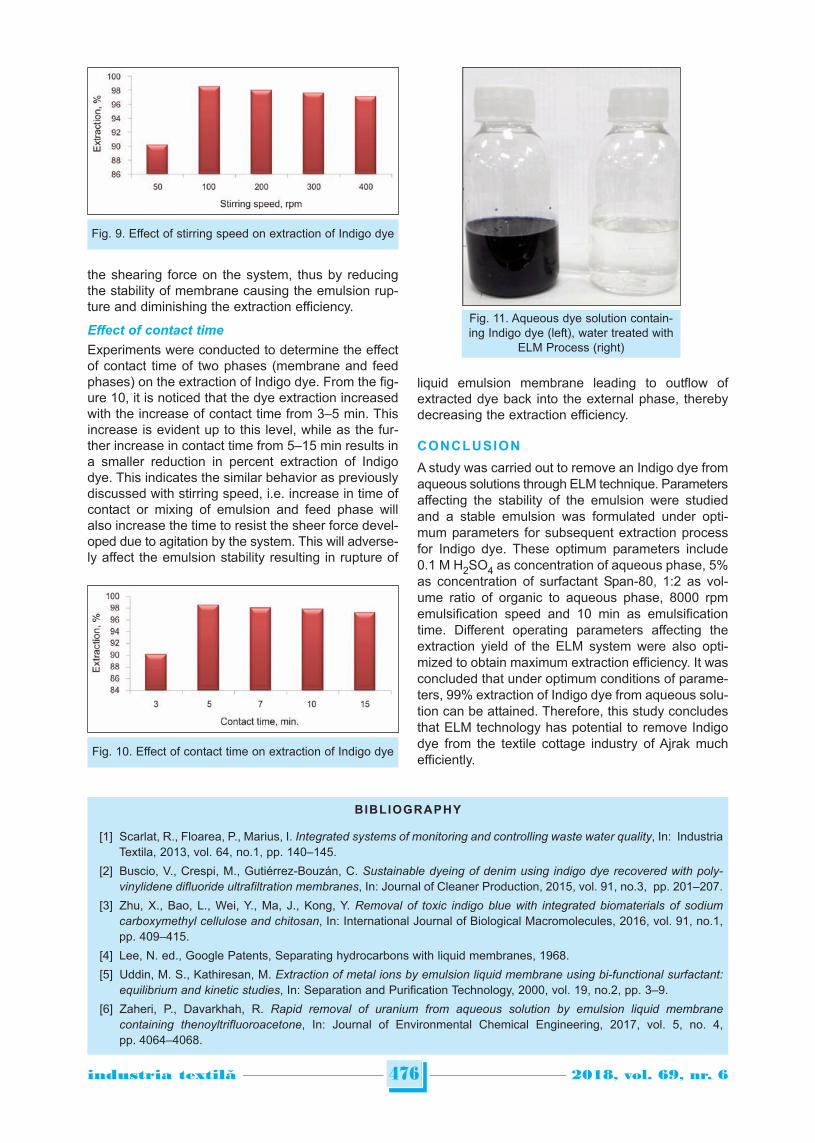
the shearing force on the system, thus by reducingthe stability of membrane causing the emulsion rup-ture and diminishing the extraction efficiency.
Effect of contact time
Experiments were conducted to determine the effectof contact time of two phases (membrane and feedphases) on the extraction of Indigo dye. From the fig-ure 10, it is noticed that the dye extraction increasedwith the increase of contact time from 3–5 min. Thisincrease is evident up to this level, while as the fur-ther increase in contact time from 5–15 min results ina smaller reduction in percent extraction of Indigodye. This indicates the similar behavior as previouslydiscussed with stirring speed, i.e. increase in time ofcontact or mixing of emulsion and feed phase willalso increase the time to resist the sheer force devel-oped due to agitation by the system. This will adverse-ly affect the emulsion stability resulting in rupture of
liquid emulsion membrane leading to outflow ofextracted dye back into the external phase, therebydecreasing the extraction efficiency.
CONCLUSION
A study was carried out to remove an Indigo dye fromaqueous solutions through ELM technique. Parametersaffecting the stability of the emulsion were studiedand a stable emulsion was formulated under opti-mum parameters for subsequent extraction processfor Indigo dye. These optimum parameters include0.1 M H2SO4 as concentration of aqueous phase, 5%as concentration of surfactant Span-80, 1:2 as vol-ume ratio of organic to aqueous phase, 8000 rpmemulsification speed and 10 min as emulsificationtime. Different operating parameters affecting theextraction yield of the ELM system were also opti-mized to obtain maximum extraction efficiency. It wasconcluded that under optimum conditions of parame-ters, 99% extraction of Indigo dye from aqueous solu-tion can be attained. Therefore, this study concludesthat ELM technology has potential to remove Indigodye from the textile cottage industry of Ajrak muchefficiently.
476industria textila 2018, vol. 69, nr. 6˘
Fig. 9. Effect of stirring speed on extraction of Indigo dye
Fig. 10. Effect of contact time on extraction of Indigo dye
Fig. 11. Aqueous dye solution contain-ing Indigo dye (left), water treated with
ELM Process (right)
BIBLIOGRAPHY
[1] Scarlat, R., Floarea, P., Marius, I. Integrated systems of monitoring and controlling waste water quality, In: IndustriaTextila, 2013, vol. 64, no.1, pp. 140–145.
[2] Buscio, V., Crespi, M., Gutiérrez-Bouzán, C. Sustainable dyeing of denim using indigo dye recovered with poly -vinylidene difluoride ultrafiltration membranes, In: Journal of Cleaner Production, 2015, vol. 91, no.3, pp. 201–207.
[3] Zhu, X., Bao, L., Wei, Y., Ma, J., Kong, Y. Removal of toxic indigo blue with integrated biomaterials of sodiumcarboxymethyl cellulose and chitosan, In: International Journal of Biological Macromolecules, 2016, vol. 91, no.1,pp. 409–415.
[4] Lee, N. ed., Google Patents, Separating hydrocarbons with liquid membranes, 1968.
[5] Uddin, M. S., Kathiresan, M. Extraction of metal ions by emulsion liquid membrane using bi-functional surfactant:equilibrium and kinetic studies, In: Separation and Purification Technology, 2000, vol. 19, no.2, pp. 3–9.
[6] Zaheri, P., Davarkhah, R. Rapid removal of uranium from aqueous solution by emulsion liquid membranecontaining thenoyltrifluoroacetone, In: Journal of Environmental Chemical Engineering, 2017, vol. 5, no. 4,pp. 4064–4068.
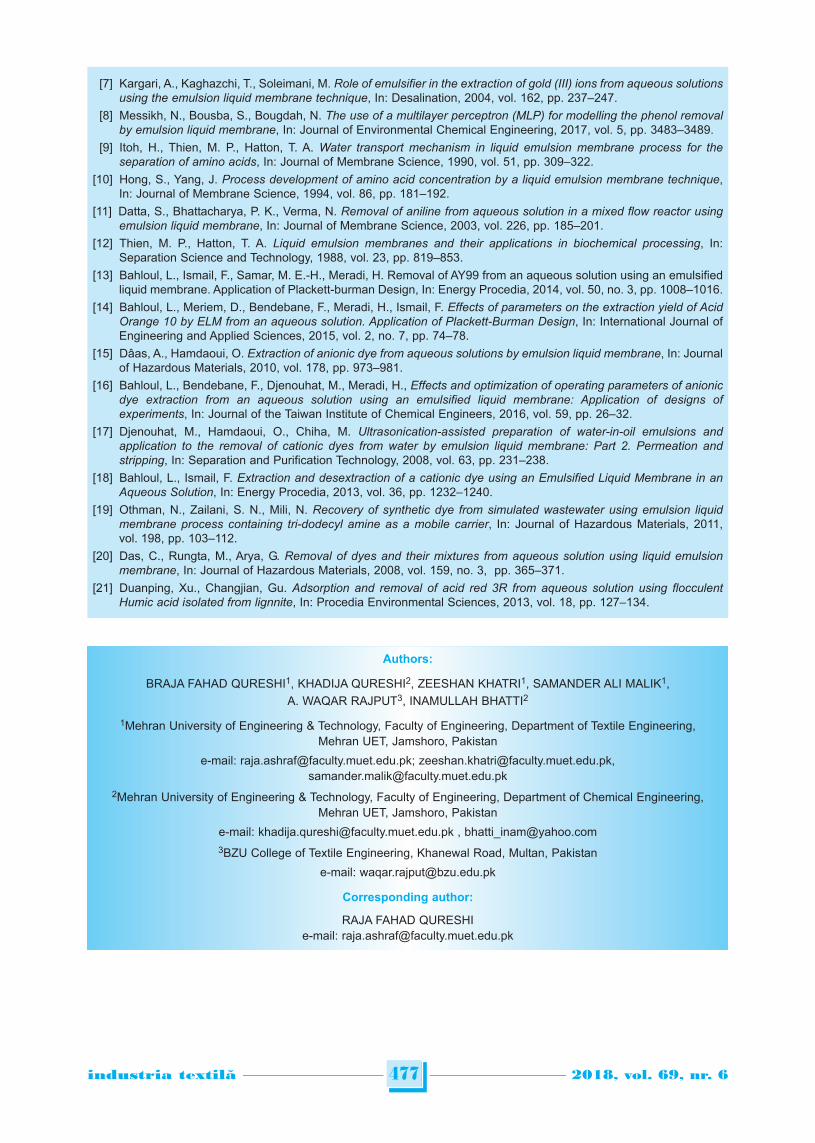
477industria textila 2018, vol. 69, nr. 6˘
Authors:
BRAJA FAHAD QURESHI1, KHADIJA QURESHI2, ZEESHAN KHATRI1, SAMANDER ALI MALIK1,A. WAQAR RAJPUT3, INAMULLAH BHATTI2
1Mehran University of Engineering & Technology, Faculty of Engineering, Department of Textile Engineering,Mehran UET, Jamshoro, Pakistan
e-mail: [email protected]; [email protected],[email protected]
2Mehran University of Engineering & Technology, Faculty of Engineering, Department of Chemical Engineering,Mehran UET, Jamshoro, Pakistan
e-mail: [email protected] , [email protected] College of Textile Engineering, Khanewal Road, Multan, Pakistan
e-mail: [email protected]
Corresponding author:
RAJA FAHAD QURESHIe-mail: [email protected]
[7] Kargari, A., Kaghazchi, T., Soleimani, M. Role of emulsifier in the extraction of gold (III) ions from aqueous solutionsusing the emulsion liquid membrane technique, In: Desalination, 2004, vol. 162, pp. 237–247.
[8] Messikh, N., Bousba, S., Bougdah, N. The use of a multilayer perceptron (MLP) for modelling the phenol removalby emulsion liquid membrane, In: Journal of Environmental Chemical Engineering, 2017, vol. 5, pp. 3483–3489.
[9] Itoh, H., Thien, M. P., Hatton, T. A. Water transport mechanism in liquid emulsion membrane process for theseparation of amino acids, In: Journal of Membrane Science, 1990, vol. 51, pp. 309–322.
[10] Hong, S., Yang, J. Process development of amino acid concentration by a liquid emulsion membrane technique,In: Journal of Membrane Science, 1994, vol. 86, pp. 181–192.
[11] Datta, S., Bhattacharya, P. K., Verma, N. Removal of aniline from aqueous solution in a mixed flow reactor usingemulsion liquid membrane, In: Journal of Membrane Science, 2003, vol. 226, pp. 185–201.
[12] Thien, M. P., Hatton, T. A. Liquid emulsion membranes and their applications in biochemical processing, In:Separation Science and Technology, 1988, vol. 23, pp. 819–853.
[13] Bahloul, L., Ismail, F., Samar, M. E.-H., Meradi, H. Removal of AY99 from an aqueous solution using an emulsifiedliquid membrane. Application of Plackett-burman Design, In: Energy Procedia, 2014, vol. 50, no. 3, pp. 1008–1016.
[14] Bahloul, L., Meriem, D., Bendebane, F., Meradi, H., Ismail, F. Effects of parameters on the extraction yield of AcidOrange 10 by ELM from an aqueous solution. Application of Plackett-Burman Design, In: International Journal ofEngineering and Applied Sciences, 2015, vol. 2, no. 7, pp. 74–78.
[15] Dâas, A., Hamdaoui, O. Extraction of anionic dye from aqueous solutions by emulsion liquid membrane, In: Journalof Hazardous Materials, 2010, vol. 178, pp. 973–981.
[16] Bahloul, L., Bendebane, F., Djenouhat, M., Meradi, H., Effects and optimization of operating parameters of anionicdye extraction from an aqueous solution using an emulsified liquid membrane: Application of designs ofexperiments, In: Journal of the Taiwan Institute of Chemical Engineers, 2016, vol. 59, pp. 26–32.
[17] Djenouhat, M., Hamdaoui, O., Chiha, M. Ultrasonication-assisted preparation of water-in-oil emulsions andapplication to the removal of cationic dyes from water by emulsion liquid membrane: Part 2. Permeation andstripping, In: Separation and Purification Technology, 2008, vol. 63, pp. 231–238.
[18] Bahloul, L., Ismail, F. Extraction and desextraction of a cationic dye using an Emulsified Liquid Membrane in anAqueous Solution, In: Energy Procedia, 2013, vol. 36, pp. 1232–1240.
[19] Othman, N., Zailani, S. N., Mili, N. Recovery of synthetic dye from simulated wastewater using emulsion liquidmembrane process containing tri-dodecyl amine as a mobile carrier, In: Journal of Hazardous Materials, 2011,vol. 198, pp. 103–112.
[20] Das, C., Rungta, M., Arya, G. Removal of dyes and their mixtures from aqueous solution using liquid emulsionmembrane, In: Journal of Hazardous Materials, 2008, vol. 159, no. 3, pp. 365–371.
[21] Duanping, Xu., Changjian, Gu. Adsorption and removal of acid red 3R from aqueous solution using flocculentHumic acid isolated from lignnite, In: Procedia Environmental Sciences, 2013, vol. 18, pp. 127–134.
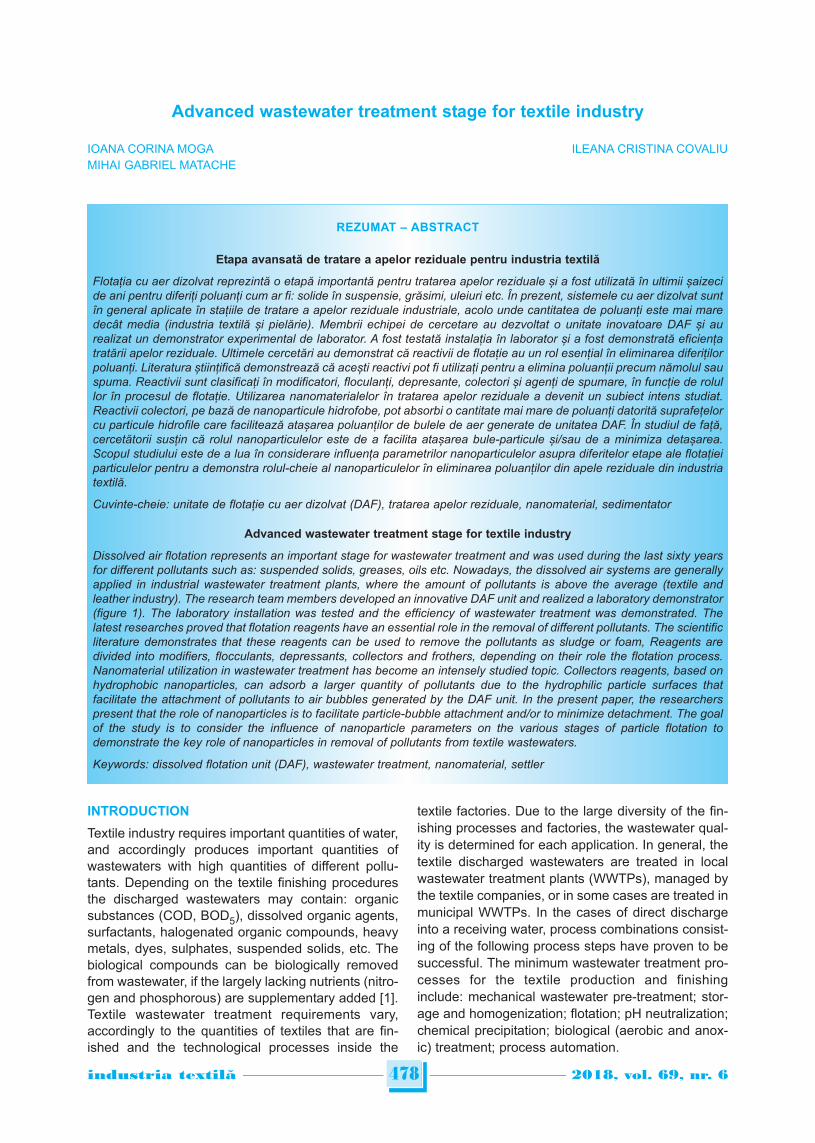
INTRODUCTION
Textile industry requires important quantities of water,and accordingly produces important quantities ofwastewaters with high quantities of different pollu-tants. Depending on the textile finishing proceduresthe discharged wastewaters may contain: organicsubstances (COD, BOD5), dissolved organic agents,surfactants, halogenated organic compounds, heavymetals, dyes, sulphates, suspended solids, etc. Thebiological compounds can be biologically removedfrom wastewater, if the largely lacking nutrients (nitro-gen and phosphorous) are supplementary added [1].Textile wastewater treatment requirements vary,accordingly to the quantities of textiles that are fin-ished and the technological processes inside the
textile factories. Due to the large diversity of the fin-ishing processes and factories, the wastewater qual-ity is determined for each application. In general, thetextile discharged wastewaters are treated in localwastewater treatment plants (WWTPs), managed bythe textile companies, or in some cases are treated inmunicipal WWTPs. In the cases of direct dischargeinto a receiving water, process combinations consist-ing of the following process steps have proven to besuccessful. The minimum wastewater treatment pro-cesses for the textile production and finishinginclude: mechanical wastewater pre-treatment; stor-age and homogenization; flotation; pH neutralization;chemical precipitation; biological (aerobic and anox-ic) treatment; process automation.
478industria textila 2018, vol. 69, nr. 6˘
Advanced wastewater treatment stage for textile industry
IOANA CORINA MOGA ILEANA CRISTINA COVALIUMIHAI GABRIEL MATACHE
REZUMAT – ABSTRACT
Etapa avansată de tratare a apelor reziduale pentru industria textilă
Flotația cu aer dizolvat reprezintă o etapă importantă pentru tratarea apelor reziduale și a fost utilizată în ultimii șaizecide ani pentru diferiți poluanți cum ar fi: solide în suspensie, grăsimi, uleiuri etc. În prezent, sistemele cu aer dizolvat suntîn general aplicate în stațiile de tratare a apelor reziduale industriale, acolo unde cantitatea de poluanți este mai maredecât media (industria textilă și pielărie). Membrii echipei de cercetare au dezvoltat o unitate inovatoare DAF și aurealizat un demonstrator experimental de laborator. A fost testată instalația în laborator și a fost demonstrată eficiențatratării apelor reziduale. Ultimele cercetări au demonstrat că reactivii de flotație au un rol esențial în eliminarea diferițilorpoluanți. Literatura științifică demonstrează că acești reactivi pot fi utilizați pentru a elimina poluanții precum nămolul sauspuma. Reactivii sunt clasificați în modificatori, floculanți, depresante, colectori și agenți de spumare, în funcție de rolullor în procesul de flotație. Utilizarea nanomaterialelor în tratarea apelor reziduale a devenit un subiect intens studiat.Reactivii colectori, pe bază de nanoparticule hidrofobe, pot absorbi o cantitate mai mare de poluanți datorită suprafețelorcu particule hidrofile care facilitează atașarea poluanților de bulele de aer generate de unitatea DAF. În studiul de față,cercetătorii susțin că rolul nanoparticulelor este de a facilita atașarea bule-particule și/sau de a minimiza detașarea.Scopul studiului este de a lua în considerare influența parametrilor nanoparticulelor asupra diferitelor etape ale flotațieiparticulelor pentru a demonstra rolul-cheie al nanoparticulelor în eliminarea poluanților din apele reziduale din industriatextilă.
Cuvinte-cheie: unitate de flotație cu aer dizolvat (DAF), tratarea apelor reziduale, nanomaterial, sedimentator
Advanced wastewater treatment stage for textile industry
Dissolved air flotation represents an important stage for wastewater treatment and was used during the last sixty yearsfor different pollutants such as: suspended solids, greases, oils etc. Nowadays, the dissolved air systems are generallyapplied in industrial wastewater treatment plants, where the amount of pollutants is above the average (textile andleather industry). The research team members developed an innovative DAF unit and realized a laboratory demonstrator(figure 1). The laboratory installation was tested and the efficiency of wastewater treatment was demonstrated. Thelatest researches proved that flotation reagents have an essential role in the removal of different pollutants. The scientificliterature demonstrates that these reagents can be used to remove the pollutants as sludge or foam, Reagents aredivided into modifiers, flocculants, depressants, collectors and frothers, depending on their role the flotation process.Nanomaterial utilization in wastewater treatment has become an intensely studied topic. Collectors reagents, based onhydrophobic nanoparticles, can adsorb a larger quantity of pollutants due to the hydrophilic particle surfaces thatfacilitate the attachment of pollutants to air bubbles generated by the DAF unit. In the present paper, the researcherspresent that the role of nanoparticles is to facilitate particle-bubble attachment and/or to minimize detachment. The goalof the study is to consider the influence of nanoparticle parameters on the various stages of particle flotation todemonstrate the key role of nanoparticles in removal of pollutants from textile wastewaters.
Keywords: dissolved flotation unit (DAF), wastewater treatment, nanomaterial, settler
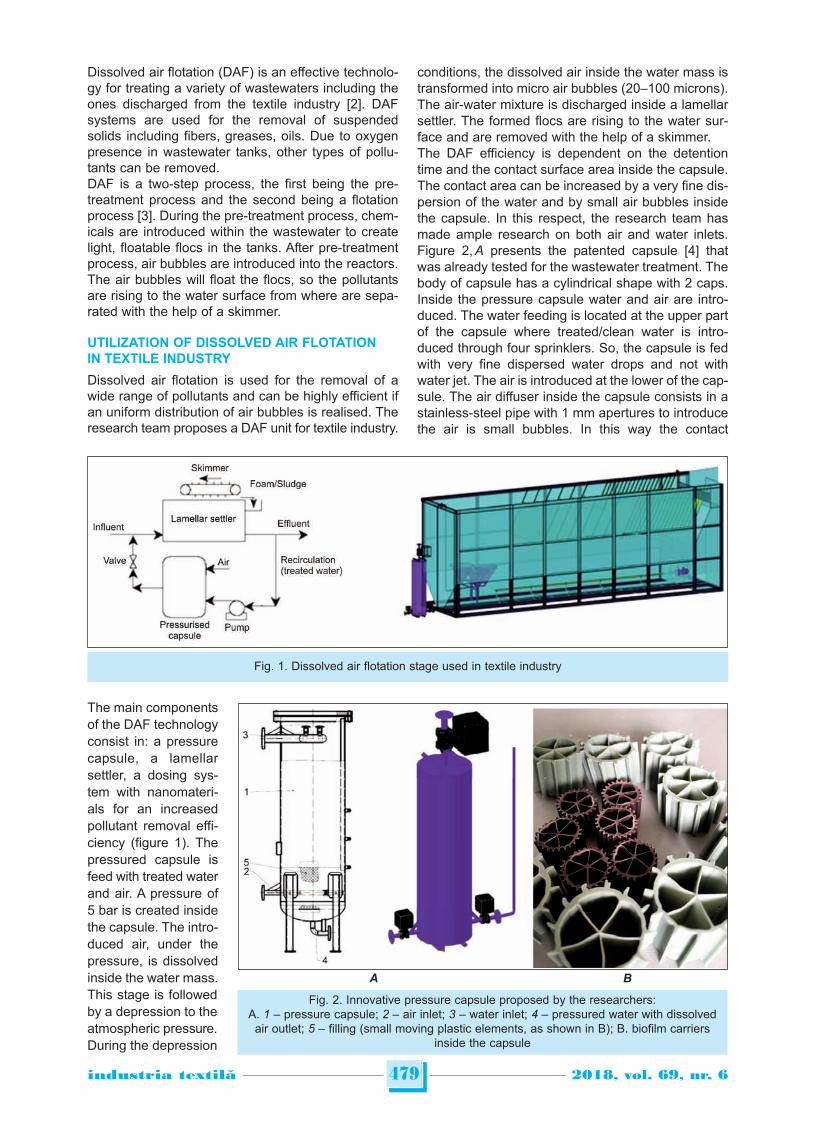
479industria textila 2018, vol. 69, nr. 6˘
Dissolved air flotation (DAF) is an effective technolo-gy for treating a variety of wastewaters including theones discharged from the textile industry [2]. DAFsystems are used for the removal of suspendedsolids including fibers, greases, oils. Due to oxygenpresence in wastewater tanks, other types of pollu-tants can be removed. DAF is a two-step process, the first being the pre-treatment process and the second being a flotationprocess [3]. During the pre-treatment process, chem-icals are introduced within the wastewater to createlight, floatable flocs in the tanks. After pre-treatmentprocess, air bubbles are introduced into the reactors.The air bubbles will float the flocs, so the pollutantsare rising to the water surface from where are sepa-rated with the help of a skimmer.
UTILIZATION OF DISSOLVED AIR FLOTATIONIN TEXTILE INDUSTRY
Dissolved air flotation is used for the removal of awide range of pollutants and can be highly efficient ifan uniform distribution of air bubbles is realised. Theresearch team proposes a DAF unit for textile industry.
The main componentsof the DAF technologyconsist in: a pressurecapsule, a lamellarsettler, a dosing sys-tem with nanomateri-als for an increasedpollutant removal effi-ciency (figure 1). Thepressured capsule isfeed with treated waterand air. A pressure of5 bar is created insidethe capsule. The intro-duced air, under thepressure, is dissolvedinside the water mass.This stage is followedby a depression to theatmospheric pres sure.During the depression
conditions, the dissolved air inside the water mass istransformed into micro air bubbles (20–100 microns).The air-water mixture is discharged inside a lamellarsettler. The formed flocs are rising to the water sur-face and are removed with the help of a skimmer.The DAF efficiency is dependent on the detentiontime and the contact surface area inside the capsule.The contact area can be increased by a very fine dis-persion of the water and by small air bubbles insidethe capsule. In this respect, the research team hasmade ample research on both air and water inlets.Figure 2, A presents the patented capsule [4] thatwas already tested for the wastewater treatment. Thebody of capsule has a cylindrical shape with 2 caps.Inside the pressure capsule water and air are intro-duced. The water feeding is located at the upper partof the capsule where treated/clean water is intro-duced through four sprinklers. So, the capsule is fedwith very fine dispersed water drops and not withwater jet. The air is introduced at the lower of the cap-sule. The air diffuser inside the capsule consists in astainless-steel pipe with 1 mm apertures to introducethe air is small bubbles. In this way the contact
Fig. 2. Innovative pressure capsule proposed by the researchers:A. 1 – pressure capsule; 2 – air inlet; 3 – water inlet; 4 – pressured water with dissolvedair outlet; 5 – filling (small moving plastic elements, as shown in B); B. biofilm carriers
inside the capsule
Fig. 1. Dissolved air flotation stage used in textile industry
A B

480industria textila 2018, vol. 69, nr. 6˘
surface between air and water is maximized. Toobtain a longer time contact between the air bubblesand water, the researchers introduced small plasticelements (figure 2, B) inside the capsule. This patent-ed solution assures a better efficiency of small airbubble generation inside the lamellar settler.
LAMELLAR SETTER DESIGNING
Mathematical modelling processes and numericalsimulations are starting to have a higher importancein the designing phase of various types of equipment.Using this tool, investors will save money and time.In addition to engineering design calculations, numeri-cal simulations have become a necessary activity indesign. In the present study, the optimal shape for alamellar clarifier was determined with the help ofnumerical simulations. The lamellar settles have anincreased efficiency in settling solid suspensions rel-ative to conventional longitudinal clarifiers. In literature it is mentioned that for the sedimentationof granular particles, the low depth basins are eco-nomically preferable. These considerations have ledto the emergence of lamellar decanters. The lamellarsettler is highly efficient and does not require a verylarge space for the solid suspensions sedimentation.For such a lamellar clarifier, a series of mathematicalmodelling and numerical simulations were per-formed, as follows. These numerical simulations werenecessary to avoid the preferential flows and currentsinside the clarifier. To efficiently design the lamellardecanter, several types of lamellar decanters (withdifferent dimensions, configurations and lengths ofdecanter plates) were analysed. Primarily, a decanterwith a length of 2,000 mm, a useful height of 2,600mm and a width of 3,000 mm was considered. A solidsuspension concentration of 300 mg/l was also con-sidered. The decanter plate package has a length of1,500 mm (figure 3).The discharge of the treated water outside the settleris performed at the top, i.e. the upper right corner ofthe images. It is noted that the lamellar settler pro-vides high efficiency for the sedimentation process,yielding approximately 30 mg/l of solid suspensions.Forward the length of the decanter plates has beenchanged, and the results are shown in figure 4.
In comparison with the above-mentioned case, animprovement in the decanter efficiency is observed,which is in line with the results obtained by otherresearchers – increasing the length of the decantingplates provides greater efficiency. In the third optiondifferent lengths of decanting plates are considered(figure 5). As it can be seen in this case, the lamellardecanter is well-sized. The next step was increasingthe number of decanter plates and the length of thedecanter to 3,000 mm (figure 6).
Fig. 3. Lamellar settler – variant 1. Sedimentation of solidsuspensions
Fig. 4. Lamellar settler – variant 2. Sedimentation of solidsuspensions
Fig. 5: Lamellar settler – variant 3. Sedimentation of solidsuspensions
Fig. 6: Lamellar settler – variant 4. Sedimentation of solidsuspensions
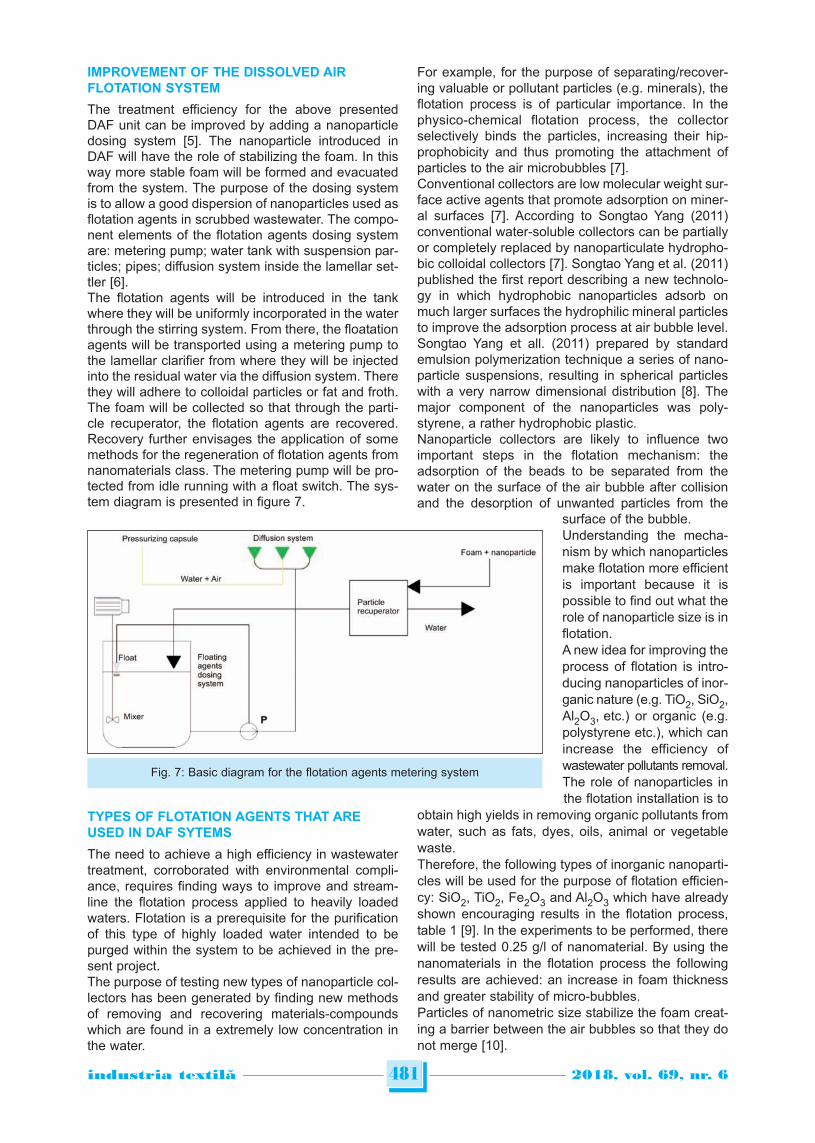
IMPROVEMENT OF THE DISSOLVED AIRFLOTATION SYSTEM
The treatment efficiency for the above presentedDAF unit can be improved by adding a nanoparticledosing system [5]. The nanoparticle introduced inDAF will have the role of stabilizing the foam. In thisway more stable foam will be formed and evacuatedfrom the system. The purpose of the dosing systemis to allow a good dispersion of nanoparticles used asflotation agents in scrubbed wastewater. The compo-nent elements of the flotation agents dosing systemare: metering pump; water tank with suspension par-ticles; pipes; diffusion system inside the lamellar set-tler [6].The flotation agents will be introduced in the tankwhere they will be uniformly incorporated in the waterthrough the stirring system. From there, the floatationagents will be transported using a metering pump tothe lamellar clarifier from where they will be injectedinto the residual water via the diffusion system. Therethey will adhere to colloidal particles or fat and froth.The foam will be collected so that through the parti-cle recuperator, the flotation agents are recovered.Recovery further envisages the application of somemethods for the regeneration of flotation agents fromnanomaterials class. The metering pump will be pro-tected from idle running with a float switch. The sys-tem diagram is presented in figure 7.
TYPES OF FLOTATION AGENTS THAT AREUSED IN DAF SYTEMS
The need to achieve a high efficiency in wastewatertreatment, corroborated with environmental compli-ance, requires finding ways to improve and stream-line the flotation process applied to heavily loadedwaters. Flotation is a prerequisite for the purificationof this type of highly loaded water intended to bepurged within the system to be achieved in the pre-sent project.The purpose of testing new types of nanoparticle col-lectors has been generated by finding new methodsof removing and recovering materials-compoundswhich are found in a extremely low concentration inthe water.
For example, for the purpose of separating/recover-ing valuable or pollutant particles (e.g. minerals), theflotation process is of particular importance. In thephysico-chemical flotation process, the collectorselectively binds the particles, increasing their hip-prophobicity and thus promoting the attachment ofparticles to the air microbubbles [7].Conventional collectors are low molecular weight sur-face active agents that promote adsorption on miner-al surfaces [7]. According to Songtao Yang (2011)conventional water-soluble collectors can be partiallyor completely replaced by nanoparticulate hydropho-bic colloidal collectors [7]. Songtao Yang et al. (2011)published the first report describing a new technolo-gy in which hydrophobic nanoparticles adsorb onmuch larger surfaces the hydrophilic mineral particlesto improve the adsorption process at air bubble level.Songtao Yang et all. (2011) prepared by standardemulsion polymerization technique a series of nano -particle suspensions, resulting in spherical particleswith a very narrow dimensional distribution [8]. Themajor component of the nanoparticles was poly -styrene, a rather hydrophobic plastic.Nanoparticle collectors are likely to influence twoimportant steps in the flotation mechanism: theadsorption of the beads to be separated from thewater on the surface of the air bubble after collisionand the desorption of unwanted particles from the
surface of the bubble.Understanding the mecha-nism by which nanoparticlesmake flotation more efficientis important because it ispossible to find out what therole of nanoparticle size is inflotation.A new idea for improving theprocess of flotation is intro-ducing nanoparticles of inor-ganic nature (e.g. TiO2, SiO2,Al2O3, etc.) or organic (e.g.polystyrene etc.), which canincrease the efficiency ofwastewater pollutants removal.The role of nanoparticles inthe flotation installation is to
obtain high yields in removing organic pollutants fromwater, such as fats, dyes, oils, animal or vegetablewaste.Therefore, the following types of inorganic nanoparti-cles will be used for the purpose of flotation efficien-cy: SiO2, TiO2, Fe2O3 and Al2O3 which have alreadyshown encouraging results in the flotation process,table 1 [9]. In the experiments to be performed, therewill be tested 0.25 g/l of nanomaterial. By using thenanomaterials in the flotation process the followingresults are achieved: an increase in foam thicknessand greater stability of micro-bubbles.Particles of nanometric size stabilize the foam creat-ing a barrier between the air bubbles so that they donot merge [10].
481industria textila 2018, vol. 69, nr. 6˘
Fig. 7: Basic diagram for the flotation agents metering system
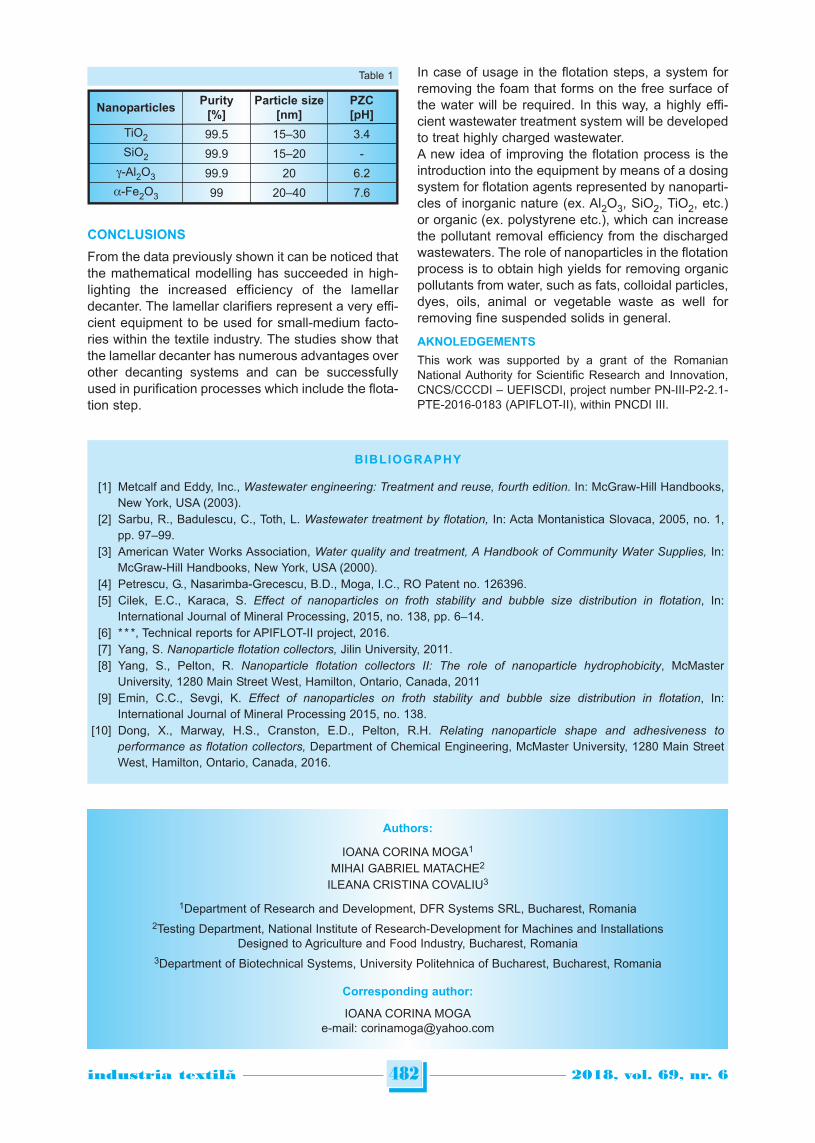
482industria textila 2018, vol. 69, nr. 6˘
CONCLUSIONS
From the data previously shown it can be noticed thatthe mathematical modelling has succeeded in high-lighting the increased efficiency of the lamellardecanter. The lamellar clarifiers represent a very effi-cient equipment to be used for small-medium facto-ries within the textile industry. The studies show thatthe lamellar decanter has numerous advantages overother decanting systems and can be successfullyused in purification processes which include the flota-tion step.
In case of usage in the flotation steps, a system forremoving the foam that forms on the free surface ofthe water will be required. In this way, a highly effi-cient wastewater treatment system will be developedto treat highly charged wastewater.A new idea of improving the flotation process is theintroduction into the equipment by means of a dosingsystem for flotation agents represented by nanoparti-cles of inorganic nature (ex. Al2O3, SiO2, TiO2, etc.)or organic (ex. polystyrene etc.), which can increasethe pollutant removal efficiency from the dischargedwastewaters. The role of nanoparticles in the flotationprocess is to obtain high yields for removing organicpollutants from water, such as fats, colloidal particles,dyes, oils, animal or vegetable waste as well forremoving fine suspended solids in general.
AKNOLEDGEMENTS
This work was supported by a grant of the RomanianNational Authority for Scientific Research and Innovation,CNCS/CCCDI – UEFISCDI, project number PN-III-P2-2.1-PTE-2016-0183 (APIFLOT-II), within PNCDI III.
Authors:
IOANA CORINA MOGA1
MIHAI GABRIEL MATACHE2
ILEANA CRISTINA COVALIU3
1Department of Research and Development, DFR Systems SRL, Bucharest, Romania2Testing Department, National Institute of Research-Development for Machines and Installations
Designed to Agriculture and Food Industry, Bucharest, Romania3Department of Biotechnical Systems, University Politehnica of Bucharest, Bucharest, Romania
Corresponding author:
IOANA CORINA MOGAe-mail: [email protected]
BIBLIOGRAPHY
[1] Metcalf and Eddy, Inc., Wastewater engineering: Treatment and reuse, fourth edition. In: McGraw-Hill Handbooks,New York, USA (2003).
[2] Sarbu, R., Badulescu, C., Toth, L. Wastewater treatment by flotation, In: Acta Montanistica Slovaca, 2005, no. 1,pp. 97–99.
[3] American Water Works Association, Water quality and treatment, A Handbook of Community Water Supplies, In:McGraw-Hill Handbooks, New York, USA (2000).
[4] Petrescu, G., Nasarimba-Grecescu, B.D., Moga, I.C., RO Patent no. 126396.[5] Cilek, E.C., Karaca, S. Effect of nanoparticles on froth stability and bubble size distribution in flotation, In:
International Journal of Mineral Processing, 2015, no. 138, pp. 6–14.[6] * * *, Technical reports for APIFLOT-II project, 2016.[7] Yang, S. Nanoparticle flotation collectors, Jilin University, 2011.[8] Yang, S., Pelton, R. Nanoparticle flotation collectors II: The role of nanoparticle hydrophobicity, McMaster
University, 1280 Main Street West, Hamilton, Ontario, Canada, 2011[9] Emin, C.C., Sevgi, K. Effect of nanoparticles on froth stability and bubble size distribution in flotation, In:
International Journal of Mineral Processing 2015, no. 138.[10] Dong, X., Marway, H.S., Cranston, E.D., Pelton, R.H. Relating nanoparticle shape and adhesiveness to
performance as flotation collectors, Department of Chemical Engineering, McMaster University, 1280 Main StreetWest, Hamilton, Ontario, Canada, 2016.
NanoparticlesPurity
[%]Particle size
[nm]PZC[pH]
TiO2 99.5 15–30 3.4SiO2 99.9 15–20 -
g-Al2O3 99.9 20 6.2
a-Fe2O3 99 20–40 7.6
Table 1
INTRODUCTION
The remarkable advances in technological develop-ment and innovation, which in recent years haveoccurred rapidly, influenced the organization andstrategies in competitive environment. The revolution of knowledge has been identified, acomplex process of transition from the physical-driv-en economy to the intangible based one, intellectualresources (knowledge packages, human and infor-mational capital). This approach plays an essentialstrategic role, being the engine of competitiveness.
It is known that, regardless of the field of activity,social welfare and added value is ensured through asystematic generation and efficient exploitation ofknowledge. Thus, among developed countries, thetrend is the development of national systems withcomplex international interactions, called by the spe-cialists: “triangles of knowledge”. The triangle ofknowledge, consisting of education, research andinnovation, is realized through cooperation betweeneducation institutions, research organizations and thebusiness environment. Of these, the highest degree
Textile & clothing clusters – sustainable development driveof the Romanian economy
SABINA OLARU MIRELA GRETI PUIUCATALIN GROSU SANDA-MIRELA BOGYOEFTALEA CĂRPUȘ SORINA LUMINIȚA BUCURAȘPYERINA CARMEN GHIȚULEASA
REZUMAT – ABSTRACT
Clustere din domeniul textile-confecții – motor de dezvoltare sustenabilă a economiei românești
Tendința, în rândul țărilor dezvoltate, este dezvoltarea de sisteme naționale cu interacțiuni internaționale complexe,numite de specialiști “triunghiuri ale cunoașterii”. Triunghiul cunoașterii, constituit din educație, cercetare și inovare, seconcretizează prin cooperarea dintre instituțiile de educație, organizațiile de cercetare și mediul de afaceri.Importanța clusterelor privind creșterea competitivității regionale derivă din faptul că afacerile co-localizate crescproductivitatea companiilor, conduc la crearea de locuri de muncă, stimulează inovația, stimulează formarea de noiafaceri și sprijină supraviețuirea și dezvoltarea întreprinderilor mici. Această lucrare prezintă elemente pentru definireaclusterelor românești implicate în domeniul textile-confecții şi analiza activității acestora. Conform MinisteruluiEconomiei, în Romȃnia, sunt înregistrate 4 clustere în domeniul textile-confecții, prezentate pe regiuni de dezvoltare. Pentru o imagine detaliată privind activitatea clusterelor românești de textile-confecții, a fost realizată analiza indica -torilor economici ai acestora în perioada 2012-2016. Cifra de afaceri realizată de întreprinderile de textile-confecții dincadrul celor 4 clustere a fost, în 2016, de cca. 1,19 miliarde lei, angajând un personal de circa 7078 persoane. Clustereleau potențial de a crea ecosisteme favorabile inovării pentru întărirea grupurilor de IMM-uri în care nevoile acestora săfie mai bine exploatate, ca mijloc de promovare a creșterii economice.
Cuvinte-cheie: cluster, textile, confecții, sustenabilitate
Textile & clothing clusters – sustainable development drive of the Romanian economy
The tendency among developed countries is the development of national systems with complex internationalinteractions, called by the specialists: “triangles of knowledge”. The triangle of knowledge, consisting of education,research and innovation, is realized through cooperation between education institutions, research organizations and thebusiness environment.The importance of clusters to increase regional competitiveness comes from the fact that co-located businessesincrease company productivity, lead to job creation, stimulate innovation, stimulate new business formation and supportthe survival and growth of small businesses.This paper presents elements for defining the Romanian clusters involved in textile & clothing sector and their activityanalysis.According to the Ministry of Economy, in Romania there are 4 clusters in the textile & clothing sector, presented bydevelopment regions. For a detailed view of the Romanian textile & clothingclusters activity, the analysis of their economic indicators duringthe period 2012-2016 was carried out. The turnover achieved by the textile & clothing enterprises part of the four clusterswas in 2016 of 1.19 billionRON, employing a staff of about 7078 employees.Clusters have the potential to create innovation-friendly ecosystems to strengthen SME clusters to better exploit theirneeds as a means of promoting economic growth.
Keywords: cluster, textile, clothing, sustainability
483industria textila 2018, vol. 69, nr. 6˘

of complexity, which raises the most problems (spe-cific policies, the well prepared human resource, thefinancial resources needed to be allocated) is theinnovation.Innovation is a function of many variables due to therole it plays as a link element (bridge betweenresearch and industry). Reducing development timein the innovative products and services implementedin the industry is driving the acceleration of the eco-nomic circuit and thus increasing the satisfaction ofthe final user. Thus, the innovative process does notend with the implementation of new products and ser-vices in the industry, but it is continuously developing,step by step. Assimilation of the innovative processand ensuring cooperation between education institu-tions, research organizations and industry representthe environment of economic clusters.Clusters appear naturally and reflect the uniqueassets and core competencies of a given region, thatcreate unique competitive advantages for specificindustries. Companies that are affiliated to a clusterstructure have the benefit of visibility and sharing oftangible and intangible resources.This paper presents elements for defining theRomanian clusters involved in textile & clothing sec-tor and their activity analysis.
CLUSTER DEVELOPMENT FACTORS
The cluster concept means an organized, legally reg-istered structure, made up of independent partners(enterprises, research organizations, universities,public authorities, nonprofit organizations, consultan-cy firms, commerce chambers, training centers, etc.),in order to increase the competitiveness of the group,by developing the production of innovative goods(technologies, products, processes) based on thecooperative innovation activities within the group,including through shared use of resources, as well asthrough the exchange and/or transfer of specializedknowledge [1].Clusters include tightly linked and interconnectedindustrial operators operating in a certain geographicarea. Companies operating in a cluster are connect-ed through a common workforce, supply chain, cus-tomers or technology. Each cluster includes busi-nesses and industry as well as companies thatsupport them, which is a mutually beneficial businessecosystem.The importance of clusters for increasing regionalcompetitiveness stems from the fact that co-locatedbusinesses have the following attributes:– increase company productivity;– lead to job creation;– stimulate innovation;– stimulate new business formation;– support the survival and growth of small businesses.Clusters create synergies, and they lead to the cre-ation of competitive advantages best illustrated byeconomist Michael Porter [2–3], stating that the eco-nomic success of a cluster depends on the complex
interaction of factors such as enterprise demand,strategy and competition, production factors, supplychains, and horizontal integration, interconnectedinto a structure known as Porter’s Diamond (figure 1). The Porter’s Diamond factor conditions are: materialresources; human resources (labour costs, qualifica-tions and commitment); knowledge resources; infras-tructure; quality of research; liquidity on stock market;natural resources [4–5].The relation between the related and supportingindustries (suppliers) leads to sharing of know-howand encouraging each other by producing comple-mentary products.The demand conditions depend on the homedemands (buyer needs, composition); size of themarket (sophistication of the demands); early satura-tion. These generate a pressure that constantlyimproves the enterprise competitiveness [4–5].The enterprise strategy, structure and right balancebetween benefits and cost associated with globaliza-tion are dynamic conditions, whichon actual directmarket competition, impels the enterprise to work forincreasing its productivity and innovation [4–5].The government acts as a catalyst and challengerstimulating early demands for advanced products andservices. The chance provides many advantages forthe enterprises ready to start up new operations [5].
This model plays a critical role in driving innovationsand improving the competitive advantage of compa-nies, in terms of internationalization [6].Clusters are catalysts for economic growth by provid-ing a framework to organize disparate local andregional public policies and investment orientedtowards economic development. Achieving this goalrequires a number of factors that are closely linked(figure 2) [7].Small and medium-sized enterprises (SMEs) providecrucial industrial links to trigger a broad-based indus-trial chain reaction. Without these SMEs, as contrib-utors, industrial growth in developing countries maynot be able to maintain an increase in domesticvalue, employment, productivity and industrial link-ages [8]. In this context, innovative regional clusters
484industria textila 2018, vol. 69, nr. 6˘
Fig. 1. The main factors that determine the competitiveadvantage – Porter’s Diamond [4–5]
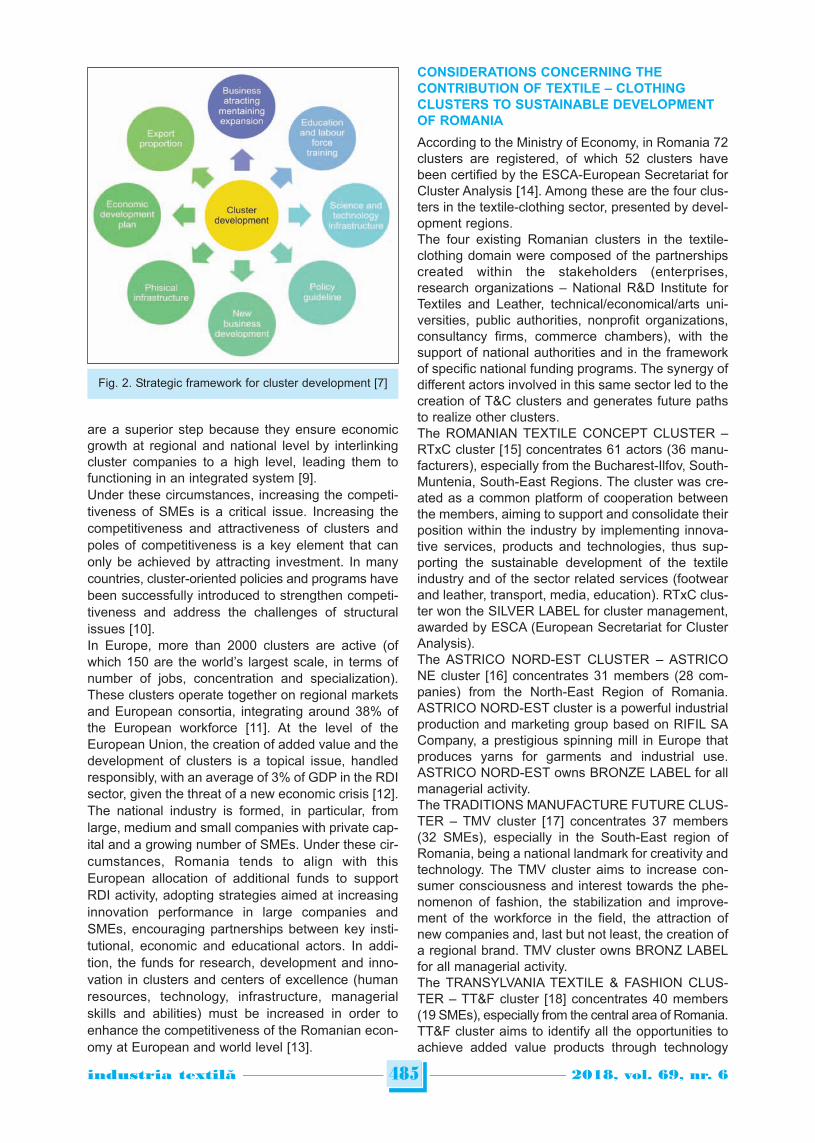
are a superior step because they ensure economicgrowth at regional and national level by interlinkingcluster companies to a high level, leading them tofunctioning in an integrated system [9].Under these circumstances, increasing the competi-tiveness of SMEs is a critical issue. Increasing thecompetitiveness and attractiveness of clusters andpoles of competitiveness is a key element that canonly be achieved by attracting investment. In manycountries, cluster-oriented policies and programs havebeen successfully introduced to strengthen competi-tiveness and address the challenges of structuralissues [10].In Europe, more than 2000 clusters are active (ofwhich 150 are the world’s largest scale, in terms ofnumber of jobs, concentration and specialization).These clusters operate together on regional marketsand European consortia, integrating around 38% ofthe European workforce [11]. At the level of theEuropean Union, the creation of added value and thedevelopment of clusters is a topical issue, handledresponsibly, with an average of 3% of GDP in the RDIsector, given the threat of a new economic crisis [12].The national industry is formed, in particular, fromlarge, medium and small companies with private cap-ital and a growing number of SMEs. Under these cir-cumstances, Romania tends to align with thisEuropean allocation of additional funds to supportRDI activity, adopting strategies aimed at increasinginnovation performance in large companies andSMEs, encouraging partnerships between key insti-tutional, economic and educational actors. In addi-tion, the funds for research, development and inno-vation in clusters and centers of excellence (humanresources, technology, infrastructure, managerialskills and abilities) must be increased in order toenhance the competitiveness of the Romanian econ-omy at European and world level [13].
CONSIDERATIONS CONCERNING THECONTRIBUTION OF TEXTILE – CLOTHINGCLUSTERS TO SUSTAINABLE DEVELOPMENTOF ROMANIA
According to the Ministry of Economy, in Romania 72clusters are registered, of which 52 clusters havebeen certified by the ESCA-European Secretariat forCluster Analysis [14]. Among these are the four clus-ters in the textile-clothing sector, presented by devel-opment regions.The four existing Romanian clusters in the textile-clothing domain were composed of the partnershipscreated within the stakeholders (enterprises,research organizations – National R&D Institute forTextiles and Leather, technical/economical/arts uni-versities, public authorities, nonprofit organizations,consultancy firms, commerce chambers), with thesupport of national authorities and in the frameworkof specific national funding programs. The synergy ofdifferent actors involved in this same sector led to thecreation of T&C clusters and generates future pathsto realize other clusters.The ROMANIAN TEXTILE CONCEPT CLUSTER –RTxC cluster [15] concentrates 61 actors (36 manu-facturers), especially from the Bucharest-Ilfov, South-Muntenia, South-East Regions. The cluster was cre-ated as a common platform of cooperation betweenthe members, aiming to support and consolidate theirposition within the industry by implementing innova-tive services, products and technologies, thus sup-porting the sustainable development of the textileindustry and of the sector related services (footwearand leather, transport, media, education). RTxC clus-ter won the SILVER LABEL for cluster management,awarded by ESCA (European Secretariat for ClusterAnalysis).The ASTRICO NORD-EST CLUSTER – ASTRICONE cluster [16] concentrates 31 members (28 com-panies) from the North-East Region of Romania.ASTRICO NORD-EST cluster is a powerful industrialproduction and marketing group based on RIFIL SACompany, a prestigious spinning mill in Europe thatproduces yarns for garments and industrial use.ASTRICO NORD-EST owns BRONZE LABEL for allmanagerial activity.The TRADITIONS MANUFACTURE FUTURE CLUS-TER – TMV cluster [17] concentrates 37 members(32 SMEs), especially in the South-East region ofRomania, being a national landmark for creativity andtechnology. The TMV cluster aims to increase con-sumer consciousness and interest towards the phe-nomenon of fashion, the stabilization and improve-ment of the workforce in the field, the attraction ofnew companies and, last but not least, the creation ofa regional brand. TMV cluster owns BRONZ LABELfor all managerial activity.The TRANSYLVANIA TEXTILE & FASHION CLUS-TER – TT&F cluster [18] concentrates 40 members(19 SMEs), especially from the central area of Romania.TT&F cluster aims to identify all the opportunities toachieve added value products through technology
485industria textila 2018, vol. 69, nr. 6˘
Fig. 2. Strategic framework for cluster development [7]

transfer and applied research. The TT&F clusterowns BRONZ LABEL for all managerial activity.For a detailed view of the activity of the Romanianclusters involved in textile & clothing sector, the anal-ysis of their economic indicators during the period2012–2016 was carried out. Figure 3 shows the evo-lution of the turnover indicator for each of theRomanian textile & clothing clusters (figure 3, a –RTxC cluster, figure 3, b – ASTRICO NE cluster, fig-ure 3, c – TMV cluster and figure 3, d – TT&F cluster).The values presented in the figure 3 represent theaggregate value of the turnover only for the produc-ing enterprises, representing the business environ-ment.Depending on the economic evolution of the mem-bers, the clusters record different values for the tur-nover during the analyzed period.It is worth mentioning that these clusters, which are areaction to the market demands and the capitaliza-tion of the interconnections between the companiesin the “activity area”, can be considered central pillarsof the local development.It is noted that the highest value of this indicator isrecorded by the ASTRICO NE cluster, over the entireperiod considered for the analysis (2012–2016).
The total turnover (of the 4 Romanian textiles & cloth-ing clusters) has a positive evolution, with a maxi-mum of 49.8% in 2014, compared to 2013 (figure 4).The turnover of the enterprises within the fourRomanian textile & clothing clusters was 1.19 billionRON in 2016.In terms of the number of employees, the RTxC clus-ter recorded a minimum in 2014 of 2754 people, in
486industria textila 2018, vol. 69, nr. 6˘
Fig. 3. Turnover evolution in RON during 2012-2016: a – RTxC; b – ASTRICO NE; c – TMV; d – TT&F
a b
c d
Fig. 4. Turnover evolution for the 4 Romanian textile &clothing clusters
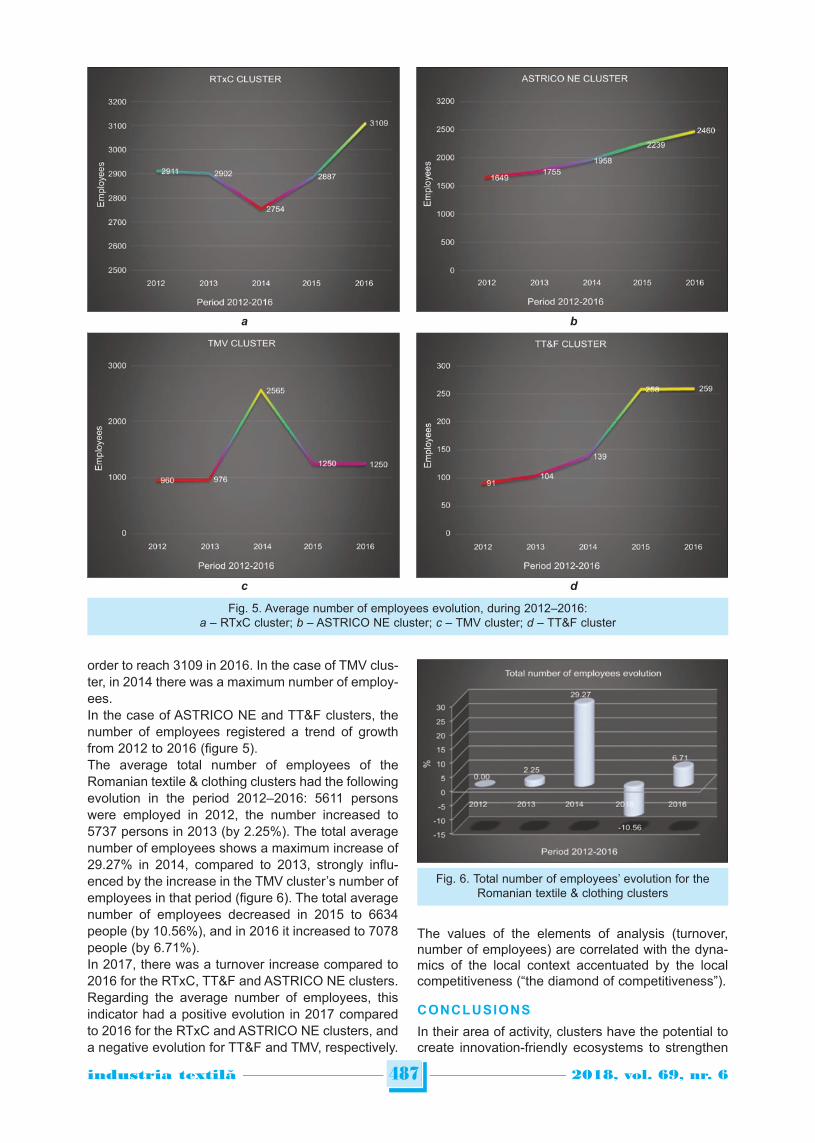
order to reach 3109 in 2016. In the case of TMV clus-ter, in 2014 there was a maximum number of employ-ees. In the case of ASTRICO NE and TT&F clusters, thenumber of employees registered a trend of growthfrom 2012 to 2016 (figure 5).The average total number of employees of theRomanian textile & clothing clusters had the followingevolution in the period 2012–2016: 5611 personswere employed in 2012, the number increased to5737 persons in 2013 (by 2.25%). The total averagenumber of employees shows a maximum increase of29.27% in 2014, compared to 2013, strongly influ-enced by the increase in the TMV cluster’s number ofemployees in that period (figure 6). The total averagenumber of employees decreased in 2015 to 6634people (by 10.56%), and in 2016 it increased to 7078people (by 6.71%).In 2017, there was a turnover increase compared to2016 for the RTxC, TT&F and ASTRICO NE clusters.Regarding the average number of employees, thisindicator had a positive evolution in 2017 comparedto 2016 for the RTxC and ASTRICO NE clusters, anda negative evolution for TT&F and TMV, respectively.
The values of the elements of analysis (turnover,number of employees) are correlated with the dyna-mics of the local context accentuated by the localcompetitiveness (“the diamond of competitiveness”).
CONCLUSIONS
In their area of activity, clusters have the potential tocreate innovation-friendly ecosystems to strengthen
487industria textila 2018, vol. 69, nr. 6˘
Fig. 5. Average number of employees evolution, during 2012–2016:a – RTxC cluster; b – ASTRICO NE cluster; c – TMV cluster; d – TT&F cluster
a b
c d
Fig. 6. Total number of employees’ evolution for theRomanian textile & clothing clusters
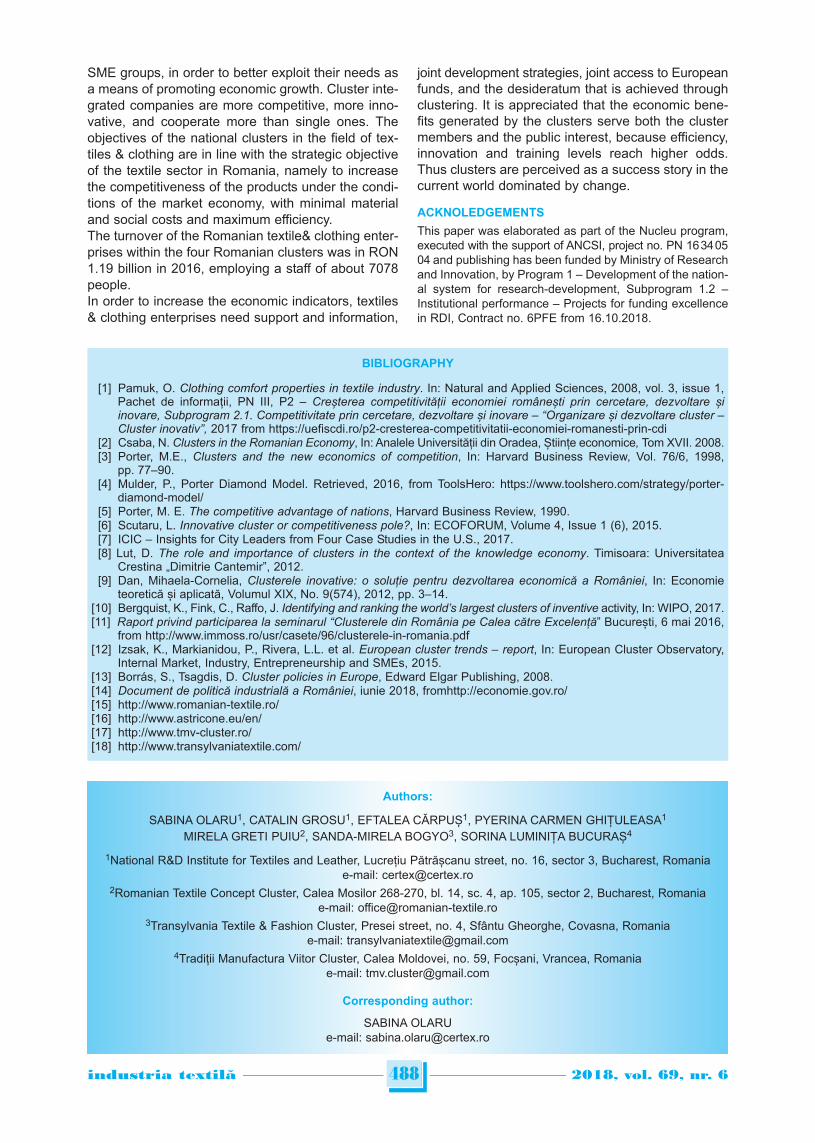
SME groups, in order to better exploit their needs asa means of promoting economic growth. Cluster inte-grated companies are more competitive, more inno-vative, and cooperate more than single ones. Theobjectives of the national clusters in the field of tex-tiles & clothing are in line with the strategic objectiveof the textile sector in Romania, namely to increasethe competitiveness of the products under the condi-tions of the market economy, with minimal materialand social costs and maximum efficiency.The turnover of the Romanian textile& clothing enter-prises within the four Romanian clusters was in RON1.19 billion in 2016, employing a staff of about 7078people.In order to increase the economic indicators, textiles& clothing enterprises need support and information,
joint development strategies, joint access to Europeanfunds, and the desideratum that is achieved throughclustering. It is appreciated that the economic bene-fits generated by the clusters serve both the clustermembers and the public interest, because efficiency,innovation and training levels reach higher odds.Thus clusters are perceived as a success story in thecurrent world dominated by change.
ACKNOLEDGEMENTS
This paper was elaborated as part of the Nucleu program,executed with the support of ANCSI, project no. PN 16 34 0504 and publishing has been funded by Ministry of Researchand Innovation, by Program 1 – Development of the nation-al system for research-development, Subprogram 1.2 –Institutional performance – Projects for funding excellencein RDI, Contract no. 6PFE from 16.10.2018.
488industria textila 2018, vol. 69, nr. 6˘
BIBLIOGRAPHY
[1] Pamuk, O. Clothing comfort properties in textile industry. In: Natural and Applied Sciences, 2008, vol. 3, issue 1,Pachet de informații, PN III, P2 – Creșterea competitivității economiei românești prin cercetare, dezvoltare șiinovare, Subprogram 2.1. Competitivitate prin cercetare, dezvoltare și inovare – “Organizare și dezvoltare cluster –Cluster inovativ”, 2017 from https://uefiscdi.ro/p2-cresterea-competitivitatii-economiei-romanesti-prin-cdi
[2] Csaba, N. Clusters in the Romanian Economy, In: Analele Universității din Oradea, Științe economice, Tom XVII. 2008.[3] Porter, M.E., Clusters and the new economics of competition, In: Harvard Business Review, Vol. 76/6, 1998,
pp. 77–90.[4] Mulder, P., Porter Diamond Model. Retrieved, 2016, from ToolsHero: https://www.toolshero.com/strategy/porter-
diamond-model/ [5] Porter, M. E. The competitive advantage of nations, Harvard Business Review, 1990.[6] Scutaru, L. Innovative cluster or competitiveness pole?, In: ECOFORUM, Volume 4, Issue 1 (6), 2015.[7] ICIC – Insights for City Leaders from Four Case Studies in the U.S., 2017.[8] Lut, D. The role and importance of clusters in the context of the knowledge economy. Timisoara: Universitatea
Crestina „Dimitrie Cantemir”, 2012.[9] Dan, Mihaela-Cornelia, Clusterele inovative: o soluție pentru dezvoltarea economică a României, In: Economie
teoretică și aplicată, Volumul XIX, No. 9(574), 2012, pp. 3–14.[10] Bergquist, K., Fink, C., Raffo, J. Identifying and ranking the world’s largest clusters of inventive activity, In: WIPO, 2017.[11] Raport privind participarea la seminarul “Clusterele din România pe Calea către Excelență” București, 6 mai 2016,
from http://www.immoss.ro/usr/casete/96/clusterele-in-romania.pdf[12] Izsak, K., Markianidou, P., Rivera, L.L. et al. European cluster trends – report, In: European Cluster Observatory,
Internal Market, Industry, Entrepreneurship and SMEs, 2015.[13] Borrás, S., Tsagdis, D. Cluster policies in Europe, Edward Elgar Publishing, 2008.[14] Document de politică industrială a României, iunie 2018, fromhttp://economie.gov.ro/[15] http://www.romanian-textile.ro/[16] http://www.astricone.eu/en/[17] http://www.tmv-cluster.ro/[18] http://www.transylvaniatextile.com/
Authors:
SABINA OLARU1, CATALIN GROSU1, EFTALEA CĂRPUȘ1, PYERINA CARMEN GHIȚULEASA1
MIRELA GRETI PUIU2, SANDA-MIRELA BOGYO3, SORINA LUMINIȚA BUCURAȘ4
1National R&D Institute for Textiles and Leather, Lucrețiu Pătrășcanu street, no. 16, sector 3, Bucharest, Romaniae-mail: [email protected]
2Romanian Textile Concept Cluster, Calea Mosilor 268-270, bl. 14, sc. 4, ap. 105, sector 2, Bucharest, Romaniae-mail: [email protected]
3Transylvania Textile & Fashion Cluster, Presei street, no. 4, Sfântu Gheorghe, Covasna, Romaniae-mail: [email protected]
4Tradiții Manufactura Viitor Cluster, Calea Moldovei, no. 59, Focșani, Vrancea, Romaniae-mail: [email protected]
Corresponding author:
SABINA OLARUe-mail: [email protected]
INTRODUCTION
The textile industry represents an important branch ofthe processing industry and is significant for theeconomy of a country. In the new era, the textileindustry began to expand faster in the 18th century.The textile industry in Serbia has a long tradition andis one of the most important branches of the pro-cessing industry [1]. It belongs to the traditionalbranches of the processing industry. As a rule, itemploys a large number of low-cost and low-skilled,mostly female laborers, whose work is paid muchless than in the other branches of the processingindustry. The social aspect of this branch is, there-fore, extremely important for all countries. The textileindustry is the most global industry in the world, withas many as 26 million employees, which amounts to15% of the world’s industrial workforce. The share ofthe social product of the textile industry in industry in
1990 was 10.06%, and in 1999, it was 6.8%. In theglobal context, this branch has undergone majorchanges since 1970, which coincides with the struc-tural crises in developed countries, the globalizationprocess and the accelerated liberalization of worldtrade [2]. The period of the development of the textileindustry in the former Yugoslavia is referred to as the“golden age of the textile industry”. At that time, morethan 250,000 workers in the branch of the Republic ofSerbia were employed in over a hundred factories[1]. The difficult political situation of the 1990s and thesanctions led to a fall in the share of Serbian textilefactories in the market. After 2000, a very importantbranch of industry remained neglected. With theunsuccessful privatization process, almost all of theformer textile giants were closed. For many yearsnow, the unfavorable aspects of the textile enterpris-es market have reflected in a considerably low positionon the world markets, unattainable competitiveness,
The evaluation of websites in the textile industry by applyingISO/IEC 9126-4 standard and the EDAS method
DARJAN KARABASEVIC MLADJAN MAKSIMOVICDRAGISA STANUJKIC PAVLE BRZAKOVICMIODRAG BRZAKOVIC
REZUMAT – ABSTRACT
Evaluarea site-urilor web din industria textilă prin aplicarea standardului ISO/IEC 9126-4 și a metodei EDAS
În zilele noastre, companiile moderne realizează cea mai mare parte a comunicării cu consumatorii lor pe Internet, deobicei pentru a-și promova propriile produse și servicii. În prezent, nu există nicio companie care să nu își promovezeprodusele și serviciile prin intermediul internetului și al site-urilor web. Prin urmare, măsurarea calității unui site web estesemnificativă din punctul de vedere al companiei, pentru a menține avantajul competitiv pe termen lung; astfel, calitateasite-ului web a devenit un aspect de mare importanță. Lucrarea urmărește prezentarea unei noi abordări de luare adeciziilor cu mai multe criterii, împreună cu criteriile standardului de calitate ISO/IEC 9126-4 dedicate evaluării calitățiisite-urilor web din industria textilă. Abordarea propusă se axează pe utilizarea noii metode de Evaluarea Bazată peDistanța de la Soluția pe Termen Mediu (EDAS) pentru clasarea alternativelor, adică în cazul nostru site-urile web, în timp ce în scopul determinării ponderii, a fost aplicată metoda Analiza Raportului de Evaluare a Ponderii în Etape(SWARA). Pentru a demonstra utilitatea, eficiența și simplitatea, a fost realizat un exemplu numeric al evaluării site-urilorweb ale industriei textile din Serbia.
Cuvinte-cheie: calitatea site-ului web, industria textilă, evaluare, EDAS, MCDM
The evaluation of websites in the textile industry by applying ISO/IEC 9126-4 standard and the EDAS method
Nowadays, modern companies perform the largest part of their communications with their consumers over the Internet,usually in order to promote their own products and services. There are almost no companies today that do not promotetheir products and services through the Internet and websites. Therefore, measuring the quality of a website is significantfrom the company’s point of view in order to maintain the competitive advantage in the long run; thus, the quality of awebsite has become an area of great importance. This paper aims to present a new multiple-criteria decision-makingapproach, together with the “quality in use” ISO/IEC 9126-4 criteria devoted to the evaluation of the quality of websitesin the textile industry. The proposed approach is based on the use of the newly-developed Evaluation Based on Distancefrom Average Solution (EDAS) method for the ranking of alternatives, i.e. in our case websites, whereas for the purposeof determining the weights, the adapted Step-wise Weight Assessment Ratio Analysis (SWARA) method is applied. Inorder to demonstrate usability, efficiency and simplicity a numerical example of the evaluation of the websites of thetextile industry in Serbia is conducted.
Keywords: website quality, textile industry, evaluation, EDAS, MCDM
489industria textila 2018, vol. 69, nr. 6˘
obsolete equipment and technology, a drastic reduc-tion in educated human resources and the insufficienttraining of the existing employees [3]. Also, Bratucuet al. point out that strong competition in this industryhas forced companies to redirect their production todeveloping countries, which provide advantages fromthe aspect of legislative regulations, the policy, envi-ronmental protection regulations and, most impor-tantly, labor costs [4].An increasing and wider use of the Internet in every-day business has contributed to the development ofthe technological environment supportive of the inte-gration of computer resources into business andmanufacturing [5]. Today, the Internet represents aglobal multimedia distributed information systembecause it includes practically the whole world andallows not only access to the multimedia content dis-tributed into space, but also the generation of a cer-tain multimedia content based on the specific require-ments of the users in the interactive mode [6].Therefore, the Internet, as a global network, allowsconsumers to create an image of the actual value ofa particular product and its benefits, which wasimpossible in earlier times in the case of the domi-nance of the one-way media. Today, the Internetoffers companies a variety of web services, such aswebsites, to promote different content, products andservices. Also, Hodge and Cagle point out that, sincethe introduction of the Internet and e-commerce inthe mid-1990s, there has been a great deal of inter-ference with the impact it will have on how compa-nies operate and the changes in the global economyas a whole [7]. Lee and Kozar emphasize the factthat companies, due to increasing competition, arepaying special attention to the importance of the qual-ity of their websites in order to promote and/or selltheir products and services [8]. Thus, the quality ofthe websites has become crucial for the acquisition ofnew consumers, as has been confirmed in numerousstudies, such as: Al-Manasra et al. [9], Lin [10], Kimand Stoel [11], and so on.The quality of websites has become an area of greatimportance. The quality of services, consumer ser-vices and customer satisfaction play an importantrole in the success and survival of websites, andthese are the key elements a website should have inorder for it to achieve good results. Therefore, thequality of websites is significant from a company’spoint of view, in order for a company to maintain thecompetitive advantage in the long run. So far, theWebQual model has been most frequently used tomeasure the quality of the website service [12], whichis based on the principles of the SERVQUAL model[13]. On the other hand, official institutions in chargeof standards and standardization, such as the ISO(International Organization for Standardization), arevery seriously addressing the issue of quality anddefine the same as “the totality of characteristics ofan entity that bear on its ability to satisfy stated andimplied needs”. It is also important to state that theISO and the International Electrotechnical Commissionhave developed a metric for measuring and evaluating
a software product. Within the above organizations,Working Group 6 have developed ISO/IEC 9126-1(the quality model), 9126-2 (the external metrics),9126-3 (the internal metrics), and 9126-4 (the quali-ty-in-use metrics). These standards provide pragmat-ic guidance when it comes to the evaluation of soft-ware products [14–15]. Multiple-criteria decision-making methods (MCDM),as a part of operational research, are increasinglybeing used to solve a variety of problems. In duecourse of time, many MCDM methods have beenproposed, such as: the AHP, the ANP, COPRAS,ARAS, SWARA, and so on [16]. Also, MCDM meth-ods were successfully applied when the evaluation ofwebsites is concerned [17–21].Based on the previously stated, the newly-developedEDAS method and SWARA method will be used inthis paper in order to evaluate websites in the textileindustry in accordance with the ISO/IEC 9126-4“quality-in-use” criteria, namely: Effectiveness;Efficiency; Satisfaction; Freedom from risk, andContext coverage. Therefore, the paper is organizedas follows: Section 1 of this paper is the introduction.The methodology applied in the paper, more precise-ly the EDAS method, is presented in Section 2 andthe SWARA method, is presented in Section 3. InSection 4, a numerical example of a website evalua-tion is shown. Finally, the conclusions are given inSection 5.
THE EDAS METHOD
The EDAS (Evaluation Based on Distance fromAverage Solution) is developed by KeshavarzGhorabaee et al. [22]. The EDAS method has large-ly found its application, which is confirmed by variousextensions [23–36].The basic concepts of the EDAS method are the useof two distance measures, namely the PositiveDistance from Average (PDA) and the NegativeDistance from Average (NDA), and that the evalua-tion of alternatives is performed according to thehigher values of the PDA and the lower values of theNDA.Based on Stanujkic et al. [25], the computational pro-cedure of the EDAS method for a decision-makingproblem with m criteria and n alternatives can be pre-sented as follows:Step 1. Select the available alternatives, the mostimportant criteria that describe the alternatives, andconstruct the decision-making matrix X, shown as fol-lows:
x11 x12 … x1n
x21 x22 … x2nX =⋮ ⋮ ⋮ ⋮
, (1)
x1n x2n … xmn
where xij denotes the performance rating of the alter-native i on the criterion j.Step 2. Determine the average solution according toall of the criteria, shown as follows:
x*j = (x1, x2, …, xn), (2)
490industria textila 2018, vol. 69, nr. 6˘
where m
i=1 xijx*j = . (3) m
Step 3. Calculate the positive distance from the aver-age d+
i j and the negative distance from the averaged –i j , according to the type of the criteria (the benefitand the cost), shown as follows:
max(0,(xij – x*j )) ; j max+ x*j
dij = , (4)max(0,(x*j – xij )) ; j minx*j
max(0,(x*j – xij )) ; j max– x*j
dij = , (5)max(0,(xij – x*j )) ; j minx*j
where max and min denotes the set of the benefitcriteria and the cost criteria, respectively.Step 4. Determine the weighted sum of the PDA, Q+
i ,
and the weighted sum of the NDS, Q–i, for all of the
alternatives, as follows: n
+Q+i = wj dij , (6)
j=1
n –Q–i = wj dij . (7)
j=1
Step 5. Normalize the values of the weighted sum ofthe PDA and the weighted sum of the NDA for all ofthe alternatives, shown as follows:
Q+iS+
i = , (8)max Q+
ii
Q–iS–
i = 1 – , (9)max Q–i
i
where S+i and S–
i denote the normalized weightedsum of the PDA and the NDA, respectively.Step 6. Calculate the appraisal score Si for all of thealternatives, as follows:
1Si = (S+
i + S–i ). (10)
2Step 7. Rank the alternatives according to thedecreasing values of the appraisal score. The alter-native with the highest Si is the best choice amongthe candidate alternatives.
THE SWARA METHOD
The Step-wise Weight Assessment Ratio Analysis(SWARA) method was proposed by Kersuliene et al.[37]. The usability of the SWARA method has beenproven in solving many MCDM problems, of whichonly several are mentioned [38–42].
The SWARA method has a certain similarity with theprominent AHP method. However, the computationalprocedures of the SWARA and the AHP methods sig-nificantly differ from one another. The requirement that evaluation criteria should besorted in descending order according to their expect-ed significances can be mentioned as the weaknessof the SWARA method, when it is compared with theAHP method. Therefore Stanujkic et al. proposed theuse of the following equation for determining the impor-tance of criteria as follows [43]:
1 when Cj ≻ Cj–1sj = 1 when Cj = Cj–1 . (11)
1 when Cj ≺ Cj–1
where: sj denotes the comparative importance of thecriterion j, and Cj Cj–1 denotes the significance ofthe criterion j in relation to the j–1 criterion.Because of the above mentioned, the computationalprocedure of the adapted SWARA method, used inthis article, could be precisely expressed by using thefollowing steps:Step 1. Choose the criteria on the basis of which anevaluation of alternatives will be carried out.Step 2. Set the value of the relative importance of thecriteria by using Eq. (11), starting from the second cri-terion. For the first criterion, the value of the relativeimportance of the criteria should be set to 1.Step 3. Calculate the coefficient kj for the criterion jas follows:
kj = 2 – sj . (12)
Step 4. Calculate the recalculated weight qj for the
criterion j as follows:1 if j = 1
qj = qj–1 . (13) when j 1kj
Step 5. Calculate the weights of the criteria as fol-lows:
qjwj = . (14)n
qkk=1
where wj denotes the weight of the criterion j.
A NUMERICAL EXAMPLE OF the WEBSITEEVALUATION IN THE TEXTILE INDUSTRY
In order to verify the proposed approach, a researchstudy related to the quality of the websites of the fourtextile companies in Serbia was conducted.In this case, the evaluation of the four websites wasperformed, namely: A1 – http://www.spartan.rs/;A2 – http://edi.rs; A3 – http://www.elipsa.rs/ andA4 – http://www.panter.co.rs/. On the other hand, the evaluation of the above web-sites was carried out in relation to the following “qual-ity-in-use” criteria: C1 – Effectiveness; C2 – Efficiency;C3 – Satisfaction; C4 – Freedom from risk, and C5 –Context coverage.
491industria textila 2018, vol. 69, nr. 6˘
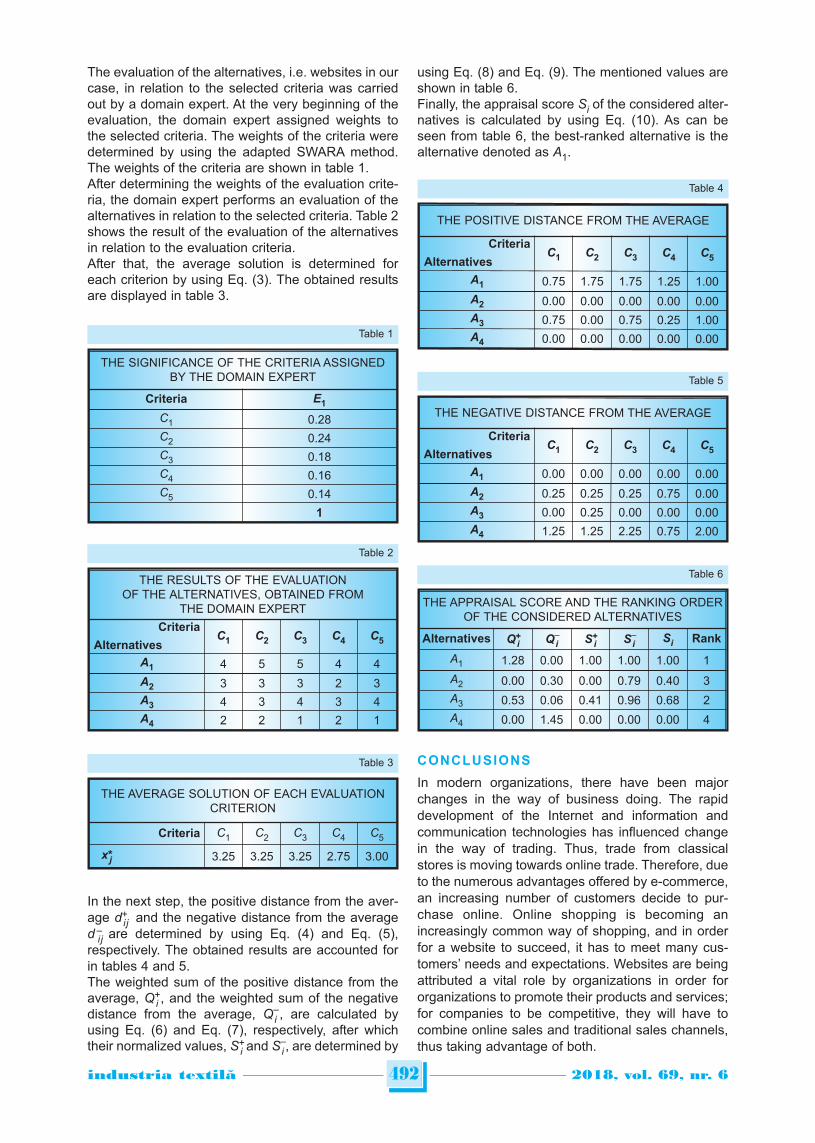
The evaluation of the alternatives, i.e. websites in ourcase, in relation to the selected criteria was carriedout by a domain expert. At the very beginning of theevaluation, the domain expert assigned weights tothe selected criteria. The weights of the criteria weredetermined by using the adapted SWARA method.The weights of the criteria are shown in table 1. After determining the weights of the evaluation crite-ria, the domain expert performs an evaluation of thealternatives in relation to the selected criteria. Table 2shows the result of the evaluation of the alternativesin relation to the evaluation criteria. After that, the average solution is determined foreach criterion by using Eq. (3). The obtained resultsare displayed in table 3.
In the next step, the positive distance from the aver-age d+
i j and the negative distance from the averaged –i j are determined by using Eq. (4) and Eq. (5),respectively. The obtained results are accounted forin tables 4 and 5.The weighted sum of the positive distance from theaverage, Q+
i , and the weighted sum of the negativedistance from the average, Q–
i , are calculated byusing Eq. (6) and Eq. (7), respectively, after whichtheir normalized values, S+
i and S–i , are determined by
using Eq. (8) and Eq. (9). The mentioned values areshown in table 6. Finally, the appraisal score Si of the considered alter-natives is calculated by using Eq. (10). As can beseen from table 6, the best-ranked alternative is thealternative denoted as A1.
CONCLUSIONS
In modern organizations, there have been majorchanges in the way of business doing. The rapiddevelopment of the Internet and information andcommunication technologies has influenced changein the way of trading. Thus, trade from classicalstores is moving towards online trade. Therefore, dueto the numerous advantages offered by e-commerce,an increasing number of customers decide to pur-chase online. Online shopping is becoming anincreasingly common way of shopping, and in orderfor a website to succeed, it has to meet many cus-tomers’ needs and expectations. Websites are beingattributed a vital role by organizations in order fororganizations to promote their products and services;for companies to be competitive, they will have tocombine online sales and traditional sales channels,thus taking advantage of both.
492industria textila 2018, vol. 69, nr. 6˘
THE SIGNIFICANCE OF THE CRITERIA ASSIGNEDBY THE DOMAIN EXPERT
Criteria E1
C1 0.28C2 0.24C3 0.18C4 0.16C5 0.14
1
Table 1
THE APPRAISAL SCORE AND THE RANKING ORDEROF THE CONSIDERED ALTERNATIVES
Alternatives Q+i Q–
i S+i S–
iSi Rank
A1 1.28 0.00 1.00 1.00 1.00 1
A2 0.00 0.30 0.00 0.79 0.40 3A3 0.53 0.06 0.41 0.96 0.68 2A4 0.00 1.45 0.00 0.00 0.00 4
Table 6THE RESULTS OF THE EVALUATIONOF THE ALTERNATIVES, OBTAINED FROM
THE DOMAIN EXPERT
Criteria
AlternativesC1 C2 C3 C4 C5
A1 4 5 5 4 4A2 3 3 3 2 3A3 4 3 4 3 4A4 2 2 1 2 1
Table 2
THE POSITIVE DISTANCE FROM THE AVERAGE
Criteria
AlternativesC1 C2 C3 C4 C5
A1 0.75 1.75 1.75 1.25 1.00A2 0.00 0.00 0.00 0.00 0.00A3 0.75 0.00 0.75 0.25 1.00A4 0.00 0.00 0.00 0.00 0.00
Table 4
THE NEGATIVE DISTANCE FROM THE AVERAGE
Criteria
AlternativesC1 C2 C3 C4 C5
A1 0.00 0.00 0.00 0.00 0.00A2 0.25 0.25 0.25 0.75 0.00A3 0.00 0.25 0.00 0.00 0.00A4 1.25 1.25 2.25 0.75 2.00
Table 5
THE AVERAGE SOLUTION OF EACH EVALUATIONCRITERION
Criteria C1 C2 C3 C4 C5
x*j 3.25 3.25 3.25 2.75 3.00
Table 3
A new approach to the evaluation and ranking ofwebsites in the textile industry is the subject matter ofconsideration in this paper. The proposed approachis based on the use of the EDAS method for theselection of the alternative, i.e. websites, whereasthe “quality-in-use” ISO/IEC 9126-4 criteria wereused to evaluate the websites. After the presented
numerical example of the evaluation of the websitesin the textile industry, the alternative denoted as A1 isthe best-ranked in terms of the evaluation criteria. Theusability, effectiveness, simplicity, applicability andadaptivity of the proposed approach is tested and ver-ified in the considered numerical example regardingthe evaluation of the websites in the textile industry.
493industria textila 2018, vol. 69, nr. 6˘
BIBLIOGRAPHY
[1] Petrović, G., Urošević, S., Karabašević, D., Maksimović, M. (2017). State and perspectives of textile industrydevelopment in Serbia. In: Tekstilna industrija, 2017, vol. 65, issue 3, pp. 4–8.
[2] Urošević, S., Đorđević, D., Cvijanović, J. M. Značaj doradnih poslova za razvoj tekstilne i odevne industrija Srbijeu procesu tranzicije. In: Industrija, 2009, vol. 37, issue 2, pp. 97–125.
[3] Krstić, J. Integration companies in Serbian textile industry clusters to increase performance. In: Tekstilna industrija,2016, vol. 64, issue 1, pp. 46–52.
[4] Bratucu, G., Epuran, G., Gârdan, D. A., Bumbas, F., Zamfirache, A., Gârdan, I. P. The evolution of textile andclothing industry in Romania: an analysis from the perspective of imports and exports determinants/Evolutiaindustriei textile si de confectii din România: analiza din perspectiva determinantilor. In: Industria Textila, 2017, vol.68, issue 2, pp. 147–155.
[5] Ghiassi, M., Spera, C. Defining the Internet-based supply chain system for mass customized markets. In:Computers & Industrial Engineering, 2003, vol. 45, issue 1, pp. 17–41.
[6] Mihajlović, M. Marketing e-kastemerizacije i razvoj Interneta – Srbija. In: Sinteza 2014-Impact of the Internet onBusiness Activities in Serbia and Worldwide, 2014, pp. 101–104.
[7] Hodge, G., Cagle, C. Business-to-business e-business models: classification and textile industry implications. In:AUTEX Research Journal, 2004, vol. 4, issue 4, pp. 211–227.
[8] Lee, Y., Kozar, K. A. Investigating the effect of website quality on e-business success: An analytic hierarchy process(AHP) approach. In: Decision support systems, 2006, vol. 42, issue 3, pp. 1383–1401.
[9] Al-Manasra, E., Khair, M., Zaid, S. A., Taher Qutaishat, F. Investigating the impact of website quality on consumers’satisfaction in Jordanian telecommunication sector. In: Arab Economic and Business Journal, 2013, vol. 8, issue1-2, pp. 31–37.
[10] Lin, H. F. The impact of website quality dimensions on customer satisfaction in the B2C e-commerce context. In:Total Quality Management and Business Excellence, 2007, vol. 18, issue 4, pp. 363–378.
[11] Kim, S., Stoel, L. Apparel retailers: website quality dimensions and satisfaction. In: Journal of Retailing andConsumer Services, 2004, pp. vol. 11, issue 2, pp. 109–117.
[12] Barnes, S. J., Vidgen, R. An evaluation of cyber-bookshops: the WebQual method. In: International Journal ofElectronic Commerce, 2001, vol. 6, issue 1, pp. 11–30.
[13] Parasuraman, A., Zeithaml, V. A., Berry, L. L. A conceptual model of service quality and its implications for futureresearch. In: the Journal of Marketing, 1985, pp. 41–50.
[14] Jung, H. W., Kim, S. G., Chung, C. S. Measuring software product quality: A survey of ISO/IEC 9126. In: IEEEsoftware, 2004, vol. 21, issue 5, pp. 88–92.
[15] Azuma, M. SQuaRE: the next generation of the ISO/IEC 9126 and 14598 international standards series on softwareproduct quality. In: ESCOM European Software Control and Metrics conference, 2001, pp. 337–346.
[16] Karabasevic, D., Zavadskas, E. K., Turskis, Z., Stanujkic, D. The framework for the selection of personnel based onthe SWARA and ARAS methods under uncertainties. In: Informatica, 2016, vol. 27, issue 1, pp. 49–65.
[17] Yu, X., Guo, S., Guo, J., Huang, X. Rank B2C e-commerce websites in e-alliance based on AHP and fuzzyTOPSIS. In: Expert Systems with Applications, 2011, vol. 38, issue 4, pp. 3550–3557.
[18] Akincilar, A., Dagdeviren, M. A hybrid multi-criteria decision making model to evaluate hotel websites. In:International Journal of Hospitality Management, 2014, vol. 36, pp. 263–271.
[19] Chung, Y. F., Liu, S. H., Wang, C. H., Pang, C. T. Applying fuzzy MCDM methods to the evaluation on portal websiteservice quality. In: The SIJ Transactions on Computer Science Engineering & its Applications, 2015, vol. 3, pp. 8–15.
[20] Stanujkic, D., Zavadskas, E. K., Tamosaitiene, J. An approach to measuring website quality in the rural tourismindustry based on Atanassov intuitionistic fuzzy sets. In: E+M Ekonomie a Management, 2015, vol. 18, issue 4,pp. 84–199.
[21] Liang, R., Wang, J., Zhang, H. Evaluation of e-commerce websites: An integrated approach under a single-valuedtrapezoidal neutrosophic environment. In: Knowledge-Based Systems, 2017, issue 135, pp. 44–59.
[22] Keshavarz Ghorabaee, M., Zavadskas, E. K., Olfat, L., Turskis, Z. Multi-criteria inventory classification using a newmethod of evaluation based on distance from average solution (EDAS). In: Informatica, 2015, vol. 26, issue 3,pp. 435–451.
[23] Ghorabaee, M. K., Zavadskas, E. K., Amiri, M., Turskis, Z. Extended EDAS method for fuzzy multi-criteria decision-making: an application to supplier selection. In: International Journal of Computers Communications & Control,2016, vol. 11, issue 3, pp. 358–371.
[24] Kahraman, C., Keshavarz Ghorabaee, M., Zavadskas, E. K., Cevik Onar, S., Yazdani, M., Oztaysi, B. Intuitionisticfuzzy EDAS method: an application to solid waste disposal site selection. In: Journal of Environmental Engineeringand Landscape Management, 2017, vol. 25, issue 1, pp. 1–12.
[25] Stanujkic, D., Zavadskas, E. K., Keshavarz Ghorabaee, M., Turskis, Z. An extension of the EDAS method based onthe use of interval grey numbers. In: Studies in Informatics and Control, 2017, vol. 26, issue 1, pp. 5–12.
[26] Keshavarz Ghorabaee, M., Amiri, M., Zavadskas, E. K., Turskis, Z., Antucheviciene, J. A new multi-criteria modelbased on interval type-2 fuzzy sets and EDAS method for supplier evaluation and order allocation withenvironmental considerations. In: Computers & Industrial Engineering, 2017, issue 112, pp. 156–174.
494industria textila 2018, vol. 69, nr. 6˘
[27] Keshavarz Ghorabaee, M., Amiri, M., Zavadskas, E. K., Turskis, Z., Antucheviciene, J. Stochastic EDAS method formulti-criteria decision-making with normally distributed data. In: Journal of Intelligent & Fuzzy Systems, 2017,vol. 33, issue 3, pp. 1627–1638.
[28] Keshavarz Ghorabaee, M., Amiri, M., Zavadskas, E. K., Turskis, Z., Antucheviciene, J. A new hybrid simulation-based assignment approach for evaluating airlines with multiple service quality criteria. In: Journal of Air TransportManagement, 2017, issue 63, pp. 45–60.
[29] Keshavarz Ghorabaee, M., Amiri, M., Zavadskas, E. K., Turskis, Z. Multi-criteria group decision-making using anextended EDAS method with interval type-2 fuzzy sets. In: Ekonomika a management, 2017, vol. 20, issue 1, pp. 48–68.
[30] Keshavarz Ghorabaee, M., Amiri, M., Zavadskas, E. K., Antucheviciene, J. A new hybrid fuzzy MCDM approach forevaluation of construction equipment with sustainability considerations. In: Archives of Civil and MechanicalEngineering, 2018, vol. 18, issue 1, pp. 32–49.
[31] Peng, X., Dai, J., Yuan, H. Interval-valued fuzzy soft decision making methods based on MABAC, similarity measureand EDAS. In: Fundamenta Informaticae, 2017, vol. 152, issue 4, pp. 373–396.
[32] Peng, X., Liu, C. Algorithms for neutrosophic soft decision making based on EDAS, new similarity measure andlevel soft set. In: Journal of Intelligent & Fuzzy Systems, 2017, vol. 32, issue 1, pp. 955–968.
[33] Ren, J., Toniolo, S. Life cycle sustainability decision-support framework for ranking of hydrogen productionpathways under uncertainties: An interval multi-criteria decision making approach. In: Journal of CleanerProduction, 2018, issue 175, pp. 222–236.
[34] Juodagalvienė, B., Turskis, Z., Šaparauskas, J., Endriukaitytė, A. Integrated multi-criteria evaluation of house’s planshape based on the EDAS and SWARA methods. In: Engineering Structures and Technologies, 2017, vol. 9,issue 3, pp. 117–125.
[35] Keshavarz Ghorabaee, M., Amiri, M., Olfat, L., Khatami Firouzabadi, S. A. Designing a multi-product multi-periodsupply chain network with reverse logistics and multiple objectives under uncertainty. In: Technological andEconomic Development of Economy, 2017, vol. 23, issue 3, pp. 520–548.
[36] Trinkūnienė, E., Podvezko, V., Zavadskas, E. K., Jokšienė, I., Vinogradova, I., Trinkūnas, V. Evaluation of qualityassurance in contractor contracts by multi-attribute decision-making methods. In: Economic research-Ekonomskaistraživanja, 2017, vol. 30, issue 1, pp. 1152–1180.
[37] Kersuliene, V., Zavadskas, E. K., Turskis, Z. Selection of rational dispute resolution method by applying newstep‐wise weight assessment ratio analysis (SWARA). In: Journal of Business Economics and Management, 2010,vol. 11, issue 2, pp. 243–258.
[38] Zolfani, S. H., Zavadskas, E. K., Turskis, Z. Design of products with both International and Local perspectives basedon Yin-Yang balance theory and SWARA method. In: Economic Research-Ekonomska Istraživanja, 2013, vol. 26,issue 2, pp. 153–166.
[39] Zolfani, S. H., Saparauskas, J. New application of SWARA method in prioritizing sustainability assessmentindicators of energy system. In: Engineering Economics, 2013, vol. 24, issue 5, pp. 408–414.
[40] Stanujkic, D., Karabasevic, D., Zavadskas, E. K. A framework for the selection of a packaging design based on theSWARA method. Inzinerine Ekonomika-Engineering Economics, 2015, vol. 26, issue 2, pp. 181–187.
[41] Stanujkic, D., Zavadskas, E. K., Karabasevic, D., Turskis, Z., Keršulienė, V. New group decision-making ARCASapproach based on the integration of the SWARA and the ARAS methods adapted for negotiations. In: Journal ofBusiness Economics and Management, 2017, vol. 18, issue 4, pp. 599–618.
[42] Karabasevic, D., Stanujkic, D., Urosevic, S., Popovic, G., Maksimovic, M. An approach to criteria weightsdetermination by integrating the Delphi and the adapted SWARA methods. In: Management: Journal of SustainableBusiness and Management Solutions in Emerging Economies, 2017, vol. 22, issue 3, pp. 15–25.
[43] Stanujkic, D., Karabasevic, D., Zavadskas, E. K. A new approach for selecting alternatives based on the adaptedweighted sum and the SWARA methods: A case of personnel selection. In: Economic Computation & EconomicCybernetics Studies & Research, 2017, vol. 51, issue 3, pp. 39–56.
Authors:
Asst. Professor DARJAN KARABASEVIC1
Assoc. Professor DRAGISA STANUJKIC2
Assoc. Professor MIODRAG BRAZKOVIC1
Asst. Professor MLADJAN MAKSIMOVIC1
Asst. PAVLE BRZAKOVIC1
1University Business Academy in Novi Sad, Faculty of Applied Management, Economics and Finance,Jevrejska 24, 11000, Belgrade, Serbia
e-mail:[email protected]; [email protected];[email protected]; [email protected]
2University of Belgrade, Technical Faculty in Bor, Vojske Jugoslavije 12, 19210, Bor, Serbiae-mail: [email protected]
Corresponding author:
DARJAN KARABASEVICe-mail: [email protected]
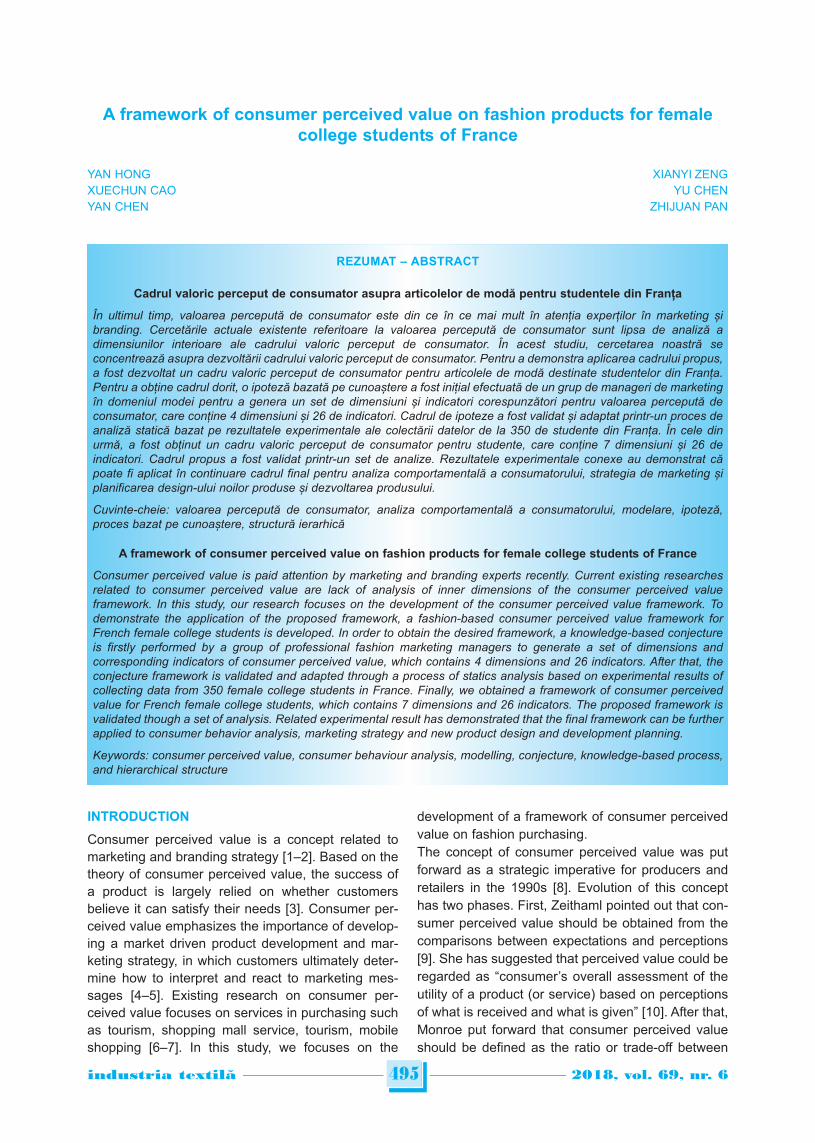
INTRODUCTION
Consumer perceived value is a concept related tomarketing and branding strategy [1–2]. Based on thetheory of consumer perceived value, the success ofa product is largely relied on whether customersbelieve it can satisfy their needs [3]. Consumer per-ceived value emphasizes the importance of develop-ing a market driven product development and mar-keting strategy, in which customers ultimately deter-mine how to interpret and react to marketing mes-sages [4–5]. Existing research on consumer per-ceived value focuses on services in purchasing suchas tourism, shopping mall service, tourism, mobileshopping [6–7]. In this study, we focuses on the
development of a framework of consumer perceivedvalue on fashion purchasing. The concept of consumer perceived value was putforward as a strategic imperative for producers andretailers in the 1990s [8]. Evolution of this concepthas two phases. First, Zeithaml pointed out that con-sumer perceived value should be obtained from thecomparisons between expectations and perceptions[9]. She has suggested that perceived value could beregarded as “consumer’s overall assessment of theutility of a product (or service) based on perceptionsof what is received and what is given” [10]. After that,Monroe put forward that consumer perceived valueshould be defined as the ratio or trade-off between
495industria textila 2018, vol. 69, nr. 6˘
A framework of consumer perceived value on fashion products for femalecollege students of France
YAN HONG XIANYI ZENGXUECHUN CAO YU CHENYAN CHEN ZHIJUAN PAN
REZUMAT – ABSTRACT
Cadrul valoric perceput de consumator asupra articolelor de modă pentru studentele din Franța
În ultimul timp, valoarea percepută de consumator este din ce în ce mai mult în atenția experților în marketing șibranding. Cercetările actuale existente referitoare la valoarea percepută de consumator sunt lipsa de analiză adimensiunilor interioare ale cadrului valoric perceput de consumator. În acest studiu, cercetarea noastră seconcentrează asupra dezvoltării cadrului valoric perceput de consumator. Pentru a demonstra aplicarea cadrului propus,a fost dezvoltat un cadru valoric perceput de consumator pentru articolele de modă destinate studentelor din Franța.Pentru a obține cadrul dorit, o ipoteză bazată pe cunoaștere a fost inițial efectuată de un grup de manageri de marketingîn domeniul modei pentru a genera un set de dimensiuni și indicatori corespunzători pentru valoarea percepută deconsumator, care conține 4 dimensiuni și 26 de indicatori. Cadrul de ipoteze a fost validat și adaptat printr-un proces deanaliză statică bazat pe rezultatele experimentale ale colectării datelor de la 350 de studente din Franța. În cele dinurmă, a fost obținut un cadru valoric perceput de consumator pentru studente, care conține 7 dimensiuni și 26 deindicatori. Cadrul propus a fost validat printr-un set de analize. Rezultatele experimentale conexe au demonstrat căpoate fi aplicat în continuare cadrul final pentru analiza comportamentală a consumatorului, strategia de marketing șiplanificarea design-ului noilor produse și dezvoltarea produsului.
Cuvinte-cheie: valoarea percepută de consumator, analiza comportamentală a consumatorului, modelare, ipoteză,proces bazat pe cunoaștere, structură ierarhică
A framework of consumer perceived value on fashion products for female college students of France
Consumer perceived value is paid attention by marketing and branding experts recently. Current existing researchesrelated to consumer perceived value are lack of analysis of inner dimensions of the consumer perceived valueframework. In this study, our research focuses on the development of the consumer perceived value framework. Todemonstrate the application of the proposed framework, a fashion-based consumer perceived value framework forFrench female college students is developed. In order to obtain the desired framework, a knowledge-based conjectureis firstly performed by a group of professional fashion marketing managers to generate a set of dimensions andcorresponding indicators of consumer perceived value, which contains 4 dimensions and 26 indicators. After that, theconjecture framework is validated and adapted through a process of statics analysis based on experimental results ofcollecting data from 350 female college students in France. Finally, we obtained a framework of consumer perceivedvalue for French female college students, which contains 7 dimensions and 26 indicators. The proposed framework isvalidated though a set of analysis. Related experimental result has demonstrated that the final framework can be furtherapplied to consumer behavior analysis, marketing strategy and new product design and development planning.
Keywords: consumer perceived value, consumer behaviour analysis, modelling, conjecture, knowledge-based process,and hierarchical structure
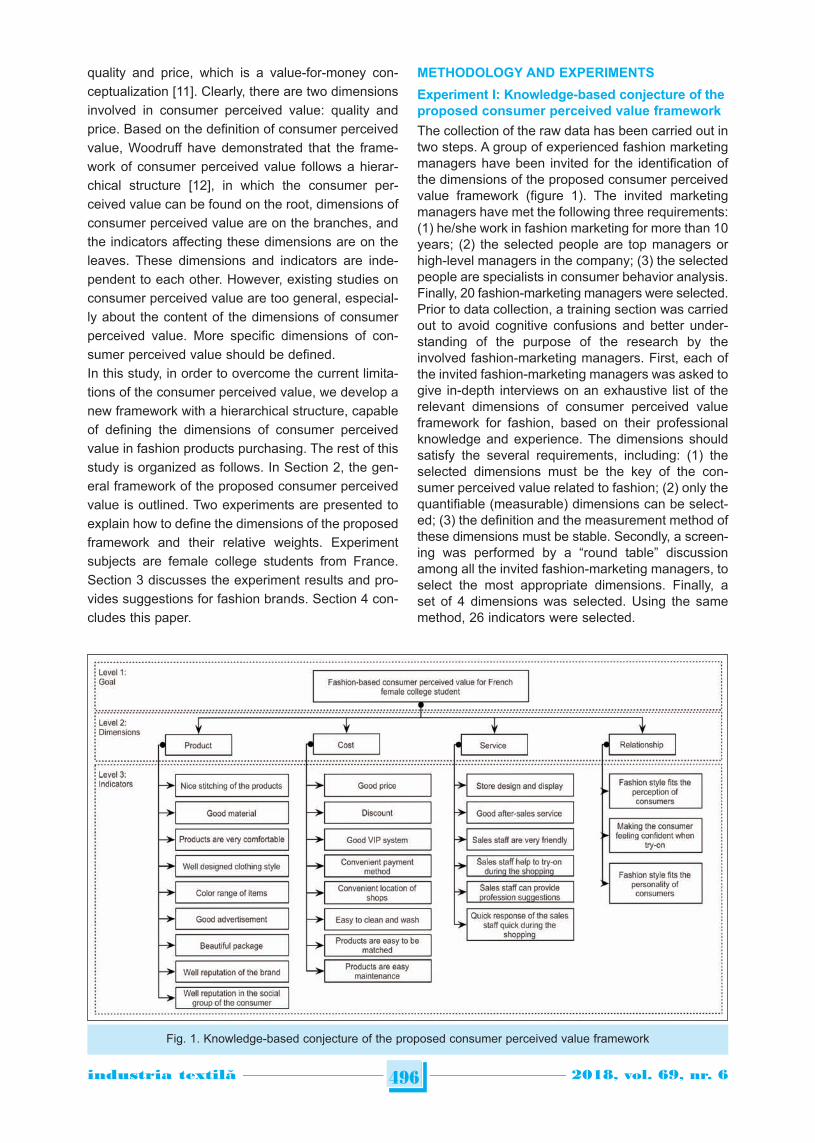
quality and price, which is a value-for-money con-ceptualization [11]. Clearly, there are two dimensionsinvolved in consumer perceived value: quality andprice. Based on the definition of consumer perceivedvalue, Woodruff have demonstrated that the frame-work of consumer perceived value follows a hierar-chical structure [12], in which the consumer per-ceived value can be found on the root, dimensions ofconsumer perceived value are on the branches, andthe indicators affecting these dimensions are on theleaves. These dimensions and indicators are inde-pendent to each other. However, existing studies onconsumer perceived value are too general, especial-ly about the content of the dimensions of consumerperceived value. More specific dimensions of con-sumer perceived value should be defined.In this study, in order to overcome the current limita-tions of the consumer perceived value, we develop anew framework with a hierarchical structure, capableof defining the dimensions of consumer perceivedvalue in fashion products purchasing. The rest of thisstudy is organized as follows. In Section 2, the gen-eral framework of the proposed consumer perceivedvalue is outlined. Two experiments are presented toexplain how to define the dimensions of the pro posedframework and their relative weights. Experimentsubjects are female college students from France.Section 3 discusses the experiment results and pro-vides suggestions for fashion brands. Section 4 con-cludes this paper.
METHODOLOGY AND EXPERIMENTS
Experiment I: Knowledge-based conjecture of theproposed consumer perceived value framework
The collection of the raw data has been carried out intwo steps. A group of experienced fashion marketingmanagers have been invited for the identification ofthe dimensions of the proposed consumer perceivedvalue framework (figure 1). The invited marketingmanagers have met the following three requirements:(1) he/she work in fashion marketing for more than 10years; (2) the selected people are top managers orhigh-level managers in the company; (3) the selectedpeople are specialists in consumer behavior analysis.Finally, 20 fashion-marketing managers were selected.Prior to data collection, a training section was carriedout to avoid cognitive confusions and better under-standing of the purpose of the research by theinvolved fashion-marketing managers. First, each ofthe invited fashion-marketing managers was asked togive in-depth interviews on an exhaustive list of therelevant dimensions of consumer perceived valueframework for fashion, based on their professionalknowledge and experience. The dimensions shouldsatisfy the several requirements, including: (1) theselected dimensions must be the key of the con-sumer perceived value related to fashion; (2) only thequantifiable (measurable) dimensions can be select-ed; (3) the definition and the measurement method ofthese dimensions must be stable. Secondly, a screen-ing was performed by a “round table” discussionamong all the invited fashion-marketing managers, toselect the most appropriate dimensions. Finally, aset of 4 dimensions was selected. Using the samemethod, 26 indicators were selected.
496industria textila 2018, vol. 69, nr. 6˘
Fig. 1. Knowledge-based conjecture of the proposed consumer perceived value framework
Experiment II: Demonstration and adaptationof the conjecture
In Experiment II, a questionnaire concerning the impor-tance of the selected 26 indicators was released to350 female college students from 15 different cities inFrance. The questionnaire was made from the 26indicators and uses the SD method to describe eachindicator. In order for the participants to answer in amore assertive way, an importance on a 5-point bipo-lar adjective scale with a neutral point at the middle(quite unimportant, slightly unimportant, normal,slightly important, quite important) was employed.Besides, education background, average monthly liv-ing expense and average monthly fashion expensewere also collected in the questionnaire. After thesurvey, 325 (92.3% of the whole 350 answers) prop-er answers were obtained.
Verification of the selected indicators
In order to verify if the selected 26 indicators are effi-cient, calculations of Common Factor Variance (CFV)were performed. Common Factor Variance has beenverified for its potential in identifying if one indicator isrelied on the common factor among all the indicatorsor not. If the CFV value of one certain indicator is toosmall, it should be considered to be an unreasonableindicator. Normally, the value of CFV of one indicatorshould be higher than 0.4. After the calculation of theCFV values, the whole 26 selected indicators areproved to be reasonable, which demonstrate the con-jecture about the selection of 26 indicators is reason-able.
Verification of the selected consumer perceived
value dimensions
In order to verify the selected value dimensions,Principal Component Analysis (PCA) was performed.PCA is a statistical procedure that uses an orthogo-nal transformation to convert a set of observations ofpossibly correlated variables into a set of values oflinearly uncorrelated variables called principal com-ponents [13]. Since indicators of consumer perceivedvalue has been verified, this section was designed toverify if principal components obtained from PCA willsupport the previous conjecture gained by expertsbased on their experience. After the analysis, there are seven principles whoseInitial Eigenvalue is greater than 1. It means there areseven principle components can be selected. Figure2 presents the result of the PCA. From figure 2, wecan find out that, the first principal components havethe largest eigenvalue. From the second principalcomponent to the seventh component, the value ofeigenvalue reduces gradually. From the eighth princi-ple component, the rest eigenvalues are rather small.In this condition, we define seven principle compo-nents based on the static analysis, which is differentfrom the conjecture. In order to validate the independence of the selectedseven principle components, Component ScoreCovariance (CSC) of these principle componentswere analyzed [13]. Using CSC analysis, it found that
there is no linear correlation among the selectedseven principle components. It can be concluded thatall these principle components are independent. LetF1, F2, F3, F4, F5, F6 and F7 be the new dimensionsof the proposed consumer perceived value. Adaptation of the structure of the proposed
framework
Since the branch of the proposed hierarchical frame-work is modified, belongings of different indicators todifferent dimensions should be modified. Table 1 presents Ingredient matrix composed of thecapacity factor, which means the relationshipbetween all the indicators and the selected principlecomponents. When the value of one indicator on onecertain principle component is higher, it means thatthis indicator is more greatly influenced by this princi-ple component. For example, F3 strongly influencesthe indicator “Good price”, “Discount”, “Store designand display”, “Well reputation of the brand”, “Wellreputation in the social group of the consumer”,“Good advertisement” and “Convenient paymentmethod”. However, F4 also has impacts on “Discount”,“Good VIP system”, “Sales staff can provide profes-sion suggestions”, “Well reputation of the brand”,“Fashion style fits the perception of consumers” and“Good price”. One indicator can be greatly influencedby two or more principle components. In this situa-tion, Maximum Variance Rotation Method wasapplied to solve this problem [14]. After that, thewhole 26 indicators are distributed to the seven prin-ciple components. Based on the distribution of theindicators, it is possible to redefine the seven princi-ple components, as presented in table 2. F1 refers to 8 indicators: “Convenient paymentmethod”, “Convenient location of shops”, “Sales staffhelp to try-on during the shopping”, “Sales staff canprovide profession suggestions”, “Beautiful pack-age”, “Quick response of the sales staff quick duringthe shopping”, “Good after-sales service” and “Salesstaff are very friendly”. All of these indicators arerelated to the service provided in store. In this condi-tion, F1 is named as “Service”. F2 refers to 5 indica-tors: “Making the consumer feeling confident whentry-on”, “Fashion style fits the personality of con-sumers”, “Color range of items”, “Fashion style fitsthe perception of consumers”, and “Well designedclothing style”. All of these indicators are related to
497industria textila 2018, vol. 69, nr. 6˘
Fig. 2. PCA of the selected indicators
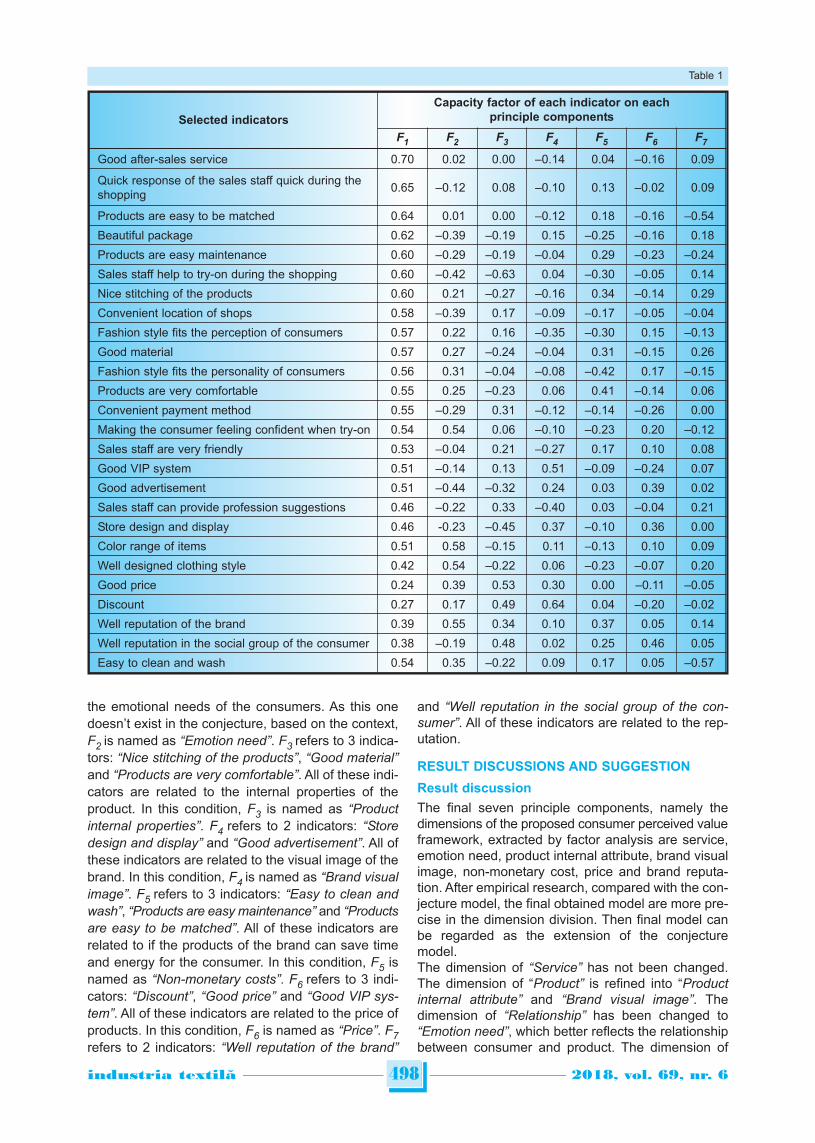
the emotional needs of the consumers. As this onedoesn’t exist in the conjecture, based on the context,F2 is named as “Emotion need”. F3 refers to 3 indica-tors: “Nice stitching of the products”, “Good material”and “Products are very comfortable”. All of these indi-cators are related to the internal properties of theproduct. In this condition, F3 is named as “Productinternal properties”. F4 refers to 2 indicators: “Storedesign and display” and “Good advertisement”. All ofthese indicators are related to the visual image of thebrand. In this condition, F4 is named as “Brand visualimage”. F5 refers to 3 indicators: “Easy to clean andwash”, “Products are easy maintenance” and “Productsare easy to be matched”. All of these indicators arerelated to if the products of the brand can save timeand energy for the consumer. In this condition, F5 isnamed as “Non-monetary costs”. F6 refers to 3 indi-cators: “Discount”, “Good price” and “Good VIP sys-tem”. All of these indicators are related to the price ofproducts. In this condition, F6 is named as “Price”. F7refers to 2 indicators: “Well reputation of the brand”
and “Well reputation in the social group of the con-sumer”. All of these indicators are related to the rep-utation.
RESULT DISCUSSIONS AND SUGGESTION
Result discussion
The final seven principle components, namely thedimensions of the proposed consumer perceived valueframework, extracted by factor analysis are service,emotion need, product internal attribute, brand visualimage, non-monetary cost, price and brand reputa-tion. After empirical research, compared with the con-jecture model, the final obtained model are more pre-cise in the dimension division. Then final model canbe regarded as the extension of the conjecturemodel. The dimension of “Service” has not been changed.The dimension of “Product” is refined into “Productinternal attribute” and “Brand visual image”. Thedimension of “Relationship” has been changed to“Emotion need”, which better reflects the relationshipbetween consumer and product. The dimension of
498industria textila 2018, vol. 69, nr. 6˘
Selected indicators
Capacity factor of each indicator on eachprinciple components
F1 F2 F3 F4 F5 F6 F7
Good after-sales service 0.70 0.02 0.00 –0.14 0.04 –0.16 0.09
Quick response of the sales staff quick during theshopping 0.65 –0.12 0.08 –0.10 0.13 –0.02 0.09
Products are easy to be matched 0.64 0.01 0.00 –0.12 0.18 –0.16 –0.54
Beautiful package 0.62 –0.39 –0.19 0.15 –0.25 –0.16 0.18
Products are easy maintenance 0.60 –0.29 –0.19 –0.04 0.29 –0.23 –0.24
Sales staff help to try-on during the shopping 0.60 –0.42 –0.63 0.04 –0.30 –0.05 0.14
Nice stitching of the products 0.60 0.21 –0.27 –0.16 0.34 –0.14 0.29
Convenient location of shops 0.58 –0.39 0.17 –0.09 –0.17 –0.05 –0.04
Fashion style fits the perception of consumers 0.57 0.22 0.16 –0.35 –0.30 0.15 –0.13
Good material 0.57 0.27 –0.24 –0.04 0.31 –0.15 0.26
Fashion style fits the personality of consumers 0.56 0.31 –0.04 –0.08 –0.42 0.17 –0.15
Products are very comfortable 0.55 0.25 –0.23 0.06 0.41 –0.14 0.06
Convenient payment method 0.55 –0.29 0.31 –0.12 –0.14 –0.26 0.00
Making the consumer feeling confident when try-on 0.54 0.54 0.06 –0.10 –0.23 0.20 –0.12
Sales staff are very friendly 0.53 –0.04 0.21 –0.27 0.17 0.10 0.08
Good VIP system 0.51 –0.14 0.13 0.51 –0.09 –0.24 0.07
Good advertisement 0.51 –0.44 –0.32 0.24 0.03 0.39 0.02
Sales staff can provide profession suggestions 0.46 –0.22 0.33 –0.40 0.03 –0.04 0.21
Store design and display 0.46 -0.23 –0.45 0.37 –0.10 0.36 0.00
Color range of items 0.51 0.58 –0.15 0.11 –0.13 0.10 0.09
Well designed clothing style 0.42 0.54 –0.22 0.06 –0.23 –0.07 0.20
Good price 0.24 0.39 0.53 0.30 0.00 –0.11 –0.05
Discount 0.27 0.17 0.49 0.64 0.04 –0.20 –0.02
Well reputation of the brand 0.39 0.55 0.34 0.10 0.37 0.05 0.14
Well reputation in the social group of the consumer 0.38 –0.19 0.48 0.02 0.25 0.46 0.05
Easy to clean and wash 0.54 0.35 –0.22 0.09 0.17 0.05 –0.57
Table 1
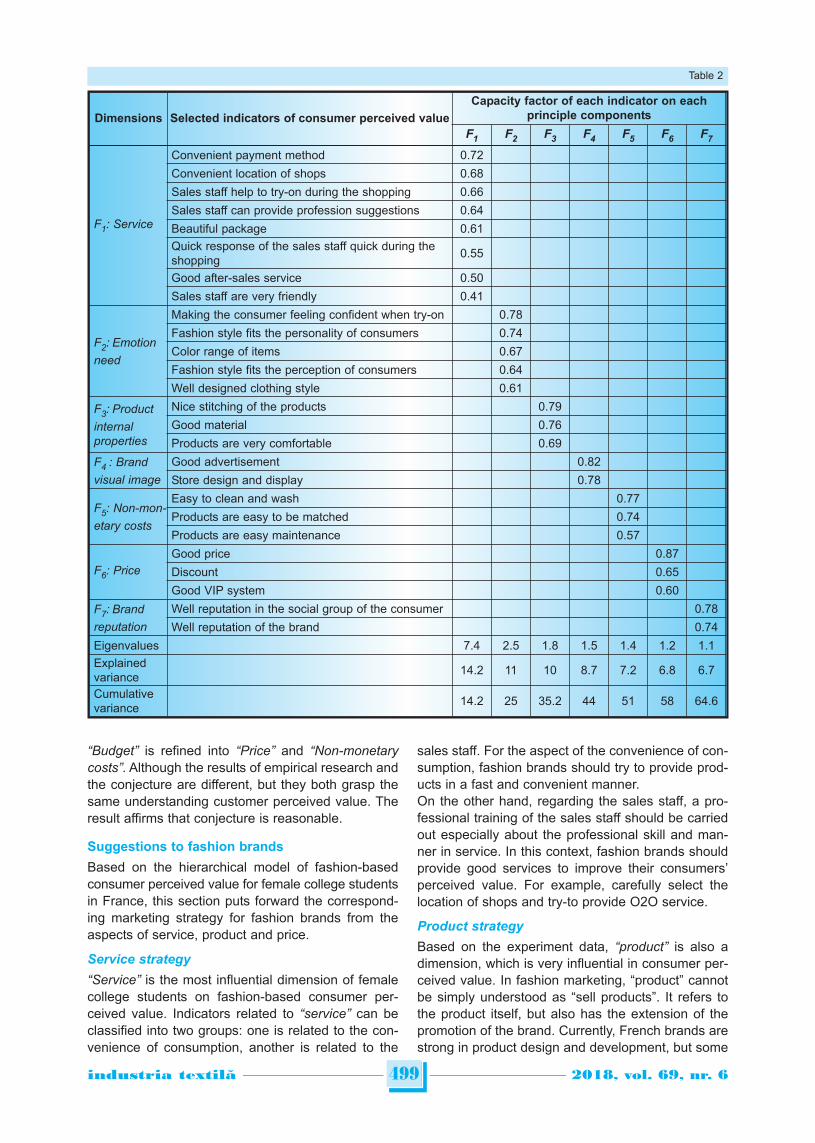
“Budget” is refined into “Price” and “Non-monetarycosts”. Although the results of empirical research andthe conjecture are different, but they both grasp thesame understanding customer perceived value. Theresult affirms that conjecture is reasonable.
Suggestions to fashion brands
Based on the hierarchical model of fashion-basedconsumer perceived value for female college studentsin France, this section puts forward the correspond-ing marketing strategy for fashion brands from theaspects of service, product and price.
Service strategy
“Service” is the most influential dimension of femalecollege students on fashion-based consumer per-ceived value. Indicators related to “service” can beclassified into two groups: one is related to the con-venience of consumption, another is related to the
sales staff. For the aspect of the convenience of con-sumption, fashion brands should try to provide prod-ucts in a fast and convenient manner. On the other hand, regarding the sales staff, a pro-fessional training of the sales staff should be carriedout especially about the professional skill and man-ner in service. In this context, fashion brands shouldprovide good services to improve their consumers’perceived value. For example, carefully select thelocation of shops and try-to provide O2O service.
Product strategy
Based on the experiment data, “product” is also adimension, which is very influential in consumer per-ceived value. In fashion marketing, “product” cannotbe simply understood as “sell products”. It refers tothe product itself, but also has the extension of thepromotion of the brand. Currently, French brands arestrong in product design and development, but some
499industria textila 2018, vol. 69, nr. 6˘
Dimensions Selected indicators of consumer perceived value
Capacity factor of each indicator on eachprinciple components
F1 F2 F3 F4 F5 F6 F7
F1: Service
Convenient payment method 0.72
Convenient location of shops 0.68
Sales staff help to try-on during the shopping 0.66
Sales staff can provide profession suggestions 0.64
Beautiful package 0.61Quick response of the sales staff quick during theshopping 0.55
Good after-sales service 0.50
Sales staff are very friendly 0.41
F2: Emotionneed
Making the consumer feeling confident when try-on 0.78
Fashion style fits the personality of consumers 0.74
Color range of items 0.67
Fashion style fits the perception of consumers 0.64
Well designed clothing style 0.61
F3: Productinternal properties
Nice stitching of the products 0.79
Good material 0.76
Products are very comfortable 0.69
F4 : Brandvisual image
Good advertisement 0.82
Store design and display 0.78
F5: Non-mon-etary costs
Easy to clean and wash 0.77
Products are easy to be matched 0.74
Products are easy maintenance 0.57
F6: PriceGood price 0.87
Discount 0.65
Good VIP system 0.60
F7: Brandreputation
Well reputation in the social group of the consumer 0.78
Well reputation of the brand 0.74
Eigenvalues 7.4 2.5 1.8 1.5 1.4 1.2 1.1Explainedvariance 14.2 11 10 8.7 7.2 6.8 6.7
Cumulativevariance 14.2 25 35.2 44 51 58 64.6
Table 2
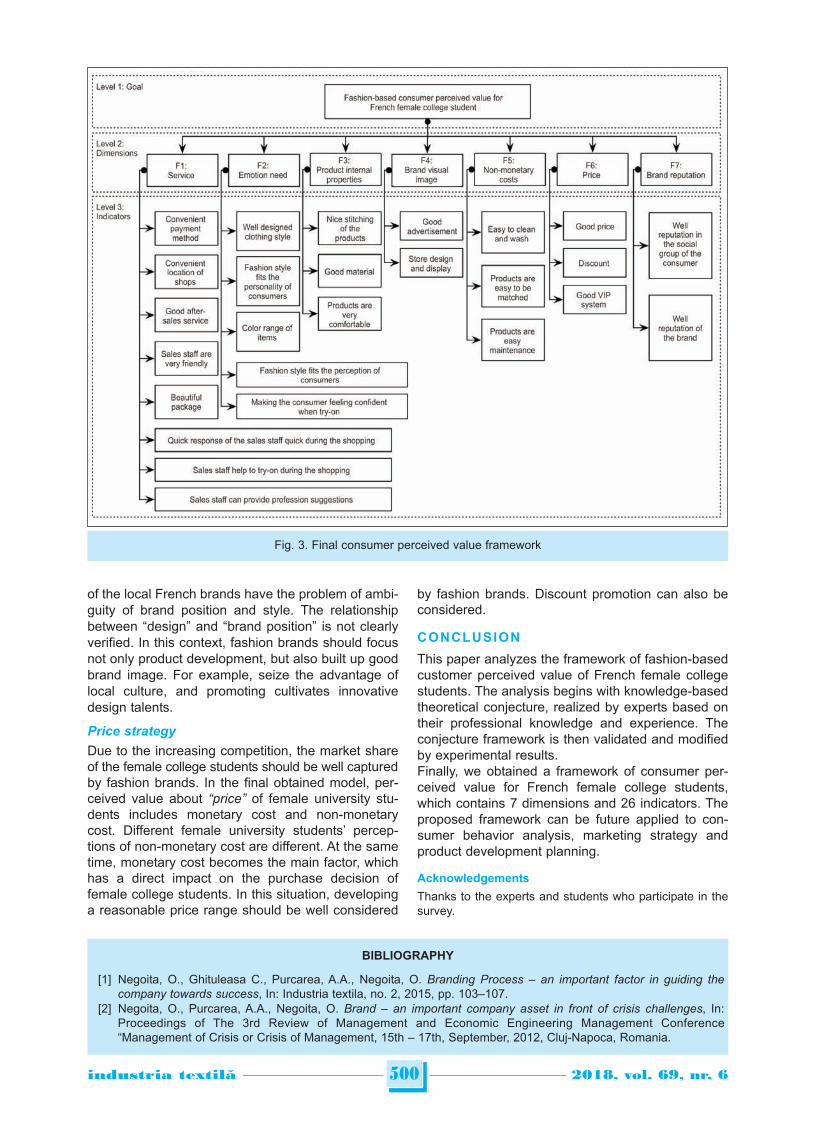
of the local French brands have the problem of ambi-guity of brand position and style. The relationshipbetween “design” and “brand position” is not clearlyverified. In this context, fashion brands should focusnot only product development, but also built up goodbrand image. For example, seize the advantage oflocal culture, and promoting cultivates innovativedesign talents.
Price strategy
Due to the increasing competition, the market shareof the female college students should be well capturedby fashion brands. In the final obtained model, per-ceived value about “price” of female university stu-dents includes monetary cost and non-monetarycost. Different female university students’ percep-tions of non-monetary cost are different. At the sametime, monetary cost becomes the main factor, whichhas a direct impact on the purchase decision offemale college students. In this situation, developinga reasonable price range should be well considered
by fashion brands. Discount promotion can also beconsidered.
CONCLUSION
This paper analyzes the framework of fashion-basedcustomer perceived value of French female collegestudents. The analysis begins with knowledge-basedtheoretical conjecture, realized by experts based ontheir professional knowledge and experience. Theconjecture framework is then validated and modifiedby experimental results. Finally, we obtained a framework of consumer per-ceived value for French female college students,which contains 7 dimensions and 26 indicators. Theproposed framework can be future applied to con-sumer behavior analysis, marketing strategy andproduct development planning.
Acknowledgements
Thanks to the experts and students who participate in thesurvey.
500industria textila 2018, vol. 69, nr. 6˘
Fig. 3. Final consumer perceived value framework
BIBLIOGRAPHY
[1] Negoita, O., Ghituleasa C., Purcarea, A.A., Negoita, O. Branding Process – an important factor in guiding thecompany towards success, In: Industria textila, no. 2, 2015, pp. 103–107.
[2] Negoita, O., Purcarea, A.A., Negoita, O. Brand – an important company asset in front of crisis challenges, In:Proceedings of The 3rd Review of Management and Economic Engineering Management Conference“Management of Crisis or Crisis of Management, 15th – 17th, September, 2012, Cluj-Napoca, Romania.
501industria textila 2018, vol. 69, nr. 6˘
[3] Negoita, O.I., Purcarea, A.A., Negoita, O.D., & Ghituleasa, C. The model of continuous improvement of brandingprocess-the key towards an efficient communication within Romanian textile industry, In: Industria Textila, no. 6,2016, pp. 420–427.
[4] Alexandru, P., Corina, P. Differences in the clothing brand perception depending on generation, In: Industria Textila,no. 42, 2016, pp. 260–264.
[5] Aaker, D.A. (1996), Building strong brands, The Free Press, New York. [6] Aaker, D.A. (1991), Managing brand equity: capitalizing on the value of a brand name, The Free Press, New York. [7] Pelau, C., Stamule, T. (2013), Analysis of the consumer’s reasons and driving factors for buying, In: International
Journal of Economic Practices and Theories. [8] Solomon, M.R. (2009), Consumer behaviour: buying, having, and being, Prentice Hall. [9] Zeithaml, V.A. (1988), Consumer perceptions of price, quality, and value: a means-end model and synthesis of
evidence, In: The Journal of marketing.[10] Parasuraman, A., Zeithaml, V.A., Berry, L.L. Servqual: A multiple-item scale for measuring consumer perc, In:
Journal of retailing, no. 1, 1988, pp. 12–40.[11] Dodds, W.B., & Monroe, K.B. The effect of brand and price information on subjective product evaluations, In:
NA-Advances in Consumer Research, no. 12, 1985, pp. 85–90.[12] Woodruff, R.B. Customer value: the next source for competitive advantage, In: Journal of the academy of marketing
science, no. 2, 1997, pp. 139–153.[13] Chattopadhyay R., Guha A., Jayadeva, Performance of neural networks for predicting yarn properties using
principal component analysis, In: Journal of Applied Polymer Science, 2004, vol. 91, pp. 1746–1751.[14] Sonnerup, B.U., & Scheible, M. (1998), Minimum and maximum variance analysis, In: Analysis methods for multi-
spacecraft data.
Authors:
YAN HONG1, XUECHUN CAO1, YAN CHEN1,
XIANYI ZENG2, YU CHEN3, ZHIJUAN PAN1
1Soochow University, College of Textile and Clothing Engineering, 215021 No. 1 Shizi Street, Suzhou, China
2GEMTEX, ENSAIT, 2 allée Louise et Victor Champier, 59056 Roubaix Cedex 1, France
3School of Fashion Engineering, Shanghai University of Engineering Science, Shanghai, China
Corresponding author:
Prof. ZHIJUAN PAN
e-mail: [email protected]
INTRODUCTION
Asian countries have recently become the rising starsof global textile and clothing trade. Pakistan, which isone of these countries, is a leading global textileexporter. Pakistan textile and clothing industry, whichis a locomotive of Pakistan economy, attracts atten-tion with increasing export ratios. However, the aca-demic studies within the literature, which analyze andscrutinize Pakistan’s textile and clothing industry,which is one of the significant actors of global textileand clothing trade, in all aspects, are inadequate andlack of current information. Therefore, a current situ-ation evaluation study, which can analyze the currentsituation of Pakistan textile and clothing industry andwhich can be helpful for developing future strategies,is needed. In this context, primarily, current situationof Pakistan’s textile and clothing industry is analyzedin detail. As known, textile is the basic industry of Pakistan. Itis accorded as the backbone of Pakistan’s economyas it is the remarkable source of Pakistan’s export
earnings. Textile industry is the single largest deter-minant for the economic growth of the country due toits share in the economy as well as its contribution toexports, employment, foreign exchange earnings,investment and revenue generation [1]. Textile andclothing industry approximately constitutes 62% ofPakistan’s exports by 2016 (table 1).Pakistan’s textile industry provides approximately%40 of industrial labour force, 40% of manufacturingsector’s banking credits, 8% of gross domestic prod-uct. According to the International Cotton AdvisoryCommittee, Pakistan is the fourth largest cotton pro-ducer and third largest cotton consumer in the world.In addition, Pakistan is the world’s second largestcotton yarn exporter and third largest cotton clothmanufacturer and exporter [3]. Easily available cheap labour and basic raw material(cotton) has played a primary role in the growth ofPakistan’s textile industry. Pakistan’s textile industry,which is the leading sector of industrial manufactur-ing, is based on abundant supply of indigenous cot-ton. In other words, it depends on cotton agriculture.
502industria textila 2018, vol. 69, nr. 6˘
SWOT analysis of Pakistan’s textile and clothing industry
SEHER KANAT SADAF AFTAB ABBASIMAZHAR HUSSAIN PEERZADA TURAN ATILGAN
REZUMAT – ABSTRACT
Analiza SWOT a industriei textile și de îmbrăcăminte din Pakistan
Industria textilă și de îmbrăcăminte din Pakistan este unul dintre jucătorii importanți ai comerțului global de textile șiîmbrăcăminte, fiind, de asemenea, o piatră de temelie pentru economia națională. Deși industria textilă și deîmbrăcăminte din Pakistan posedă resurse abundente de materii prime (bumbac) și de forță de muncă ieftină șiabundentă, aceasta s-a confruntat cu multe probleme în ultimii ani. În acest moment, analiza SWOT este una dintremetodele care pot fi utilizate pentru analiza situației curente. Acest studio urmărește să prezinte situația actuală aindustriei textile și de îmbrăcăminte din Pakistan prin analiza SWOT. Astfel, poate fi completat un decalaj în care studiileacademice sunt inadecvate. În plus, studiul contribuie la dezvoltarea strategiei companiilor pakistaneze de textile șiîmbrăcăminte și a oficialilor guvernamentali. În conformitate cu scopul cercetării, au fost determinate în primul rândpunctele forte și dezavantajele industriei textile și de îmbrăcăminte din Pakistan. Ulterior, au fost analizate oportunitățileși amenințările comerțului național și internațional cu produse textile și de îmbrăcăminte. În cele din urmă, dateleobținute au fost analizate și evaluate și au fost elaborate sugestii pentru viitorul industriei.
Cuvinte-cheie: industria textilă și de îmbrăcăminte din Pakistan, analiza SWOT, competitivitate, comerțul cu produsetextile și îmbrăcăminte
SWOT analysis of Pakistan’s textile and clothing industry
Pakistan’s textile and clothing industry is one of the significant players of global textile and clothing trade as well as beinga corner stone for its national economy. Although Pakistan’s textile and clothing industry possesses abundant rawmaterial resources (cotton) and cheap and abundant labour, it has confronted with many issues in recent years. At thispoint, SWOT analysis is one of the methods which can be used for the analysis of current situation. This research aimsto reveal the present situation of Pakistan’s textile and clothing industry with SWOT analysis. Thus, a gap can be filledin which academic studies are inadequate. Besides, the study contributes to the strategy development of Pakistan’stextile and clothing companies and government executives. In accordance with the aim of the research, the strengthsand weakness of Pakistan’s textile and clothing industry are determined primarily. Afterwards, opportunities and threats,which can be faced within national and international textile and clothing trade are analyzed. Finally, the obtained dataare analyzed and evaluated and suggestions are made for the future of the industry.
Keywords: Pakistan’s textile and clothing industry, SWOT analysis, competitiveness, textile and clothing trade

Therefore, whatever affects the cotton crop is likely toaffect the performance of the textile industry [4].Today, Pakistan has an integrated textile industrywhich comprises cotton spinning, cotton weaving,cotton fabric, fabric processing, home textiles, tow-els, hosiery, knitwear and clothing. These are manu-factured both on large scale units and small andmedium cottage units [5]. The major concentration ofthe industry is in the Karachi, Hyderabad, Multan,Lahore, Gujranwala and Faisalabad [1]. Since 2000, Government of Pakistan has beenemphasizing the value added production in textileindustry. For this purpose, comprehensive TextileVision-2000 policy was formulated in order to bringinnovations, implement market driven strategies andencounter the challenges of World Trade Organization.However, the progress of value added production inweaving and spinning has not been satisfactory [6].In the mid of 2000s, Pakistan’s textile production hasseen a sharp increase in investment, which coupledwith Pakistan’s pool of inexpensive labour. It hasattracted global brands, particularly in the manufac-ture of sportswear. Nevertheless, the industry’s perfor-mance has been undermined recently by increasedinternational competition, particularly after the phase-out of the Multifibre Agreement in December 2004. Inaddition, numerous infrastructure bottlenecks, partic-ularly in the energy sector, crippled textiles produc-tion and squeezed the profit margins of textile andclothing producers [7].
In spite of these disadvantages, Pakistan’s share inglobal textile exports is %2,7 by 2016 and it is the-seventh biggest textile exporter of the world [8].Textile and clothing export and import figures ofPakistan and its shares within world textile trade areshown in table 2.Textile and clothing exports of Pakistan according toproduct segments are shown in table 3 whereas theimports figures according to product segments areshown in table 4. As it can be seen, Pakistan mostlyexports cotton (fibre, yarn and fabric), other made-uptextile articles, knitted apparel and clothing acces-sories and woven apparel and clothing accessories.The biggest shares within cotton belong to cottonyarn other than sewing thread (containing >= 85%cotton by weight) and woven fabrics of cotton (con-taining >= 85% cotton by weight and weighing > 200g/m²), whereas lion’s share within other made-up tex-tile articles belongs to bed linen, table linen, toiletlinen and kitchen linen of all types of textile materials. If the imported textile and clothing items of Pakistanare analyzed, it can be seen that Pakistan mostlyimports cotton (fibre, yarn and fabric), man-made fil-aments (fibre, yarn and fabric) and man-made staplefibres (fibre, yarn and fabric). The lion’s share withincotton belongs to neither carded nor combed cotton,whereas the biggest shares within man-made fila-ments and staples belong to synthetic filament yarn(including synthetic monofilaments of < 67 decitex)and artificial staple fibres (not carded or combed).
503industria textila 2018, vol. 69, nr. 6˘
SHARE OF TEXTILE AND CLOTHING INDUSTRY IN PAKISTAN’S GLOBAL TRADE (MILLION US DOLLAR) [2]
2011 2012 2013 2014 2015 2016
Pakistan’s total exports 25,383 24,567 25,121 24,706 22,188 20,435
Pakistan’s textile and clothing exports 13,632 12,919 13,890 14,068 13,255 12,783
Share of textile and clothing in exports (%) 53.71 52.59 55.29 56.94 59.74 62.55
Pakistan’s total imports 44,012 44,105 44,647 47,434 44,219 47,155
Pakistan’s textile and clothing imports 1,332 1,148 1,313 1,631 1,724 1,821
Share of textile and clothing in imports (%) 3.03 2.60 2.94 3.44 3.90 3.86
Table 1
2011 2012 2013 2014 2015 2016
World textile export 293,844 283,430 303,503 313,621 290,519 284,064
Pakistan’s textile export 9,082 8,705 9,341 9,077 8,232 7,680
Pakistan’s share in world textile export 3.09 3.07 3.08 2.89 2.83 2.70
World textile import 311,299 301,950 324,505 335,258 308,108 303,934
Pakistan’s textile import 1,245 1,077 1,245 1,545 1,621 1,716
Pakistan’s share in world textile import 0.40 0.36 0.38 0.46 0.52 0.56
World clothing export 418,523 421,554 462,005 490,168 453,894 444,444
Pakistan’s clothing export 4,550 4,214 4,549 4,991 5,023 5,103
Pakistan’s share in world clothing export 1.09 1.00 0.98 1.02 1.11 1.14
World clothing import 438,190 457,034 502,610 525,977 498,525 468,793
Pakistan’s clothing import 87 71 68 86 103 105
Pakistan’s share in world clothing import 0.02 0.02 0.01 0.02 0.02 0.02
Table 2
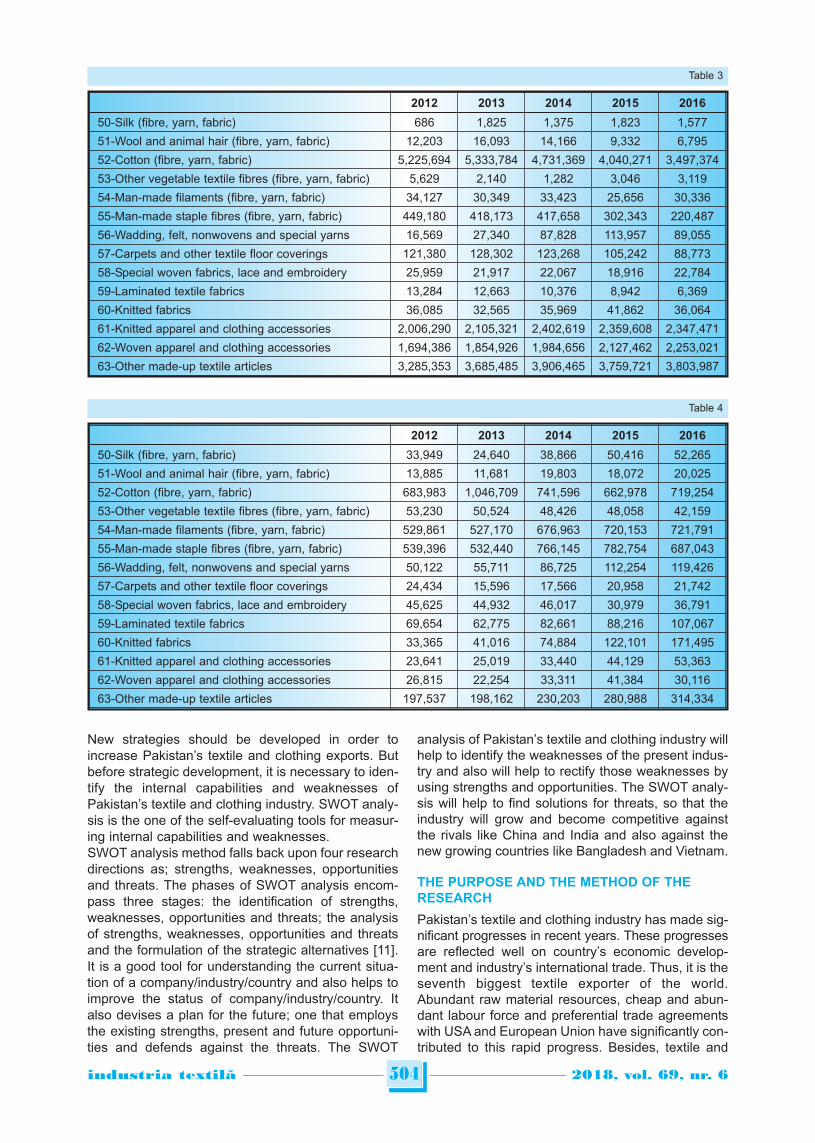
New strategies should be developed in order toincrease Pakistan’s textile and clothing exports. Butbefore strategic development, it is necessary to iden-tify the internal capabilities and weaknesses ofPakistan’s textile and clothing industry. SWOT analy-sis is the one of the self-evaluating tools for measur-ing internal capabilities and weaknesses.SWOT analysis method falls back upon four researchdirections as; strengths, weaknesses, opportunitiesand threats. The phases of SWOT analysis encom-pass three stages: the identification of strengths,weaknesses, opportunities and threats; the analysisof strengths, weaknesses, opportunities and threatsand the formulation of the strategic alternatives [11].It is a good tool for understanding the current situa-tion of a company/industry/country and also helps toimprove the status of company/industry/country. Italso devises a plan for the future; one that employsthe existing strengths, present and future opportuni-ties and defends against the threats. The SWOT
analysis of Pakistan’s textile and clothing industry willhelp to identify the weaknesses of the present indus-try and also will help to rectify those weaknesses byusing strengths and opportunities. The SWOT analy-sis will help to find solutions for threats, so that theindustry will grow and become competitive againstthe rivals like China and India and also against thenew growing countries like Bangladesh and Vietnam.
THE PURPOSE AND THE METHOD OF THERESEARCH
Pakistan’s textile and clothing industry has made sig-nificant progresses in recent years. These progressesare reflected well on country’s economic develop-ment and industry’s international trade. Thus, it is theseventh biggest textile exporter of the world.Abundant raw material resources, cheap and abun-dant labour force and preferential trade agreementswith USA and European Union have significantly con-tributed to this rapid progress. Besides, textile and
504industria textila 2018, vol. 69, nr. 6˘
2012 2013 2014 2015 2016
50-Silk (fibre, yarn, fabric) 33,949 24,640 38,866 50,416 52,265
51-Wool and animal hair (fibre, yarn, fabric) 13,885 11,681 19,803 18,072 20,025
52-Cotton (fibre, yarn, fabric) 683,983 1,046,709 741,596 662,978 719,254
53-Other vegetable textile fibres (fibre, yarn, fabric) 53,230 50,524 48,426 48,058 42,159
54-Man-made filaments (fibre, yarn, fabric) 529,861 527,170 676,963 720,153 721,791
55-Man-made staple fibres (fibre, yarn, fabric) 539,396 532,440 766,145 782,754 687,043
56-Wadding, felt, nonwovens and special yarns 50,122 55,711 86,725 112,254 119,426
57-Carpets and other textile floor coverings 24,434 15,596 17,566 20,958 21,742
58-Special woven fabrics, lace and embroidery 45,625 44,932 46,017 30,979 36,791
59-Laminated textile fabrics 69,654 62,775 82,661 88,216 107,067
60-Knitted fabrics 33,365 41,016 74,884 122,101 171,495
61-Knitted apparel and clothing accessories 23,641 25,019 33,440 44,129 53,363
62-Woven apparel and clothing accessories 26,815 22,254 33,311 41,384 30,116
63-Other made-up textile articles 197,537 198,162 230,203 280,988 314,334
Table 4
2012 2013 2014 2015 2016
50-Silk (fibre, yarn, fabric) 686 1,825 1,375 1,823 1,577
51-Wool and animal hair (fibre, yarn, fabric) 12,203 16,093 14,166 9,332 6,795
52-Cotton (fibre, yarn, fabric) 5,225,694 5,333,784 4,731,369 4,040,271 3,497,374
53-Other vegetable textile fibres (fibre, yarn, fabric) 5,629 2,140 1,282 3,046 3,119
54-Man-made filaments (fibre, yarn, fabric) 34,127 30,349 33,423 25,656 30,336
55-Man-made staple fibres (fibre, yarn, fabric) 449,180 418,173 417,658 302,343 220,487
56-Wadding, felt, nonwovens and special yarns 16,569 27,340 87,828 113,957 89,055
57-Carpets and other textile floor coverings 121,380 128,302 123,268 105,242 88,773
58-Special woven fabrics, lace and embroidery 25,959 21,917 22,067 18,916 22,784
59-Laminated textile fabrics 13,284 12,663 10,376 8,942 6,369
60-Knitted fabrics 36,085 32,565 35,969 41,862 36,064
61-Knitted apparel and clothing accessories 2,006,290 2,105,321 2,402,619 2,359,608 2,347,471
62-Woven apparel and clothing accessories 1,694,386 1,854,926 1,984,656 2,127,462 2,253,021
63-Other made-up textile articles 3,285,353 3,685,485 3,906,465 3,759,721 3,803,987
Table 3
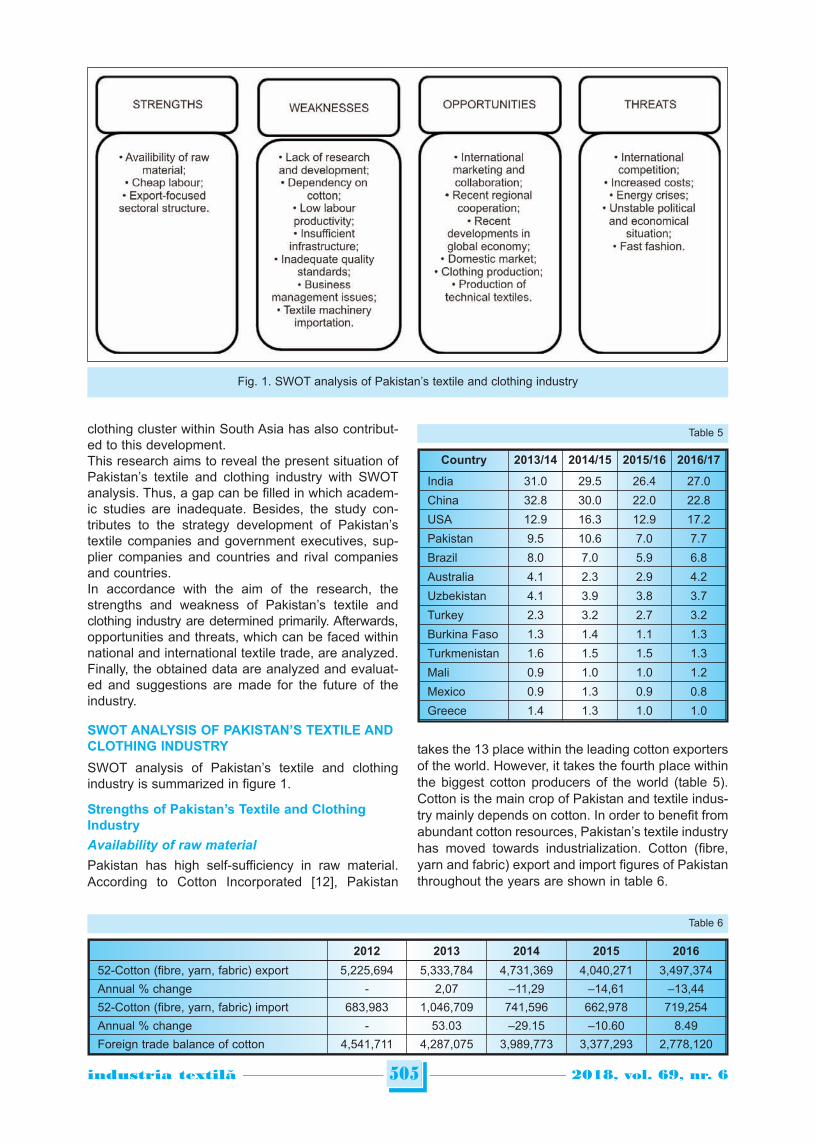
clothing cluster within South Asia has also contribut-ed to this development. This research aims to reveal the present situation ofPakistan’s textile and clothing industry with SWOTanalysis. Thus, a gap can be filled in which academ-ic studies are inadequate. Besides, the study con-tributes to the strategy development of Pakistan’stextile companies and government executives, sup-plier companies and countries and rival companiesand countries. In accordance with the aim of the research, thestrengths and weakness of Pakistan’s textile andclothing industry are determined primarily. Afterwards,opportunities and threats, which can be faced withinnational and international textile trade, are analyzed.Finally, the obtained data are analyzed and evaluat-ed and suggestions are made for the future of theindustry.
SWOT ANALYSIS OF PAKISTAN’S TEXTILE ANDCLOTHING INDUSTRY
SWOT analysis of Pakistan’s textile and clothingindustry is summarized in figure 1.
Strengths of Pakistan’s Textile and ClothingIndustry
Availability of raw material
Pakistan has high self-sufficiency in raw material.According to Cotton Incorporated [12], Pakistan
takes the 13 place within the leading cotton exportersof the world. However, it takes the fourth place withinthe biggest cotton producers of the world (table 5).Cotton is the main crop of Pakistan and textile indus-try mainly depends on cotton. In order to benefit fromabundant cotton resources, Pakistan’s textile industryhas moved towards industrialization. Cotton (fibre,yarn and fabric) export and import figures of Pakistanthroughout the years are shown in table 6.
505industria textila 2018, vol. 69, nr. 6˘
Fig. 1. SWOT analysis of Pakistan’s textile and clothing industry
2012 2013 2014 2015 2016
52-Cotton (fibre, yarn, fabric) export 5,225,694 5,333,784 4,731,369 4,040,271 3,497,374
Annual % change - 2,07 –11,29 –14,61 –13,44
52-Cotton (fibre, yarn, fabric) import 683,983 1,046,709 741,596 662,978 719,254
Annual % change - 53.03 –29.15 –10.60 8.49
Foreign trade balance of cotton 4,541,711 4,287,075 3,989,773 3,377,293 2,778,120
Table 6
Country 2013/14 2014/15 2015/16 2016/17
India 31.0 29.5 26.4 27.0
China 32.8 30.0 22.0 22.8
USA 12.9 16.3 12.9 17.2
Pakistan 9.5 10.6 7.0 7.7
Brazil 8.0 7.0 5.9 6.8
Australia 4.1 2.3 2.9 4.2
Uzbekistan 4.1 3.9 3.8 3.7
Turkey 2.3 3.2 2.7 3.2
Burkina Faso 1.3 1.4 1.1 1.3
Turkmenistan 1.6 1.5 1.5 1.3
Mali 0.9 1.0 1.0 1.2
Mexico 0.9 1.3 0.9 0.8
Greece 1.4 1.3 1.0 1.0
Table 5
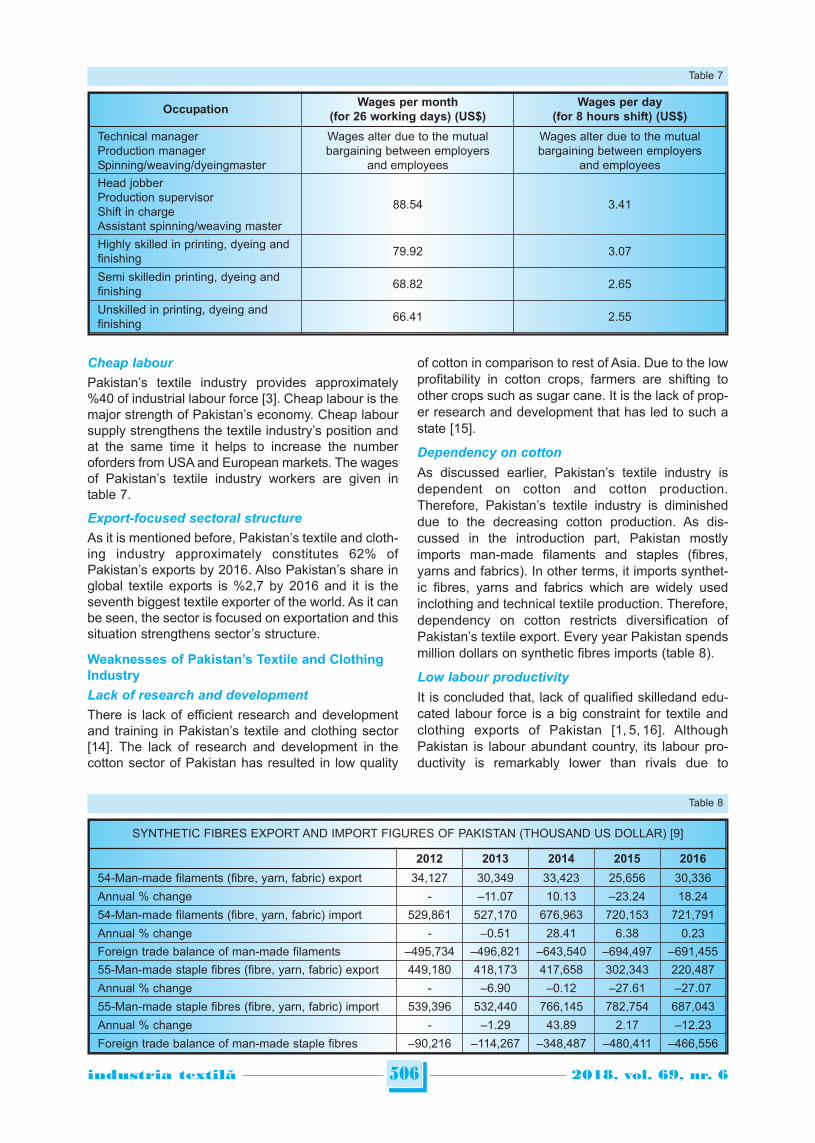
Cheap labour
Pakistan’s textile industry provides approximately%40 of industrial labour force [3]. Cheap labour is themajor strength of Pakistan’s economy. Cheap laboursupply strengthens the textile industry’s position andat the same time it helps to increase the numberoforders from USA and European markets. The wagesof Pakistan’s textile industry workers are given intable 7.
Export-focused sectoral structure
As it is mentioned before, Pakistan’s textile and cloth-ing industry approximately constitutes 62% ofPakistan’s exports by 2016. Also Pakistan’s share inglobal textile exports is %2,7 by 2016 and it is theseventh biggest textile exporter of the world. As it canbe seen, the sector is focused on exportation and thissituation strengthens sector’s structure.
Weaknesses of Pakistan’s Textile and ClothingIndustry
Lack of research and development
There is lack of efficient research and developmentand training in Pakistan’s textile and clothing sector[14]. The lack of research and development in thecotton sector of Pakistan has resulted in low quality
of cotton in comparison to rest of Asia. Due to the lowprofitability in cotton crops, farmers are shifting toother crops such as sugar cane. It is the lack of prop-er research and development that has led to such astate [15].
Dependency on cotton
As discussed earlier, Pakistan’s textile industry isdependent on cotton and cotton production.Therefore, Pakistan’s textile industry is diminisheddue to the decreasing cotton production. As dis-cussed in the introduction part, Pakistan mostlyimports man-made filaments and staples (fibres,yarns and fabrics). In other terms, it imports synthet-ic fibres, yarns and fabrics which are widely usedinclothing and technical textile production. Therefore,dependency on cotton restricts diversification ofPakistan’s textile export. Every year Pakistan spendsmillion dollars on synthetic fibres imports (table 8).
Low labour productivity
It is concluded that, lack of qualified skilledand edu-cated labour force is a big constraint for textile andclothing exports of Pakistan [1, 5, 16]. AlthoughPakistan is labour abundant country, its labour pro-ductivity is remarkably lower than rivals due to
506industria textila 2018, vol. 69, nr. 6˘
OccupationWages per month
(for 26 working days) (US$)Wages per day
(for 8 hours shift) (US$)
Technical manager Production manager Spinning/weaving/dyeingmaster
Wages alter due to the mutualbargaining between employers
and employees
Wages alter due to the mutualbargaining between employers
and employeesHead jobber Production supervisor Shift in charge Assistant spinning/weaving master
88.54 3.41
Highly skilled in printing, dyeing andfinishing 79.92 3.07
Semi skilledin printing, dyeing andfinishing 68.82 2.65
Unskilled in printing, dyeing andfinishing 66.41 2.55
Table 7
SYNTHETIC FIBRES EXPORT AND IMPORT FIGURES OF PAKISTAN (THOUSAND US DOLLAR) [9]
2012 2013 2014 2015 2016
54-Man-made filaments (fibre, yarn, fabric) export 34,127 30,349 33,423 25,656 30,336
Annual % change - –11.07 10.13 –23.24 18.24
54-Man-made filaments (fibre, yarn, fabric) import 529,861 527,170 676,963 720,153 721,791
Annual % change - –0.51 28.41 6.38 0.23
Foreign trade balance of man-made filaments –495,734 –496,821 –643,540 –694,497 –691,455
55-Man-made staple fibres (fibre, yarn, fabric) export 449,180 418,173 417,658 302,343 220,487
Annual % change - –6.90 –0.12 –27.61 –27.07
55-Man-made staple fibres (fibre, yarn, fabric) import 539,396 532,440 766,145 782,754 687,043
Annual % change - –1.29 43.89 2.17 –12.23
Foreign trade balance of man-made staple fibres –90,216 –114,267 –348,487 –480,411 –466,556
Table 8

unqualified and unskilled labour force. Labour pro-ductivity can be improved by proper training and edu-cation. Therefore, redundant raw material usage canbe reduced and product quality can be increased.
Insufficient infrastructure
Adequate infrastructure consists of sufficient waterresources, continuous electricity and gas supplies,efficient logistics and transportation, proper tax struc-ture and abundant raw material. These are the basicrequirements for industry development. However,Pakistan is deficient in terms of adequate infrastruc-ture. Nowadays, Pakistan textile industry faces withincreasing electricity and gas prices which directlyaffect the production costs [4].
Moreover, critics argue that the textile industry hasobsolete equipment and machinery. The inability totimely modernize the equipment and machinery hasled to the decline of Pakistan’s textile competitive-ness. Due to obsolete technology, the productioncosts are higher in Pakistan as compared to othercountries like India, Bangladesh and China [15].
Inadequate quality standards
Pakistan textile industry is currently facing severalchallenges. There is a need for the industry toimprove the quality of its products [14]. Some of thelarge scaled Pakistani textile companies produceaccording to the standards whereas most of the smalland medium sized companies do not focus on quali-ty standards. Most of the small and medium sizedcompanies purchase second-hand textile machinesfrom China, India and South Korea. However, theirmachinery buying criteria only consist of cheapnessand workableness. Consequently, these old machinesare very poor in terms of quality and textile productswhich are produced by these machines possess lowquality [5]. This situation usually ends with interna-tional customer and market loss. If an industry wantsto be successful in international markets, it has toprovide best quality. Therefore it has to produceaccording to the quality standards which are accept-ed globally.
Business management issues
Pakistan misses many opportunities due to the lackof professionalism, which is the basic requirement oftoday’s business life. In addition, supply chain man-agement is the key factor of successful business.However, supply chain management is rarely imple-mented in Pakistan’s textile industry. This situation isresulted in disorganized, disconnected and distorted
industry. Therefore, Pakistan cannot be able to fulfilorders on time. However, customers demand theirorders on time in order to launch their own productson time. Consequently, Pakistan loses customers [4].
Textile machinery importation
Pakistan has given foreign trade deficit in textilemachinery trade over the past five years (table 9). Itstextile and leather machinery import has approxi-mately increased %22 for the last five years.Therefore, Pakistan’s textile and clothing sector isdependent on imported machineries.The textile machinery used in Pakistan is importedmainly from countries like Japan, Switzerland,Germany, China and Belgium [14].
Opportunities for Pakistan’s Textile and ClothingIndustry
International marketing and collaboration
Marketing can be defined asan art of product andservice presentation. Marketing techniques are usedin order to build good relationships with customers,present products and services outstandingly and takeadvantage of opportunities. If Pakistan invests inmarketing techniques and marketing employees, itcan easily increase its share within global textile andclothing trade. Pakistani textile companies must reduce productioncosts, improve labour efficiency, apply quality stan-dards, produce high value-added products, use mar-keting techniques successfully and penetrate intoforeign markets. In this context; collaboration withother successful foreign companies can be useful,because a company can learn lots of things from itspartners (suppliers, rivals, collaborators etc.).
Recent regional cooperation
The Shanghai Cooperation Organisation is a perma-nent intergovernmental international organisation,the creation of which was announced on 15 June2001 in Shanghai (China) by the Republic ofKazakhstan, the People’s Republic of China, theKyrgyz Republic, the Russian Federation, the Republicof Tajikistan, and the Republic of Uzbekistan. It waspreceded by the Shanghai Five mechanism [19]. Forthe first time since its 2001 inception, the ShanghaiCooperation Organization has a pair of new mem-bers. By simultaneously adding Pakistan and Indiato the organization in June 2017, now it representsnearly half of the global population, as well as signif-icant economic and geographic heft [20]. Therefore,
507industria textila 2018, vol. 69, nr. 6˘
2012 2013 2014 2015 2016
724-Textile and leather machinery export 14,539 13,958 9,073 10,006 8,010
Annual % change - –4.00 –35.00 10.28 –19.95
724-Textile and leather machinery import 439,315 498,101 584,915 515,227 537,486
Annual % change - 13.38 17.43 –11.91 4.32
Foreign trade balance of textile and leather machinery –424,776 –484,143 –575,842 –505,221 –529,476
Table 9
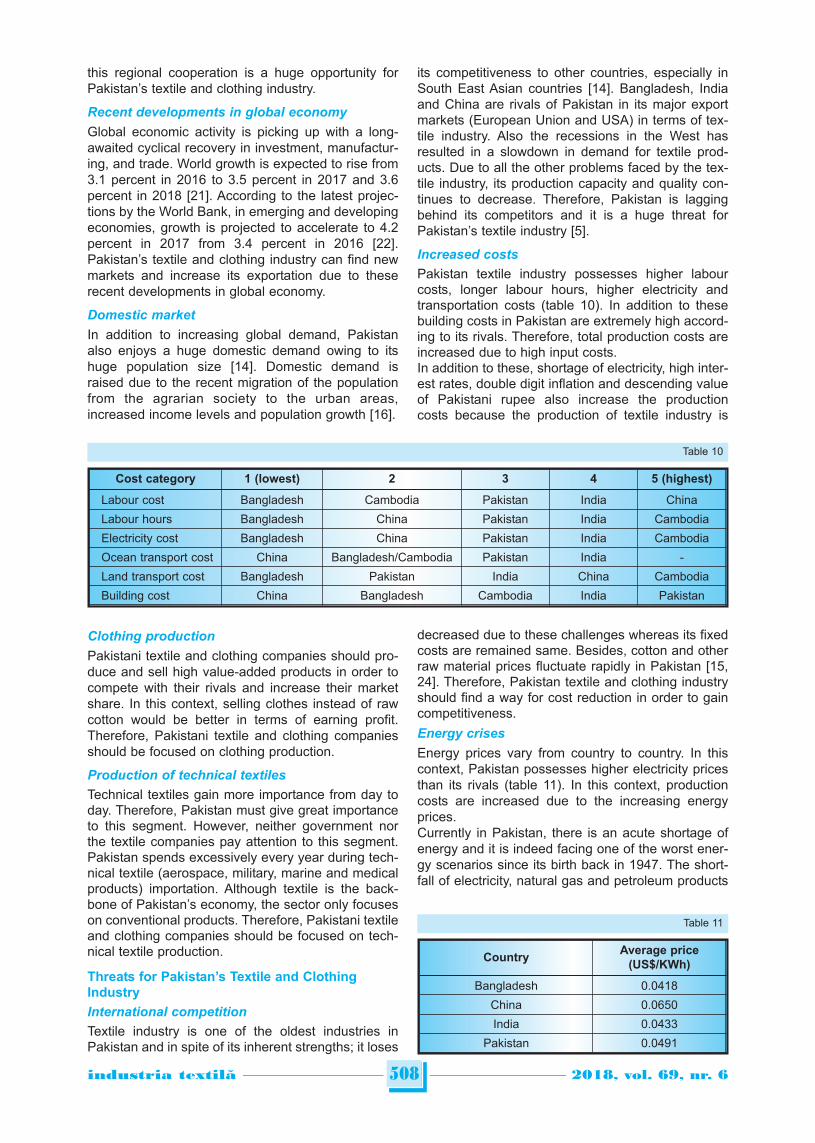
this regional cooperation is a huge opportunity forPakistan’s textile and clothing industry.
Recent developments in global economy
Global economic activity is picking up with a long-awaited cyclical recovery in investment, manufactur-ing, and trade. World growth is expected to rise from3.1 percent in 2016 to 3.5 percent in 2017 and 3.6percent in 2018 [21]. According to the latest projec-tions by the World Bank, in emerging and developingeconomies, growth is projected to accelerate to 4.2percent in 2017 from 3.4 percent in 2016 [22].Pakistan’s textile and clothing industry can find newmarkets and increase its exportation due to theserecent developments in global economy.
Domestic market
In addition to increasing global demand, Pakistanalso enjoys a huge domestic demand owing to itshuge population size [14]. Domestic demand israised due to the recent migration of the populationfrom the agrarian society to the urban areas,increased income levels and population growth [16].
Clothing production
Pakistani textile and clothing companies should pro-duce and sell high value-added products in order tocompete with their rivals and increase their marketshare. In this context, selling clothes instead of rawcotton would be better in terms of earning profit.Therefore, Pakistani textile and clothing companiesshould be focused on clothing production.
Production of technical textiles
Technical textiles gain more importance from day today. Therefore, Pakistan must give great importanceto this segment. However, neither government northe textile companies pay attention to this segment.Pakistan spends excessively every year during tech-nical textile (aerospace, military, marine and medicalproducts) importation. Although textile is the back-bone of Pakistan’s economy, the sector only focuseson conventional products. Therefore, Pakistani textileand clothing companies should be focused on tech-nical textile production.
Threats for Pakistan’s Textile and ClothingIndustry
International competition
Textile industry is one of the oldest industries inPakistan and in spite of its inherent strengths; it loses
its competitiveness to other countries, especially inSouth East Asian countries [14]. Bangladesh, Indiaand China are rivals of Pakistan in its major exportmarkets (European Union and USA) in terms of tex-tile industry. Also the recessions in the West hasresulted in a slowdown in demand for textile prod-ucts. Due to all the other problems faced by the tex-tile industry, its production capacity and quality con-tinues to decrease. Therefore, Pakistan is laggingbehind its competitors and it is a huge threat forPakistan’s textile industry [5].
Increased costs
Pakistan textile industry possesses higher labourcosts, longer labour hours, higher electricity andtransportation costs (table 10). In addition to thesebuilding costs in Pakistan are extremely high accord-ing to its rivals. Therefore, total production costs areincreased due to high input costs. In addition to these, shortage of electricity, high inter-est rates, double digit inflation and descending valueof Pakistani rupee also increase the productioncosts because the production of textile industry is
decreased due to these challenges whereas its fixedcosts are remained same. Besides, cotton and otherraw material prices fluctuate rapidly in Pakistan [15,24]. Therefore, Pakistan textile and clothing industryshould find a way for cost reduction in order to gaincompetitiveness. Energy crises
Energy prices vary from country to country. In thiscontext, Pakistan possesses higher electricity pricesthan its rivals (table 11). In this context, productioncosts are increased due to the increasing energyprices.Currently in Pakistan, there is an acute shortage ofenergy and it is indeed facing one of the worst ener-gy scenarios since its birth back in 1947. The short-fall of electricity, natural gas and petroleum products
508industria textila 2018, vol. 69, nr. 6˘
Cost category 1 (lowest) 2 3 4 5 (highest)
Labour cost Bangladesh Cambodia Pakistan India China
Labour hours Bangladesh China Pakistan India Cambodia
Electricity cost Bangladesh China Pakistan India Cambodia
Ocean transport cost China Bangladesh/Cambodia Pakistan India -
Land transport cost Bangladesh Pakistan India China Cambodia
Building cost China Bangladesh Cambodia India Pakistan
Table 10
CountryAverage price
(US$/KWh)
Bangladesh 0.0418
China 0.0650
India 0.0433
Pakistan 0.0491
Table 11
has greatly affected the daily life of almost everyPakistani. Presently, industrial and agricultural growthare on the decline due to the shortage of energywhich gave birth to many vices like inflation, unem-ployment, unrest, everyday strikes, street crimes,intolerance in the society and increase of the povertylevel in the country [25].
Unstable political and economic situation
Unstable political situation and corrupt system in thecountry are one of the major reasons of industrialdecline. Industrial activities cannot be performed in adisturbance and fear atmosphere. Besides, Pakistanis a country where policies are rapidly changed evenin days and weeks. Moreover, the recent terroristattacks within the country results in high freight costs.Therefore, textile industry cannot develop properlywithout long-termed and consistent policies [5].
Fast fashion
Nowadays, product life cycles within the clothing sec-tor are shortened due to the rapid alterations andfashion concept. Companies frequently present newcollections to their customers in order to comply withfast fashion. In this context, fast fashion poses athreat to Pakistan’s textile and clothing industrybecause Pakistan is lack of new machines, fast andefficient production and qualified labours. Therefore,customers prefer Pakistan’s rivals even at highercosts due to the deadline issues.
CONCLUSIONS, GENERAL EVALUATION ANDSUGGESTIONS
Pakistan’s textile and clothing industry has recentlygone through serious and strategic processes. Globaldevelopments also seriously affect these strategic pro-cesses. However, textile and clothing industry ismostly affected by internal issues such as high elec-tricity prices, frequent power cuts, devaluation ofPakistani rupee, high production costs, political uncer-tainties, low labour productivity, inadequate qualitystandards, insufficient infrastructure and absence ofresearch and development activities. These issuesnegatively affect competitiveness and exportation oftextile and clothing industry.
In spite of these issues, Pakistan’s textile and cloth-ing industry has an important place in Pakistan’seconomy. Also it is the seventh biggest textileexporter of the world. Therefore, significant precau-tions should be taken in order to improve andenhance this industry. As a consequence, some sug-gestions are made for Pakistan’s textile and clothingindustry. 1. Short, medium and long term policies and incen-tive implementations of government must bereviewed and activated. 2. Pakistan’s textile and clothing industry is depen-dent on cotton and cotton production. However, theindustry must be focused on clothing and technicaltextile production. In other words, it should produceand sell high value added products. Thus, exporta-tion amounts and values can be increased. 3. Although Pakistan is labour abundant country, itlacks for qualified labour force. Its labour productivityis remarkably lower than its rivals. Labour skills andproductivity should be improved by proper trainingand education. 4. Pakistan possesses higher energy prices than itsrivals. Production costs are increased due to theincreasing electricity and gas prices. Besides, powercut (electricity and natural gas cuts) is the main prob-lem of Pakistan’s textile and clothing industry.Therefore; continuous, adequate and cheaper powershould be supplied. 5. All Pakistani textile and clothing companies shouldpay attention to international quality standards. Theproducts must be manufactured according to thesestandards. 6. All Pakistani textile and clothing companies shouldinvest in technology. High technology is helpful interms of product quality and customer satisfaction. 7. Pakistan is dependent on textile machinery impor-tation. Therefore, companies should invest to thissegment.8. Pakistan’s textile and clothing industry should payattention to accurate business management in orderto prevent from disorganized, disconnected and dis-torted industry. To sum up, textile and clothing industry’s share andefficiency within Pakistan economy should beincreased progressively and permanently.
509industria textila 2018, vol. 69, nr. 6˘
BIBLIOGRAPHY
[1] Khaliji B.A., Jaffari S.I.A., Shahzad A., Mehtab M. Role of textile sector in domestic resources development, In:Business Management Dynamics, 2013, 2(10), pp. 14–27.
[2] World Trade Organization, Statistics Database, Time Series on International Trade, http://stat.wto.org/StatisticalProgram/WSDBStatProgramHome.aspx?Language=E (Date of Access: November 2017).
[3] Pakistan Textile Journal, Annual Fact File 2015,http://www.ptj.com.pk/Web-2015/12-2015/December-2015-PDF/Annual-Fact-File-2015.pdf (Date of Access: July 2017).
[4] Akhlaq M.A.,SWOT analysis of the textile industry of Pakistan, In: Pakistan Textile Journal, 2009,August 2009,pp. 37–39.
[5] Siddique R., Shaheen I., Akbar W., Malik M.A., Syndicate Report-VI, Pakistan’s Federal Board of Revenue, 37p.,https://tr.scribd.com/document/114042237/6 (Date of Access: July 2017).
510industria textila 2018, vol. 69, nr. 6˘
[6] Ahmad N., Kalim R. Implications of export competitiveness and performance of textile and clothing sector ofPakistan: pre and post quota analysis, In: Pakistan Journal of Commerce and Social Sciences, 2014, 8(3), pp.696–714.
[7] Luchnikava H., Pakistan Country Intelligence Report, IHS Global Insight, 2012, 25 p.
[8] World Trade Organization, World Trade Statistical Review 2017, 2017, 181 p.
[9] International Trade Center, Trademap – Trade Statistics for International Business Development,http://www.trademap.org/Index.aspx (Date of Access: July 2017).
[10] Harmonized System (HS) Classification Code Explanations, http://www.foreign-trade.com/reference/hscode.htm(Date of Access: July 2017).
[11] Butnariu A., Condurache G. SWOT analysis of the efficinecy in the production of technological steam for the textilematerials finishing, In: Industria Textila, 2013, 64(6), pp. 342–345.
[12] Cotton Incorporated, Monthly Economic Letter, August 2017, http://www.cottoninc.com/corporate/Market-Data/MonthlyEconomicLetter/pdfs/English-pdf-charts-and-tables/World-Cotton-Production-Bales.pdf (Date ofAccess: August 2017).
[13] Minimum wages of textile workers in textile industry in Pakistan, http://www.paycheck.pk/main/salary/minimum-wages/minimum-wages-2011-1/textile-industry(Date of Access: July 2017).
[14] Iqbal M.S., Shaikh F.M., Mahmood B., Shafiq K. Development of textile industrial clusters in Pakistan, In: AsianSocial Science, 2010, 6(11), pp. 123–140.
[15] Khan A.A., Khan M. Pakistan textile industry facing new challenges, In: Research Journal of International Studies,2010, 14, pp. 21–29.
[16] Jaleel R., Ishfaq A., Saleemi A., Samin T. SWOT analysis of textile industry in Pakistan, In: Asian Journal ofResearch in Business Economics and Management, 2014, 4(9), pp. 76–87.
[17] United Nations Comtrade, International Trade Statistics Database, https://comtrade.un.org/data/ (Date of Access:July 2017).
[18] SITC Revision Code 72 Explanation, https://unstats.un.org/unsd/cr/registry/ regcs.asp?Cl=14&Lg=1&Co=72 (Dateof Access: July 2017).
[19] Shanghai Cooperation Organisation, About The Shanghai Cooperation Organisation, http://eng.sectsco.org/about_sco/ (Date of Access: July 2017).
[20] Michel C., 2017, It’s Official: India and Pakistan Join Shanghai Cooperation Organization, https://thediplomat.com/2017/06/its-official-india-and-pakistan-join-shanghai-cooperation-organization/ (Date of Access: July 2017).
[21] International Monetary Fund, World Economic Outlook, April 2017: Gaining Momentum? http://www.imf.org/en/Publications/WEO/Issues/2017/04/04/world-economic-outlook-april-2017 (Date of Access: July 2017).
[22] The World Bank, Global Economy in 2017: Hope and Uncertainty, http://www.worldbank.org/en/news/opinion/2017/02/15/global-economy-in-2017-hope-and-uncertainty (Date of Access: July 2017).
[23] United States Agency for International Development (USAID), Cost competitiveness of Pakistan’s textiles andapparel industry, 2009, http://pdf.usaid.gov/pdf_docs/PA00JBZ6.pdf(Date of Access: July 2017).
[24] Afzal M.Y. Impact of electricity crisis and interest rate on textile industry of Pakistan, In: Academy of ContemporaryResearch Journal, 2012, 1(1), pp. 32–35.
[25] Farooq M., Shakoor A. Severe energy crises and solar thermal energy as a viable option for Pakistan, In: Journalof Renewable and Sustainable Energy, 2013, 5, doi:10.1063/1.4772637.
Authors:
SEHER KANAT1, SADAF AFTAB ABBASI2, MAZHAR HUSSAIN PEERZADA2, TURAN ATILGAN1
1Department of Textile Engineering, Ege University, İzmir, Turkey2Department of Textile Engineering, Mehran University of Engineering & Technology, Jamshoro, Pakistan
Corresponding author:
SEHER KANAT
e-mail: seher.kanat @ege.edu.tr
INTRODUCTION
Metal mordants are usually used in combination withvarious synthetic and natural mordant dyes in orderto improve the fastness and depth of shade or obtaindifferent hues when using a single dye [1–2]. Varioustransition metals can act as mordants and their saltscan be applied on wool by three different applicationroutes namely, pre-mordanting, meta-mordanting andafter-mordanting depending on whether the mordantis applied before, together with or after the dyeingprocedure. However, the use of mordant dyes hasdeclined in recent years, owing to their negative envi-ronmental impacts and eco-toxicity [1, 3–4].Recently, a great tendency to the use of natural prod-ucts has been arisen specially when speaking aboutthe coloration of textiles. This renewed interest ismainly due to the increased awareness of the envi-ronmental and health risks that synthetic dyes pro-duce in the synthesis, processing and applicationstages [5–6]. Most of the natural dyes possess lowaffinity towards the textile fibers, therefore highamounts of the dyeing material and prolonged dyeingtimes are usually needed to dye a textile productusing natural dyeing plants satisfactorily. To improvethe exhaustion of natural dyes onto textile fibers,different techniques have been employed. Several
pretreatments like cationization [7], plasma treatment[6, 8–9], enzyme treatment [10], gamma treatment[11–12], and microwave treatment [13] are examplesof techniques which have been studied to overcomethis drawback. However, the most usual way to enhance the dyeingof textile fibers with natural dyes is still mordantingwith metal salts. Examples of the most common mor-dants are the salts of chromium, tin, iron, copper andaluminum and several studies have been publishedon the optimization of natural dyeing and mordantingof fibers with different mordants [14–19]. When apply-ing mordants on wool fibers, the main action of mor-danting is to increases the interaction between theamine groups of protein molecules of wool fibers andhydroxyl and carbonyl groups of dye molecules.Figure 1 shows the mechanism of complex formationbetween wool protein, aluminum ion, and juglone asa model natural dye molecule [20–21].Recently the use of binary and ternary metal saltcombinations has been reported with the aim ofobtaining new shades using annatto and walnut barkas natural dyesand their colorimetric and fastnessproperties have been studied [22–23]. The main con-cern in the previous studies have been about theimprovement of exhaustion, color strength and fast-ness properties besides achieving different shades or
511industria textila 2018, vol. 69, nr. 6˘
Statistical study of the effect of metallic mordants on tensile strength of wool
AMINODDIN HAJI MAJID NASIRIBOROUMAND
REZUMAT – ABSTRACT
Studiul statistic al efectului mordantului metallic asupra rezistenței la tracțiune a lânii
În ciuda varietății mari de studii în domeniul efectului diferiților mordanți asupra proprietăților de vopsire și de rezistențăa culorii lânii cu coloranți naturali, nu există o investigație aprofundată a efectului mordantului metallic asupraproprietăților de tracțiune a lânii. În acest studiu s-au aplicat cinci tipuri diferite de săruri metalice pe lână: sulfatul depotasiu, de aluminiu, clorura de staniu, dicromatul de potasiu, sulfatul de cupru și sulfatul feros, cu concentrații cuprinseîntre 1 %owf și 20 %owf. Rezistența la tracțiune a probelor a fost măsurată și a fost utilizat software-ul SPSS pentru aevidenția efectul diferitelor concentrații de mordanți asupra rezistenței la tracțiune a firelor de lână, comparativ cu probanetratată. Rezultatele au arătat că sulfatul de potasiu, de aluminiu și sulfatul feros nu au avut un efect semnificativstatistic asupra rezistenței firelor, în timp ce clorura de staniu a prezentat cel mai mare effect și a redus în modsemnificativ rezistența firelor. Sulfatul de potasiu, de aluminiu și sulfatul feros au redus tenacitatea la maximum 4,2 %owfși respectiv 4,4 %owf, în timp ce proba tratată cu clorură de staniu a fost complet distrusă atunci când s-a aplicat maimult de 5 %owf din mordant.
Cuvinte-cheie: mordant, tenacitate, lână, formare complex, alaun, SPSS
Statistical study of the effect of metallic mordants on tensile strength of wool
Despite the vast variety of studies in the field of effect of different mordants on dyeing and fastness properties of woolwith natural dyes, there is no thorough investigation on the effect of metal mordants on tensile properties of wool. In thisstudy, five different metallic salts namely aluminum potassium sulfate, tin chloride, potassium dichromate, coppersulfate, and ferrous sulfate were applied on wool with concentrations ranging from 1 %owf to 20 %owf. The tenacity ofthe samples was measured and SPSS software was employed to investigate the effect of different concentrations ofvarious mordants on tensile strength of woolen yarn compared with raw sample. The results showed that aluminumpotassium sulfate and ferrous sulfate had no statistically significant effect on the tenacity of the yarns while tin chlorideshowed the highest inverse effect and lowered the yarn strength significantly. Aluminum potassium sulfate and ferroussulfate reduced the tenacity for maximum of 4.2 %owf and 4.4 %owf respectively while the tin chloride treated samplewas completely destroyed when applying higher than 5 %owf of the mordant.
Keywords: mordant, tenacity, wool, complex formation, alum, SPSS
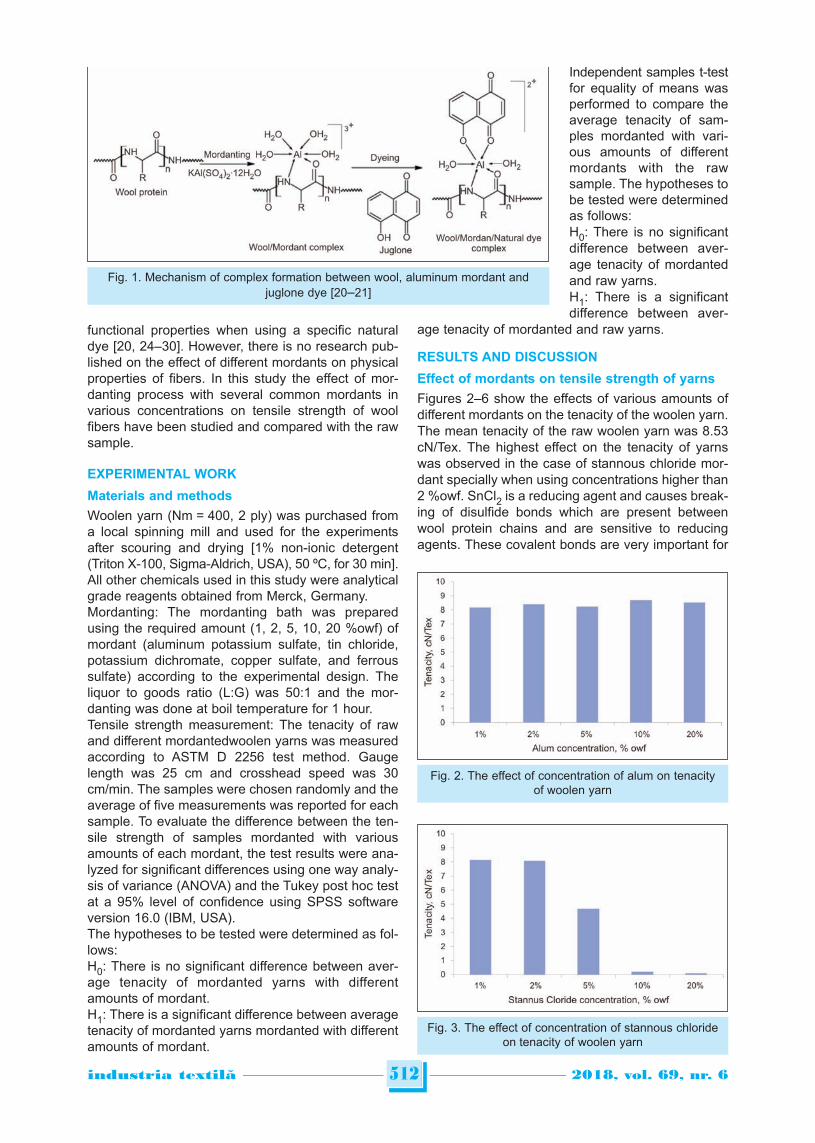
functional properties when using a specific naturaldye [20, 24–30]. However, there is no research pub-lished on the effect of different mordants on physicalproperties of fibers. In this study the effect of mor-danting process with several common mordants invarious concentrations on tensile strength of woolfibers have been studied and compared with the rawsample.
EXPERIMENTAL WORK
Materials and methods
Woolen yarn (Nm = 400, 2 ply) was purchased froma local spinning mill and used for the experimentsafter scouring and drying [1% non-ionic detergent(Triton X-100, Sigma-Aldrich, USA), 50 ºC, for 30 min].All other chemicals used in this study were analyticalgrade reagents obtained from Merck, Germany.Mordanting: The mordanting bath was preparedusing the required amount (1, 2, 5, 10, 20 %owf) ofmordant (aluminum potassium sulfate, tin chloride,potassium dichromate, copper sulfate, and ferroussulfate) according to the experimental design. Theliquor to goods ratio (L:G) was 50:1 and the mor-danting was done at boil temperature for 1 hour.Tensile strength measurement: The tenacity of rawand different mordantedwoolen yarns was measuredaccording to ASTM D 2256 test method. Gaugelength was 25 cm and crosshead speed was 30cm/min. The samples were chosen randomly and theaverage of five measurements was reported for eachsample. To evaluate the difference between the ten-sile strength of samples mordanted with variousamounts of each mordant, the test results were ana-lyzed for significant differences using one way analy-sis of variance (ANOVA) and the Tukey post hoc testat a 95% level of confidence using SPSS softwareversion 16.0 (IBM, USA). The hypotheses to be tested were determined as fol-lows: H0: There is no significant difference between aver-age tenacity of mordanted yarns with differentamounts of mordant.H1: There is a significant difference between averagetenacity of mordanted yarns mordanted with differentamounts of mordant.
Independent samples t-testfor equality of means wasperformed to compare theaverage tenacity of sam-ples mordanted with vari-ous amounts of differentmordants with the rawsample. The hypotheses tobe tested were determinedas follows: H0: There is no significantdifference between aver-age tenacity of mordantedand raw yarns.H1: There is a significantdifference between aver-
age tenacity of mordanted and raw yarns.
RESULTS AND DISCUSSION
Effect of mordants on tensile strength of yarns
Figures 2–6 show the effects of various amounts ofdifferent mordants on the tenacity of the woolen yarn.The mean tenacity of the raw woolen yarn was 8.53cN/Tex. The highest effect on the tenacity of yarnswas observed in the case of stannous chloride mor-dant specially when using concentrations higher than2 %owf. SnCl2 is a reducing agent and causes break-ing of disulfide bonds which are present betweenwool protein chains and are sensitive to reducingagents. These covalent bonds are very important for
512industria textila 2018, vol. 69, nr. 6˘
Fig. 1. Mechanism of complex formation between wool, aluminum mordant andjuglone dye [20–21]
Fig. 2. The effect of concentration of alum on tenacityof woolen yarn
Fig. 3. The effect of concentration of stannous chlorideon tenacity of woolen yarn
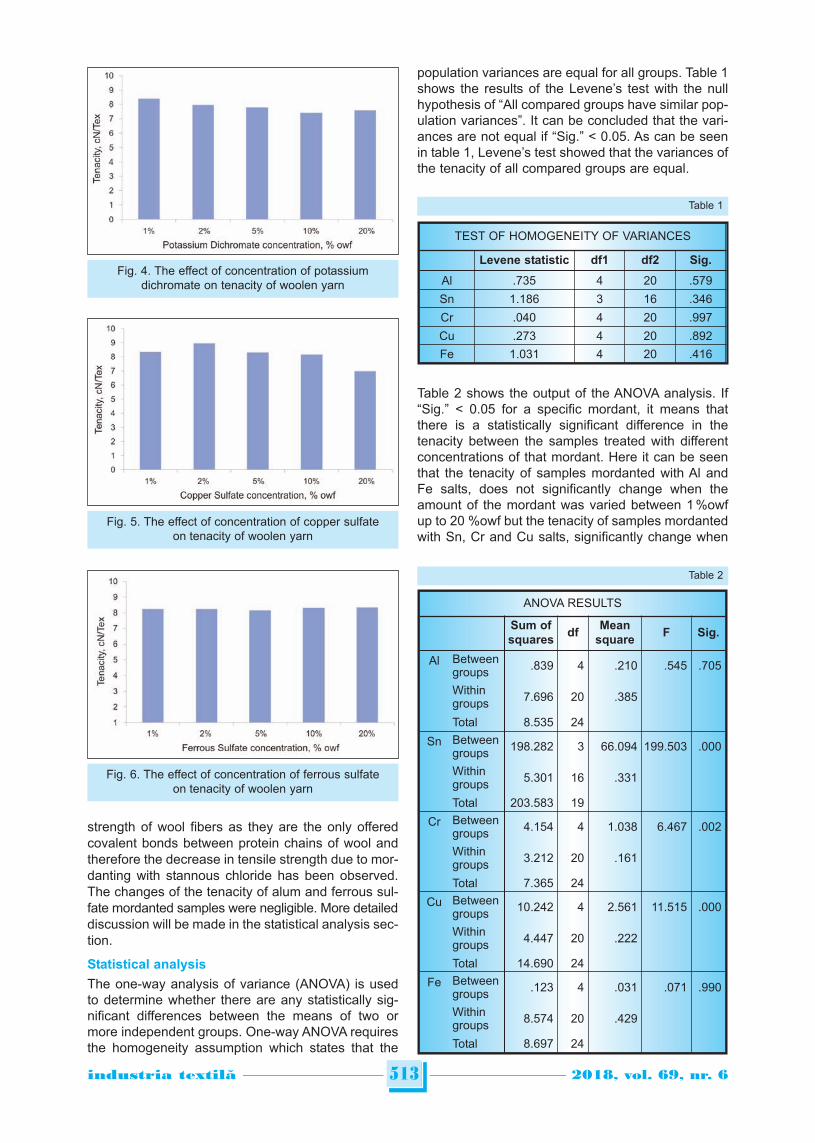
strength of wool fibers as they are the only offeredcovalent bonds between protein chains of wool andtherefore the decrease in tensile strength due to mor-danting with stannous chloride has been observed.The changes of the tenacity of alum and ferrous sul-fate mordanted samples were negligible. More detaileddiscussion will be made in the statistical analysis sec-tion.
Statistical analysis
The one-way analysis of variance (ANOVA) is usedto determine whether there are any statistically sig-nificant differences between the means of two ormore independent groups. One-way ANOVA requiresthe homogeneity assumption which states that the
population variances are equal for all groups. Table 1shows the results of the Levene’s test with the nullhypothesis of “All compared groups have similar pop-ulation variances”. It can be concluded that the vari-ances are not equal if “Sig.” < 0.05. As can be seenin table 1, Levene’s test showed that the variances ofthe tenacity of all compared groups are equal.
Table 2 shows the output of the ANOVA analysis. If“Sig.” < 0.05 for a specific mordant, it means thatthere is a statistically significant difference in thetenacity between the samples treated with differentconcentrations of that mordant. Here it can be seenthat the tenacity of samples mordanted with Al andFe salts, does not significantly change when theamount of the mordant was varied between 1 %owfup to 20 %owf but the tenacity of samples mordantedwith Sn, Cr and Cu salts, significantly change when
513industria textila 2018, vol. 69, nr. 6˘
TEST OF HOMOGENEITY OF VARIANCES
Levene statistic df1 df2 Sig.
Al .735 4 20 .579
Sn 1.186 3 16 .346
Cr .040 4 20 .997
Cu .273 4 20 .892
Fe 1.031 4 20 .416
Table 1
ANOVA RESULTS
Sum ofsquares
dfMean
squareF Sig.
Al Betweengroups .839 4 .210 .545 .705
Withingroups 7.696 20 .385
Total 8.535 24
Sn Betweengroups 198.282 3 66.094 199.503 .000
Withingroups 5.301 16 .331
Total 203.583 19
Cr Betweengroups 4.154 4 1.038 6.467 .002
Withingroups 3.212 20 .161
Total 7.365 24
Cu Betweengroups 10.242 4 2.561 11.515 .000
Withingroups 4.447 20 .222
Total 14.690 24
Fe Betweengroups .123 4 .031 .071 .990
Withingroups 8.574 20 .429
Total 8.697 24
Table 2
Fig. 4. The effect of concentration of potassiumdichromate on tenacity of woolen yarn
Fig. 5. The effect of concentration of copper sulfateon tenacity of woolen yarn
Fig. 6. The effect of concentration of ferrous sulfateon tenacity of woolen yarn
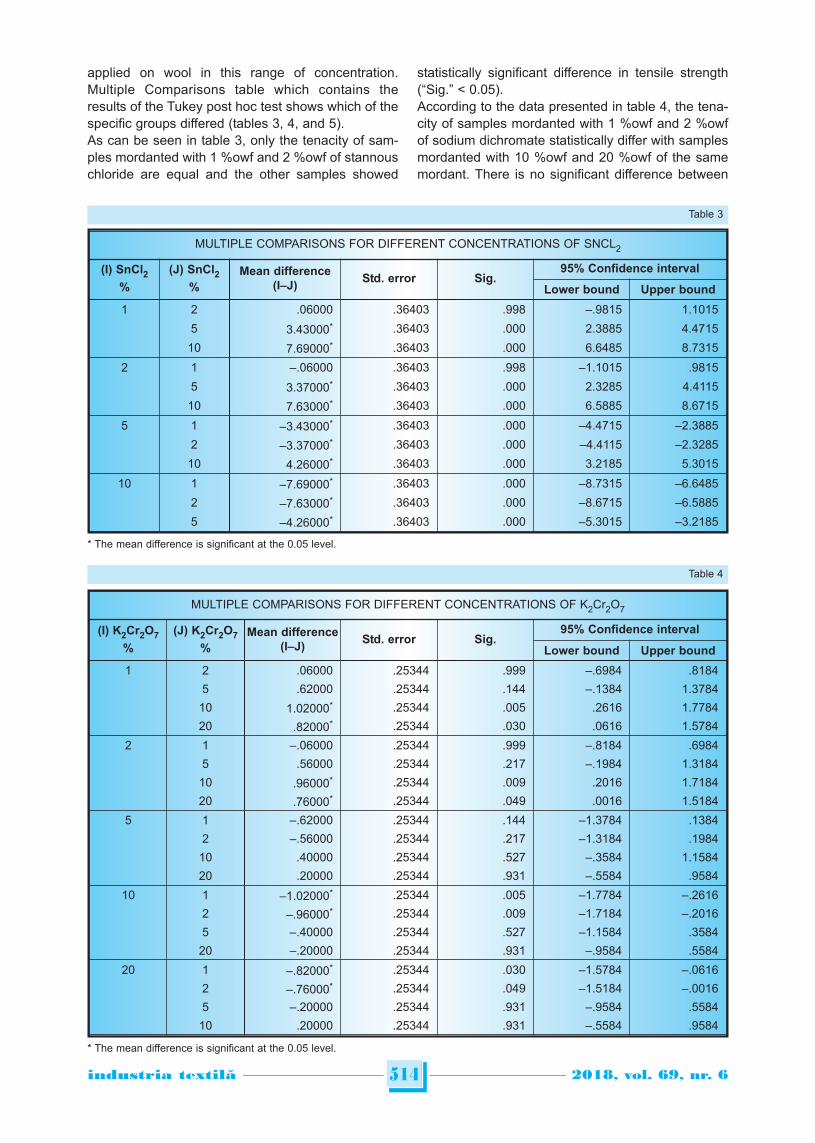
applied on wool in this range of concentration.Multiple Comparisons table which contains theresults of the Tukey post hoc test shows which of thespecific groups differed (tables 3, 4, and 5).As can be seen in table 3, only the tenacity of sam-ples mordanted with 1 %owf and 2 %owf of stannouschloride are equal and the other samples showed
statistically significant difference in tensile strength(“Sig.” < 0.05). According to the data presented in table 4, the tena-city of samples mordanted with 1 %owf and 2 %owfof sodium dichromate statistically differ with samplesmordanted with 10 %owf and 20 %owf of the samemordant. There is no significant difference between
514industria textila 2018, vol. 69, nr. 6˘
MULTIPLE COMPARISONS FOR DIFFERENT CONCENTRATIONS OF SNCL2
(I) SnCl2%
(J) SnCl2%
Mean difference(I–J)
Std. error Sig.95% Confidence interval
Lower bound Upper bound
1 2 .06000 .36403 .998 –.9815 1.1015
5 3.43000* .36403 .000 2.3885 4.4715
10 7.69000* .36403 .000 6.6485 8.7315
2 1 –.06000 .36403 .998 –1.1015 .9815
5 3.37000* .36403 .000 2.3285 4.4115
10 7.63000* .36403 .000 6.5885 8.6715
5 1 –3.43000* .36403 .000 –4.4715 –2.3885
2 –3.37000* .36403 .000 –4.4115 –2.3285
10 4.26000* .36403 .000 3.2185 5.3015
10 1 –7.69000* .36403 .000 –8.7315 –6.6485
2 –7.63000* .36403 .000 –8.6715 –6.5885
5 –4.26000* .36403 .000 –5.3015 –3.2185
MULTIPLE COMPARISONS FOR DIFFERENT CONCENTRATIONS OF K2Cr2O7
(I) K2Cr2O7
%
(J) K2Cr2O7
%
Mean difference(I–J)
Std. error Sig.95% Confidence interval
Lower bound Upper bound
1 2 .06000 .25344 .999 –.6984 .8184
5 .62000 .25344 .144 –.1384 1.3784
10 1.02000* .25344 .005 .2616 1.7784
20 .82000* .25344 .030 .0616 1.5784
2 1 –.06000 .25344 .999 –.8184 .6984
5 .56000 .25344 .217 –.1984 1.3184
10 .96000* .25344 .009 .2016 1.7184
20 .76000* .25344 .049 .0016 1.5184
5 1 –.62000 .25344 .144 –1.3784 .1384
2 –.56000 .25344 .217 –1.3184 .1984
10 .40000 .25344 .527 –.3584 1.1584
20 .20000 .25344 .931 –.5584 .9584
10 1 –1.02000* .25344 .005 –1.7784 –.2616
2 –.96000* .25344 .009 –1.7184 –.2016
5 –.40000 .25344 .527 –1.1584 .3584
20 –.20000 .25344 .931 –.9584 .5584
20 1 –.82000* .25344 .030 –1.5784 –.0616
2 –.76000* .25344 .049 –1.5184 –.0016
5 –.20000 .25344 .931 –.9584 .5584
10 .20000 .25344 .931 –.5584 .9584
Table 4
* The mean difference is significant at the 0.05 level.
* The mean difference is significant at the 0.05 level.
Table 3
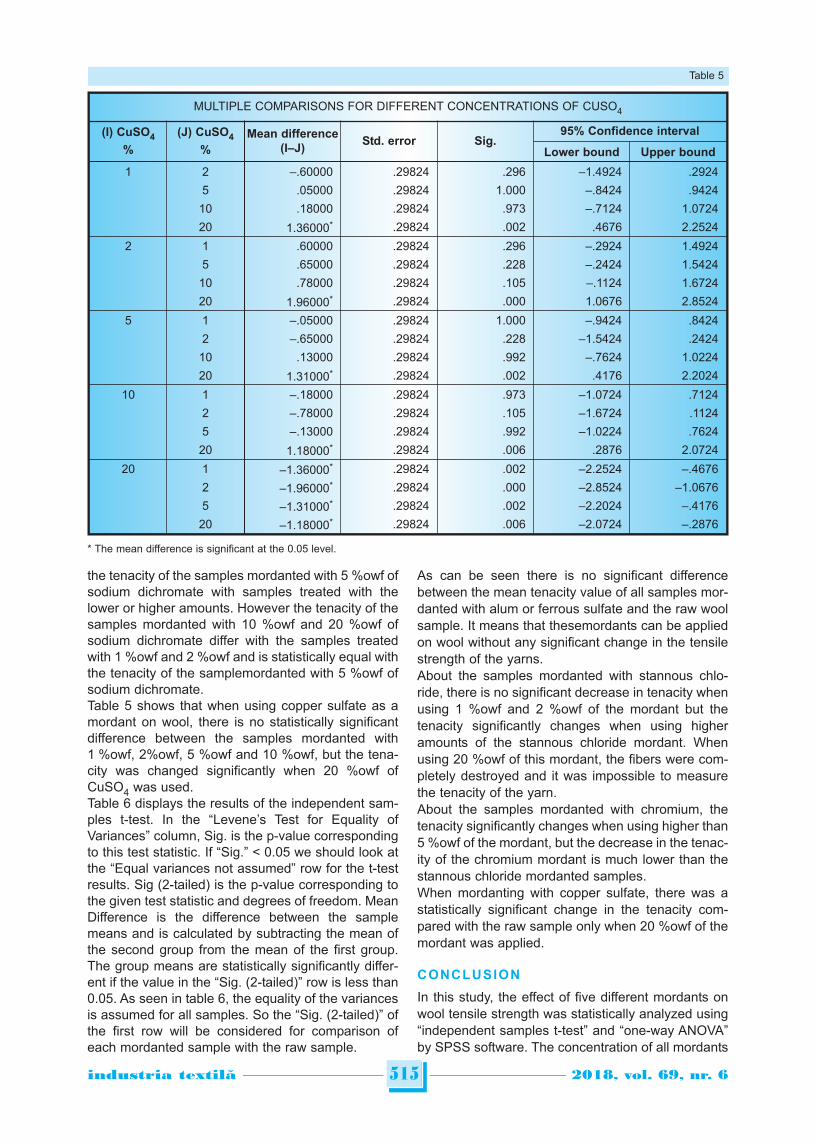
the tenacity of the samples mordanted with 5 %owf ofsodium dichromate with samples treated with thelower or higher amounts. However the tenacity of thesamples mordanted with 10 %owf and 20 %owf ofsodium dichromate differ with the samples treatedwith 1 %owf and 2 %owf and is statistically equal withthe tenacity of the samplemordanted with 5 %owf ofsodium dichromate.Table 5 shows that when using copper sulfate as amordant on wool, there is no statistically significantdifference between the samples mordanted with1 %owf, 2%owf, 5 %owf and 10 %owf, but the tena-city was changed significantly when 20 %owf ofCuSO4 was used.Table 6 displays the results of the independent sam-ples t-test. In the “Levene’s Test for Equality ofVariances” column, Sig. is the p-value correspondingto this test statistic. If “Sig.” < 0.05 we should look atthe “Equal variances not assumed” row for the t-testresults. Sig (2-tailed) is the p-value corresponding tothe given test statistic and degrees of freedom. MeanDifference is the difference between the samplemeans and is calculated by subtracting the mean ofthe second group from the mean of the first group.The group means are statistically significantly differ-ent if the value in the “Sig. (2-tailed)” row is less than0.05. As seen in table 6, the equality of the variancesis assumed for all samples. So the “Sig. (2-tailed)” ofthe first row will be considered for comparison ofeach mordanted sample with the raw sample.
As can be seen there is no significant differencebetween the mean tenacity value of all samples mor-danted with alum or ferrous sulfate and the raw woolsample. It means that thesemordants can be appliedon wool without any significant change in the tensilestrength of the yarns. About the samples mordanted with stannous chlo-ride, there is no significant decrease in tenacity whenusing 1 %owf and 2 %owf of the mordant but thetenacity significantly changes when using higheramounts of the stannous chloride mordant. Whenusing 20 %owf of this mordant, the fibers were com-pletely destroyed and it was impossible to measurethe tenacity of the yarn.About the samples mordanted with chromium, thetenacity significantly changes when using higher than5 %owf of the mordant, but the decrease in the tenac-ity of the chromium mordant is much lower than thestannous chloride mordanted samples.When mordanting with copper sulfate, there was astatistically significant change in the tenacity com-pared with the raw sample only when 20 %owf of themordant was applied.
CONCLUSION
In this study, the effect of five different mordants onwool tensile strength was statistically analyzed using“independent samples t-test” and “one-way ANOVA”by SPSS software. The concentration of all mordants
515industria textila 2018, vol. 69, nr. 6˘
MULTIPLE COMPARISONS FOR DIFFERENT CONCENTRATIONS OF CUSO4
(I) CuSO4
%
(J) CuSO4
%
Mean difference(I–J)
Std. error Sig.95% Confidence interval
Lower bound Upper bound
1 2 –.60000 .29824 .296 –1.4924 .2924
5 .05000 .29824 1.000 –.8424 .9424
10 .18000 .29824 .973 –.7124 1.0724
20 1.36000* .29824 .002 .4676 2.2524
2 1 .60000 .29824 .296 –.2924 1.4924
5 .65000 .29824 .228 –.2424 1.5424
10 .78000 .29824 .105 –.1124 1.6724
20 1.96000* .29824 .000 1.0676 2.8524
5 1 –.05000 .29824 1.000 –.9424 .8424
2 –.65000 .29824 .228 –1.5424 .2424
10 .13000 .29824 .992 –.7624 1.0224
20 1.31000* .29824 .002 .4176 2.2024
10 1 –.18000 .29824 .973 –1.0724 .7124
2 –.78000 .29824 .105 –1.6724 .1124
5 –.13000 .29824 .992 –1.0224 .7624
20 1.18000* .29824 .006 .2876 2.0724
20 1 –1.36000* .29824 .002 –2.2524 –.4676
2 –1.96000* .29824 .000 –2.8524 –1.0676
5 –1.31000* .29824 .002 –2.2024 –.4176
20 –1.18000* .29824 .006 –2.0724 –.2876
* The mean difference is significant at the 0.05 level.
Table 5
516industria textila 2018, vol. 69, nr. 6˘
INDEPENDENT SAMPLES TEST
Levene’s testfor equalityof variances
t-test for equality of means
F Sig. t dfSig.
(2-tailed)Mean
differenceStd. errordifference
95% Confidence inter-val of the difference
Lower Upper
Al 1% Equal variances assumed .022 .885 –1.214 8 .259 –.36200 .29821 –1.04968 .32568Equal variances not assumed –1.214 7.892 .260 –.36200 .29821 –1.05132 .32732
Al 2% Equal variances assumed .018 .896 –.449 8 .666 –.12000 .26756 –.73699 .49699Equal variances not assumed –.449 7.925 .666 –.12000 .26756 –.73800 .49800
Al 5% Equal variances assumed .102 .758 –.938 8 .376 –.30000 .31980 –1.03747 .43747Equal variances not assumed –.938 7.591 .377 –.30000 .31980 –1.04444 .44444
Al 10% Equal variances assumed .000 1.000 .490 8 .638 .14000 .28596 –.51943 .79943Equal variances not assumed .490 7.987 .638 .14000 .28596 –.51961 .79961
Al 20% Equal variances assumed 1.269 .293 –.041 8 .968 –.02000 .48637 –1.14158 1.10158Equal variances not assumed –.041 5.532 .969 –.02000 .48637 –1.23497 1.19497
Sn 1% Equal variances assumed .179 .684 –1.661 8 .135 –.41000 .24679 –.97911 .15911Equal variances not assumed –1.661 7.382 .138 –.41000 .24679 –.98751 .16751
Sn 2% Equal variances assumed .132 .726 –1.431 8 .190 –.47000 .32838 –1.22725 .28725Equal variances not assumed –1.431 7.450 .193 –.47000 .32838 –1.23709 .29709
Sn 5% Equal variances assumed .825 .390 –8.459 8 .000 –3.84000 .45395 –4.88682 –2.79318Equal variances not assumed –8.459 5.784 .000 –3.84000 .45395 –4.96090 –2.71910
Sn 10% Equal variances assumed 1.334 .281 –37.249 8 .000 –8.10000 .21746 –8.60146 –7.59854Equal variances not assumed –37.249 5.568 .000 –8.10000 .21746 –8.64225 –7.55775
Cr 1% Equal variances assumed .002 .963 –.437 8 .674 –.12000 .27480 –.75369 .51369Equal variances not assumed –.437 7.987 .674 –.12000 .27480 –.75387 .51387
Cr 2% Equal variances assumed .109 .750 –.729 8 .487 –.18000 .24679 –.74911 .38911Equal variances not assumed –.729 7.382 .488 –.18000 .24679 –.75751 .39751
Cr 5% Equal variances assumed .012 .915 –2.751 8 .025 –.74000 .26896 –1.36021 –.11979Equal variances not assumed –2.751 7.942 .025 –.74000 .26896 –1.36101 –.11899
Cr 10% Equal variances assumed .053 .824 –4.398 8 .002 –1.14000 .25922 –1.73776 –.54224Equal variances not assumed –4.398 7.778 .002 –1.14000 .25922 –1.74074 .53926
Cr 20% Equal variances assumed .001 .974 –3.304 8 .011 –.94000 .28453 –1.59613 –.28387Equal variances not assumed –3.304 7.993 .011 –.94000 .28453 –1.59623 –.28377
Cu 1% Equal variances assumed .004 .949 –.627 8 .548 –.18000 .28725 –.84241 .48241Equal variances not assumed –.627 7.981 –.548 –.18000 .28725 –.84268 .48268
Cu 2% Equal variances assumed .006 .942 1.441 8 .188 .42000 .29151 –.25222 1.09222Equal variances not assumed 1.441 7.954 .188 .42000 .29151 –.25289 1.09289
Cu 5% Equal variances assumed .072 .795 –.749 8 .476 –.23000 .30727 –.93857 .47857Equal variances not assumed –.749 7.780 .476 –.23000 .30727 –.94207 .48207
Cu 10% Equal variances assumed .142 .716 –1.128 8 .292 –.36000 .31924 –1.09617 .37617Equal variances not assumed –1.128 7.600 .294 –.36000 .31924 –1.10297 .38297
Cu 20% Equal variances assumed .549 .480 –6.574 8 .000 –1.54000 .23426 –2.08020 –.99980Equal variances not assumed –6.574 6.746 .000 –1.54000 .23426 –2.09819 –.98181
Fe 1% Equal variances assumed .043 .841 –.935 8 .377 –.29000 .31031 –1.00559 .42559Equal variances not assumed –.935 7.737 .378 –.29000 .31031 –1.00985 .42985
Fe 2% Equal variances assumed 1.172 .311 –1.397 8 .200 –.31000 .22198 –.82189 .20189Equal variances not assumed –1.397 5.914 .213 –.31000 .22198 –.85507 .23507
Fe 5% Equal variances assumed .105 .754 –1.196 8 .266 –.38000 .31766 –1.11252 .35252Equal variances not assumed –1.196 7.625 .267 –.38000 .31766 –1.11884 .35884
Fe 10% Equal variances assumed 1.129 .319 –.401 8 .699 –.22000 .54801 –1.48371 1.04371Equal variances not assumed –.401 5.177 .704 –.22000 .54801 –1.61436 1.17436
Fe 20% Equal variances assumed .001 .973 –.643 8 .538 –.18000 .27975 –.82509 .46509Equal variances not assumed –.643 8.000 .538 –.18000 .27975 –.82510 .46510
Table 6
was varying between 1 %owf and 20 %owf. Theresults showed that alum and ferrous sulfate had nosignificant effect on the tensile strength of wool andthere was no statistically significant differencebetween the tenacity of samples mordanted with dif-ferent concentrations of these mordants. Samplesmordanted with 20 %owf of sodium dichromate and
copper sulfate exhibited statistically significantdecrease in tensile strength while the sample mor-danted with 20 %owf of stannous chloride was com-pletely destroyed. The loss of tensile strength forsamples mordanted with stannous chloride havingconcentrations higher than 2 %owf was statisticallysignificant.
517industria textila 2018, vol. 69, nr. 6˘
BIBLIOGRAPHY
[1] Burkinshaw, S. M., Kumar, N. The mordant dyeing of wool using tannic acid and FeSO4, Part 1: Initial findings. In:Dyes and Pigments, 2009, vol. 80, issue 1, pp. 53–60.
[2] Campanella, B., Degano, I., Grifoni, E., Legnaioli, S., Lorenzetti, G., Pagnotta, S., Poggialini, F., Palleschi, V.Identification of inorganic dyeing mordant in textiles by surface-enhanced laser-induced breakdown spectroscopy.In: Microchemical Journal, 2018,vol. 139, issue, pp. 230–235.
[3] Erdem İşmal, Ö., Yıldırım, L., Özdoğan, E. Valorisation of almond shell waste in ultrasonic biomordanted dyeing:alternatives to metallic mordants. In: The Journal of The Textile Institute, 2015, vol. 106, issue 4, pp. 343–353.
[4] Ding, Y., Freeman, H. S. Mordant dye application on cotton: optimisation and combination with natural dyes. In:Coloration Technology, 2017, vol. 133, issue 5, pp. 369–375.
[5] Baaka, N., Haddar, W., Ben Ticha, M., Amorim, M. T. P., M’Henni, M. F. Sustainability issues of ultrasonic wooldyeing with grape pomace colourant. In: Natural Product Research, 2017, pp. 1–8.
[6] Sajed, T., Haji, A., Mehrizi, M. K., Nasiri Boroumand, M. Modification of wool protein fiber with plasma anddendrimer: Effects on dyeing with cochineal. In: International Journal of Biological Macromolecules, 2018, vol. 107,issue Part A, pp. 642–653.
[7] Ben Ticha, M., Haddar, W., Meksi, N., Guesmi, A., Mhenni, M. F. Improving dyeability of modified cotton fabrics bythe natural aqueous extract from red cabbage using ultrasonic energy. In: Carbohydrate Polymers, 2016, vol. 154,issue, pp. 287–295.
[8] Molakarimi, M., Khajeh Mehrizi, M., Haji, A. Effect of plasma treatment and grafting of β-cyclodextrin on colorproperties of wool fabric dyed with Shrimp shell extract. In: The Journal of The Textile Institute, 2016, vol. 107, issue10, pp. 1314–1321.
[9] Gaidau, C., Niculescu, M.-D., Surdu, L., Dinca, L., Barbu, I. Improved properties of wool on sheepskins by lowpressure plasma treatment. In: Industria Textila, 2017, vol. 68, issue 3, pp. 193–196.
[10] Vankar, P. S., Shukla, D., Wijayapala, S. Innovative Silk dyeing using Enzyme and Rubia cordifolia extract at roomtemperature. In: Pigment & Resin Technology, 2017, vol. 46, issue 4, p. null.
[11] Zahid, M., Bhatti, I. A., Adeel, S., Saba, S. Modification of cotton fabric for textile dyeing: industrial mercerizationversus gamma irradiation. In: The Journal of The Textile Institute, 2017, vol. 108, issue 2, pp. 287–292.
[12] Stanculescu, I., Chirila, L., Popescu, A., Cutrubinis, M. Gamma pre-irradiation effects on natural dyeingperformances of proteinic blended yarns. In: Environmental Engineering and Management Journal, 2017, vol. 16,issue 4, pp. 913–920.
[13] Hussaan, M., Iqbal, N., Adeel, S., Azeem, M., Tariq Javed, M., Raza, A. Microwave-assisted enhancement ofmilkweed (Calotropis procera L.) leaves as an eco-friendly source of natural colorants for textile. In: EnvironmentalScience and Pollution Research, 2017, vol. 24, issue 5, pp. 5089–5094.
[14] Haji, A. Antibacterial dyeing of wool with natural cationic dye using metal mordants. In: Materials Science(Medžiagotyra), 2012, vol. 18, issue 3, pp. 267–270.
[15] Haji, A., Qavamnia, S. S. Response surface methodology optimized dyeing of wool with cumin seeds extractimproved with plasma treatment. In: Fibers and Polymers, 2015, vol. 16, issue 1, pp. 46–53.
[16] Erdem İşmal, Ö., Özdoğan, E., Yıldırım, L. An alternative natural dye, almond shell waste: effects of plasma andmordants on dyeing properties. In: Coloration Technology, 2013, vol. 129, issue 6, pp. 431–437.
[17] Barani, H., Rezaee, K., Maleki, H. Influence of dyeing conditions of natural dye extracted from Berberis integerrimafruit on color shade of woolen yarn. In: Journal of Natural Fibers, 2018, pp. 1–12.
[18] Barani, H., Rezaee, K. Optimization of dyeing process using achillea pachycephala as a natural dye for wool fibers.In: Chiang Mai Journal of Science, 2017, vol. 44, issue 4, pp. 1548–1561.
[19] Benli, H. An investigation of dyeability of wool fabric with red cabbage (Brassica oleracea L. var.) extract. In:Industria Textila, 2017, vol. 68, issue 2, pp. 108–115.
[20] Bukhari, M. N., Shahid-ul-Islam, Shabbir, M., Rather, L. J., Shahid, M., Singh, U., Khan, M. A., Mohammad, F.Dyeing studies and fastness properties of brown naphtoquinone colorant extracted from Juglans regia L on naturalprotein fiber using different metal salt mordants. In: Textiles and Clothing Sustainability, 2017, vol. 3, issue 1,pp. 1–9.
[21] Haji, A., Qavamnia, S. S., Nasiriboroumand, M. The use of D-optimal design in optimization of wool dyeing withJuglans regia bark. In: Industria Textila, 2018, vol. 69, issue 2, pp. 104–110.
518industria textila 2018, vol. 69, nr. 6˘
[22] ul-Islam, S., Rather, L. J., Shabbir, M., Bukhari, M. N., Khan, M. A., Mohammad, F. First application of mix metallicsalt mordant combinations to develop newer shades on wool with Bixa orellana natural dye using reflectancespectroscopy. In: Journal of Natural Fibers, 2018, vol. 15, issue 3, pp. 363–372.
[23] Bukhari, M. N., Shahid ul, I., Shabbir, M., Rather, L. J., Shahid, M., Khan, M. A., Mohammad, F. Effect of binary andternary combination of metal salt mordants on dyeing and fastness properties of natural protein fibre with Juglansregia L. dye. In: Journal of Natural Fibers, 2017, vol. 14, issue 4, pp. 519–529.
[24] Haddar, W., Ben Ticha, M., Meksi, N., Guesmi, A. Application of anthocyanins as natural dye extracted fromBrassica oleracea L. var. capitata f. rubra: dyeing studies of wool and silk fibres In: Natural Product Research, 2018,vol. 32, issue 2, pp. 141–148.
[25] ul-Islam, S., Rather, L. J., Shabbir, M., Bukhari, M. N., Khan, M. A., Mohammad, F. First application of mix metallicsalt mordant combinations to develop newer shades on wool with Bixa orellana natural dye using reflectancespectroscopy. In: Journal of Natural Fibers, 2017, pp. 1–10.
[26] Bhuiyan, M. A. R., Islam, A., Ali, A., Islam, M. N. Color and chemical constitution of natural dye henna (Lawsoniainermis L) and its application in the coloration of textiles. In: Journal of Cleaner Production, 2017, vol. 167, issueSupplement C, pp. 14–22.
[27] Büyükakinci, B. Y., Investigation of dyeing methods on wool fabrics with hibiscus and its antibacterial efficiency. In:Industria Textila, 2017, vol. 68, issue 2, pp. 103-107
[28] Inan, M., Kaya, D. A., Kirici, S. The effect of dye plant amounts on color and color fastness of wool yarns. In:Industria Textila, 2014, vol. 65, issue 1, pp. 29–32.
[29] Baaka, N., Ben Ticha, M., Haddar, W., Amorim, M. T. P., Mhenni, M. F. Upgrading of UV protection properties ofseveral textile fabrics by their dyeing with grape pomace colorants. In: Fibers and Polymers, 2018, vol. 19, issue 2,pp. 307–312.
[30] Shahid, M., Shahid ul, I., Rather, L. J., Manzoor, N., Mohammad, F. Simultaneous shade development, antibacterial,and antifungal functionalization of wool using Punica granatum L. Peel extract as a source of textile dye. In: Journalof Natural Fibers, 2018, pp. 1–12.
Authors:
AMINODDIN HAJI1
MAJID NASIRIBOROUMAND2
1Department of Textile Engineering, Yazd University, Yazd, Iran
2Department of Carpet, Faculty of Art, Shahid Bahonar University of Kerman, Kerman, Iran
e-mail: [email protected]; [email protected]
Corresponding author:
AMINODDIN HAJI
e-mail: [email protected]
INTRODUCTION
Clothing fit is one of the most important factors thataffect consumers’ purchasing behaviour and bodymovement comfort. In order for a garment fitting tothe body, the patterns must be compatible with thebody sizes and shapes of the person. Fabricationclothing that can fit the body is one of the most impor-tant competitive advantages for companies that man-ufacture by using mass production-based measure-ments.A lot of research is present in the international litera-ture on patternmaking of different body types, bodysizes, and garment groups. Some of the studies con-ducted can be summarized as follows.Connell et al. (2003) noted that body-type analysis istheoretically the basis of body size measurement. Intheir work, the researchers examined the body typesof women in America [1].Schofield et al. (2006) published a study, whichexplored fitting pantsof 176 women aged 55 and old-erto be able to see the relation between sizing, bodyand pattern shape in clothes. According to the resultsof the study, body shapes have been presented assubsetgroups and the personalized productions were
recommended as a solution to the problem of cloth-ing fit to the body [2].Cho et al. (2006) stated that consumers demandpersonal clothing and variety in their study. Theresearchers emphasized that not only body sizes butalso body shapesmust be taken into account duringthe preparation of the patterns of personal clothes [3].In their study, Connell et al. (2006) developed a newtool called the Body Shape Assessment Scale(BSAS) ©, which analyses female body shapes andexplained how it works [4].Lee et al. (2007) compared the body shapes ofAmerican and Korean women by race and age intheir study. The study found that the largest shapecategory was the rectangle shape in both countries,but the distribution within each shape category forKorean women was different from that of USAwomen. More body shape categories were found inthe USA women than in Korean women. They point-ed out that body shape is one of the main factors inclothing fit and clothing comfort [5].In their study, Shin et al. (2007) revealed that ethnicgroups had different fit problems and significant bodyshape differences [6].
519industria textila 2018, vol. 69, nr. 6˘
Impacts of female body shapes on patternmaking
NEZLA ÜNAL EMİNE UTKUN
REZUMAT – ABSTRACT
Impactul formelor corpului feminine asupra creării tiparelor
Îmbrăcămintea potrivită este unul dintre cei mai importanți factori care determină comportamentul cumpărătorilor șiconfortul mișcării corpului.Acest studiu își propune să examineze efectele diferitelor forme de corp feminin asupra modelului de îmbrăcăminte. Înacest scop, au fost prelevate și clasificate în funcție de forma și dimensiunile corpului măsurătorile corpului a 231 defemei cu vârsta cuprinsă între 18 și 25 de ani. Impactul formelor corpului a fost investigat pe modelul de bază deîmbrăcăminte cu standard de ajustare pregătit în sistemul de creare a tiparelor Müller & Sohn.Modelele de bază ale rochiilor de damă ajustate pe corp cu măsura 36 și cu formă a corpului dreptunghiulară și tip parăau fost ajustate, iar aceste ajustări au fost comparate. În timp ce ajustările de model s-au efectuat în funcție de formacorpului dreptunghiuluară și de cea tip pară, modificările necesare au fost făcute pe întreaga înălțime, circumferințasânilor, talie, șold și partea frontală și au fost efectuate măsurători de lungime medie în partea din față și spate.
Cuvinte-cheie: potrivirea îmbrăcămintei, ajustări ale modelului, forme ale corpului, confortul mișcării corpului
Impacts of female body shapes on patternmaking
Clothing fit is one of the most important factors that affect consumers’ purchasing behaviour and body movementcomfort. This study aims to examine the effects of different female body shapes on clothing pattern design. For this purpose,body measurements of 231 women aged between 18 and 25 were taken and classified according to body shapes andsizes. Then the impacts of body shapes were investigated on basic dress pattern drawing with standard dart preparedin Müller&Sohn patternmaking system.Darted basic dress patterns of women who had a body size of 36 and piled up in pear and rectangle body shapes wereadjusted, and these adjustments were compared. While pattern adjustments were carried out according to the rectan-gle and pear body shape, necessary changes were made on the full height, the girths of breasts, waist, hip and front,back and front average length measurements.
Keywords: fitting, pattern adjustments, body shapes, body movement comfort
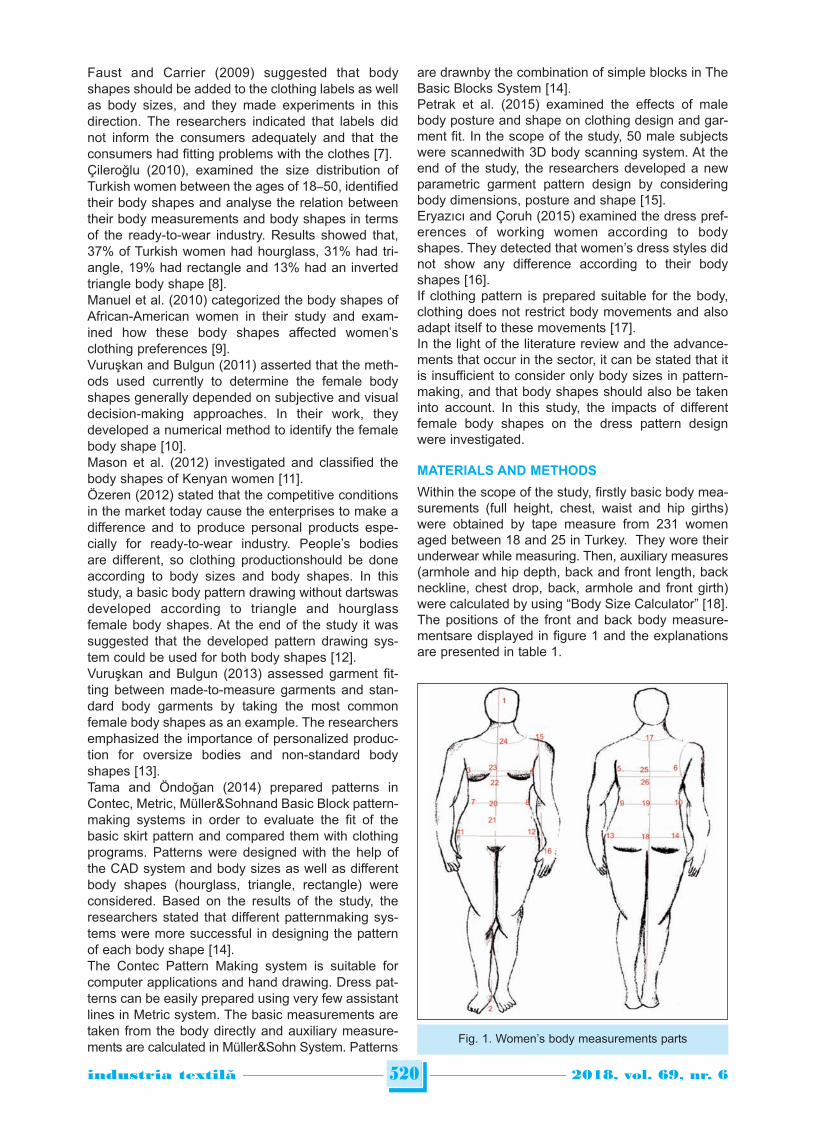
Faust and Carrier (2009) suggested that bodyshapes should be added to the clothing labels as wellas body sizes, and they made experiments in thisdirection. The researchers indicated that labels didnot inform the consumers adequately and that theconsumers had fitting problems with the clothes [7].Çileroğlu (2010), examined the size distribution ofTurkish women between the ages of 18–50, identifiedtheir body shapes and analyse the relation betweentheir body measurements and body shapes in termsof the ready-to-wear industry. Results showed that,37% of Turkish women had hourglass, 31% had tri-angle, 19% had rectangle and 13% had an invertedtriangle body shape [8].Manuel et al. (2010) categorized the body shapes ofAfrican-American women in their study and exam-ined how these body shapes affected women’sclothing preferences [9].Vuruşkan and Bulgun (2011) asserted that the meth-ods used currently to determine the female bodyshapes generally depended on subjective and visualdecision-making approaches. In their work, theydeveloped a numerical method to identify the femalebody shape [10].Mason et al. (2012) investigated and classified thebody shapes of Kenyan women [11].Özeren (2012) stated that the competitive conditionsin the market today cause the enterprises to make adifference and to produce personal products espe-cially for ready-to-wear industry. People’s bodiesare different, so clothing productionshould be doneaccording to body sizes and body shapes. In thisstudy, a basic body pattern drawing without dartswasdeveloped according to triangle and hourglassfemale body shapes. At the end of the study it wassuggested that the developed pattern drawing sys-tem could be used for both body shapes [12].Vuruşkan and Bulgun (2013) assessed garment fit-ting between made-to-measure garments and stan-dard body garments by taking the most commonfemale body shapes as an example. The researchersemphasized the importance of personalized produc-tion for oversize bodies and non-standard bodyshapes [13].Tama and Öndoğan (2014) prepared patterns inContec, Metric, Müller&Sohnand Basic Block pattern-making systems in order to evaluate the fit of thebasic skirt pattern and compared them with clothingprograms. Patterns were designed with the help ofthe CAD system and body sizes as well as differentbody shapes (hourglass, triangle, rectangle) wereconsidered. Based on the results of the study, theresearchers stated that different patternmaking sys-tems were more successful in designing the patternof each body shape [14].The Contec Pattern Making system is suitable forcomputer applications and hand drawing. Dress pat-terns can be easily prepared using very few assistantlines in Metric system. The basic measurements aretaken from the body directly and auxiliary measure-ments are calculated in Müller&Sohn System. Patterns
are drawnby the combination of simple blocks in TheBasic Blocks System [14]. Petrak et al. (2015) examined the effects of malebody posture and shape on clothing design and gar-ment fit. In the scope of the study, 50 male subjectswere scannedwith 3D body scanning system. At theend of the study, the researchers developed a newparametric garment pattern design by consideringbody dimensions, posture and shape [15].Eryazıcı and Çoruh (2015) examined the dress pref-erences of working women according to bodyshapes. They detected that women’s dress styles didnot show any difference according to their bodyshapes [16].If clothing pattern is prepared suitable for the body,clothing does not restrict body movements and alsoadapt itself to these movements [17]. In the light of the literature review and the advance-ments that occur in the sector, it can be stated that itis insufficient to consider only body sizes in pattern-making, and that body shapes should also be takeninto account. In this study, the impacts of differentfemale body shapes on the dress pattern designwere investigated.
MATERIALS AND METHODS
Within the scope of the study, firstly basic body mea-surements (full height, chest, waist and hip girths)were obtained by tape measure from 231 womenaged between 18 and 25 in Turkey. They wore theirunderwear while measuring. Then, auxiliary measures(armhole and hip depth, back and front length, backneckline, chest drop, back, armhole and front girth)were calculated by using “Body Size Calculator” [18]. The positions of the front and back body measure-mentsare displayed in figure 1 and the explanationsare presented in table 1.
520industria textila 2018, vol. 69, nr. 6˘
Fig. 1. Women’s body measurements parts
The body sizes of the women were determinedaccording to the Müller&Sohn pattern making systemby using data in table 2.After establishing body size, women were classifiedaccording to body shapes. These shapes have beenclassified using geometric figures, rods, lines or fruitformsin the literature. In this study, Rosen’s classification was used. Rosen(2005) namedthe seven groups representing femalebody shapes as proportioned, rectangle, pear, apple,hourglass, diamond, and round [19].While female body shapes are classified:• Pear body type; women whose chest girthisat least
8 cm less than their hip girth;• Apple body type; women whose chest girth is at
least 9 cm more than their hip girth;• Rectangle body type; women who have a differ-
ence of 7 cm or less between their chest and hipgirths;
• Hourglassbody type; women whose chest girthis atleast 37 cm larger than their waist girth [20, 21, 22,23].
Finally, the impacts of body shapes on pattern draw-ing were investigated on basic body pattern drawingwith standard darts prepared in Müller&Sohn pattern-making system, pattern adjustments were made andthese adjustments were compared. These adjust-ments were madewith the help of the data obtainedby calculating the arithmetic mean of the basic andauxiliary body measurements of 36-size women withpear and rectangle body shapes where piling upwas-determined.
In this study, in order for the dress pattern drawingsto be done, first 36-body size, darted basic body pat-tern with standard posture and expansion drawingswere made. Later on, based on the measurementsobtained, adjustments were made on the 36-body-size, darted basic dress pattern drawings accordingto pear and rectangle body shapes.
FINDINGS
Table 3 illustrates the distribution of the women bybody shape and size.
According to the data obtained from 231 women itwas determined that 90 women had pear, 126women had rectangle and 15 women had apple bodyshape.A total of 31out of 90 women with pear and 28 out of126 women with rectangle body shape were of 36-body size. It was revealed that the piling upin bothbody shapes was in 36-body size.A comparison of the differences in 36-sized femalebody measurements according to rectangle and pearbody shapes is displayed in table 4.Figures 2 and 3 show pattern adjustments appliedaccording to the rectangle and pear body shapesaccording to Müller&Sohn pattern making system.
CONCLUSION
Existing patternmaking systems mostly take intoaccount body measurements of the standard bodyshape and posture. Within the scope of this study, the
521industria textila 2018, vol. 69, nr. 6˘
Basicmeasurements
LineAuxiliary
measurementsLine
Auxiliarymeasurements
Line
Full length 1–2 Armhole depth 17–26 Front length I 24–21
Breasts girth 3–4 & 5–6 Back neckline 17 Front length II 20–24
Waist girth 7–8 & 9–10 Hip drop 17–18 Back girth 5–6
Hip size 11–12 & 13–14 Breasts drop I 22–24 Armhole width 3–5/4–6Sleeve length 15–16 Breasts drop II 23–24 Front girth
Back length3–4
17–19
Table 1
Breasts girth Size no.
Between 80 and 83 cm 34
Between 84 and 87 cm 36
Between 88 and 91 cm 38
Between 92 and 95 cm 40
Between 96 and 99 cm 42
Between 100 and 103 cm 44
Between 104 and 109 cm 46
Between 110 and 115 cm 48
Between 116 and 121 cm 50
Between 122 and 127 cm 52
Between 128 and 133 cm 54
Table 2
Bodysize
Body shapes (n)
Pear Apple Rectangle Total
34 10 0 11 2136 31 0 28 5938 8 1 22 3140 10 1 18 2942 14 1 7 2244 1 5 12 1846 7 0 8 1548 8 3 11 2250 1 4 4 952 0 0 3 354 0 0 2 2
Total 90 15 126 231
Table 3
effects of different female body shapes on the pat-ternmakingwere examined and the patternmakingstages of different body shapes were compared.While pattern adjustments were carried outaccordingto the rectangle body shape; necessary changeswere made on the fullheight, breasts, waist,front andhip girths, back average length measurements.
When pattern adjustments were carried out accord-ing to the pear body shape; necessary changes weremade on the full height, breasts, waist and hip girth,back average length and front average length mea-surements.When pattern adjustments were carried out accord-ing to the rectangle and pear body shapes, it was
522industria textila 2018, vol. 69, nr. 6˘
Body shape with 36-SizeStandard Posture
36-Size Rectangle Body Shape 36-Size Pear Body Shape
Measurements Measurements Differences Measurements Differences
Full height 160 cm 162 cm 2 cm lengthened 163 cm 3 cm lengthened
Chest girth 84 cm 86 cm 2 cm enlarged 85 cm 1 cm enlarged
Waist girth 68 cm 67 cm 1 cm taken in 69 cm 1 cm enlarged
Hip girth 90 cm 89 cm 2 cm taken in 96 cm 6 cm enlarged
Armhole depth 19 cm 19 cm No difference 19 cm No difference
Back length 40 cm 41 cm 1 cm lengthened 41cm 1 cm lengthened
Hip depth 60 cm 60 cm No difference 60 cm No difference
Back neckline 6 cm 6 cm No difference 6 cm No difference
Breastsdepth I 31 cm 31 cm No difference 31 cm No difference
Breast depth II 25 cm 25 cm No difference 25 cm No difference
Front length I 44 cm 44 cm No difference 44 cm No difference
Front length II 50 cm 50 cm No difference 51 cm 1 cm lengthened
Back girth 16 cm 16 cm No difference 16 cm No difference
Armhole width 9 cm 9 cm No difference 9 cm No difference
Front girth 17 cm 18 cm 1 cm enlarged 17.5 cm 0.5 cm enlarged
Table 4
Fig. 2. 36-body size, darted basic dress patternadjustments according to the rectangle body
Fig. 3. 36-body size, darted basic dress patternadjustments according to the pear body shape
36-body size, standard darted basic dress pattern baselineAdjustment drawings according to pear body shape
36-body size, standard darted basic dress pattern baselineAdjustment drawings according to rectangle body shape
revealed that there were no changes in hollow fore-arm depth, hip drop, back neckline, breasts drop 1,breasts drop 2, front average length 2, back girth,
and hollow forearm girth, and no adjustments weremade.
523industria textila 2018, vol. 69, nr. 6˘
BIBLIOGRAPHY
[1] Connell, L.J., Ulrich, P., Knox, A., Hutton, G., Woronka, D., Ashdown, S. Body scan analysis for fit models basedon body shape and posture analysis, In: National Textile Center Annual Report, NTC Project S01-AC27, 2003.
[2] Schofield, N.A., Ashdown, S.P., Hethorn, J., LaBat, K., Salusso, C.J. Improving pant fit for women 55 and olderthrough an exploration of two pant shapes, In: Textile Research Journal, 2006, vol. 24, no. 2, pp. 147–160.
[3] Cho, Y., Komatsu, T., Inui, S., Takatera, M., Shimizu, Y., Park, H. Individual pattern making using computerizeddraping method for clothing, In: Textile Research Journal, 2006, vol. 76, no. 8, pp. 646–654.
[4] Connell, L.J., Ulrich, P.V., Brannon, E.L., Alexander, M., Presley, A.B. Body shape assessment scale: Instrumentdevelopment for analyzing female figures, In: Clothing & Textiles Research Journal, 2006, vol. 24, no. 2, pp. 80–95.
[5] Lee, J.Y., Istook, C.L., Nam, Y.J., Parl, S.M. Comparison of body shape between USA and Korean women, In:International Journal of Clothing Science and Technology, 2007, vol. 19, no. 5, pp. 374–391.
[6] Shin, S.J.H. and Istook, C.L. The importance of understanding the shape of diverse ethnic female consumers fordeveloping jeans sizing systems, In: International Journal of Consumer Studies, 2007, vol. 31, pp. 135–143.
[7] Faust, M.E. and Carrier, S. A. Proposal for a new size label to assist consumers in finding well-fitting women’sclothing, especially pants: An analysis of size USA female data and women’s ready-to-wear pants for NorthAmerican Companies, In: Textile Research Journal, 2009, vol. 79, no. 16, pp. 1446–1458.
[8] Çileroğlu, B. Body shapes of Turkish women: In terms of the ready-to-wear industry, In: Tekstil ve Konfeksiyon,2010, vol. 20, no. 2, pp. 130–136.
[9] Manuel, M.B., Connell, L.J., Presley, A.B. Body shape and fit preference in body cathexis and clothing benefitssought for prefessional African-American women, In: International Journal of Fashion Design, Technology andEducation, 2010, vol. 3, no. 1, pp. 25–32.
[10] Vuru_kan, A., Bulgun, E. Identification of female body shapes based on numerical evaluations, In: InternationalJournal of Clothing Science and Technology, 2011, vol. 23, no. 1, pp. 46–60.
[11] Mason, A.M., Klerk, H.M.D., Ashdown, S. Identification of a unique African female body shape, In: InternationalJournal of Fashion Design, Technology and Education, 2012, vol. 5, no. 2, pp. 105–116.
[12] Özeren, F. Pattern drafting for women by using individual measurement – dartless pattern model for different bodyshapes, In: Tekstil ve Konfeksiyon, 2012, vol. 22, no. 2, pp. 144–151.
[13] Vuru_kan, A., Bulgun, E. Fit analysis for made-to-measure garments, In: Journal of Textiles and Engineer, 2013,vol. 20, no. 90, pp. 42–53.
[14] Tama, D., Öndoğan, Z. Fitting evaluation of pattern making systems according to female body shapes, In: Fibers &Textiles in Eastern Europe, 2014, vol. 22, no. 4(106), pp. 107–111.
[15] Petrak, S., Mahnic, M., Rogale, D. Impact of male body posture and shape on design and garment fit, In: Fibers &Textiles in Eastern Europe, 2015, vol. 23, no. 6(114), pp. 150–158.
[16] Eryazıcı, E., Çoruh, E. Dress preferences of working women according to body shapes, In: Journal of Textiles andEngineer, 2015, vol. 22, no. 98, pp. 42–55.
[17] Utkun, E., Ünal, N. Improving fit of work uniforms used in laboratories and workshops, In: Industria Textila, 2017,vol. 68, no. 5, pp. 370–374.
[18] Utkun, E., Yeşil, E. Ünal, N. Development of a mobile-based application software body size calculator, In:Fibres&Textiles in Eastern Europe, 2018, vol. 26, no. 2(128), pp. 104–107.
[19] Rosen, S. Make it fit, In: Fairchild Publications, New York, USA, 2005. [20] Istanbul Metropolitan Municipality Art and Vocational Training Courses – Fashion Designer Books 1, 2, 3, 2004.[21] Pamuk, B. Application techniques – basic mold and sewing techniques, 1981, pp. 59–70.[22] Cihangir, E. Measurements in ready-made clothing, Istanbul Textile and Apparel Exporters’ Associations, 2002/1.[23] Ministry of National Education, Clothing Production Technology, Basic Female Body Forms 1, 542TGD027, Ankara,
2011, pp. 3–10.
Authors:
NEZLA ÜNAL , EMINE UTKUN
Pamukkale University, Buldan Vocational Training School, 20400, Denizli, Turkey
Corresponding author:
EMINE UTKUN
e-mail: [email protected]
Industria Textila 5/2018
Contents, pp. 419-421 – The translation in Romanian language is: Materiale izolatoare pentru construcții – o colaborare de succes în domeniul cercetării și dezvoltăriipentru prelucrarea fibrelor de lână în Romania
Scientific reviewers:
prof. dr. Andrei Demsar, University of Ljubliana, Sloveniaprof. dr. Krste Dimitrovski, University of Ljubliana, Slovenia