textila 2 2012 · 2019-08-28 · industria textila˘ 406 2017, vol. 68, nr. 6 407 415 421 427 435...
TRANSCRIPT
IndustriaTextila
ISSN 1222–5347
6/2017
COLEGIULDE REDACTIE:
Dr. ing. CARMEN GHIŢULEASACS I – DIRECTOR GENERAL
Institutul Naţional de Cercetare-Dezvoltare pentru Textile şi Pielărie – Bucureşti
Dr. ing. EMILIA VISILEANUCS I – EDITOR ŞEF
Institutul Naţional de Cercetare-Dezvoltare pentru Textile şi Pielărie – Bucureşti
Conf. univ. dr. ing. MARIANA URSACHEDECAN
Facultatea de Textile-Pielărieşi Management Industrial, Universitatea
Tehnică „Ghe. Asachi“ – Iaşi
Prof. dr. GELU oNoSECS I
Universitatea de Medicină şi Farmacie„Carol Davila“ – Bucureşti
Prof. dr. ing. ERHAN ÖNERMarmara University – Turcia
Prof. dr. S. MUGE YUKSELoGLUMarmara University – Turcia
Prof. univ. dr. DoINA I. PoPESCUAcademia de Studii Economice – Bucureşti
Prof. univ. dr. ing. CARMEN LoGHINFacultatea de Textile-Pielărie
şi Management Industrial, UniversitateaTehnică „Ghe. Asachi“ – Iaşi
Prof. univ. dr. MARGARETA STELEA FLoRESCUAcademia de Studii Economice – Bucureşti
Prof. ing. ARISTIDE DoDUMembru de onoare al Academiei de Ştiinţe
Tehnice din România
Prof. dr. ing. LUIS ALMEIDAUniversity of Minho – Portugal
Prof. dr. LUCIAN CoNSTANTIN HANGANUUniversitatea Tehnică „Ghe. Asachi“ – Iaşi
Dr. AMINoDDIN HAJI PhD, MSc, BSc, Textile Chemistry and Fiber Science
Assistant ProfessorTextile and Art Department
Islamic Azad University, Birjand BranchBirjand, Iran
GÜNAYDIN KARAKAN GIZEM, ÇEVEN ERHAN KENANStudiu privind proprietățile de rezistență la întindere și proprietățilede abraziune ale țesăturilor din fire de poliester de tip convenționalși ignifuge 407–414
SI CHEN, XIAo-qING WANGCaracterizarea proprietăților de impact și postimpact (CAI)ale compozitelor cu structură 3D 415–420
PoLoNA DoBNIK DUBRoVSKI, ABHIJIT MAJUMDAREfectele porozității deschise și ale parametrilor de construcțieasupra factorului de protecție la ultraviolete al țesăturilor 421–426
DENIZ oZDEN, GULDEMET BASAL Filtru HEPA acoperit cu nanofibră de poliamidă 6/chitosan pentrucontrolul bioaerosolului 427–434
ABDUL WAqAR RAJPUT, USMAN ALI, AMIR ABBAS, RANA AMJAD,SIDRA SALEEMIEfectul densității lineare a semitortului asupra parametrilor de calitateai firelor de bumbac 16 Nec 435–438
IULIANA IAŞNICU (STAMATE), GHEoRGHIŢA ToMESCU, oVIDIU VASILE, VIVIANA FILIP, SIMoNA MIHAIAnaliza influenței utilizării materialelor textile recuperate asupraproprietăților acustice ale materialelor compozite 439–445
NESMA SAoUSSEN ACHoUR, MoHAMED HAMDAoUI, SASSI BEN NASRALLAHEfectul parametrilor de evaporare şi tricotare asupra comportamentuluide permeabilitate: abordări experimentale și analitice 446–450
MARİJA SAVIC, DUSAN TRAJKoVIC, JoVAN STEPANoVIC, PETAR SToJANoVIC, MİRJANA KoSTIC, DİVNA MAJSToRoVICInfluenţa temperaturii şi vitezei de texturare asupra caracteristicilor fizico-mecanice ale firelor de poliamidă texturate prin procedeul de falsă torsiune 451–457
AKCAGUN ENGIN, ÖZ CEVIZ NURAY, YILMAZ ABDURRAHIM, MAZARI ADNANInvestıgarea proprıetăţılor de confort termıc ale jachetelorbărbăteştı dın materıale mono- şı multıstrat 458–463
LAURENŢIU-CHRISTIAN DINCĂ, HoRTENSIA-CLARA RĂDULESCU,DIoNEZIE BoJIN, EMILIA VISILEANU, ALINA PoPESCU, CARMEN-PYERINA GHIȚULEASAAnalize statistice dimensionale comparative, prin SEM, întrenanotratamentele de Cuo nemetalizate şi metalizate cu aur, de pe substraturi textile 464–469
ADRIAN SALISTEAN, DANIELA FARIMA, MIHAI CIoCoIU, CoNSTANTIN NITEoptimizări ale proiectării parașutei de tip ram-air 470–473
HUA YUAN, JUNJIE ZHANG, YUN ZHANG, YAN HoNG,HoNGZHoNG ZHAoEfectele externalităților de aglomerare asupra productivității totale: exemple din industria textilă din China 474–480
Editatã în 6 nr./an, indexatã ºi recenzatã în:Edited in 6 issues per year, indexed and abstracted in:
Science Citation Index Expanded (SciSearch®), Materials ScienceCitation Index®, Journal Citation Reports/Science Edition, World Textile
Abstracts, Chemical Abstracts, VINITI, Scopus, Toga FIZ technikProQuest Central
Editatã cu sprijinul Ministerului Cercetãrii ºi Inovãrii
Revistã cotatã ISI ºi inclusã în Master Journal List a Institutului pentruªtiinþa Informãrii din Philadelphia – S.U.A., începând cu vol. 58, nr. 1/2007/ISI rated magazine, included in the ISI Master Journal List of the Instituteof Science Information, Philadelphia, USA, starting with vol. 58, no. 1/2007
¸
˘
405industria textila 2017, vol. 68, nr. 6˘
Recunoscutã în România, în domeniul ªtiinþelor inginereºti, de cãtre
Consiliul Naþional al Cercetãrii ªtiinþifice din Învãþãmântul Superior(C.N.C.S.I.S.), în grupa A /
Aknowledged in Romania, in the engineering sciences domain,
by the National Council of the Scientific Research from the Higher Education
(CNCSIS), in group A
406industria textila 2017, vol. 68, nr. 6˘
407
415
421
427
435
439
446
451
458
464
470
474
A research on tensile and abrasion properties of fabrics produced from conventionaland fire resistant type polyester yarns
Characterization of the impact and post impact (CAI) properties of 3D-structurecomposites
The effects of open porosity and constructional parameters on cotton woven fabric’sultraviolet protection factor
Polyamide 6/chitosan nanofiber coated HEPA filter for bioaerosol control
Effect of roving linear density on the quality parameters of 16 Nec 100% cotton yarn
Analysis on the influence of the use of recovered textiles on the acoustic propertiesof composite materials
Effect of the evaporation and knitting parameters on wicking behaviours:Experimental and analytical approaches
Influence of heater temperature and texturing speed on the physical-mechanicalpropertiesof polyamide textured yarns in false-twist texturing process
Investigating the thermal comfort properties of men’s jacket as single andmultiple layered material
Comparative dimensional statistical analyses by sEm, between unmetallizedand gold-metallized CuO-nanotreatments from textile substrates
Ram-air parachute design optimizations
Effects of agglomeration externalities on total factor productivity: evidence fromChina’s Textile Industry
EDITORIAL STAFF
Editor-in-chief: Dr. eng. Emilia Visileanu
Graphic designer: Florin Prisecaru
e-mail: [email protected]
Scientific reviewers for the papers published in this number :
Contents
Journal edited in colaboration with Editura AGIR , 118 Calea Victoriei, sector 1, Bucharest, tel./fax: 021-316.89.92; 021-316.89.93;
e-mail: [email protected], www.edituraagir.ro
Prof. dr. Elsayed Ahmed Einashar, Kafrelsheikh University, Faculty of Specific Education, Egypt
Asist. dr. Silvestru Bogdănel Muntean, Faculty of Physics, ‘‘Al. I. Cuza’’ University, Iasi, Romania
Prof. dr. Adrian Buhu, “Gh. Asachi” Technical University, Iasi, Romania
Prof. dr. Goran Demboski, University “Ss. Cyril and Methodius”, Faculty of Technology and Metallurgy,Department of Textile Engineering, Skopje, Macedonia
Prof. dr. Doina Popescu, Academy of Economic Studies, Bucharest, Romania
Prof. dr. Margareta Florescu, Academy of Economic Studies, Bucharest, Romania
GÜNAYDIN KARAKAN GIZEM,ÇEVEN ERHAN KENAN
SI CHEN, XİAo-qİNG WANG
PoLoNA DoBNIK DUBRoVSKI,ABHIJIT MAJUMDAR
DENIZ oZDEN, GULDEMET BASAL
ABDUL WAqAR RAJPUT, USMAN ALI,AMIR ABBAS, RANA AMJAD,SIDRA SALEEMI
IULIANA IAŞNICU (STAMATE),GHEoRGHIŢA ToMESCU,oVIDIU VASILE, VIVIANA FILIP,SIMoNA MIHAI
NESMA SAoUSSEN ACHoUR,MoHAMED HAMDAoUI, SASSIBEN NASRALLAH
MARİJA SAVIC, DUSAN TRAJKoVIC,JoVAN STEPANoVIC,PETAR SToJANoVIC, MİRJANA KoSTIC,DİVNA MAJSToRoVIC
AKCAGUN ENGIN, ÖZCEVIZ NURAY,YILMAZ ABDURRAHIM, MAZARI ADNAN
LAURENŢIU-CHRISTIAN DINCĂ,HoRTENSIA-CLARA RĂDULESCU,DIoNEZIE BoJIN, EMILIA VISILEANU,ALINA PoPESCU,CARMEN-PYERINA GHIȚULEASA
ADRIAN SALISTEAN, DANIELA FARIMA,MIHAI CIoCoIU, CoNSTANTIN NITE
HUA YUAN, JUNJIE ZHANG, YUN ZHANG,YAN HoNG, HoNGZHoNG ZHAo
INTRODUCTION
The textile flammability is generally defined with someof the processes such as burning rates, flame spreadrates, characteristics for ignition (e.g., delay time,ignition temperature, critical heat flux for ignition). Flammability property for textile materials may beinfluenced by many factors including polymer itself,weaving or knitting type, yarn construction, additivesin the fiber, chemical treatment type as well as thetest conditions [1]. Flame retardant textiles may beapplied in different fields such as military, automotive,aerospace applications and safety protective gar-ments. There are four methods for reducing theflammability of textiles. First is using inherently flameretardant textiles including the high performancefibers (e.g., polyoxazoles, polyether etherketone,polymides, carbon, asbestos, glass, polibenzimidazol,kyrol, polifenilensulfur and aramides). The second
method is changing the structures of fibers by copoly-merization (chlorine content) and chemical modifica-tion where the flame retardant monomer is observedin chain structures of fibers (FR polyester, FRpolyamide, FR wool) [2–4]. Since the demand forflame retardant polyester (FR) has been recentlyincreasing for the fire protective textiles, some solu-tions were developed for improving the flame retar-dant property of polyester. The most widespread andefficient method of FR protection for synthetic fiberssuch as polyester is adding flame retardants duringpolymer processing. This method doesn’t requirenew equipment which makes it economically effi-cient. Trevira CS is an example of FR Polyester pro-duction by incorporating a comonomeric phosphinicacid unit into the PET polymeric chain. Halogen con-taining organic compounds and organophosphorouscompounds has also been used as flame retardant
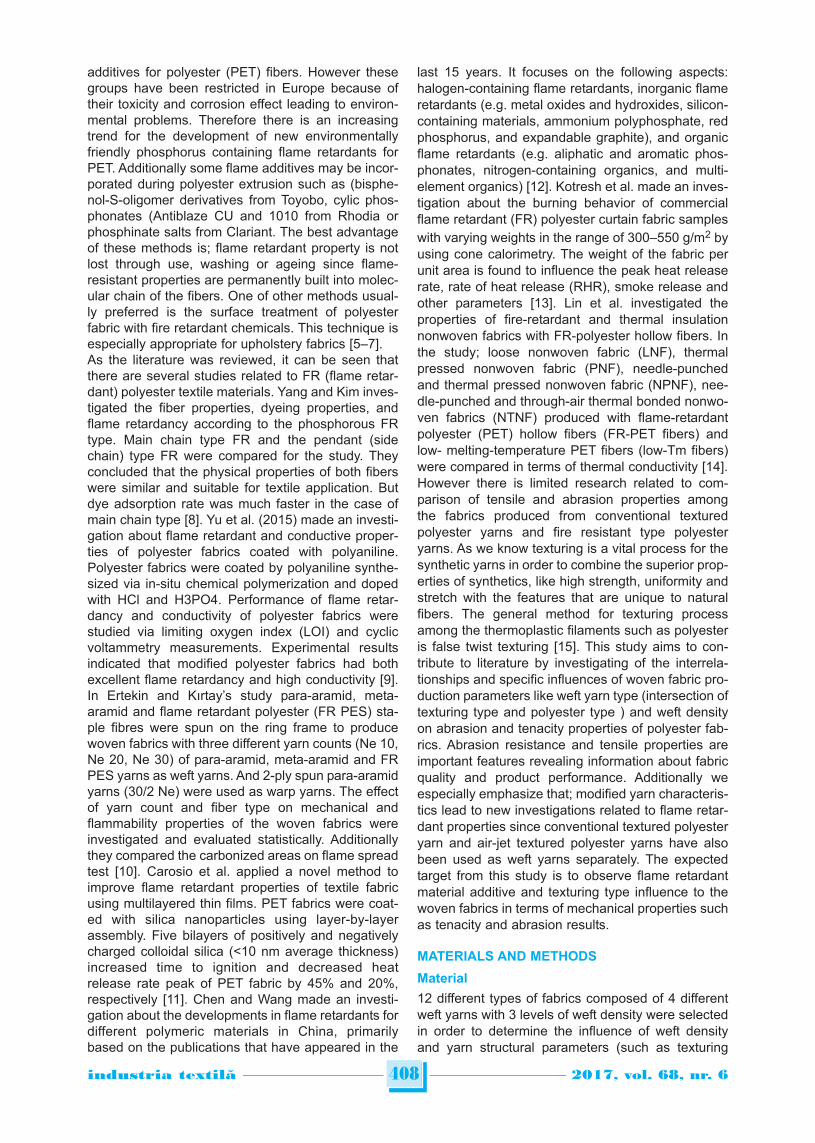
A research on tensile and abrasion properties of fabrics producedfrom conventional and fire resistant type polyester yarns
GÜNAYDIN KARAKAN GIZEM ÇEVEN ERHAN KENAN
REZUMAT – ABSTRACT
Studiu privind proprietățile de rezistență la întindere și proprietățile de abraziune ale țesăturilordin fire de poliester de tip convențional și ignifuge
Acest sudiu are ca obiectiv investigarea proprietăților de abraziune și de rezistență la tracțiune ale țesăturilor din fire depoliester convenționale și ignifuge. În studiul experimental au fost selectate douăsprezece tipuri diferite de țesăturicompuse din patru fire diferite de bătătură cu trei niveluri de densitate a firelor de bătătură, pentru a determina influențadensității firelor de bătătură și parametrii structurali ai firelor (texturarea și adaosul de material ignifug) asupra tenacitățiiși rezistenței la abraziune. Firele de bătătură utilizate au fost: fire de poliester texturate convenționale (CTP), fire depoliester texturate cu jet de aer (ATP), fire de poliester ignifuge texturate convenționale (CTPFR), fire de poliesterignifuge texturate cu jet de aer (ATPFR). Polisterul neted trilobal lucios a fost utilizat ca fir de urzeală pentru toate tipurilede țesături. După țeserea materialelor pentru draperie de tip satinat, testele de abraziune ale țesăturilor au fost efectuatecu echipamentul de testare Martindale, în timp ce testele de tenacitate au fost efectuate cu dispozitivul de testareInstron. Conform rezultatelor analizelor statistice efectuate utilizând valorile experimentale obținute din teste, s-a ajunsla concluzia că proprietățile de rezistență la abraziune și proprietățile de rezistență la tracțiune în direcția urzelii șibătăturii au fost afectate de parametrii structurali ai firelor (cum ar fi: texturarea și adaosul de material ignifug) și dedensitatea firelor de bătătură.
Cuvinte-cheie: fir de poliester, ignifug, rezistența la întindere, rezistența la abraziune
A research on tensile and abrasion properties of fabrics produced from conventionaland fire resistant type polyester yarns
This paper is focused on investigating the abrasion and tensile properties of fabrics from conventional and fire resistanttype polyester yarns. In the experimental study, twelve different types of fabrics composed of four different weft yarnswith three levels of weft density were selected in order to determine the influence of weft density and yarn structuralparameters (texturing and addition of flame retardant material) on tenacity and abrasion resistance. The weft yarns wereconventional textured polyester yarn (CTP), air-jet textured polyester yarn (ATP), conventional textured flame retardantpolyester yarn (CTPFR), air-jet textured flame retardant polyester yarn (ATPFR). Trilobal bright flat polyester was usedas the warp yarn for all the fabrics. After the satin type drapery fabrics were woven, the abrasion tests of the fabrics wereperformed with Martindale test equipment while the tenacity tests were carried out by using Instron test device.According to the results of the statistical analyses performed using the experimental values obtained from the tests, wedetermined that, the abrasion resistance and the tensile properties in warp and weft directions were affected by the yarnstructural parameters ( such as texturing and the addition of flame retardant material) and weft density.
Keywords: polyester yarn, fire resistance, tensile strength, abrasion resistance
407industria textila 2017, vol. 68, nr. 6˘
DOI: 10.35530/IT.068.06.1484
additives for polyester (PET) fibers. However thesegroups have been restricted in Europe because oftheir toxicity and corrosion effect leading to environ-mental problems. Therefore there is an increasingtrend for the development of new environmentallyfriendly phosphorus containing flame retardants forPET. Additionally some flame additives may be incor-porated during polyester extrusion such as (bisphe-nol-S-oligomer derivatives from Toyobo, cylic phos-phonates (Antiblaze CU and 1010 from Rhodia orphosphinate salts from Clariant. The best advantageof these methods is; flame retardant property is notlost through use, washing or ageing since flame-resis tant properties are permanently built into molec-ular chain of the fibers. One of other methods usual-ly preferred is the surface treatment of polyesterfabric with fire retardant chemicals. This technique isespecially appropriate for upholstery fabrics [5–7].As the literature was reviewed, it can be seen thatthere are several studies related to FR (flame retar-dant) polyester textile materials. Yang and Kim inves-tigated the fiber properties, dyeing properties, andflame retardancy according to the phosphorous FRtype. Main chain type FR and the pendant (sidechain) type FR were compared for the study. Theyconcluded that the physical properties of both fiberswere similar and suitable for textile application. Butdye adsorption rate was much faster in the case ofmain chain type [8]. Yu et al. (2015) made an investi-gation about flame retardant and conductive proper-ties of polyester fabrics coated with polyaniline.Polyester fabrics were coated by polyaniline synthe-sized via in-situ chemical polymerization and dopedwith HCl and H3PO4. Performance of flame retar-dancy and conductivity of polyester fabrics werestudied via limiting oxygen index (LOI) and cyclicvoltammetry measurements. Experimental resultsindicated that modified polyester fabrics had bothexcellent flame retardancy and high conductivity [9].In Ertekin and Kırtay’s study para-aramid, meta-aramid and flame retardant polyester (FR PES) sta-ple fibres were spun on the ring frame to producewoven fabrics with three different yarn counts (Ne 10,Ne 20, Ne 30) of para-aramid, meta-aramid and FRPES yarns as weft yarns. And 2-ply spun para-aramidyarns (30/2 Ne) were used as warp yarns. The effectof yarn count and fiber type on mechanical andflammability properties of the woven fabrics wereinvestigated and evaluated statistically. Additionallythey compared the carbonized areas on flame spreadtest [10]. Carosio et al. applied a novel method toimprove flame retardant properties of textile fabricusing multilayered thin films. PET fabrics were coat-ed with silica nanoparticles using layer-by-layerassembly. Five bilayers of positively and negativelycharged colloidal silica (<10 nm average thickness)increased time to ignition and decreased heatrelease rate peak of PET fabric by 45% and 20%,respectively [11]. Chen and Wang made an investi-gation about the developments in flame retardants fordifferent polymeric materials in China, primarilybased on the publications that have appeared in the
last 15 years. It focuses on the following aspects:halogen-containing flame retardants, inorganic flameretardants (e.g. metal oxides and hydroxides, silicon-containing materials, ammonium polyphosphate, redphosphorus, and expandable graphite), and organicflame retardants (e.g. aliphatic and aromatic phos-phonates, nitrogen-containing organics, and multi-element organics) [12]. Kotresh et al. made an inves-tigation about the burning behavior of commercialflame retardant (FR) polyester curtain fabric sampleswith varying weights in the range of 300–550 g/m2 byusing cone calorimetry. The weight of the fabric perunit area is found to influence the peak heat releaserate, rate of heat release (RHR), smoke release andother parameters [13]. Lin et al. investigated theproperties of fire-retardant and thermal insulationnonwoven fabrics with FR-polyester hollow fibers. Inthe study; loose nonwoven fabric (LNF), thermalpressed nonwoven fabric (PNF), needle-punchedand thermal pressed nonwoven fabric (NPNF), nee-dle-punched and through-air thermal bonded nonwo-ven fabrics (NTNF) produced with flame-retardantpolyester (PET) hollow fibers (FR-PET fibers) andlow- melting-temperature PET fibers (low-Tm fibers)were compared in terms of thermal conductivity [14].However there is limited research related to com-parison of tensile and abrasion properties amongthe fabrics produced from conventional texturedpolyester yarns and fire resistant type polyesteryarns. As we know texturing is a vital process for thesynthetic yarns in order to combine the superior prop-erties of synthetics, like high strength, uniformity andstretch with the features that are unique to naturalfibers. The general method for texturing processamong the thermoplastic filaments such as polyesteris false twist texturing [15]. This study aims to con-tribute to literature by investigating of the interrela-tionships and specific influences of woven fabric pro-duction parameters like weft yarn type (intersection oftexturing type and polyester type ) and weft densityon abrasion and tenacity properties of polyester fab-rics. Abrasion resistance and tensile properties areimportant features revealing information about fabricquality and product performance. Additionally weespecially emphasize that; modified yarn characteris-tics lead to new investigations related to flame retar-dant properties since conventional textured polyesteryarn and air-jet textured polyester yarns have alsobeen used as weft yarns separately. The expectedtarget from this study is to observe flame retardantmaterial additive and texturing type influence to thewoven fabrics in terms of mechanical properties suchas tenacity and abrasion results.
MATERIALS AND METHODS
Material
12 different types of fabrics composed of 4 differentweft yarns with 3 levels of weft density were selectedin order to determine the influence of weft densityand yarn structural parameters (such as texturing
408industria textila 2017, vol. 68, nr. 6˘
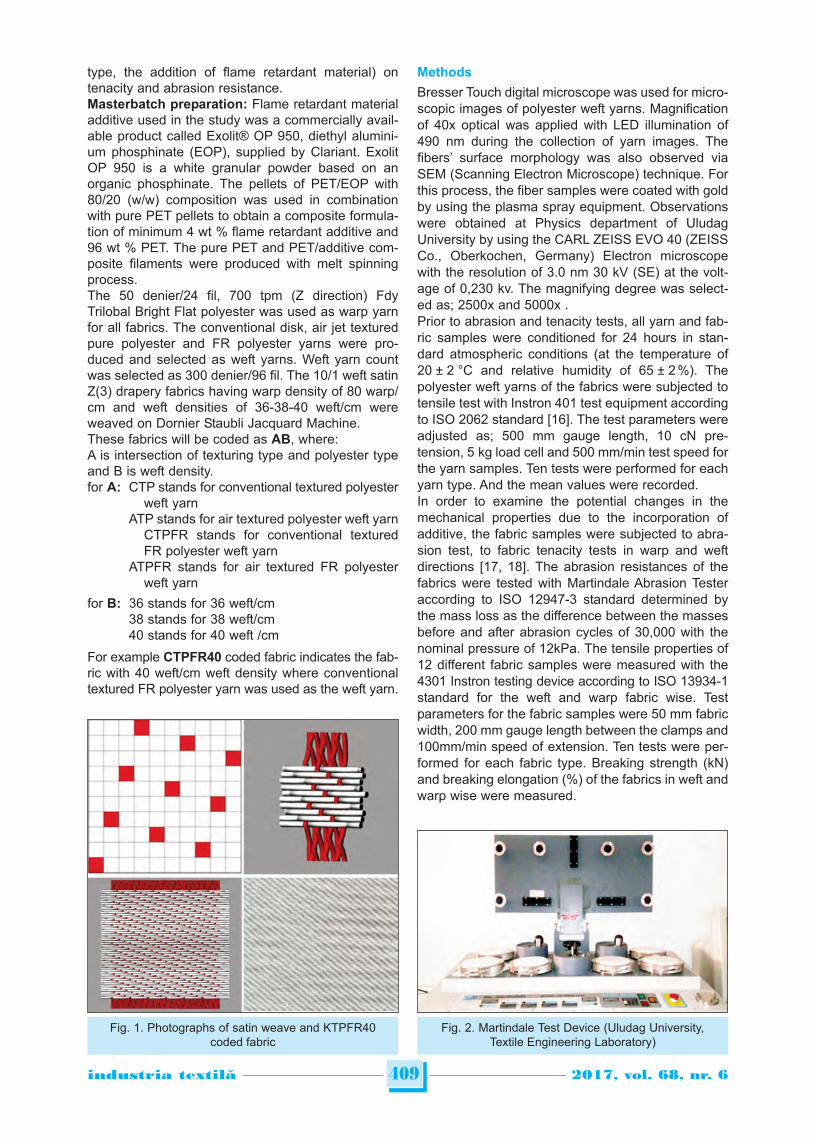
type, the addition of flame retardant material) ontenacity and abrasion resistance.Masterbatch preparation: Flame retardant materialadditive used in the study was a commercially avail-able product called Exolit® OP 950, diethyl alumini-um phosphinate (EOP), supplied by Clariant. ExolitOP 950 is a white granular powder based on anorganic phosphinate. The pellets of PET/EOP with80/20 (w/w) composition was used in combinationwith pure PET pellets to obtain a composite formula-tion of minimum 4 wt % flame retardant additive and96 wt % PET. The pure PET and PET/additive com-posite filaments were produced with melt spinningprocess.The 50 denier/24 fil, 700 tpm (Z direction) FdyTrilobal Bright Flat polyester was used as warp yarnfor all fabrics. The conventional disk, air jet texturedpure polyester and FR polyester yarns were pro-duced and selected as weft yarns. Weft yarn countwas selected as 300 denier/96 fil. The 10/1 weft satinZ(3) drapery fabrics having warp density of 80 warp/cm and weft densities of 36-38-40 weft/cm wereweaved on Dornier Staubli Jacquard Machine.These fabrics will be coded as AB, where:A is intersection of texturing type and polyester typeand B is weft density.for A: CTP stands for conventional textured polyester
weft yarnATP stands for air textured polyester weft yarn
CTPFR stands for conventional texturedFR polyester weft yarn
ATPFR stands for air textured FR polyesterweft yarn
for B: 36 stands for 36 weft/cm38 stands for 38 weft/cm40 stands for 40 weft /cm
For example CTPFR40 coded fabric indicates the fab-ric with 40 weft/cm weft density where conventionaltextured FR polyester yarn was used as the weft yarn.
Methods
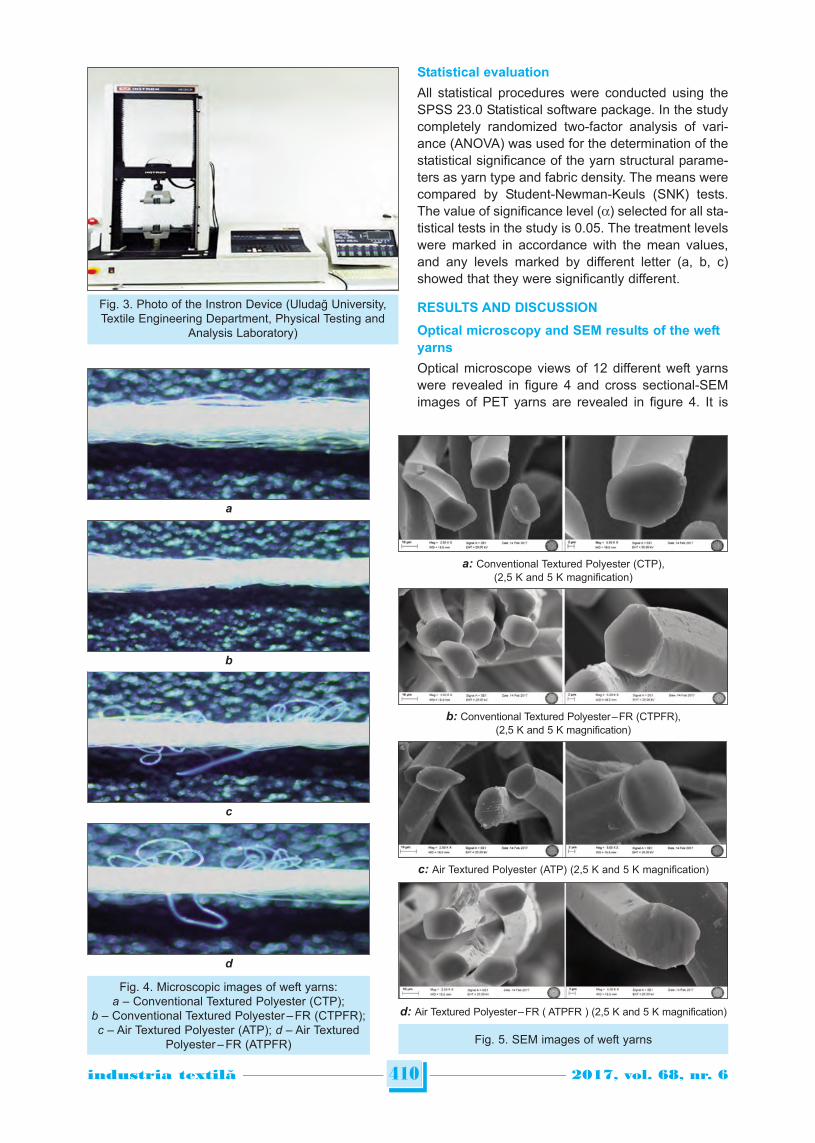
Bresser Touch digital microscope was used for micro-scopic images of polyester weft yarns. Magnificationof 40x optical was applied with LED illumination of490 nm during the collection of yarn images. Thefibers’ surface morphology was also observed viaSEM (Scanning Electron Microscope) technique. Forthis process, the fiber samples were coated with goldby using the plasma spray equipment. Observationswere obtained at Physics department of UludagUniversity by using the CARL ZEISS EVO 40 (ZEISSCo., Oberkochen, Germany) Electron microscopewith the resolution of 3.0 nm 30 kV (SE) at the volt-age of 0,230 kv. The magnifying degree was select-ed as; 2500x and 5000x .Prior to abrasion and tenacity tests, all yarn and fab-ric samples were conditioned for 24 hours in stan-dard atmospheric conditions (at the temperature of20 ± 2 °C and relative humidity of 65 ± 2 %). Thepolyester weft yarns of the fabrics were subjected totensile test with Instron 401 test equipment accordingto ISO 2062 standard [16]. The test parameters wereadjusted as; 500 mm gauge length, 10 cN pre-tension, 5 kg load cell and 500 mm/min test speed forthe yarn samples. Ten tests were performed for eachyarn type. And the mean values were recorded. In order to examine the potential changes in themechanical properties due to the incorporation ofadditive, the fabric samples were subjected to abra-sion test, to fabric tenacity tests in warp and weftdirections [17, 18]. The abrasion resistances of thefabrics were tested with Martindale Abrasion Testeraccording to ISO 12947-3 standard determined bythe mass loss as the difference between the massesbefore and after abrasion cycles of 30,000 with thenominal pressure of 12kPa. The tensile properties of12 different fabric samples were measured with the4301 Instron testing device according to ISO 13934-1standard for the weft and warp fabric wise. Testparameters for the fabric samples were 50 mm fabricwidth, 200 mm gauge length between the clamps and100mm/min speed of extension. Ten tests were per-formed for each fabric type. Breaking strength (kN)and breaking elongation (%) of the fabrics in weft andwarp wise were measured.
409industria textila 2017, vol. 68, nr. 6˘
Fig. 1. Photographs of satin weave and KTPFR40coded fabric
Fig. 2. Martindale Test Device (Uludag University,Textile Engineering Laboratory)
Statistical evaluation
All statistical procedures were conducted using theSPSS 23.0 Statistical software package. In the studycompletely randomized two-factor analysis of vari-ance (ANOVA) was used for the determination of thestatistical significance of the yarn structural parame-ters as yarn type and fabric density. The means werecompared by Student-Newman-Keuls (SNK) tests.The value of significance level (a) selected for all sta-tistical tests in the study is 0.05. The treatment levelswere marked in accordance with the mean values,and any levels marked by different letter (a, b, c)showed that they were significantly different.
RESULTS AND DISCUSSION
Optical microscopy and SEM results of the weft
yarns
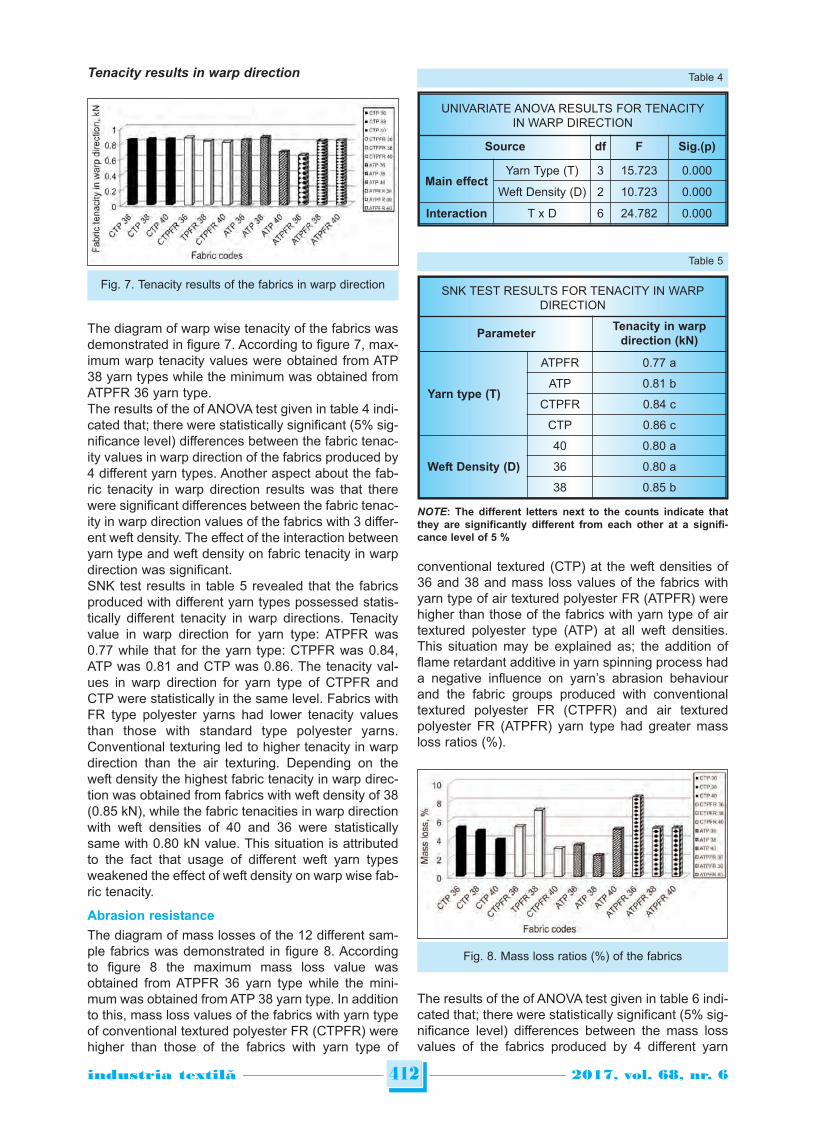
Optical microscope views of 12 different weft yarnswere revealed in figure 4 and cross sectional-SEMimages of PET yarns are revealed in figure 4. It is
410industria textila 2017, vol. 68, nr. 6˘
Fig. 3. Photo of the Instron Device (Uludağ University,Textile Engineering Department, Physical Testing and
Analysis Laboratory)
Fig. 4. Microscopic images of weft yarns:a – Conventional Textured Polyester (CTP);
b – Conventional Textured Polyester – FR (CTPFR);c – Air Textured Polyester (ATP); d – Air Textured
Polyester – FR (ATPFR) Fig. 5. SEM images of weft yarns
a
b
c
d
a: Conventional Textured Polyester (CTP),(2,5 K and 5 K magnification)
b: Conventional Textured Polyester – FR (CTPFR),(2,5 K and 5 K magnification)
c: Air Textured Polyester (ATP) (2,5 K and 5 K magnification)
d: Air Textured Polyester – FR ( ATPFR ) (2,5 K and 5 K magnification)
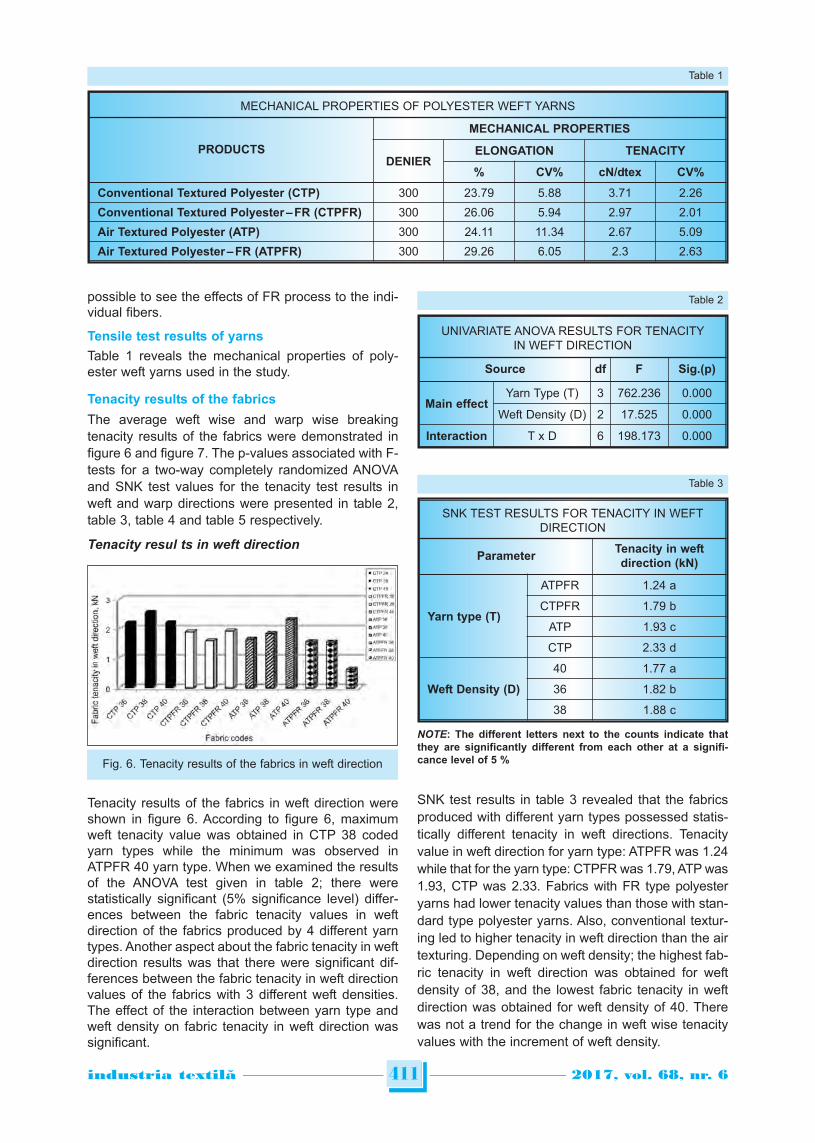
possible to see the effects of FR process to the indi-vidual fibers.
Tensile test results of yarns
Table 1 reveals the mechanical properties of poly -ester weft yarns used in the study.
Tenacity results of the fabrics
The average weft wise and warp wise breakingtenacity results of the fabrics were demonstrated infigure 6 and figure 7. The p-values associated with F-tests for a two-way completely randomized ANOVAand SNK test values for the tenacity test results inweft and warp directions were presented in table 2,table 3, table 4 and table 5 respectively.
Tenacity resul ts in weft direction
Tenacity results of the fabrics in weft direction wereshown in figure 6. According to figure 6, maximumweft tenacity value was obtained in CTP 38 codedyarn types while the minimum was observed inATPFR 40 yarn type. When we examined the resultsof the ANOVA test given in table 2; there werestatistically significant (5% significance level) differ-ences between the fabric tenacity values in weftdirection of the fabrics produced by 4 different yarntypes. Another aspect about the fabric tenacity in weftdirection results was that there were significant dif-ferences between the fabric tenacity in weft directionvalues of the fabrics with 3 different weft densities.The effect of the interaction between yarn type andweft density on fabric tenacity in weft direction wassignificant.
SNK test results in table 3 revealed that the fabricsproduced with different yarn types possessed statis-tically different tenacity in weft directions. Tenacityvalue in weft direction for yarn type: ATPFR was 1.24while that for the yarn type: CTPFR was 1.79, ATP was1.93, CTP was 2.33. Fabrics with FR type polyesteryarns had lower tenacity values than those with stan-dard type polyester yarns. Also, conventional textur-ing led to higher tenacity in weft direction than the airtexturing. Depending on weft density; the highest fab-ric tenacity in weft direction was obtained for weftdensity of 38, and the lowest fabric tenacity in weftdirection was obtained for weft density of 40. Therewas not a trend for the change in weft wise tenacityvalues with the increment of weft density.
411industria textila 2017, vol. 68, nr. 6˘
MECHANICAL PROPERTIES OF POLYESTER WEFT YARNS
PRODUCTS
MECHANICAL PROPERTIES
DENIERELONGATION TENACITY
% CV% cN/dtex CV%
Conventional Textured Polyester (CTP) 300 23.79 5.88 3.71 2.26
Conventional Textured Polyester – FR (CTPFR) 300 26.06 5.94 2.97 2.01
Air Textured Polyester (ATP) 300 24.11 11.34 2.67 5.09
Air Textured Polyester – FR (ATPFR) 300 29.26 6.05 2.3 2.63
Table 1
Fig. 6. Tenacity results of the fabrics in weft direction
UNIVARIATE ANOVA RESULTS FOR TENACITYIN WEFT DIRECTION
Source df F Sig.(p)
Main effectYarn Type (T) 3 762.236 0.000
Weft Density (D) 2 17.525 0.000
Interaction T x D 6 198.173 0.000
Table 2
SNK TEST RESULTS FOR TENACITY IN WEFTDIRECTION
ParameterTenacity in weftdirection (kN)
Yarn type (T)
ATPFR 1.24 a
CTPFR 1.79 b
ATP 1.93 c
CTP 2.33 d
Weft Density (D)
40 1.77 a
36 1.82 b
38 1.88 c
Table 3
NOTE: The different letters next to the counts indicate thatthey are significantly different from each other at a signifi-cance level of 5 %
Tenacity results in warp direction
The diagram of warp wise tenacity of the fabrics wasdemonstrated in figure 7. According to figure 7, max-imum warp tenacity values were obtained from ATP38 yarn types while the minimum was obtained fromATPFR 36 yarn type.The results of the of ANOVA test given in table 4 indi-cated that; there were statistically significant (5% sig-nificance level) differences between the fabric tenac-ity values in warp direction of the fabrics produced by4 different yarn types. Another aspect about the fab-ric tenacity in warp direction results was that therewere significant differences between the fabric tenac-ity in warp direction values of the fabrics with 3 differ-ent weft density. The effect of the interaction betweenyarn type and weft density on fabric tenacity in warpdirection was significant.SNK test results in table 5 revealed that the fabricsproduced with different yarn types possessed statis-tically different tenacity in warp directions. Tenacityvalue in warp direction for yarn type: ATPFR was0.77 while that for the yarn type: CTPFR was 0.84,ATP was 0.81 and CTP was 0.86. The tenacity val-ues in warp direction for yarn type of CTPFR andCTP were statistically in the same level. Fabrics withFR type polyester yarns had lower tenacity valuesthan those with standard type polyester yarns.Conventional texturing led to higher tenacity in warpdirection than the air texturing. Depending on theweft density the highest fabric tenacity in warp direc-tion was obtained from fabrics with weft density of 38(0.85 kN), while the fabric tenacities in warp directionwith weft densities of 40 and 36 were statisticallysame with 0.80 kN value. This situation is attributedto the fact that usage of different weft yarn typesweakened the effect of weft density on warp wise fab-ric tenacity.
Abrasion resistance
The diagram of mass losses of the 12 different sam-ple fabrics was demonstrated in figure 8. Accordingto figure 8 the maximum mass loss value wasobtained from ATPFR 36 yarn type while the mini-mum was obtained from ATP 38 yarn type. In additionto this, mass loss values of the fabrics with yarn typeof conventional textured polyester FR (CTPFR) werehigher than those of the fabrics with yarn type of
conventional textured (CTP) at the weft densities of36 and 38 and mass loss values of the fabrics withyarn type of air textured polyester FR (ATPFR) werehigher than those of the fabrics with yarn type of airtextured polyester type (ATP) at all weft densities.This situation may be explained as; the addition offlame retardant additive in yarn spinning process hada negative influence on yarn’s abrasion behaviourand the fabric groups produced with conventionaltextured polyester FR (CTPFR) and air texturedpolyester FR (ATPFR) yarn type had greater massloss ratios (%).
The results of the of ANOVA test given in table 6 indi-cated that; there were statistically significant (5% sig-nificance level) differences between the mass lossvalues of the fabrics produced by 4 different yarn
412industria textila 2017, vol. 68, nr. 6˘
UNIVARIATE ANOVA RESULTS FOR TENACITYIN WARP DIRECTION
Source df F Sig.(p)
Main effectYarn Type (T) 3 15.723 0.000
Weft Density (D) 2 10.723 0.000
Interaction T x D 6 24.782 0.000
Table 4
SNK TEST RESULTS FOR TENACITY IN WARPDIRECTION
ParameterTenacity in warp
direction (kN)
Yarn type (T)
ATPFR 0.77 a
ATP 0.81 b
CTPFR 0.84 c
CTP 0.86 c
Weft Density (D)
40 0.80 a
36 0.80 a
38 0.85 b
Table 5
NOTE: The different letters next to the counts indicate thatthey are significantly different from each other at a signifi-cance level of 5 %
Fig. 8. Mass loss ratios (%) of the fabrics
Fig. 7. Tenacity results of the fabrics in warp direction
types. Another aspect about the abrasion test resultswas that there were significant differences betweenthe mass loss values of the fabrics with 3 differentfabric densities. The effect of the interaction betweenyarn type and fabric density on mass loss was alsosignificant.SNK test results in table 7 revealed that the fabricsproduced with different yarn types possessed statis-tically different mass loss values. Mass loss value foryarn type: ATP was 3.58% while that for the yarntype: CTP was 4.68 %, CTPFR was 5.15%, ATPFRwas 6.30%. Mass loss values of the fabrics increasedwith the usage of FR type polyester weft yarns. Therewas not a trend for the ranking of fabric mass lossvalues with respect to the texturing method. The SNK
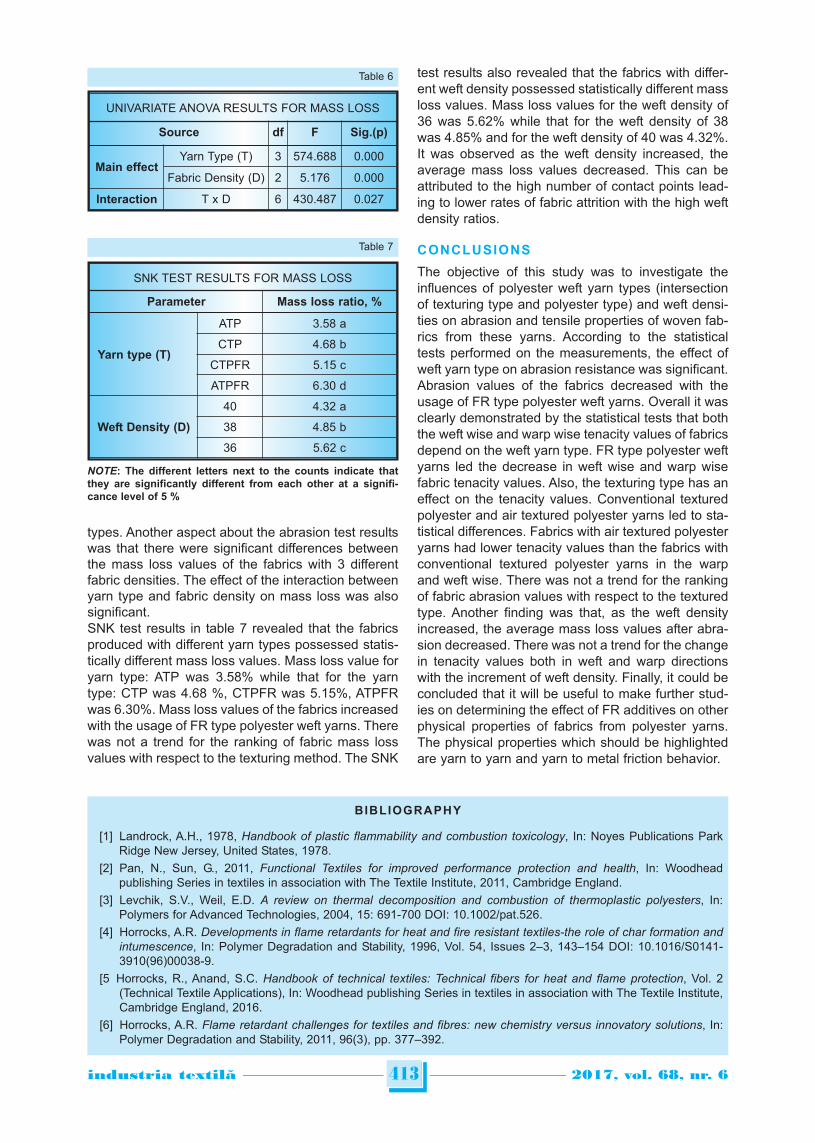
test results also revealed that the fabrics with differ-ent weft density possessed statistically different massloss values. Mass loss values for the weft density of36 was 5.62% while that for the weft density of 38was 4.85% and for the weft density of 40 was 4.32%.It was observed as the weft density increased, theaverage mass loss values decreased. This can beattributed to the high number of contact points lead-ing to lower rates of fabric attrition with the high weftdensity ratios.
CONCLUSIONS
The objective of this study was to investigate theinfluences of polyester weft yarn types (intersectionof texturing type and polyester type) and weft densi-ties on abrasion and tensile properties of woven fab-rics from these yarns. According to the statisticaltests performed on the measurements, the effect ofweft yarn type on abrasion resistance was significant.Abrasion values of the fabrics decreased with theusage of FR type polyester weft yarns. Overall it wasclearly demonstrated by the statistical tests that boththe weft wise and warp wise tenacity values of fabricsdepend on the weft yarn type. FR type polyester weftyarns led the decrease in weft wise and warp wisefabric tenacity values. Also, the texturing type has aneffect on the tenacity values. Conventional texturedpolyester and air textured polyester yarns led to sta-tistical differences. Fabrics with air textured polyesteryarns had lower tenacity values than the fabrics withconventional textured polyester yarns in the warpand weft wise. There was not a trend for the rankingof fabric abrasion values with respect to the texturedtype. Another finding was that, as the weft densityincreased, the average mass loss values after abra-sion decreased. There was not a trend for the changein tenacity values both in weft and warp directionswith the increment of weft density. Finally, it could beconcluded that it will be useful to make further stud-ies on determining the effect of FR additives on otherphysical properties of fabrics from polyester yarns.The physical properties which should be highlightedare yarn to yarn and yarn to metal friction behavior.
413industria textila 2017, vol. 68, nr. 6˘
UNIVARIATE ANOVA RESULTS FOR MASS LOSS
Source df F Sig.(p)
Main effectYarn Type (T) 3 574.688 0.000
Fabric Density (D) 2 5.176 0.000
Interaction T x D 6 430.487 0.027
Table 6
SNK TEST RESULTS FOR MASS LOSS
Parameter Mass loss ratio, %
Yarn type (T)
ATP 3.58 a
CTP 4.68 b
CTPFR 5.15 c
ATPFR 6.30 d
Weft Density (D)
40 4.32 a
38 4.85 b
36 5.62 c
Table 7
NOTE: The different letters next to the counts indicate thatthey are significantly different from each other at a signifi-cance level of 5 %
BIBLIOGRAPHY
[1] Landrock, A.H., 1978, Handbook of plastic flammability and combustion toxicology, In: Noyes Publications ParkRidge New Jersey, United States, 1978.
[2] Pan, N., Sun, G., 2011, Functional Textiles for improved performance protection and health, In: Woodheadpublishing Series in textiles in association with The Textile Institute, 2011, Cambridge England.
[3] Levchik, S.V., Weil, E.D. A review on thermal decomposition and combustion of thermoplastic polyesters, In:Polymers for Advanced Technologies, 2004, 15: 691-700 DOI: 10.1002/pat.526.
[4] Horrocks, A.R. Developments in flame retardants for heat and fire resistant textiles-the role of char formation andintumescence, In: Polymer Degradation and Stability, 1996, Vol. 54, Issues 2–3, 143–154 DOI: 10.1016/S0141-3910(96)00038-9.
[5 Horrocks, R., Anand, S.C. Handbook of technical textiles: Technical fibers for heat and flame protection, Vol. 2(Technical Textile Applications), In: Woodhead publishing Series in textiles in association with The Textile Institute,Cambridge England, 2016.
[6] Horrocks, A.R. Flame retardant challenges for textiles and fibres: new chemistry versus innovatory solutions, In:Polymer Degradation and Stability, 2011, 96(3), pp. 377–392.
414industria textila 2017, vol. 68, nr. 6˘
[7] Chivas, C., Guillaume, E., Sainrat, A., Barbosa, V. Assessment of risks and benefits in the use of flame retardants
in upholstered furniture in continental Europe, In: Fire Safety Journal, 2009, 44(5), 801–807.
[8] Yang, S.C., Kim, J.P. Flame retardant polyesters. III. Fibers, In: Journal of Applied Polymer Science, 2008, 108(4),
pp. 2297–2300.
[9] Yu, J., Zhou, T., Pang, Z., Wei, Q. Flame retardancy and conductive properties of polyester fabrics coated with
polyaniline, In: Textile Research Journal , 2015, vol. 86, no. 11,1171-1179, DOI: 10.1177/0040517515606360.
[10] Ertekin, M., Kırtay, E. Burning behaviour and mechanical properties of fabrics woven with ring spun aramid and
flame retardant polyester yarns, In: Journal of Textile & Apparel/Tekstil ve Konfeksiyon, Jul/Sep2014, 2014, Vol. 24
Issue 3, pp. 259–265.
[11] Carosio, F., Laufer, G., Alongi, J., Camino, G., Grunlan, J.C. Layer-by-layer assembly of silica-based flame retardant
thin film on PET fabric, In: Polymer Degradation and Stability, 2011, 96 (5), pp. 745–750.
[12] Chen, L., Wang, Y. A review on flame retardant technology in China. Part I: development of flame retardants, In:
Polymer Advanced Technologies, 2009, Vol. 21, Issue 1, 1–26. 10.1002/pat.1550.
[13] Kotresh, T.M., Indushekar, R., Subbulakshmi, M.S., Vijayalakshmi, S.N., Prasad, A.K., Agrawal, A.K. Evaluation of
Commercial Flame Retardant Polyester Curtain Fabrics in the Cone Calorimeter, In: Journal of Industrial Textiles,
2006, 36(1), 47-58, doi: 10.1177/1528083706064379.
[14] Lin, C.M., Tsai, I.J., Lin, J.H. Manufacturing and properties of fire-retardant and thermal insulation nonwoven fabrics
with FR-polyester hollow fibers, In: Textile Research journal, 2009, 79(11), pp. 993–100.
[15] Çelik, P., Süpüren, G., Özdil, N. Experimental investigation on the static and dynamic strength of false twist textured
polyester yarns, In: Industria Textila, 2011, vol. 62, nr. 1, pp. 38–43.
[16] ISO 2062, Breaking Force and Elongation of Yarns, Geneva, Switzerland, 2009.
[17] ISO 12947-3, Determination of the abrasion resistance of fabrics by the Martindale method – Part 3: Determination
of mass loss, Geneva, Switzerland, 1998.
[18] ISO 13934-1, Determination of maximum force and elongation at maximum force using the strip method, Geneva,
Switzerland, 2013.
Authors:
GÜNAYDIN KARAKAN GIZEM1
ÇEVEN ERHAN KENAN2
1 Pamukkale University, Buldan Vocational School20400, Buldan, Denizli, Turkeye-mail: [email protected]
2 Uludağ University, Faculty of Eng., Textile Eng. Department16059, Nilüfer, Bursa, Turkeye-mail: [email protected]
Corresponding author:
GÜNAYDIN KARAKAN GIZEMe-mail: [email protected]
Introduction
The structural composites are determined that thematerial system consisting of two or more elementson a macroscopic scale, whose mechanical proper-ties and responses are designed to be superior thanthose of the constituent materials acting indepen-dently [1]. Light-weight construction, high stiffnessand high strength, from the economical points ofview, is of particular importance in the range of mod-ern industrial systems for cushioning applications [2]. Composites with integrated 3D structure offer thegreat potential to be used in impact-resistance appli-cations, since they combine low weight with highanti-impact abilities and their delamination resistantabilities are also preferable [3–4]. In these circum -stances, the integrated 3D-structurecomposites arewidely used for automobiles, vehicles, marine andso on.Some researches have investigated on the impactand compression after impact (CAI) behaviors of3D-structurecomposites. Velosa et al. [5] studiedsome effect factors, that is, cross-thread density, fine-ness of yarns and structure of face of fabrics, as wellas thickness of fabrics, on the mechanical behaviors(compression and low-velocity impact responses) ofnovel sandwich composite panels made of 3D-knittedspacer fabrics. Thermoplastic composites based on
flat warp-knitted 3D multilayer spacer fabrics havebeen introduced by Abounaim [6]. It can be conclud-ed from their studies that the mechanical responsesof these composites are significantly influenced bythe arrangement of reinforced yarns and the integra-tion of reinforced yarns with biaxial inlays are foundto be the optimum method.The obtained results indi-cate that the 3D-structure composites are usuallymade from spacer fabrics as reinforcement materials,consisting of two separate faces connected by spac-er yarns.Additionally, the mechanical properties ofwarp-knitted spacer fabriccomposites can also be tai-lored to meet the specific applications by simply vary-ing the fabric structural parameters [7]. Compressionafter impact (CAI) properties performance representsan important design criterion because it can study theimpact-damage-tolerance of composites after suffer-ing impact loading. Lots of published papers revealedthat composites with 3D structure endow high CAIstrength owing to the capacity of reduction of impactenergy [8–10]. The 3D-structure composites charac-tered for impact and CAI responses involved in thisstudy possessa flexiblestructure, which is quite dif-ferent from the compositesmade with stiff surfacesas shown in literatures. These novel integrated3D-strucutre composites are made from warp-knittedspacer fabrics, consisting of two separate faces
415industria textila 2017, vol. 68, nr. 6˘
Characterization of the impact and post impact (CAI) propertiesof 3D-structure composites
SI CHEN XIAO-QING WANG
REZUMAT – ABSTRACT
Caracterizarea proprietăților de impact și postimpact (CAI) ale compozitelor cu structură 3D
Răspunsurile la impact sunt o țintă importantă în proiectarea compozitelor avansate deoarece compozitele cu structură3D integrată sunt adesea folosite în aplicații de rezistență la impact. Această lucrare prezintă un nou tip de compozite3D realizate din tricot de urzeală. Cinci tipuri diferite de tricoturi din urzeală, cu parametrii structurali diferiți, de exemplustructura stratului exterior, finețea firelor și unghiul de înclinare a firului au fost implicate în producerea compozitelor.Pentru a analiza comportamentele la impact și postimpact (CAI) ale compozitelor și efectul fiecărui parametru structural,s-au efectuat testele de impact și compresiune după impact. Rezultatele indică faptul că parametrii structurali aimaterialului pot influența în mod evident performanța la impact a compozitelor, iar după impact, compozitele au capa -cități de amortizare favorabile care pot satisface cererea de utilizare finală.
Cuvinte-cheie: structura 3D, parametrii structurali, proprietăți de impact, comportamente CAI
Characterization of the impact and post impact (CAI) properties of 3D-structure composites
Impact responses are important target in designing advanced composites because composites with integrated 3Dstructure are often used in impact-resistance applications. This paper considers a new type of 3D composites made fromwarp-knitted spacer fabric. Five different types of warp-knitted spacer fabrics with different structural parameters, e.g.outer layer structure, fineness of spacer yarn and inclination angle of spacer yarn, were involved to produce thecomposites. To analyze the impact and post impact (CAI) behaviors of composites and the effect of each structureparameter, the impact and compression-after-impact tests were conducted. The findings indicate that the fabricstructural parameters can obviously influence the impact performance of composites and the composites after impactretain favorable cushioning capacities which can satisfy the end-use application.
Keywords: 3D structure, structural parameters, impact properties, CAI behaviors
DOI: 10.35530/IT.068.06.1570
416industria textila 2017, vol. 68, nr. 6˘
connected by spacer yarns. It is expected that a reg-ular pattern for tailoringthe composites with favorableimpact and CAIperformance could be found from thisstudy.
EXPERIMENTAL DETAILS
Samples
Warp-knitted spacer fabrics
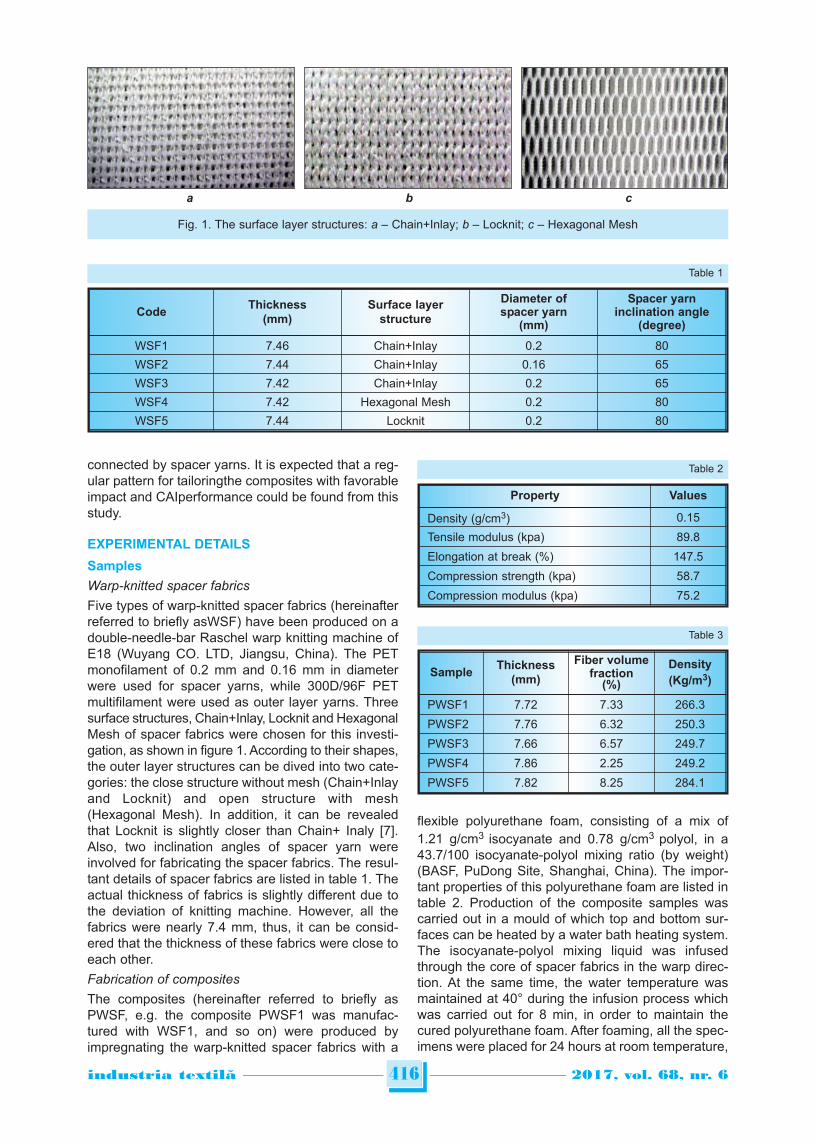
Five types of warp-knitted spacer fabrics (hereinafterreferred to briefly asWSF) have been produced on adouble-needle-bar Raschel warp knitting machine ofE18 (Wuyang CO. LTD, Jiangsu, China). The PETmonofilament of 0.2 mm and 0.16 mm in diameterwere used for spacer yarns, while 300D/96F PETmultifilament were used as outer layer yarns. Threesurface structures, Chain+Inlay, Locknit and HexagonalMesh of spacer fabrics were chosen for this investi-gation, as shown in figure 1. According to their shapes,the outer layer structures can be dived into two cate-gories: the close structure without mesh (Chain+Inlayand Locknit) and open structure with mesh(Hexagonal Mesh). In addition, it can be revealedthat Locknit is slightly closer than Chain+ Inaly [7].Also, two inclination angles of spacer yarn wereinvolved for fabricating the spacer fabrics. The resul-tant details of spacer fabrics are listed in table 1. Theactual thickness of fabrics is slightly different due tothe deviation of knitting machine. However, all thefabrics were nearly 7.4 mm, thus, it can be consid-ered that the thickness of these fabrics were close toeach other.
Fabrication of composites
The composites (hereinafter referred to briefly asPWSF, e.g. the composite PWSF1 was manufac-tured with WSF1, and so on) were produced byimpregnating the warp-knitted spacer fabrics with a
flexible polyurethane foam, consisting of a mix of1.21 g/cm3 isocyanate and 0.78 g/cm3 polyol, in a43.7/100 isocyanate-polyol mixing ratio (by weight)(BASF, PuDong Site, Shanghai, China). The impor-tant properties of this polyurethane foam are listed intable 2. Production of the composite samples wascarried out in a mould of which top and bottom sur-faces can be heated by a water bath heating system.The isocyanate-polyol mixing liquid was infusedthrough the core of spacer fabrics in the warp direc-tion. At the same time, the water temperature wasmaintained at 40° during the infusion process whichwas carried out for 8 min, in order to maintain thecured polyurethane foam. After foaming, all the spec-imens were placed for 24 hours at room temperature,
CodeThickness
(mm)Surface layer
structure
Diameter ofspacer yarn
(mm)
Spacer yarninclination angle
(degree)
WSF1 7.46 Chain+Inlay 0.2 80
WSF2 7.44 Chain+Inlay 0.16 65
WSF3 7.42 Chain+Inlay 0.2 65
WSF4 7.42 Hexagonal Mesh 0.2 80
WSF5 7.44 Locknit 0.2 80
Table 1
Property Values
Density (g/cm3) 0.15
Tensile modulus (kpa) 89.8
Elongation at break (%) 147.5
Compression strength (kpa) 58.7
Compression modulus (kpa) 75.2
Table 2
SampleThickness
(mm)
Fiber volumefraction
(%)
Density
(Kg/m3)
PWSF1 7.72 7.33 266.3
PWSF2 7.76 6.32 250.3
PWSF3 7.66 6.57 249.7
PWSF4 7.86 2.25 249.2
PWSF5 7.82 8.25 284.1
Table 3
Fig. 1. The surface layer structures: a – Chain+Inlay; b – Locknit; c – Hexagonal Mesh
a b c
417industria textila 2017, vol. 68, nr. 6˘
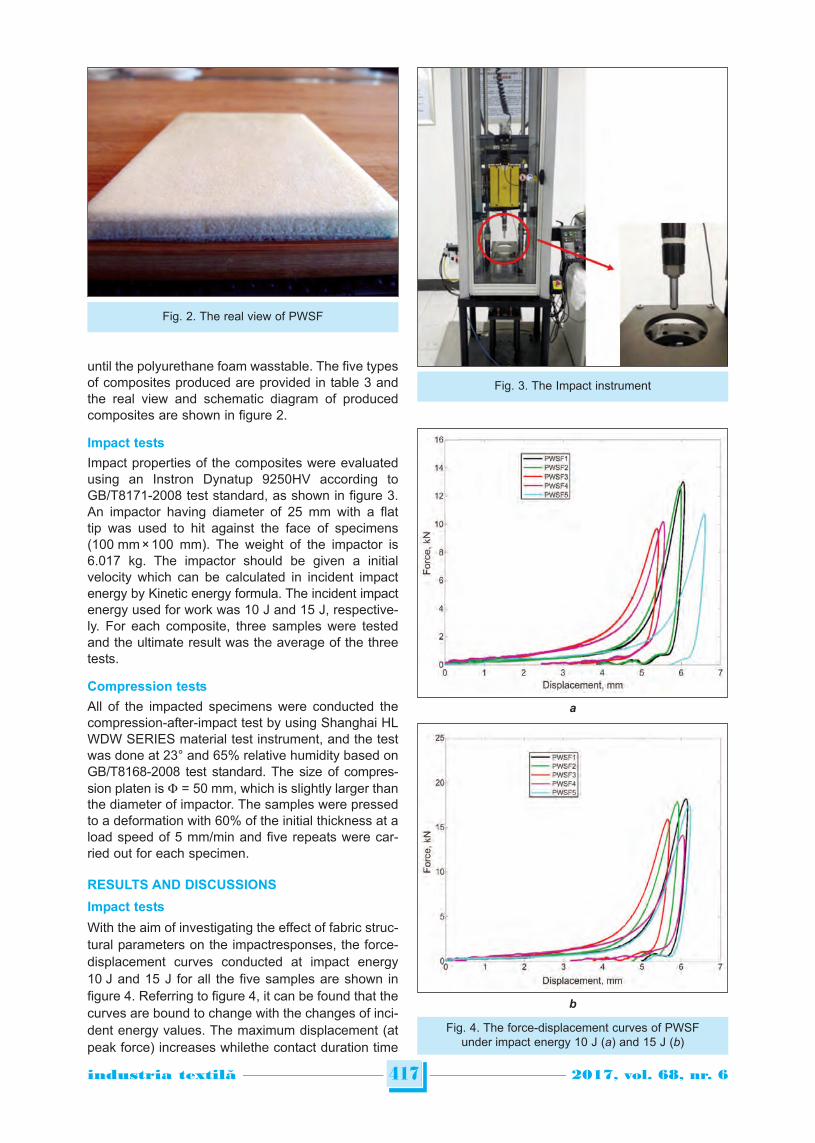
until the polyurethane foam wasstable. The five typesof composites produced are provided in table 3 andthe real view and schematic diagram of producedcomposites are shown in figure 2.
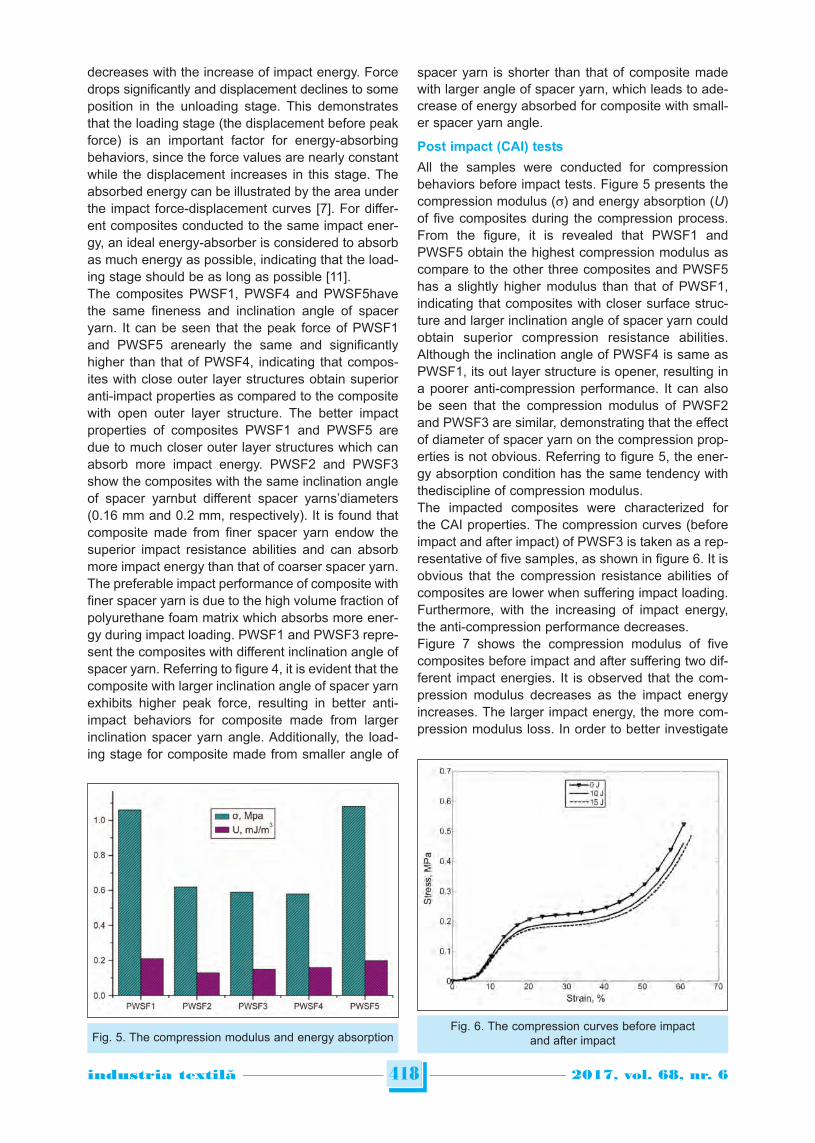
Impact tests
Impact properties of the composites were evaluatedusing an Instron Dynatup 9250HV according toGB/T8171-2008 test standard, as shown in figure 3.An impactor having diameter of 25 mm with a flattip was used to hit against the face of specimens(100 mm × 100 mm). The weight of the impactor is6.017 kg. The impactor should be given a initialvelocity which can be calculated in incident impactenergy by Kinetic energy formula. The incident impactenergy used for work was 10 J and 15 J, respective-ly. For each composite, three samples were testedand the ultimate result was the average of the threetests.
Compression tests
All of the impacted specimens were conducted thecompression-after-impact test by using Shanghai HLWDW SERIES material test instrument, and the testwas done at 23° and 65% relative humidity based onGB/T8168-2008 test standard. The size of compres -sion platen is = 50 mm, which is slightly larger thanthe diameter of impactor. The samples were pressedto a deformation with 60% of the initial thickness at aload speed of 5 mm/min and five repeats were car-ried out for each specimen.
RESULTS AND DISCUSSIONS
Impact tests
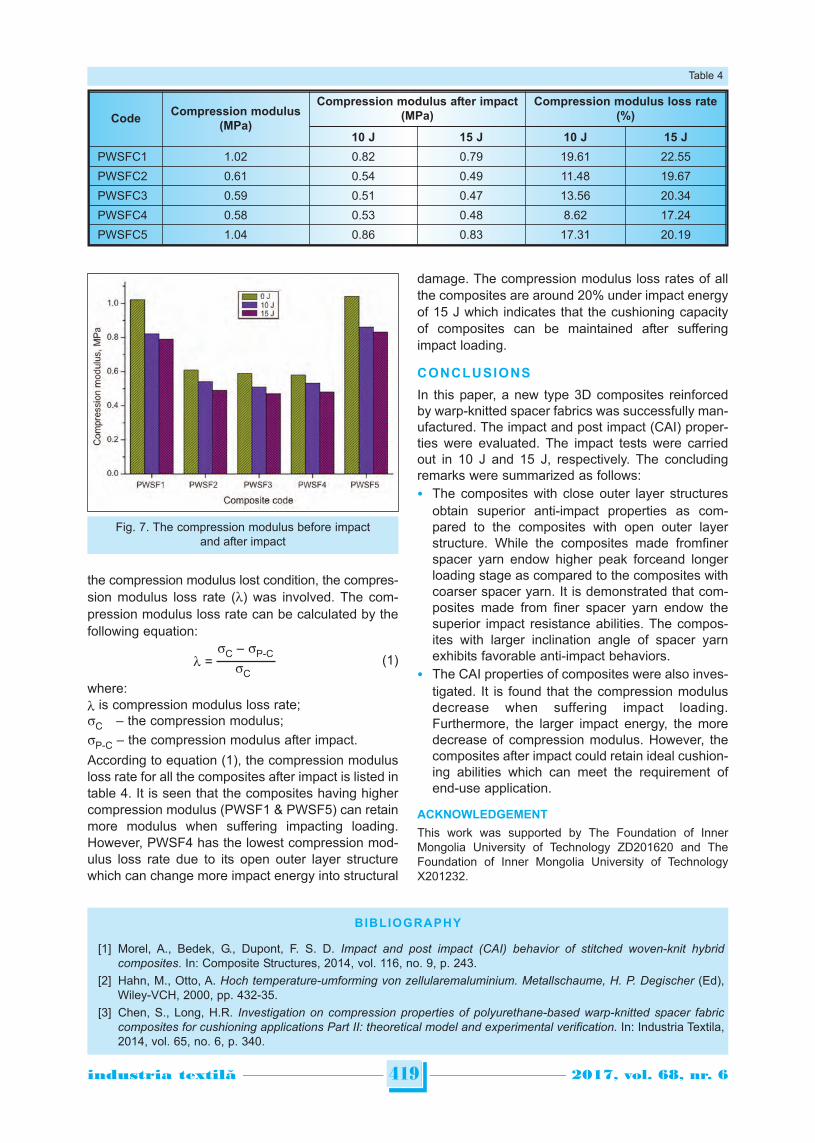
With the aim of investigating the effect of fabric struc-tural parameters on the impactresponses, the force-displacement curves conducted at impact energy10 J and 15 J for all the five samples are shown infigure 4. Referring to figure 4, it can be found that thecurves are bound to change with the changes of inci-dent energy values. The maximum displacement (atpeak force) increases whilethe contact duration time
Fig. 2. The real view of PWSF
Fig. 3. The Impact instrument
Fig. 4. The force-displacement curves of PWSFunder impact energy 10 J (a) and 15 J (b)
a
b
decreases with the increase of impact energy. Forcedrops significantly and displacement declines to someposition in the unloading stage. This demonstratesthat the loading stage (the displacement before peakforce) is an important factor for energy-absorbingbehaviors, since the force values are nearly constantwhile the displacement increases in this stage. Theabsorbed energy can be illustrated by the area underthe impact force-displacement curves [7]. For differ-ent composites conducted to the same impact ener-gy, an ideal energy-absorber is considered to absorbas much energy as possible, indicating that the load-ing stage should be as long as possible [11].The composites PWSF1, PWSF4 and PWSF5havethe same fineness and inclination angle of spaceryarn. It can be seen that the peak force of PWSF1and PWSF5 arenearly the same and significantlyhigher than that of PWSF4, indicating that compos-ites with close outer layer structures obtain superioranti-impact properties as compared to the compositewith open outer layer structure. The better impactproperties of composites PWSF1 and PWSF5 aredue to much closer outer layer structures which canabsorb more impact energy. PWSF2 and PWSF3show the composites with the same inclination angleof spacer yarnbut different spacer yarns’diameters(0.16 mm and 0.2 mm, respectively). It is found thatcomposite made from finer spacer yarn endow thesuperior impact resistance abilities and can absorbmore impact energy than that of coarser spacer yarn.The preferable impact performance of composite withfiner spacer yarn is due to the high volume fraction ofpolyurethane foam matrix which absorbs more ener-gy during impact loading. PWSF1 and PWSF3 repre-sent the composites with different inclination angle ofspacer yarn. Referring to figure 4, it is evident that thecomposite with larger inclination angle of spacer yarnexhibits higher peak force, resulting in better anti-impact behaviors for composite made from largerinclination spacer yarn angle. Additionally, the load-ing stage for composite made from smaller angle of
spacer yarn is shorter than that of composite madewith larger angle of spacer yarn, which leads to ade-crease of energy absorbed for composite with small-er spacer yarn angle.
Post impact (CAI) tests
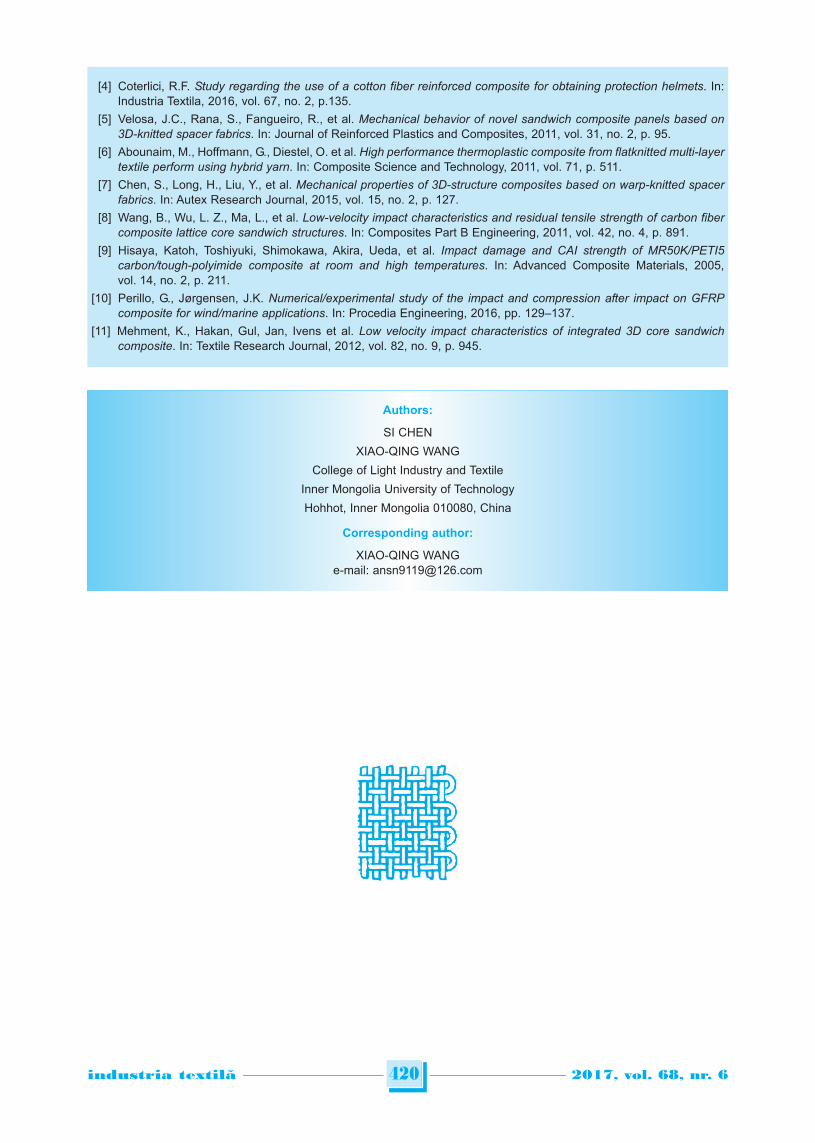
All the samples were conducted for compressionbehaviors before impact tests. Figure 5 presents thecompression modulus (s) and energy absorption (U)of five composites during the compression process.From the figure, it is revealed that PWSF1 andPWSF5 obtain the highest compression modulus ascompare to the other three composites and PWSF5has a slightly higher modulus than that of PWSF1,indicating that composites with closer surface struc-ture and larger inclination angle of spacer yarn couldobtain superior compression resistance abilities.Although the inclination angle of PWSF4 is same asPWSF1, its out layer structure is opener, resulting ina poorer anti-compression performance. It can alsobe seen that the compression modulus of PWSF2and PWSF3 are similar, demonstrating that the effectof diameter of spacer yarn on the compression prop-erties is not obvious. Referring to figure 5, the ener-gy absorption condition has the same tendency withthediscipline of compression modulus. The impacted composites were characterized forthe CAI properties. The compression curves (beforeimpact and after impact) of PWSF3 is taken as a rep-resentative of five samples, as shown in figure 6. It isobvious that the compression resistance abilities ofcomposites are lower when suffering impact loading.Furthermore, with the increasing of impact energy,the anti-compression performance decreases. Figure 7 shows the compression modulus of fivecomposites before impact and after suffering two dif-ferent impact energies. It is observed that the com-pression modulus decreases as the impact energyincreases. The larger impact energy, the more com-pression modulus loss. In order to better investigate
418industria textila 2017, vol. 68, nr. 6˘
Fig. 5. The compression modulus and energy absorptionFig. 6. The compression curves before impact
and after impact
the compression modulus lost condition, the compres-sion modulus loss rate (l) was involved. The com-pression modulus loss rate can be calculated by thefollowing equation:
sC – sP-Cl = (1)
sC
where:l is compression modulus loss rate;sC – the compression modulus;
sP-C – the compression modulus after impact.
According to equation (1), the compression modulusloss rate for all the composites after impact is listed intable 4. It is seen that the composites having highercompression modulus (PWSF1 & PWSF5) can retainmore modulus when suffering impacting loading.However, PWSF4 has the lowest compression mod-ulus loss rate due to its open outer layer structurewhich can change more impact energy into structural
damage. The compression modulus loss rates of allthe composites are around 20% under impact energyof 15 J which indicates that the cushioning capacityof composites can be maintained after sufferingimpact loading.
CONCLUSIONS
In this paper, a new type 3D composites reinforcedby warp-knitted spacer fabrics was successfully man-ufactured. The impact and post impact (CAI) proper-ties were evaluated. The impact tests were carriedout in 10 J and 15 J, respectively. The concludingremarks were summarized as follows:
• The composites with close outer layer structuresobtain superior anti-impact properties as com-pared to the composites with open outer layerstructure. While the composites made fromfinerspacer yarn endow higher peak forceand longerloading stage as compared to the composites withcoarser spacer yarn. It is demonstrated that com-posites made from finer spacer yarn endow thesuperior impact resistance abilities. The compos-ites with larger inclination angle of spacer yarnexhibits favorable anti-impact behaviors.
• The CAI properties of composites were also inves-tigated. It is found that the compression modulusdecrease when suffering impact loading.Furthermore, the larger impact energy, the moredecrease of compression modulus. However, thecomposites after impact could retain ideal cushion-ing abilities which can meet the requirement ofend-use application.
ACKNOWLEDGEMENT
This work was supported by The Foundation of InnerMongolia University of Technology ZD201620 and TheFoundation of Inner Mongolia University of TechnologyX201232.
419industria textila 2017, vol. 68, nr. 6˘
Fig. 7. The compression modulus before impactand after impact
CodeCompression modulus
(MPa)
Compression modulus after impact(MPa)
Compression modulus loss rate(%)
10 J 15 J 10 J 15 J
PWSFC1 1.02 0.82 0.79 19.61 22.55
PWSFC2 0.61 0.54 0.49 11.48 19.67
PWSFC3 0.59 0.51 0.47 13.56 20.34
PWSFC4 0.58 0.53 0.48 8.62 17.24
PWSFC5 1.04 0.86 0.83 17.31 20.19
Table 4
BIBLIOGRAPHY
[1] Morel, A., Bedek, G., Dupont, F. S. D. Impact and post impact (CAI) behavior of stitched woven-knit hybridcomposites. In: Composite Structures, 2014, vol. 116, no. 9, p. 243.
[2] Hahn, M., Otto, A. Hoch temperature-umforming von zellularemaluminium. Metallschaume, H. P. Degischer (Ed),Wiley-VCH, 2000, pp. 432-35.
[3] Chen, S., Long, H.R. Investigation on compression properties of polyurethane-based warp-knitted spacer fabriccomposites for cushioning applications Part II: theoretical model and experimental verification. In: Industria Textila,2014, vol. 65, no. 6, p. 340.
420industria textila 2017, vol. 68, nr. 6˘
[4] Coterlici, R.F. Study regarding the use of a cotton fiber reinforced composite for obtaining protection helmets. In:Industria Textila, 2016, vol. 67, no. 2, p.135.
[5] Velosa, J.C., Rana, S., Fangueiro, R., et al. Mechanical behavior of novel sandwich composite panels based on3D-knitted spacer fabrics. In: Journal of Reinforced Plastics and Composites, 2011, vol. 31, no. 2, p. 95.
[6] Abounaim, M., Hoffmann, G., Diestel, O. et al. High performance thermoplastic composite from flatknitted multi-layertextile perform using hybrid yarn. In: Composite Science and Technology, 2011, vol. 71, p. 511.
[7] Chen, S., Long, H., Liu, Y., et al. Mechanical properties of 3D-structure composites based on warp-knitted spacerfabrics. In: Autex Research Journal, 2015, vol. 15, no. 2, p. 127.
[8] Wang, B., Wu, L. Z., Ma, L., et al. Low-velocity impact characteristics and residual tensile strength of carbon fibercomposite lattice core sandwich structures. In: Composites Part B Engineering, 2011, vol. 42, no. 4, p. 891.
[9] Hisaya, Katoh, Toshiyuki, Shimokawa, Akira, Ueda, et al. Impact damage and CAI strength of MR50K/PETI5carbon/tough-polyimide composite at room and high temperatures. In: Advanced Composite Materials, 2005,vol. 14, no. 2, p. 211.
[10] Perillo, G., Jørgensen, J.K. Numerical/experimental study of the impact and compression after impact on GFRPcomposite for wind/marine applications. In: Procedia Engineering, 2016, pp. 129–137.
[11] Mehment, K., Hakan, Gul, Jan, Ivens et al. Low velocity impact characteristics of integrated 3D core sandwichcomposite. In: Textile Research Journal, 2012, vol. 82, no. 9, p. 945.
Authors:
SI CHEN
XIAO-QING WANG
College of Light Industry and Textile
Inner Mongolia University of Technology
Hohhot, Inner Mongolia 010080, China
Corresponding author:
XIAO-QING WANGe-mail: [email protected]
INTRODUCTION
Sunburns (erythema), tanning (pigment darkening),premature aging of the skin, suppression of theimmune system, damage to the eyes, and skin can-cer, are today’s well known negative effects thatexcessive exposure to ultraviolet radiation (UV-A,UV-B, and UV-C) has on human health [1, 2]. Personalprotection, provided by clothing, is one of the sim-plest and best means of sun protection, albeit for per-sonal protection, the use of sunscreen, sunglasses,
umbrellas, hats, etc.,can also be very helpful [3–6].
The fact is that not all clothing offers sufficient ultra-
violet (UV) protection. The UV protection benefits of
clothing items mainly depends on its fundamental
material, e.g. the type and construction of fabrics
used in the making process.Parameters, which influ-
ence the levels of UV protection of woven fabrics,
can be grouped as follows [7, 8]:
The effects of open porosity and constructional parameters on cottonwoven fabric’s ultraviolet protection factor
POLONA DOBNIK DUBROVSKI ABHIJIT MAJUMDAR
REZUMAT – ABSTRACT
Efectele porozității deschise și ale parametrilor de construcție asupra factorului de protecție
la ultraviolete al țesăturilor
Lucrarea prezintă rezultatele cercetărilor cu privire la efectul structurii țesăturilor de bumbac de culoare deschisă asuprafactorului de protecție la ultraviolete (UPF). Tipul de legătură, densitatea absolută a țesăturii și densitatea relativă ațesăturii au fost luate în considerare pentru a defini efectul structurii țesăturilor asupra UPF. Pentru a stabili o relațiecantitativă între structura țesăturii și UPF, porozitatea deschisă a fost utilizată ca un parametru care defineștecombinațiile dintre parametrii de construcție al țesăturii. În acest studiu s-au utilizat țesături în stare brută (țesături deculoare ecru, maro deschis), și țesături albite și calandrate (țesături albe) realizate din fire scurte de bumbac 100%.Țesăturile de culoare ecru au fost construite cu diferite tipuri de legături (pânză, 2 × 2 diagonal, 1 × 4 atlas), la trei niveluridiferite de densitate relativă a țesăturii (aproximativ 60%, 70% și 80%), în timp ce țesăturile albite au fost create culegătură pânză, 2 × 2 diagonal și 2 × 2 legătură tip rogojină, cu aceeași densitate a urzelii și densitate diferită a bătăturii(15, 19, 23 și 29 fire de bătătură/cm). Rezultatele au demonstrat că porozitatea deschisă mai mică duce la o protecțiemai bună la ultraviolete. Efectul legăturii este evident numai atunci când probele sunt comparabile la densitatea relativăa țesăturii. O densitate absolută mai mare a țesăturii înseamnă și protecție superioară la UV. Mai mult decât atât,rezultatele indică, de asemenea, valori ale porozității deschise și ale densităților țesăturilor prin care țesătura atinge obună protecție UV (UPF = 15) – și astfel acestea pot fi utilizate ca recomandări pentru inginerii textiliști la dezvoltareaunui nou tip de structură a țesăturii care să includă protecție adecvată la UV.
Cuvinte-cheie: radiații ultraviolete, protecție UV, construcția țesăturii, porozitate deschisă
The effects of open porosity and constructional parameters on cotton woven fabric’s
ultraviolet protection factor
The paper presents the results of research dealing with the effect of fabric construction on the ultraviolet protection factor(UPF) of light coloured cotton woven fabrics. The type of weave, absolute fabric density, and relative fabric density weretaken into account to define the effect of fabric construction on UPF. To establish quantitative relationship between thefabric construction and UPF, the open porosity was used as a parameter which defines the woven fabric constructionalparameter’s combinations. Fabrics in a raw state (loomstate, light brown fabrics),along with bleached and calendaredfabrics (white fabrics) made from 100% cotton staple-fibre yarns were used in this research. Loomstate fabrics wereconstructed with different types of weaves (plain, 2 × 2 twill, 1 × 4 satin),at threedifferent levels of relative fabric density(around 60%, 70% and 80%), while bleached fabrics were constructed in plain, 2 × 2 twill, and 2 × 2 mattweave, with thesame warp density and different weft density at four different levels (15, 19, 23, and 29 picks/cm). The results clearlyindicate that lower open porosity leads to better ultraviolet protection. The effect of weave is evident only when samplesare comparable in fabric relative density. Higher absolute fabric density also means superior UV protection. Moreover,the results also indicate the values of open porosity and fabric densities by which the fabric achievesgood UV protection(UPF=15) – and in this way, they can serve as guidelines for fabric engineers when developing a new type of fabricconstruction that encompasses sufficient UV protection ability.
Keywords: ultraviolet radiation, UV protection, woven fabric construction, open porosity
421industria textila 2017, vol. 68, nr. 6˘
DOI: 10.35530/IT.068.06.1534
• yarn constructional parameters (the type of usedfibres/filaments, yarn geometry, yarn twist, yarnpacking factor);
• fabric constructional parameters: a) primary param-eters of fabric geometry (type of weave, yarn fine-ness, warp/weft density, relative fabric density orfabric tightness), and b) secondary parameters offabric geometry (cover factor, open porosity/macro porosity, fabric volume mass, fabric thick-ness, volume porosity);
• finishing treatments/additives (dye, pigment, delus -terant, optical brighteners, UV absorbers);
• maintenance and end-usage relating to the laun-dering and wearing conditions (stretch, wetness).
In order to achieve the optimal value of fabric UV pro-tection, as well as other end-usage properties ofdeveloped fabric constructions, there is a need tounderstand the effects of aforementioned parameterson UPF (first and foremost), and to understand theeffects of constructional parameter’s combinations.The ability of fabric to protect humans against UVradiation is expressed by the ultraviolet protectionfactor (UPF), which in general describes the amountof UV radiation that passes through the fabric. UPF ismeasuredusing the in vitro or in vivo method. The invitro method is less time consuming, simple and cost-effective, and is based on spectrophotometric mea-surements of UV transmissions through the fabric.UPF calculation is done by using two weighting fac-tors, namely solar spectral irradiance and erythemaleffectiveness. The in vivo method is based on livingsubjects, and the UPF calculation is done based onthe minimal erythemal dose with and without fabric[9]. There are several standards of categorization offabrics in regards to their UPF value. AS/NZS stan-dard [10] specifies the requirements for determiningUPF of sun protective (un-stretched and dry) textiles,garments and other items of personal apparel (hats),which are worn in close proximity to the skin, andappropriate detailed labelling. According to AS/NZSstandard, a fabric should transmit no more than 2.5%of incident UV rays in order to be categorized as afabric of excellent UV protection. Woven fabric consists of fibrous material (yarns) andvoid spaces between the yarns (so called macro-pores or inter-yarn pores). These pores are exposedto external surface and separated by warp and weftyarns [11]. They allow the transmission of energy andhave a direct effect on ultraviolet radiation transmis-sion through the fabric. The amount, size and form ofthese macro-pores depends on the set of woven fab-ric constructional parameters, namely the type ofweave, type of used threads, yarn fineness andwarp/weft density. The objective of presented research was to under-stand the role of fabric construction on UPF in thecase of light coloured cotton woven fabrics, whichare normally used in hot weather conditions due toless absorption of IR radiation. The purpose of thisresearch was also to establish a quantitative relation-ship between macroporosity structure of woven
fabrics, e.g. open porosity, and UPF, in order to givefabric engineers some guidelines whendevelopingfabric constructionsof sufficient UV protection.
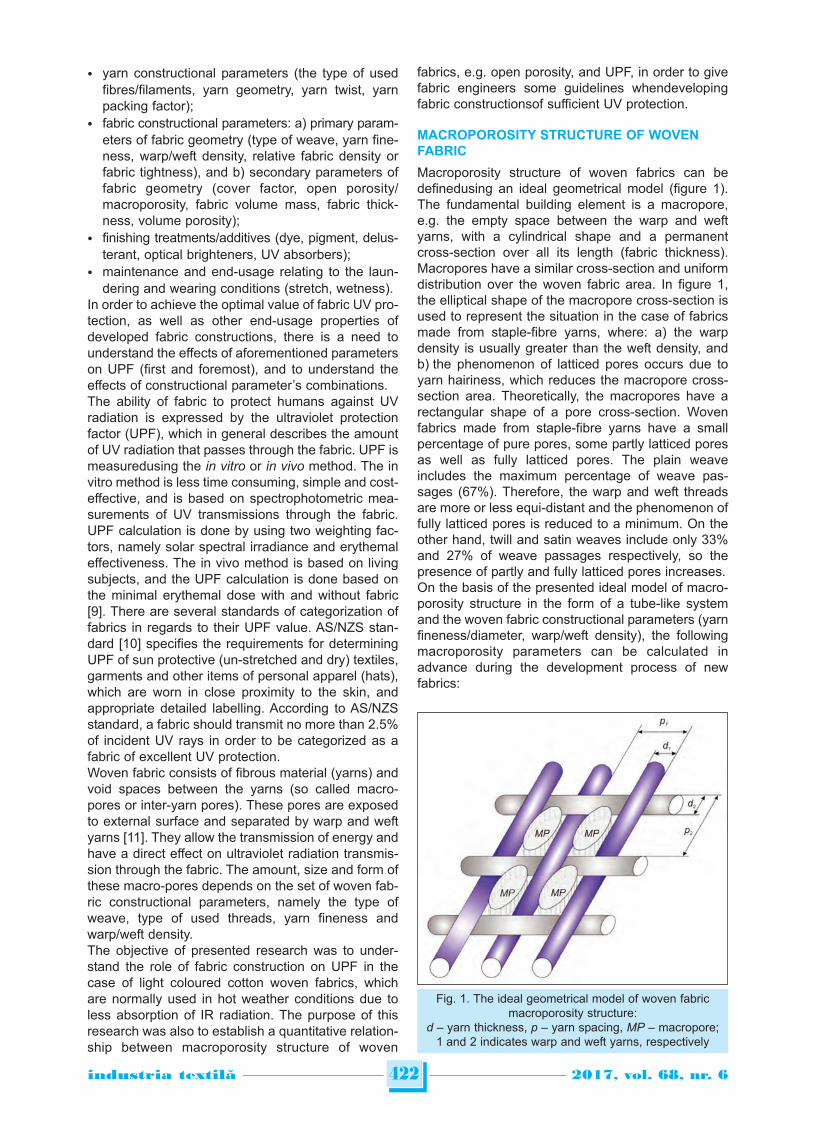
MACROPOROSITY STRUCTURE OF WOVENFABRIC
Macroporosity structure of woven fabrics can bedefinedusing an ideal geometrical model (figure 1).The fundamental building element is a macropore,e.g. the empty space between the warp and weftyarns, with a cylindrical shape and a permanentcross-section over all its length (fabric thickness).Macropores have a similar cross-section and uniformdistribution over the woven fabric area. In figure 1,the elliptical shape of the macropore cross-section isused to represent the situation in the case of fabricsmade from staple-fibre yarns, where: a) the warpdensity is usually greater than the weft density, andb) the phenomenon of latticed pores occurs due toyarn hairiness, which reduces the macropore cross-section area. Theoretically, the macropores have arectangular shape of a pore cross-section. Wovenfabrics made from staple-fibre yarns have a smallpercentage of pure pores, some partly latticed poresas well as fully latticed pores. The plain weaveincludes the maximum percentage of weave pas-sages (67%). Therefore, the warp and weft threadsare more or less equi-distant and the phenomenon offully latticed pores is reduced to a minimum. On theother hand, twill and satin weaves include only 33%and 27% of weave passages respectively, so thepresence of partly and fully latticed pores increases.On the basis of the presented ideal model of macro-porosity structure in the form of a tube-like systemand the woven fabric constructional parameters (yarnfineness/diameter, warp/weft density), the followingmacroporosity parameters can be calculated inadvance during the development process of newfabrics:
422industria textila 2017, vol. 68, nr. 6˘
Fig. 1. The ideal geometrical model of woven fabricmacroporosity structure:
d – yarn thickness, p – yarn spacing, MP – macropore;1 and 2 indicates warp and weft yarns, respectively
• macroporosity, which describes the portion ofmacropore volume in the volume unit of wovenfabric. It is defined using equation 1. The rectan-gular or elliptical macro-pore cross-section areacan be calculated using equations 2 and 3, respec-tively [11].
Vp Ap · D Apemacro = = = (1)
Vp + Vy p1 · p2 · D p1 · p2
Ap/rect = (p1 – d1) · (p2 – d2) (2)
p · (p1 – d1) · (p2 – d2)Ap/ell = (3)
4
where, emacro stands for macroporosity, Vp stands formacropore volume in cm3, Vy is the volume of warpand weft yarns (which refer to a single macropore incm3), p means yarn spacing in mm, d is the yarndiameter in mm, D is for woven fabric thickness inmm, Ap is the macropore area in mm2 and subscripts1 and 2 indicate warp and weft yarns, respectively;• open porosity (area of macro pore cross-section)
describes the fraction of macro-pore cross-sectionarea in the area unit of woven fabrics. If weassume the rectangular or elliptical macro-porecross-section area, the open porosity is calculatedusing equations 4 and 5, respectively [11]. In thiscase the open porosity is equal to macroporosity:
Ap (p1 – d1) · (p2 – d2)eopen/rect = = (4)
Ap + Ay p1 · p2
Ap p (p1 – d1) · (p2 – d2)eopen/ell = = (5)
Ap + Ay 4 p1 · p2
Here, eopen stands for open porosity, Ay for the pro-
jection area of warp and weft yarns (mm2), Ap for the
cross-section area of macro-pore (mm2), p for yarnspacing (mm), and d for yarn diameter (mm).Subscripts 1 and 2 indicate warp and weft yarns,respectively.
EXPERIMENTAL PART
Materials and methods
Two groups of woven fabricsamples, designed for hotweather conditions in light colours, were involved inthis research. In the first group nine light beige wovenfabrics made from staple-fibre yarns with the finenessof 14 tex in both directions were used. They wereproduced from 100% cotton yarns, which were madeby a carding procedure on a ring spinning machine.In order to define the effects of constructional param-eters only, and to eliminate the influence of finishingprocesses, the fabrics were in a raw state (loomstatefabrics). The samples were comparable in relativefabric density (fabric tightness). The reason why weselected woven fabrics for relative fabric density isbecause such fabric constructions are universallyused.It is for example impossible to produce plainweave fabric with the warp density of 56 ends/cm, as
is the case with satin fabric, because the limit valueof plain fabric density is only 43 threads/cm.Similarly; it is unrealistic to produce satin fabric withthe warp density of 38 end/cm, as such fabric con-struction is simply too loose and not adequate forend-usage. Plain 2 × 2 twill and 1 × 4 satin fabricswere used in this research at three levels of fabric rel-ative density (55% – 65%, 65% – 75%, 75% – 85%).The Kienbaum’s setting theory [12] was used todetermine the fabric relative density and weave fac-tor for plain (0.904), twill (1.188), and satin (1.379)fabrics. The constructional parameters of loom-statewoven fabric samples are collected in table 1(No. 1–9).In the second group of woven fabrics twelve wovenfabrics made from staple-fibre yarns with 14.8 texfineness (or yarn diameter of 0.125 mm) in bothdirections were used. They were also produced from100 % cotton yarns, how ever loomstate fabrics werethen finally desized, bleached and calendered. Thesesamples were comparable in regards to theabsolutevalue offabric density. Plain, 2 × 2 twill and 2 × 2 mattfabrics were prepared using four levels of weft densi-ty (15, 19, 23 and 27 picks/cm). Warp density wasidentical for all samples (40 end/cm). The construc-tional parameters of bleached woven fabric samplesare collected in table 1 (No. 10–21).Open porosityof tested samples was calculated theo-retically on the basis of equation 4 and equation 5,where rectangular and elliptical shape of macroporecross-section was taken into account, respectively.For yarn diameter calculation, the value of 1.5 g/cm3
for fibre bulk density and 0.8 for yarn packing factorwas taken into account. The calculated yarn diameterwas 0.122 mm and 0.125 mm for yarn of 14 and14.8 tex, respectively. All fabric samples were testedfor their warp/weft density value using pick countingglass. The flattened diameter of bleached and calen-dered fabrics was measured under the Projectinamicroscope with 100 × magnification after the yarnswere unravelled from the fabric.The UPF of tested samples was determined by:• in vitro method for samples No. 1–9, according to
the AS/NZ standard 4399:1966 using UV-VISSpectrophotometer Varian Cary 50. The estimatedUPF value was the mean UPF value for four test-ing samples, reduced for the standard error in themean UPF, and calculated for the 99% confidencelevel. The UPF was not rounded down to the near-est multiple of five in order to find out the effect ofthe constructional parameters on UPF. Accordingto AS/NZ standard, a good UV protection isachieved at the value of UPF 15;
• in vitromethod for samples No. 11–21, in accor-dancewith the American Association of TextileChemist and Colorists (AATCC) standard 183-1998,using the SDL measurement system, after condi-tioning the samples in standard atmosphere. Thetest was performed by exposing the fabric to UVradiation (280 nm to 400 nm) and measuring thetransmission through the fabric. According to
423industria textila 2017, vol. 68, nr. 6˘
AATCC standard, the rated UPF is the lowestvalue of measured UPF rounded to the nearestmultiple of 5. Even so, unrounded values of UPFare still listed in table 1 so that the effect of variousparameters can be understood properly.
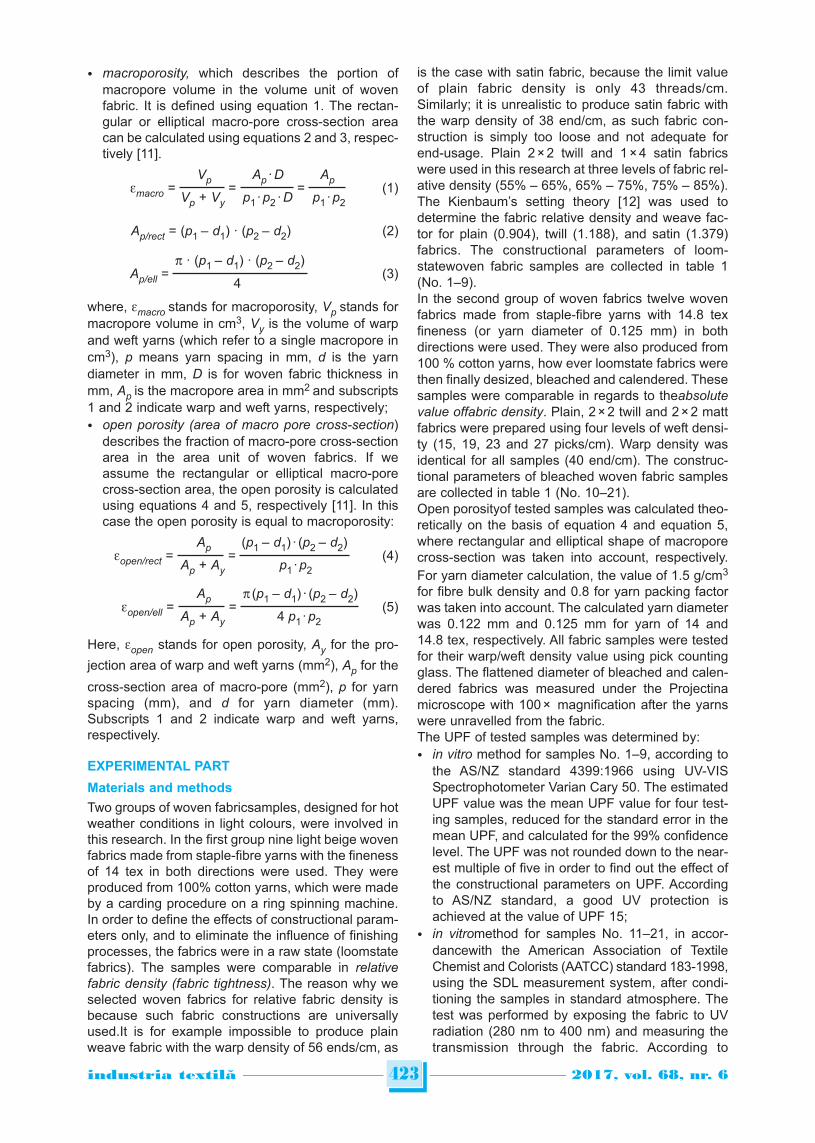
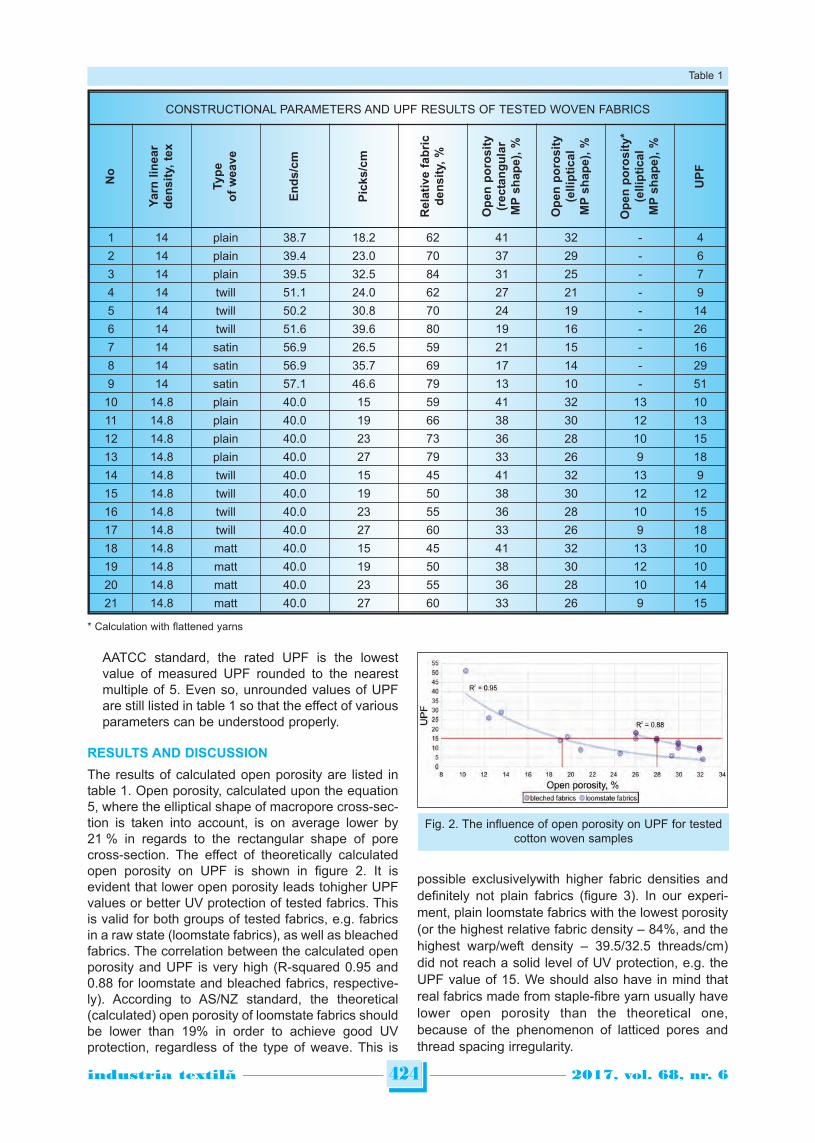
RESULTS AND DISCUSSION
The results of calculated open porosity are listed intable 1. Open porosity, calculated upon the equation5, where the elliptical shape of macropore cross-sec-tion is taken into account, is on average lower by21 % in regards to the rectangular shape of porecross-section. The effect of theoretically calculatedopen porosity on UPF is shown in figure 2. It isevident that lower open porosity leads tohigher UPFvalues or better UV protection of tested fabrics. Thisis valid for both groups of tested fabrics, e.g. fabricsin a raw state (loomstate fabrics), as well as bleachedfabrics. The correlation between the calculated openporosity and UPF is very high (R-squared 0.95 and0.88 for loomstate and bleached fabrics, respective-ly). According to AS/NZ standard, the theoretical(calculated) open porosity of loomstate fabrics shouldbe lower than 19% in order to achieve good UVprotection, regardless of the type of weave. This is
possible exclusivelywith higher fabric densities anddefinitely not plain fabrics (figure 3). In our experi-ment, plain loomstate fabrics with the lowest porosity(or the highest relative fabric density – 84%, and thehighest warp/weft density – 39.5/32.5 threads/cm)did not reach a solid level of UV protection, e.g. theUPF value of 15. We should also have in mind thatreal fabrics made from staple-fibre yarn usually havelower open porosity than the theoretical one,because of the phenomenon of latticed pores andthread spacing irregularity.
424industria textila 2017, vol. 68, nr. 6˘
CONSTRUCTIONAL PARAMETERS AND UPF RESULTS OF TESTED WOVEN FABRICSN
o
Ya
rn l
ine
ar
de
ns
ity,
te
x
Ty
pe
of
we
av
e
En
ds
/cm
Pic
ks
/cm
Re
lati
ve
fa
bri
cd
en
sit
y, %
Op
en
po
ros
ity
(re
cta
ng
ula
rM
P s
ha
pe
), %
Op
en
po
ros
ity
(ell
ipti
ca
lM
Ps
ha
pe
), %
Op
en
po
ros
ity
*(e
llip
tic
al
MP
sh
ap
e),
%
UP
F
1 14 plain 38.7 18.2 62 41 32 - 4
2 14 plain 39.4 23.0 70 37 29 - 6
3 14 plain 39.5 32.5 84 31 25 - 7
4 14 twill 51.1 24.0 62 27 21 - 9
5 14 twill 50.2 30.8 70 24 19 - 14
6 14 twill 51.6 39.6 80 19 16 - 26
7 14 satin 56.9 26.5 59 21 15 - 16
8 14 satin 56.9 35.7 69 17 14 - 29
9 14 satin 57.1 46.6 79 13 10 - 51
10 14.8 plain 40.0 15 59 41 32 13 10
11 14.8 plain 40.0 19 66 38 30 12 13
12 14.8 plain 40.0 23 73 36 28 10 15
13 14.8 plain 40.0 27 79 33 26 9 18
14 14.8 twill 40.0 15 45 41 32 13 9
15 14.8 twill 40.0 19 50 38 30 12 12
16 14.8 twill 40.0 23 55 36 28 10 15
17 14.8 twill 40.0 27 60 33 26 9 18
18 14.8 matt 40.0 15 45 41 32 13 10
19 14.8 matt 40.0 19 50 38 30 12 10
20 14.8 matt 40.0 23 55 36 28 10 14
21 14.8 matt 40.0 27 60 33 26 9 15
Table 1
* Calculation with flattened yarns
Fig. 2. The influence of open porosity on UPF for testedcotton woven samples
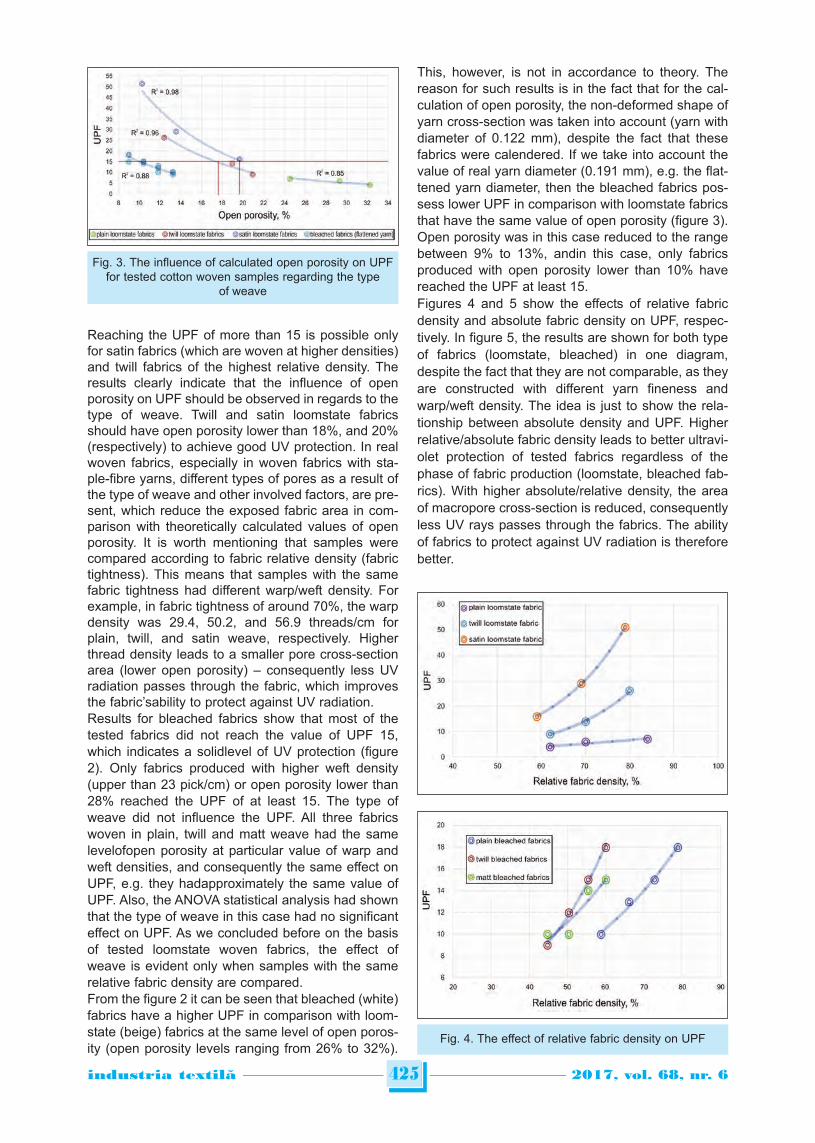
Reaching the UPF of more than 15 is possible onlyfor satin fabrics (which are woven at higher densities)and twill fabrics of the highest relative density. Theresults clearly indicate that the influence of openporosity on UPF should be observed in regards to thetype of weave. Twill and satin loomstate fabricsshould have open porosity lower than 18%, and 20%(respectively) to achieve good UV protection. In realwoven fabrics, especially in woven fabrics with sta-ple-fibre yarns, different types of pores as a result ofthe type of weave and other involved factors, are pre-sent, which reduce the exposed fabric area in com-parison with theoretically calculated values of openporosity. It is worth mentioning that samples werecompared according to fabric relative density (fabrictightness). This means that samples with the samefabric tightness had different warp/weft density. Forexample, in fabric tightness of around 70%, the warpdensity was 29.4, 50.2, and 56.9 threads/cm forplain, twill, and satin weave, respectively. Higherthread density leads to a smaller pore cross-sectionarea (lower open porosity) – consequently less UVradiation passes through the fabric, which improvesthe fabric’sability to protect against UV radiation.Results for bleached fabrics show that most of thetested fabrics did not reach the value of UPF 15,which indicates a solidlevel of UV protection (figure2). Only fabrics produced with higher weft density(upper than 23 pick/cm) or open porosity lower than28% reached the UPF of at least 15. The type ofweave did not influence the UPF. All three fabricswoven in plain, twill and matt weave had the samelevelofopen porosity at particular value of warp andweft densities, and consequently the same effect onUPF, e.g. they hadapproximately the same value ofUPF. Also, the ANOVA statistical analysis had shownthat the type of weave in this case had no significanteffect on UPF. As we concluded before on the basisof tested loomstate woven fabrics, the effect ofweave is evident only when samples with the samerelative fabric density are compared.From the figure 2 it can be seen that bleached (white)fabrics have a higher UPF in comparison with loom-state (beige) fabrics at the same level of open poros-ity (open porosity levels ranging from 26% to 32%).
This, however, is not in accordance to theory. Thereason for such results is in the fact that for the cal-culation of open porosity, the non-deformed shape ofyarn cross-section was taken into account (yarn withdiameter of 0.122 mm), despite the fact that thesefabrics were calendered. If we take into account thevalue of real yarn diameter (0.191 mm), e.g. the flat-tened yarn diameter, then the bleached fabrics pos-sess lower UPF in comparison with loomstate fabricsthat have the same value of open porosity (figure 3).Open porosity was in this case reduced to the rangebetween 9% to 13%, andin this case, only fabricsproduced with open porosity lower than 10% havereached the UPF at least 15.Figures 4 and 5 show the effects of relative fabricdensity and absolute fabric density on UPF, respec-tively. In figure 5, the results are shown for both typeof fabrics (loomstate, bleached) in one diagram,despite the fact that they are not comparable, as theyare constructed with different yarn fineness andwarp/weft density. The idea is just to show the rela-tionship between absolute density and UPF. Higherrelative/absolute fabric density leads to better ultravi-olet protection of tested fabrics regardless of thephase of fabric production (loomstate, bleached fab-rics). With higher absolute/relative density, the areaof macropore cross-section is reduced, consequentlyless UV rays passes through the fabrics. The abilityof fabrics to protect against UV radiation is thereforebetter.
425industria textila 2017, vol. 68, nr. 6˘
Fig. 3. The influence of calculated open porosity on UPFfor tested cotton woven samples regarding the type
of weave
Fig. 4. The effect of relative fabric density on UPF
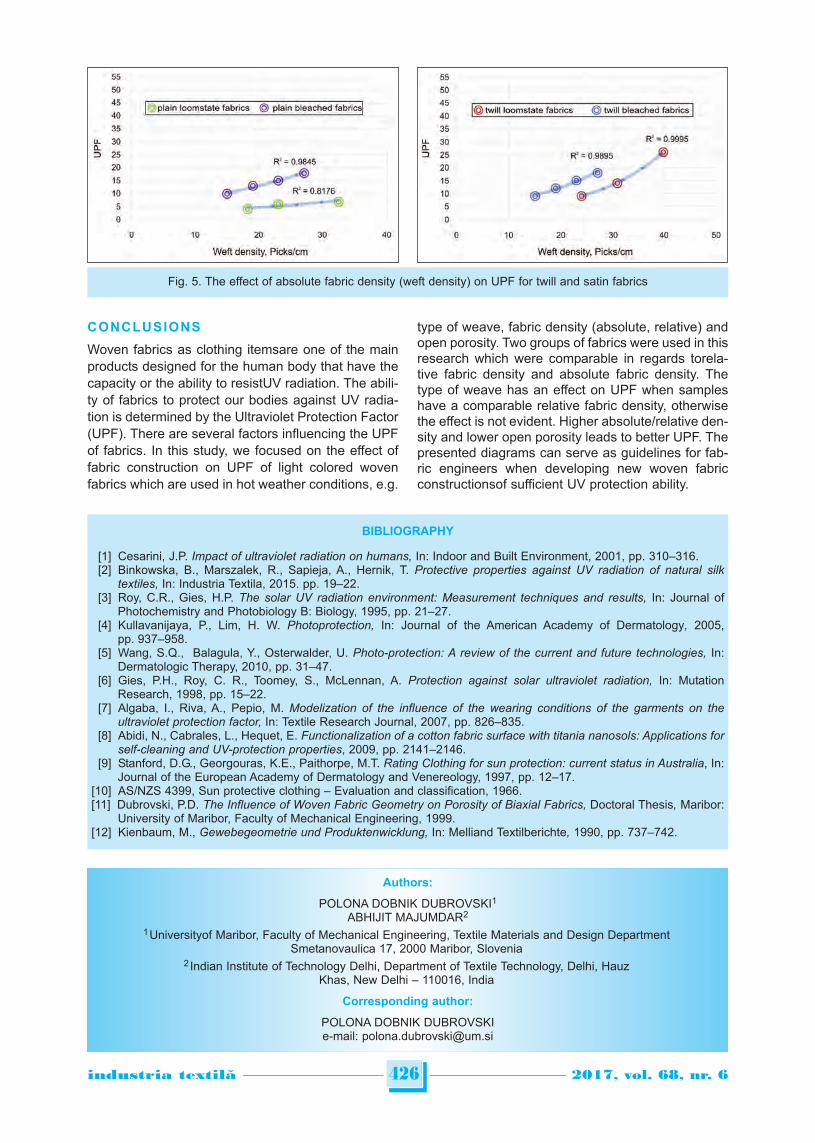
CONCLUSIONS
Woven fabrics as clothing itemsare one of the mainproducts designed for the human body that have thecapacity or the ability to resistUV radiation. The abili-ty of fabrics to protect our bodies against UV radia-tion is determined by the Ultraviolet Protection Factor(UPF). There are several factors influencing the UPFof fabrics. In this study, we focused on the effect offabric construction on UPF of light colored wovenfabrics which are used in hot weather conditions, e.g.
type of weave, fabric density (absolute, relative) andopen porosity. Two groups of fabrics were used in thisresearch which were comparable in regards torela-tive fabric density and absolute fabric density. Thetype of weave has an effect on UPF when sampleshave a comparable relative fabric density, otherwisethe effect is not evident. Higher absolute/relative den-sity and lower open porosity leads to better UPF. Thepresented diagrams can serve as guidelines for fab-ric engineers when developing new woven fabricconstructionsof sufficient UV protection ability.
426industria textila 2017, vol. 68, nr. 6˘
BIBLIOGRAPHY
[1] Cesarini, J.P. Impact of ultraviolet radiation on humans, In: Indoor and Built Environment, 2001, pp. 310–316.[2] Binkowska, B., Marszalek, R., Sapieja, A., Hernik, T. Protective properties against UV radiation of natural silk
textiles, In: Industria Textila, 2015. pp. 19–22.[3] Roy, C.R., Gies, H.P. The solar UV radiation environment: Measurement techniques and results, In: Journal of
Photochemistry and Photobiology B: Biology, 1995, pp. 21–27.[4] Kullavanijaya, P., Lim, H. W. Photoprotection, In: Journal of the American Academy of Dermatology, 2005,
pp. 937–958.[5] Wang, S.Q., Balagula, Y., Osterwalder, U. Photo-protection: A review of the current and future technologies, In:
Dermatologic Therapy, 2010, pp. 31–47.[6] Gies, P.H., Roy, C. R., Toomey, S., McLennan, A. Protection against solar ultraviolet radiation, In: Mutation
Research, 1998, pp. 15–22.[7] Algaba, I., Riva, A., Pepio, M. Modelization of the influence of the wearing conditions of the garments on the
ultraviolet protection factor, In: Textile Research Journal, 2007, pp. 826–835.[8] Abidi, N., Cabrales, L., Hequet, E. Functionalization of a cotton fabric surface with titania nanosols: Applications for
self-cleaning and UV-protection properties, 2009, pp. 2141–2146.[9] Stanford, D.G., Georgouras, K.E., Paithorpe, M.T. Rating Clothing for sun protection: current status in Australia, In:
Journal of the European Academy of Dermatology and Venereology, 1997, pp. 12–17.[10] AS/NZS 4399, Sun protective clothing – Evaluation and classification, 1966.[11] Dubrovski, P.D. The Influence of Woven Fabric Geometry on Porosity of Biaxial Fabrics, Doctoral Thesis, Maribor:
University of Maribor, Faculty of Mechanical Engineering, 1999.[12] Kienbaum, M., Gewebegeometrie und Produktenwicklung, In: Melliand Textilberichte, 1990, pp. 737–742.
Fig. 5. The effect of absolute fabric density (weft density) on UPF for twill and satin fabrics
Authors:
POLONA DOBNIK DUBROVSKI1
ABHIJIT MAJUMDAR2
1 Universityof Maribor, Faculty of Mechanical Engineering, Textile Materials and Design DepartmentSmetanovaulica 17, 2000 Maribor, Slovenia
2 Indian Institute of Technology Delhi, Department of Textile Technology, Delhi, HauzKhas, New Delhi – 110016, India
Corresponding author:
POLONA DOBNIK DUBROVSKIe-mail: [email protected]
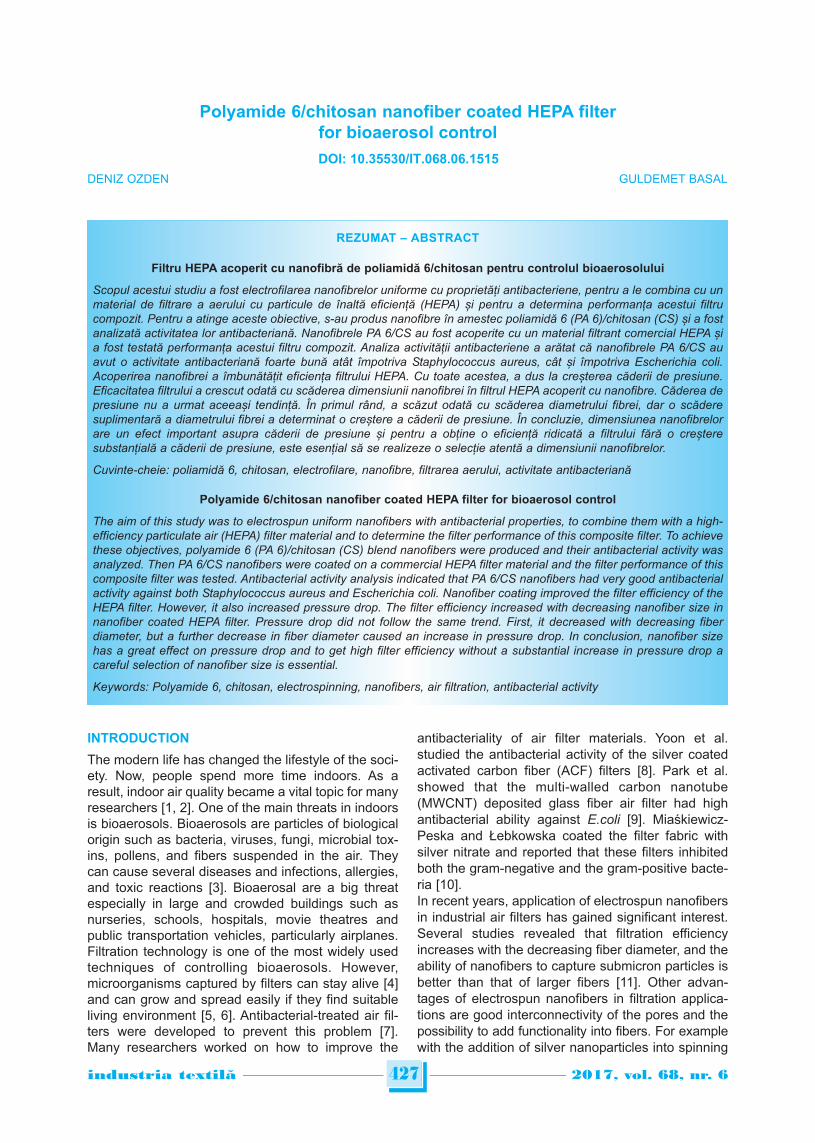
INTRODUCTION
The modern life has changed the lifestyle of the soci-ety. Now, people spend more time indoors. As aresult, indoor air quality became a vital topic for manyresearchers [1, 2]. One of the main threats in indoorsis bioaerosols. Bioaerosols are particles of biologicalorigin such as bacteria, viruses, fungi, microbial tox-ins, pollens, and fibers suspended in the air. Theycan cause several diseases and infections, allergies,and toxic reactions [3]. Bioaerosal are a big threatespecially in large and crowded buildings such asnurseries, schools, hospitals, movie theatres andpublic transportation vehicles, particularly airplanes.Filtration technology is one of the most widely usedtechniques of controlling bioaerosols. However,micro organisms captured by filters can stay alive [4]and can grow and spread easily if they find suitableliving environment [5, 6]. Antibacterial-treated air fil-ters were developed to prevent this problem [7].Many researchers worked on how to improve the
antibacteriality of air filter materials. Yoon et al.studied the antibacterial activity of the silver coatedactivated carbon fiber (ACF) filters [8]. Park et al.showed that the multi-walled carbon nanotube(MWCNT) deposited glass fiber air filter had highantibacterial ability against E.coli [9]. Miaśkiewicz-Peska and Łebkowska coated the filter fabric withsilver nitrate and reported that these filters inhibitedboth the gram-negative and the gram-positive bacte-ria [10]. In recent years, application of electrospun nanofibersin industrial air filters has gained significant interest.Several studies revealed that filtration efficiencyincreases with the decreasing fiber diameter, and theability of nanofibers to capture submicron particles isbetter than that of larger fibers [11]. Other advan-tages of electrospun nanofibers in filtration applica-tions are good interconnectivity of the pores and thepossibility to add functionality into fibers. For examplewith the addition of silver nanoparticles into spinning
Polyamide 6/chitosan nanofiber coated HEPA filterfor bioaerosol control
DENIZ OZDEN GULDEMET BASAL
REZUMAT – ABSTRACT
Filtru HEPA acoperit cu nanofibră de poliamidă 6/chitosan pentru controlul bioaerosolului
Scopul acestui studiu a fost electrofilarea nanofibrelor uniforme cu proprietăți antibacteriene, pentru a le combina cu unmaterial de filtrare a aerului cu particule de înaltă eficiență (HEPA) și pentru a determina performanța acestui filtrucompozit. Pentru a atinge aceste obiective, s-au produs nanofibre în amestec poliamidă 6 (PA 6)/chitosan (CS) și a fostanalizată activitatea lor antibacteriană. Nanofibrele PA 6/CS au fost acoperite cu un material filtrant comercial HEPA șia fost testată performanța acestui filtru compozit. Analiza activității antibacteriene a arătat că nanofibrele PA 6/CS auavut o activitate antibacteriană foarte bună atât împotriva Staphylococcus aureus, cât și împotriva Escherichia coli.Acoperirea nanofibrei a îmbunătățit eficiența filtrului HEPA. Cu toate acestea, a dus la creșterea căderii de presiune.Eficacitatea filtrului a crescut odată cu scăderea dimensiunii nanofibrei în filtrul HEPA acoperit cu nanofibre. Căderea depresiune nu a urmat aceeași tendință. În primul rând, a scăzut odată cu scăderea diametrului fibrei, dar o scăderesuplimentară a diametrului fibrei a determinat o creștere a căderii de presiune. În concluzie, dimensiunea nanofibrelorare un efect important asupra căderii de presiune și pentru a obține o eficiență ridicată a filtrului fără o creșteresubstanțială a căderii de presiune, este esenţial să se realizeze o selecție atentă a dimensiunii nanofibrelor.
Cuvinte-cheie: poliamidă 6, chitosan, electrofilare, nanofibre, filtrarea aerului, activitate antibacteriană
Polyamide 6/chitosan nanofiber coated HEPA filter for bioaerosol control
The aim of this study was to electrospun uniform nanofibers with antibacterial properties, to combine them with a high-efficiency particulate air (HEPA) filter material and to determine the filter performance of this composite filter. To achievethese objectives, polyamide 6 (PA 6)/chitosan (CS) blend nanofibers were produced and their antibacterial activity wasanalyzed. Then PA 6/CS nanofibers were coated on a commercial HEPA filter material and the filter performance of thiscomposite filter was tested. Antibacterial activity analysis indicated that PA 6/CS nanofibers had very good antibacterialactivity against both Staphylococcus aureus and Escherichia coli. Nanofiber coating improved the filter efficiency of theHEPA filter. However, it also increased pressure drop. The filter efficiency increased with decreasing nanofiber size innanofiber coated HEPA filter. Pressure drop did not follow the same trend. First, it decreased with decreasing fiberdiameter, but a further decrease in fiber diameter caused an increase in pressure drop. In conclusion, nanofiber sizehas a great effect on pressure drop and to get high filter efficiency without a substantial increase in pressure drop acareful selection of nanofiber size is essential.
Keywords: Polyamide 6, chitosan, electrospinning, nanofibers, air filtration, antibacterial activity
427industria textila 2017, vol. 68, nr. 6˘
DOI: 10.35530/IT.068.06.1515
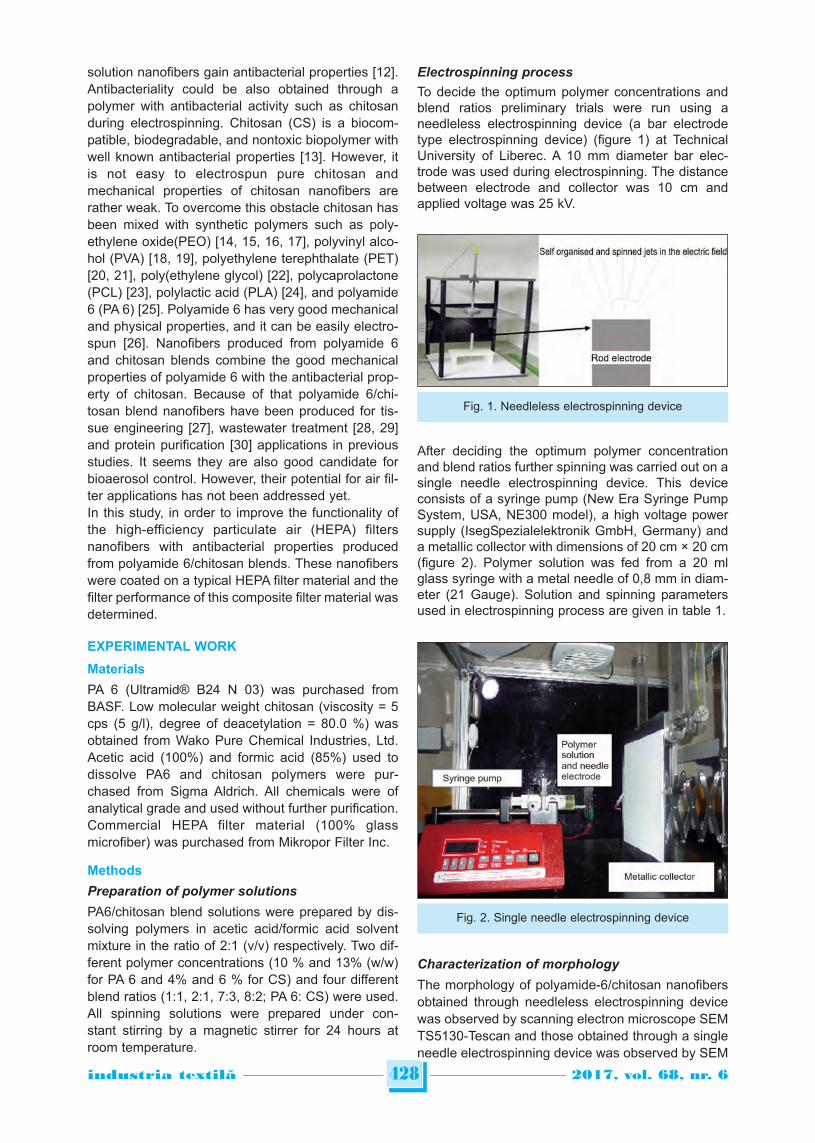
solution nanofibers gain antibacterial properties [12].Antibacteriality could be also obtained through apolymer with antibacterial activity such as chitosanduring electrospinning. Chitosan (CS) is a biocom-patible, biodegradable, and nontoxic biopolymer withwell known antibacterial properties [13]. However, itis not easy to electrospun pure chitosan andmechanical properties of chitosan nanofibers arerather weak. To overcome this obstacle chitosan hasbeen mixed with synthetic polymers such as poly -ethylene oxide(PEO) [14, 15, 16, 17], polyvinyl alco-hol (PVA) [18, 19], polyethylene terephthalate (PET)[20, 21], poly(ethylene glycol) [22], polycaprolactone(PCL) [23], polylactic acid (PLA) [24], and polyamide6 (PA 6) [25]. Polyamide 6 has very good mechanicaland physical properties, and it can be easily electro-spun [26]. Nanofibers produced from polyamide 6and chitosan blends combine the good mechanicalproperties of polyamide 6 with the antibacterial prop-erty of chitosan. Because of that polyamide 6/chi-tosan blend nanofibers have been produced for tis-sue engineering [27], wastewater treatment [28, 29]and protein purification [30] applications in previousstudies. It seems they are also good candidate forbioaerosol control. However, their potential for air fil-ter applications has not been addressed yet. In this study, in order to improve the functionality ofthe high-efficiency particulate air (HEPA) filtersnanofibers with antibacterial properties producedfrom polyamide 6/chitosan blends. These nanofiberswere coated on a typical HEPA filter material and thefilter performance of this composite filter material wasdetermined.
EXPERIMENTAL WORK
Materials
PA 6 (Ultramid® B24 N 03) was purchased fromBASF. Low molecular weight chitosan (viscosity = 5cps (5 g/l), degree of deacetylation = 80.0 %) wasobtained from Wako Pure Chemical Industries, Ltd.Acetic acid (100%) and formic acid (85%) used todissolve PA6 and chitosan polymers were pur-chased from Sigma Aldrich. All chemicals were ofanalytical grade and used without further purification.Commercial HEPA filter material (100% glassmicrofiber) was purchased from Mikropor Filter Inc.
Methods
Preparation of polymer solutions
PA6/chitosan blend solutions were prepared by dis-solving polymers in acetic acid/formic acid solventmixture in the ratio of 2:1 (v/v) respectively. Two dif-ferent polymer concentrations (10 % and 13% (w/w)for PA 6 and 4% and 6 % for CS) and four differentblend ratios (1:1, 2:1, 7:3, 8:2; PA 6: CS) were used.All spinning solutions were prepared under con-stant stirring by a magnetic stirrer for 24 hours atroom temperature.
Electrospinning process
To decide the optimum polymer concentrations andblend ratios preliminary trials were run using aneedleless electrospinning device (a bar electrodetype electrospinning device) (figure 1) at TechnicalUniversity of Liberec. A 10 mm diameter bar elec-trode was used during electrospinning. The distancebetween electrode and collector was 10 cm andapplied voltage was 25 kV.
After deciding the optimum polymer concentrationand blend ratios further spinning was carried out on asingle needle electrospinning device. This deviceconsists of a syringe pump (New Era Syringe PumpSystem, USA, NE300 model), a high voltage powersupply (IsegSpezialelektronik GmbH, Germany) anda metallic collector with dimensions of 20 cm × 20 cm(figure 2). Polymer solution was fed from a 20 mlglass syringe with a metal needle of 0,8 mm in diam-eter (21 Gauge). Solution and spinning parametersused in electrospinning process are given in table 1.
Characterization of morphology
The morphology of polyamide-6/chitosan nanofibersobtained through needleless electrospinning devicewas observed by scanning electron microscope SEMTS5130-Tescan and those obtained through a singleneedle electrospinning device was observed by SEM
428industria textila 2017, vol. 68, nr. 6˘
Fig. 2. Single needle electrospinning device
Fig. 1. Needleless electrospinning device
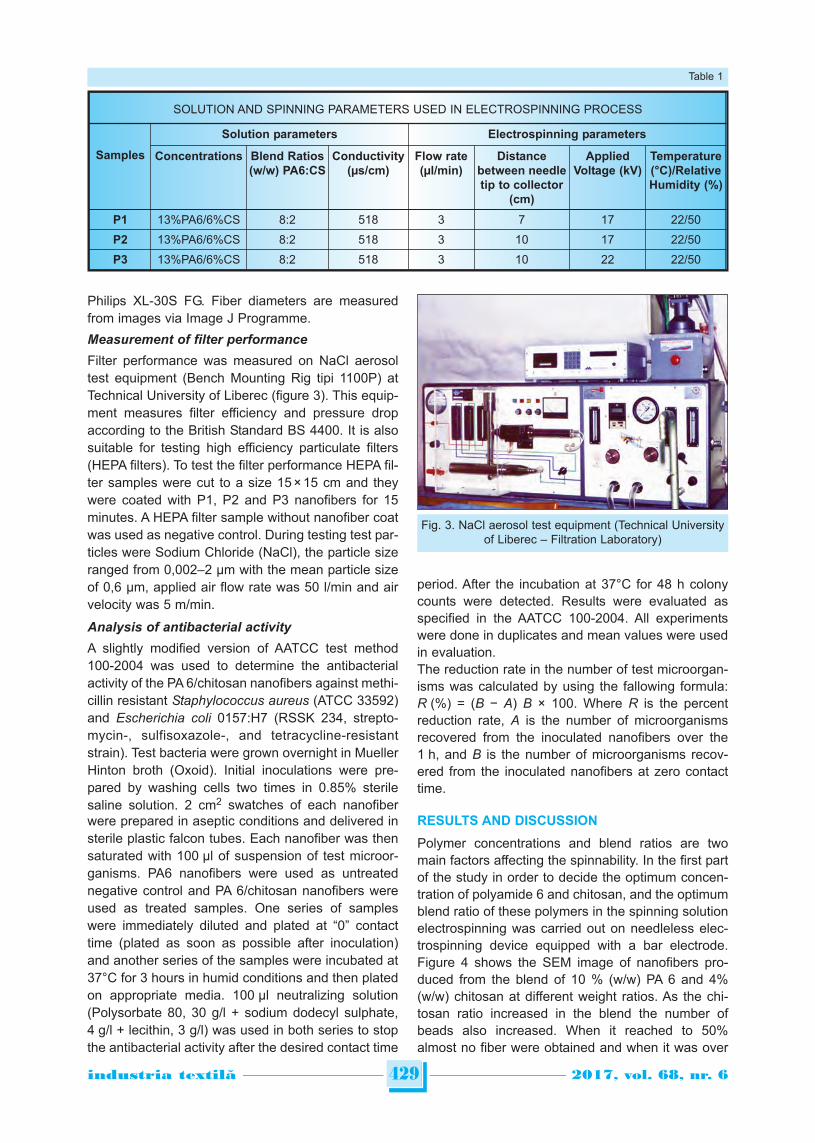
Philips XL-30S FG. Fiber diameters are measuredfrom images via Image J Programme.
Measurement of filter performance
Filter performance was measured on NaCl aerosoltest equipment (Bench Mounting Rig tipi 1100P) atTechnical University of Liberec (figure 3). This equip-ment measures filter efficiency and pressure dropaccording to the British Standard BS 4400. It is alsosuitable for testing high efficiency particulate filters(HEPA filters). To test the filter performance HEPA fil-ter samples were cut to a size 15 × 15 cm and theywere coated with P1, P2 and P3 nanofibers for 15minutes. A HEPA filter sample without nanofiber coatwas used as negative control. During testing test par-ticles were Sodium Chloride (NaCl), the particle sizeranged from 0,002–2 µm with the mean particle sizeof 0,6 µm, applied air flow rate was 50 l/min and airvelocity was 5 m/min.
Analysis of antibacterial activity
A slightly modified version of AATCC test method100-2004 was used to determine the antibacterialactivity of the PA 6/chitosan nanofibers against methi-cillin resistant Staphylococcus aureus (ATCC 33592)and Escherichia coli 0157:H7 (RSSK 234, strepto-mycin-, sulfisoxazole-, and tetracycline-resistantstrain). Test bacteria were grown overnight in MuellerHinton broth (Oxoid). Initial inoculations were pre-pared by washing cells two times in 0.85% sterilesaline solution. 2 cm2 swatches of each nanofiberwere prepared in aseptic conditions and delivered insterile plastic falcon tubes. Each nanofiber was thensaturated with 100 µl of suspension of test microor-ganisms. PA6 nanofibers were used as untreatednegative control and PA 6/chitosan nanofibers wereused as treated samples. One series of sampleswere immediately diluted and plated at “0” contacttime (plated as soon as possible after inoculation)and another series of the samples were incubated at37°C for 3 hours in humid conditions and then platedon appropriate media. 100 µl neutralizing solution(Polysorbate 80, 30 g/l + sodium dodecyl sulphate,4 g/l + lecithin, 3 g/l) was used in both series to stopthe antibacterial activity after the desired contact time
period. After the incubation at 37°C for 48 h colonycounts were detected. Results were evaluated asspecified in the AATCC 100-2004. All experimentswere done in duplicates and mean values were usedin evaluation. The reduction rate in the number of test microorgan-isms was calculated by using the fallowing formula:R (%) = (B − A) B × 100. Where R is the percentreduction rate, A is the number of microorganismsrecovered from the inoculated nanofibers over the1 h, and B is the number of microorganisms recov-ered from the inoculated nanofibers at zero contacttime.
RESULTS AND DISCUSSION
Polymer concentrations and blend ratios are twomain factors affecting the spinnability. In the first partof the study in order to decide the optimum concen-tration of polyamide 6 and chitosan, and the optimumblend ratio of these polymers in the spinning solutionelectrospinning was carried out on needleless elec-trospinning device equipped with a bar electrode.Figure 4 shows the SEM image of nanofibers pro-duced from the blend of 10 % (w/w) PA 6 and 4%(w/w) chitosan at different weight ratios. As the chi-tosan ratio increased in the blend the number ofbeads also increased. When it reached to 50%almost no fiber were obtained and when it was over
429industria textila 2017, vol. 68, nr. 6˘
SOLUTION AND SPINNING PARAMETERS USED IN ELECTROSPINNING PROCESS
Samples
Solution parameters Electrospinning parameters
Concentrations Blend Ratios(w/w) PA6:CS
Conductivity(µs/cm)
Flow rate(µl/min)
Distancebetween needletip to collector
(cm)
AppliedVoltage (kV)
Temperature(°C)/RelativeHumidity (%)
P1 13%PA6/6%CS 8:2 518 3 7 17 22/50
P2 13%PA6/6%CS 8:2 518 3 10 17 22/50
P3 13%PA6/6%CS 8:2 518 3 10 22 22/50
Table 1
Fig. 3. NaCl aerosol test equipment (Technical Universityof Liberec – Filtration Laboratory)
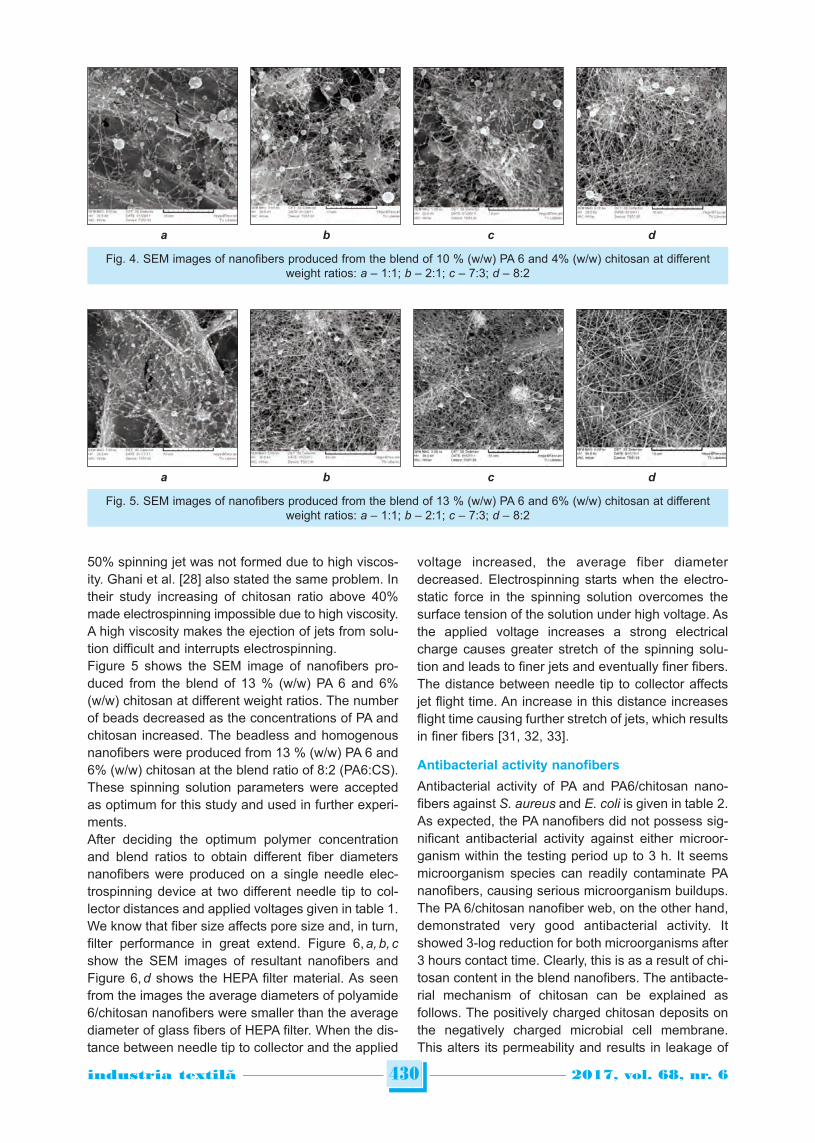
50% spinning jet was not formed due to high viscos-ity. Ghani et al. [28] also stated the same problem. Intheir study increasing of chitosan ratio above 40%made electrospinning impossible due to high viscosity.A high viscosity makes the ejection of jets from solu-tion difficult and interrupts electrospinning. Figure 5 shows the SEM image of nanofibers pro-duced from the blend of 13 % (w/w) PA 6 and 6%(w/w) chitosan at different weight ratios. The numberof beads decreased as the concentrations of PA andchitosan increased. The beadless and homogenousnanofibers were produced from 13 % (w/w) PA 6 and6% (w/w) chitosan at the blend ratio of 8:2 (PA6:CS).These spinning solution parameters were acceptedas optimum for this study and used in further experi-ments.After deciding the optimum polymer concentrationand blend ratios to obtain different fiber diametersnanofibers were produced on a single needle elec-trospinning device at two different needle tip to col-lector distances and applied voltages given in table 1.We know that fiber size affects pore size and, in turn,filter performance in great extend. Figure 6, a, b, cshow the SEM images of resultant nanofibers andFigure 6, d shows the HEPA filter material. As seenfrom the images the average diameters of polyamide6/chitosan nanofibers were smaller than the averagediameter of glass fibers of HEPA filter. When the dis-tance between needle tip to collector and the applied
voltage increased, the average fiber diameterdecreased. Electrospinning starts when the electro-static force in the spinning solution overcomes thesurface tension of the solution under high voltage. Asthe applied voltage increases a strong electricalcharge causes greater stretch of the spinning solu-tion and leads to finer jets and eventually finer fibers.The distance between needle tip to collector affectsjet flight time. An increase in this distance increasesflight time causing further stretch of jets, which resultsin finer fibers [31, 32, 33].
Antibacterial activity nanofibers
Antibacterial activity of PA and PA6/chitosan nano -fibers against S. aureus and E. coli is given in table 2.As expected, the PA nanofibers did not possess sig-nificant antibacterial activity against either microor-ganism within the testing period up to 3 h. It seemsmicroorganism species can readily contaminate PAnanofibers, causing serious microorganism buildups.The PA 6/chitosan nanofiber web, on the other hand,demonstrated very good antibacterial activity. Itshowed 3-log reduction for both microorganisms after3 hours contact time. Clearly, this is as a result of chi-tosan content in the blend nanofibers. The antibacte-rial mechanism of chitosan can be explained asfollows. The positively charged chitosan deposits onthe negatively charged microbial cell membrane.This alters its permeability and results in leakage of
430industria textila 2017, vol. 68, nr. 6˘
Fig. 4. SEM images of nanofibers produced from the blend of 10 % (w/w) PA 6 and 4% (w/w) chitosan at differentweight ratios: a – 1:1; b – 2:1; c – 7:3; d – 8:2
a b c d
Fig. 5. SEM images of nanofibers produced from the blend of 13 % (w/w) PA 6 and 6% (w/w) chitosan at differentweight ratios: a – 1:1; b – 2:1; c – 7:3; d – 8:2
a b c d
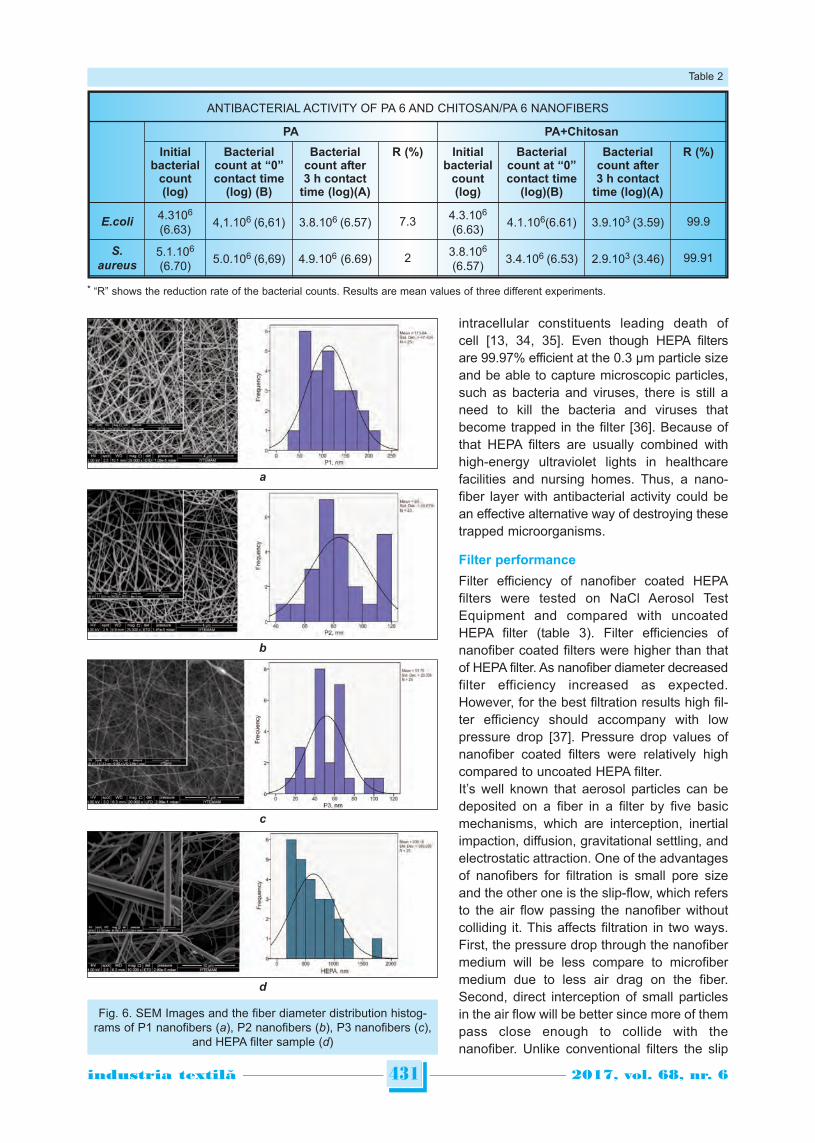
intracellular constituents leading death ofcell [13, 34, 35]. Even though HEPA filtersare 99.97% efficient at the 0.3 µm particle sizeand be able to capture microscopic particles,such as bacteria and viruses, there is still aneed to kill the bacteria and viruses thatbecome trapped in the filter [36]. Because ofthat HEPA filters are usually combined withhigh-energy ultraviolet lights in healthcarefacilities and nursing homes. Thus, a nano -fiber layer with antibacterial activity could bean effective alternative way of destroying thesetrapped microorganisms.
Filter performance
Filter efficiency of nanofiber coated HEPAfilters were tested on NaCl Aerosol TestEquipment and compared with uncoatedHEPA filter (table 3). Filter efficiencies ofnano fiber coated filters were higher than thatof HEPA filter. As nanofiber diameter decreasedfilter efficiency increased as expected.However, for the best filtration results high fil-ter efficiency should accompany with lowpressure drop [37]. Pressure drop values ofnanofiber coated filters were relatively highcompared to uncoated HEPA filter. It’s well known that aerosol particles can bedeposited on a fiber in a filter by five basicmechanisms, which are interception, inertialimpaction, diffusion, gravitational settling, andelectrostatic attraction. One of the advantagesof nanofibers for filtration is small pore sizeand the other one is the slip-flow, which refersto the air flow passing the nanofiber withoutcolliding it. This affects filtration in two ways.First, the pressure drop through the nanofibermedium will be less compare to microfibermedium due to less air drag on the fiber.Second, direct interception of small particlesin the air flow will be better since more of thempass close enough to collide with thenanofiber. Unlike conventional filters the slip
431industria textila 2017, vol. 68, nr. 6˘
* “R” shows the reduction rate of the bacterial counts. Results are mean values of three different experiments.
ANTIBACTERIAL ACTIVITY OF PA 6 AND CHITOSAN/PA 6 NANOFIBERS
PA PA+Chitosan
Initialbacterial
count(log)
Bacterialcount at “0”contact time
(log) (B)
Bacterialcount after3 h contact
time (log)(A)
R (%) Initialbacterial
count(log)
Bacterialcount at “0”contact time
(log)(B)
Bacterialcount after3 h contact
time (log)(A)
R (%)
E.coli4.3106
(6.63)4,1.106 (6,61) 3.8.106 (6.57) 7.3 4.3.106
(6.63)4.1.106(6.61) 3.9.103 (3.59) 99.9
S.
aureus5.1.106
(6.70)5.0.106 (6,69) 4.9.106 (6.69) 2 3.8.106
(6.57)3.4.106 (6.53) 2.9.103 (3.46) 99.91
Table 2
a
b
d
c
Fig. 6. SEM Images and the fiber diameter distribution histog-rams of P1 nanofibers (a), P2 nanofibers (b), P3 nanofibers (c),
and HEPA filter sample (d)
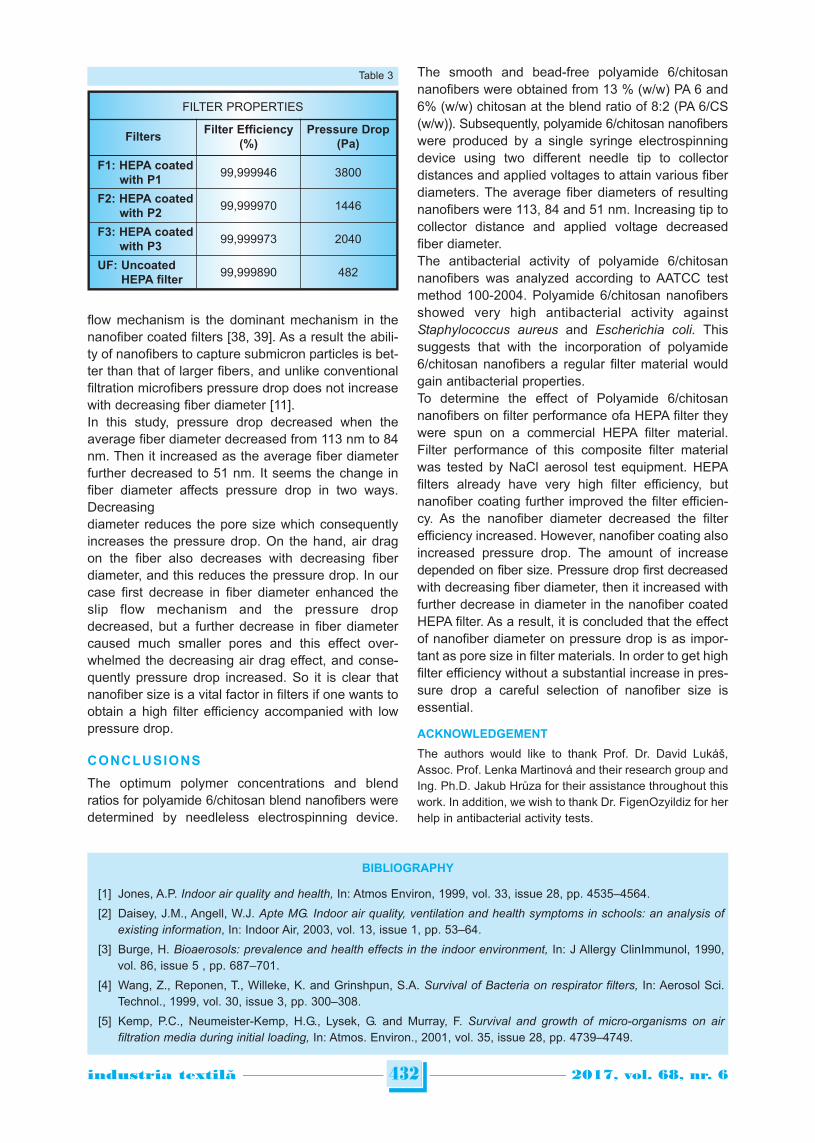
flow mechanism is the dominant mechanism in thenanofiber coated filters [38, 39]. As a result the abili-ty of nanofibers to capture submicron particles is bet-ter than that of larger fibers, and unlike conventionalfiltration micro fibers pressure drop does not increasewith decreasing fiber diameter [11].In this study, pressure drop decreased when theaverage fiber diameter decreased from 113 nm to 84nm. Then it increased as the average fiber diameterfurther decreased to 51 nm. It seems the change infiber diameter affects pressure drop in two ways.Decreasingdiameter reduces the pore size which consequentlyincreases the pressure drop. On the hand, air dragon the fiber also decreases with decreasing fiberdiameter, and this reduces the pressure drop. In ourcase first decrease in fiber diameter enhanced theslip flow mechanism and the pressure dropdecreased, but a further decrease in fiber diametercaused much smaller pores and this effect over-whelmed the decreasing air drag effect, and conse-quently pressure drop increased. So it is clear thatnanofiber size is a vital factor in filters if one wants toobtain a high filter efficiency accompanied with lowpressure drop.
CONCLUSIONS
The optimum polymer concentrations and blendratios for polyamide 6/chitosan blend nanofibers weredetermined by needleless electrospinning device.
The smooth and bead-free polyamide 6/chitosannanofibers were obtained from 13 % (w/w) PA 6 and6% (w/w) chitosan at the blend ratio of 8:2 (PA 6/CS(w/w)). Subsequently, polyamide 6/chitosan nanofiberswere produced by a single syringe electrospinningdevice using two different needle tip to collectordistances and applied voltages to attain various fiberdiameters. The average fiber diameters of resultingnanofibers were 113, 84 and 51 nm. Increasing tip tocollector distance and applied voltage decreasedfiber diameter. The antibacterial activity of polyamide 6/chitosannanofibers was analyzed according to AATCC testmethod 100-2004. Polyamide 6/chitosan nanofibersshowed very high antibacterial activity againstStaphylococcus aureus and Escherichia coli. Thissuggests that with the incorporation of polyamide6/chitosan nanofibers a regular filter material wouldgain antibacterial properties. To determine the effect of Polyamide 6/chitosannanofibers on filter performance ofa HEPA filter theywere spun on a commercial HEPA filter material.Filter performance of this composite filter materialwas tested by NaCl aerosol test equipment. HEPAfilters already have very high filter efficiency, butnano fiber coating further improved the filter efficien-cy. As the nanofiber diameter decreased the filterefficiency increased. However, nanofiber coating alsoincreased pressure drop. The amount of increasedepended on fiber size. Pressure drop first decreasedwith decreasing fiber diameter, then it increased withfurther decrease in diameter in the nanofiber coatedHEPA filter. As a result, it is concluded that the effectof nanofiber diameter on pressure drop is as impor-tant as pore size in filter materials. In order to get highfilter efficiency without a substantial increase in pres-sure drop a careful selection of nanofiber size isessential.
ACKNOWLEDGEMENT
The authors would like to thank Prof. Dr. David Lukáš,Assoc. Prof. Lenka Martinová and their research group andIng. Ph.D. Jakub Hrůza for their assistance throughout thiswork. In addition, we wish to thank Dr. FigenOzyildiz for herhelp in antibacterial activity tests.
432industria textila 2017, vol. 68, nr. 6˘
BIBLIOGRAPHY
[1] Jones, A.P. Indoor air quality and health, In: Atmos Environ, 1999, vol. 33, issue 28, pp. 4535–4564.
[2] Daisey, J.M., Angell, W.J. Apte MG. Indoor air quality, ventilation and health symptoms in schools: an analysis ofexisting information, In: Indoor Air, 2003, vol. 13, issue 1, pp. 53–64.
[3] Burge, H. Bioaerosols: prevalence and health effects in the indoor environment, In: J Allergy ClinImmunol, 1990,vol. 86, issue 5 , pp. 687–701.
[4] Wang, Z., Reponen, T., Willeke, K. and Grinshpun, S.A. Survival of Bacteria on respirator filters, In: Aerosol Sci.Technol., 1999, vol. 30, issue 3, pp. 300–308.
[5] Kemp, P.C., Neumeister-Kemp, H.G., Lysek, G. and Murray, F. Survival and growth of micro-organisms on airfiltration media during initial loading, In: Atmos. Environ., 2001, vol. 35, issue 28, pp. 4739–4749.
FILTER PROPERTIES
FiltersFilter Efficiency
(%)Pressure Drop
(Pa)
F1: HEPA coatedwith P1
99,999946 3800
F2: HEPA coatedwith P2
99,999970 1446
F3: HEPA coatedwith P3
99,999973 2040
UF: UncoatedHEPA filter
99,999890 482
Table 3
433industria textila 2017, vol. 68, nr. 6˘
[6] Maus, R., Goppelsroder, A. and Umhauer, H. Survival of bacterial and mold spores in air filter media, In: Atmos.Environ. 2001, vol. 35, issue 1, pp. 105–113.
[7] Foarde, K.K. and Hanley, J.T. Determine the efficacy of antimicrobial treatments of fibrous air filters, In: ASHRAETrans., 1999, 4429(RP-909).
[8] Yoon, K.Y., Byeon, J.H., Park, C.W. and Hwang, J. Antimicrobial effect of silver particles on bacterial contaminationof activated carbon fibers, In: Environ. Sci. Technol., 2008, vol. 42, issue 4, pp. 1251–1255.
[9] Park, J.H., Yoon, K.Y., Na, H., Kim, Y.S., Hwang, J., Kim, J. and Yoon, Y.H. Fabrication of a multiwalled carbonnanotube-deposited glass fiber air filter for the enhancement of nano and submicron aerosol particle filtration andadditional antibacterial efficacy, In: Sci. Total Environ., 2011, vol. 409, issue 19, pp. 4132–4138.
[10] Miaśkiewicz-Peska, E. and Łebkowska, M., Effect of antimicrobial air filter treatment on bacterial survival, In: FibresText. East. Eur., 2011, vol. 19, issue1, pp. 73–77.
[11] Qin, X.H., Wang S.Y. Filtration properties of electrospinning nanofibres, In: J. Appl. Polym. Sci., 2006, vol. 102,issue 2, pp. 1285–1290.
[12] Lala, N.L., Ramaseshan, R., Bojun, L., Sundarrajan, S., Barhate, R.S., Ying-jun, L., Ramakrishna, S. Fabrication ofnanofibers with antimicrobial functionality used as filters – protection against bacterial contaminants, In:Biotechnology and Bioengineering, 2007, vol. 97, issue 6, pp. 1357–1365.
[13] Kong, M., Chen, X.G., Xing, K., Park, H.J. Antimicrobial properties of chitosan and mode of action: a state of the artreview, In: International Journal of Food Microbiology, 2010, vol. 144, issue 1, pp. 51–63.
[14] Kriegel, C., Kit, K.M., McClements, D.J., Weiss, J. Electrospinning of chitosan–poly(ethylene oxide) blendnanofibers in the presence of micellar surfactant solutions, In: Polymer, 2009, vol. 50, issue 1, pp. 189–200.
[15] Kriegel, C., Kit, K.M., McClements, D.J., Weiss, J. Influence of surfactant type and concentration on electrospinningof chitosan–poly(ethylene oxide) blend nanofibers, In: Food Biophysics, 2009, vol. 4, issue 3, pp. 213–228.
[16] Zhang, J.F., Yang, D.Z., Xu, F., Yin, R.X., Nie, J. Electrospuncore!shell structure nanofibers from homogeneoussolution of poly(ethylene oxide)/chitosan, In: Macromolecules, 2009, vol. 42, issue 14, pp. 5278–5284.
[17] Dogan, G., Ozyildiz, F., Basal, G., Uzel, A. Fabrication of electrospun chitosan and chitosan/poly(ethylene oxide)nanofiber webs and assessment of their antimicrobial activity, In: International Polymer Processing, 2013, vol. 28,issue 2, pp. 143–150.
[18] Zheng, H., Du, Y., Yu, J., Huang, R., Zhang, L. Preparation and characterization of chitosan/poly(vinyl alcohol) blendfibers, In: Journal of Applied Polymer Science, 2001, vol. 80, issue 13, pp. 2558–2565.
[19] Zhang, Y., Huang, X., Duan, B., Wu, B., Li, S., Juan, X. Preparation of electrospun chitosan/poly(vinyl alcohol)membranes, In: Colloid and Polymer Science, 2007, vol. 285, issue 8, pp. 855–863.
[20] Jung, K.H., Huh, M.W., Meng, W., Yuan, J., Hyun, S.H., Bae, J.S., Hudson, S.M., Kang, I.K. Preparation andantibacterial activity of PET/chitosan nanofibrous mats using an electrospinning technique, In: Journal of AppliedPolymer Science, 2007, vol. 105, issue 5, pp. 2816–2823.
[21] Lopes-da-Silva, J.A., Veleirinho, B., Delgadillo, I. Preparation and characterization of electrospun mats made ofPET/chitosan hybrid nanofibers, In: Journal of Nanoscience and Nanotechnology, 2009, vol. 9, issue 6, pp. 3798–3804.
[22] Kolhe, P., Kannan, R.M. Improvement in ductility of chitosan through blending and copolymerization with PEG:FTIR Investigation of Molecular Interactions, In: Biomacromolecules, 2003, vol. 4 , issue 1, pp. 173–180.
[23] Shalumon, K.T., Anulekha, K.H., Girish, C.M., Prasantha, R., Naira, S.V., Jayakumar, R. Single step electrospinningof chitosan/poly(caprolactone) nanofibers using formic acid/acetone solvent mixture, In: Carbohydrate Polymers,2010, vol. 80, issue 2, pp. 413–419.
[24] Xu, J., Zhang, J. H., Gao, W. Q., Liang, H., Wang, H., Li J. Preparation of chitosan/PLA blend micro/nano-fibers byelectrospinning, In: Materials Letters, 2009, vol. 63, issue 8, pp. 658–660.
[25] Zhang, H. T., Li, S. B., Christopher, J., Ning, X., Nie, H., Zhu, L. Studies on electrospun nylon-6/chitosan complexnanofiber interactions, In: ElectrochimicaActa, 2009, vol. 54, issue 24, pp. 5739–5745.
[26] Stephens, J.S., Chase, D.B. and Rabolt, J.F. Effect of the electrospinning process on polymer crystallization chainconformation in nylon-6 and nylon-12, In: Macromolecules, 2004, vol. 37, issue 3, pp. 877–881.
[27] Nirmala, R., Navamathavan, R., Kang, H.S., El-Newehy, M. H. and Kim, H. Y. Preparation of polyamide-6/chitosancomposite nanofibers by a single solvent system via electrospinning for biomedical applications, In: Colloids andSurfaces B, 2011, vol. 83, issue 1, pp. 173–178.
[28] Ghani, M., Gharehaghaji, A.A., Arami, M., Takhtkuse, N., andRezaei, B. Fabrication of electrospun polyamide-6/chitosan nanofibrous membrane toward anionic dyes removal, In: Journal of Nanotechnology, 2014, vol. 2014,Article ID 278418, 12 pages.
[29] Maryšková, M., Ardao, I, García-González, C.A., Martinová, L., Rotková, J., Ševců, A. Polyamide 6/chitosannanofibers as support for the immobilization of Trametes versicolor laccase for the elimination of endocrinedisrupting chemicals, In: Enzyme Microb Technol., 2016 , vol. 89, pp. 31–38.
[30] Zhang, H., Wu, C., Zhang Y., White C., J.B. , Xue, Y, Nie H, Zhu, L. Elaboration, characterization and study of anovel affinity membrane made from electrospun hybrid chitosan/nylon-6 nanofibers for papain purification, In:Journal of Materials Science, 2010, vol. 45, issue 9, pp. 2296–2304.
[31] Homayonia, H., Ravandi, S. A. H., Valizadeh, M. Electrospinning of chitosan nanofibers: Processing optimization,In: Carbohydrate Polymers, 2009, vol. 77, issue 3, pp. 656–661.
434industria textila 2017, vol. 68, nr. 6˘
[32] Frenot, A., Chronakis, I. Polymer nanofibers assembled by electrospinning, In: Current Opinion in Colloid andInterface Science, 2003, vol. 8, issue 1, pp. 64–75.
[33] Ramakrishna, S., Fujihara, K., Teo, W.E., Lim, T.C., Ma, Z. Introduction to electrospinning and nanofibers, In: WordScientific Publishing, Singapore, 2005, pp. 90–152.
[34] Papineau, A.M., Hoover, D.G., Dnorr, D., Farkas, D.F. Antimicrobial effect of water-soluble chitosans with highhydrostatic pressure, In: Food Biotechnology, 1991, vol. 5, issue 1, pp. 45–57.
[35] Helander, I.M., Nurmiaho-Lassila, E.L., Ahvenainen, R., Rhoades, J., Roller, S. Chitosan disrupts the barrierproperties of the outer membrane of gram-negative bacteria, In: International Journal of Food Microbiology, 2001,vol. 71, issue 2–3, pp. 235–244.
[36] Himanshu Mittal, S.R.P., Pottage, T., Walker, J.T., & Bennett, A.M. Survival of microorganisms on HEPA filters,In: Applied Biosafety, 2011, vol. 16, pp. 163–166.
[37] Matteson, M.J., Orr, C. Filtration: Principles and practices, In: Marcel Dekker, New York, 1987, pp. 1–8.
[38] Graham, K., Ouyang, M., Raether, T., Grafe, T., McDonald, B., Knauf, P. Polymeric nanofibers in air filtrationapplications, In: The Fifteenth Annual Technical Conference & Expo of the American Filtration & SeparationsSociety, Galveston, Texas, April 9-12, 2002.
[39] Sundarrajana, S., Tana, K.L., Lima, S. H., Ramakrishnab, S. Electrospun nanofibers for air filtration applications,In: Procedia Engineering, 2014, vol. 75, pp. 159–163.
Authors:
MSc. Eng. Deniz Ozden1
Assoc. Prof. Dr. Guldemet Basal 2
1 Ege University, Faculty of Engineering, Department of Textile Engineering
35100, Bornova-Izmir, Turkey
2 Ege University, Faculty of Engineering, Department of Textile Engineering
35100, Bornova-Izmir, Turkey
Corresponding author:
Assoc. Prof. Dr. Guldemet Basal
e-mail: [email protected]
INTRODUCTION
Yarn manufacturing is becoming very competitiveday by day. The raw material cost about 50% to 70%of the manufacturing cost, since the cotton price isout of the control of the manufacturer tries to reducethe manufacturing cost [1, 2]. The emphasis is beingon the quality at cheaper manufacturing cost. Cottonyarn manufacturing is multistage process. One ofsuch stage is roving. Manufacturer try to use theheavier roving which results in higher production.However the heavier roving compel the manufactur-er to apply higher draft on the ring frame, which couldresult in the deterioration in the yarn quality [3]. Thereare no clear guidelines which indicate the right lineardensity of roving for certain yarn count. In this studyit was intended to investigate the effect of roving linerdensity on the quality parameters of yarns. The gen-eral guideline provided by Kumar et al. indicates themajor factors that influence the irregularity of fibrousmaterial during drafting on roving frame including;
irregularity in the feed material, unsatisfactory condi-tion of the drafting elements, faults in design anduneven fibre distribution of different lengths in crosssection [4, 5]. The irregular movement of fibresincreases with the draft also due to the difference inthe fibre length in the product cross section, thisirregular movement occurs at any draft although theirmagnitude increases with the increase in draft [6].However; at roving frame the irregularity added is rel-atively low and almost independent of draft [5].Balasubramanian determined the effect of rovingdensity on the relative variance of different yarn count[5]. The investigation was not focused on finding theoptimised values for producing a certain count. Threedifferent drafts for 1 hank roving and 2 drafts for 1.5hank rovings for one type of cotton were investigatedwhile using different varieties of cotton to produceyarn from 2, 4 and 6 Hank rovings [5]. It was con-cluded that 2 Nec hank roving is superior for produc-ing superior quality yarn in terms of relative varia-tions, however; the effect of roving density on IPI
435industria textila 2017, vol. 68, nr. 6˘
Effect of roving linear density on the quality parameters of 16 Nec100% cotton yarn
ABDUL WAQAR RAJPUT RANA AMJADUSMAN ALI SIDRA SALEEMIAMIR ABBAS
REZUMAT – ABSTRACT
Efectul densității lineare a semitortului asupra parametrilor de calitate ai firelor de bumbac 16 Nec
În acest studiu a fost prezentat efectul densității lineare a semitortului asupra firului de bumbac 16 Nec. Semitortul subformă de sculuri joacă un rol important în procesul de filare cu inele. Semitorturile mai grele duc la o producție mai mare,însă un semitort mai greu presupune o laminare mai mare pe mașina de filat cu inele, care ar putea avea ca rezultatdeteriorarea calității firelor. Pe de altă parte, un semitort mai ușor reduce producția și, prin urmare, duce la creștereacostului de producție. În acest studiu au fost prelucrate semitorturi cu diferite densități liniare în fire de 16 Nec. Au fosttestate și analizate indicele de uniformitate, indicele IPI și proprietățile de rezistență la întindere. S-au obținut cincisemitorturi cu densitate liniară de 0,82 Nec, 0,87 Nec, 0,92 Nec, 0,97 Nec și 1,02 Nec prin menținerea tuturorparametrilor la aceleași valori. Fire 16 Nec au fost produse prin utilizarea acestor semitorturi, iar parametrii de calitateau fost testați și analizați. Studiul a arătat că reducerea densității semitortului influențează pozitiv U% și IPI, însă, cutoate acestea nu au existat efecte semnificative de scădere a densității semitortului asupra proprietăților de rezistențăla tracțiune a firelor.
Cuvinte-cheie: semitort sub formă de sculuri, fire 16 Nec, calitatea firului, IPI, laminare
Effect of roving linear density on the quality parameters of 16 Nec 100% cotton yarn
In this study the effect of roving linear density on the 16 Nec cotton yarn was studied. Hank roving plays an importantrole in ring spinning process. Heavier roving results in higher production however heavier roving mean higher draft onthe subsequent ring spinning frame which could cause deterioration in the yarn quality. On the other hand lighter rovingreduces the production hence increases the process cost. In this study roving with different linear densities wereprocessed into the 16 Nec yarn. The uniformity index, IPI index and tensile properties were tested and analysed. Fiverovings with linear density of 0.82 Nec, 0.87 Nec, 0.92 Nec, 0.97 Nec and 1.02 Nec were produced by keeping all theparameters same. 16 Nec yarns were produced by utilising these rovings the quality parameters were tested andanalysed. The study showed that the reduction in the roving density positively influences the U % and IPI however therewere no significant effects of decrease in roving density on yarn tensile properties.
Keywords: hank roving, 16 Nec, yarn quality, IPI, draft
DOI: 10.35530/IT.068.06.1576
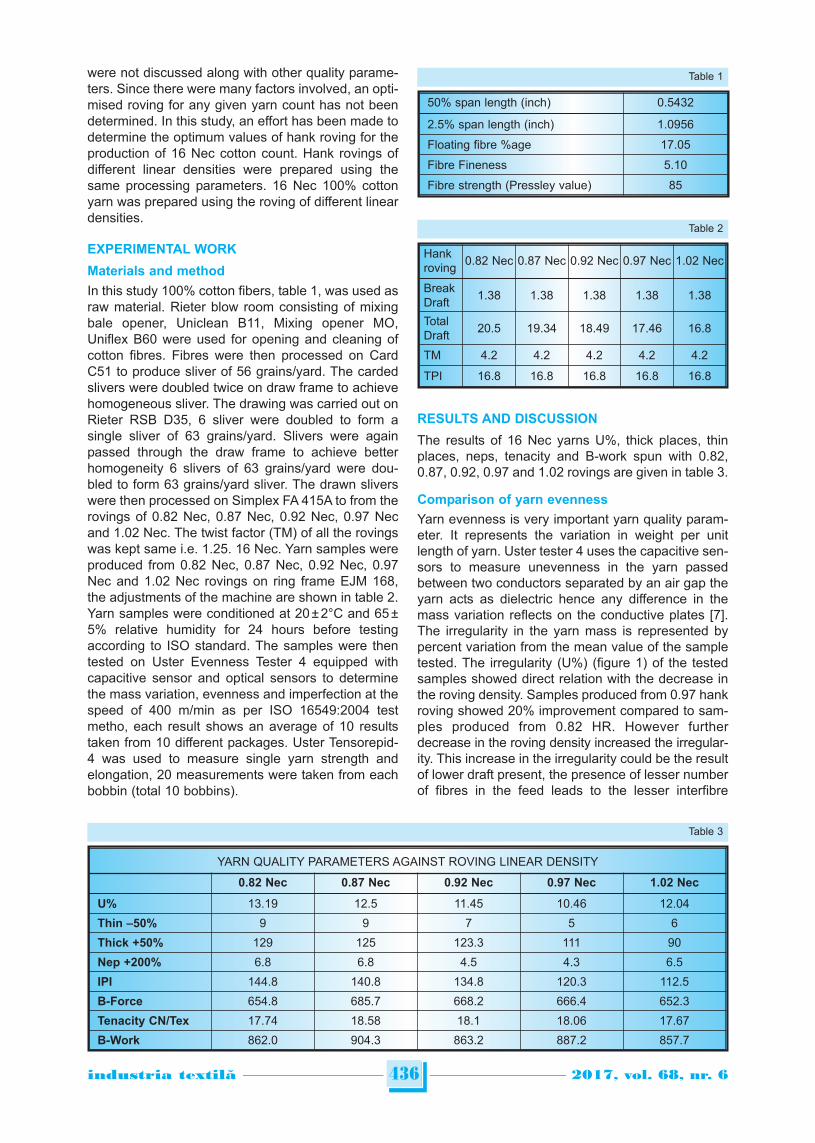
were not discussed along with other quality parame-ters. Since there were many factors involved, an opti-mised roving for any given yarn count has not beendetermined. In this study, an effort has been made todetermine the optimum values of hank roving for theproduction of 16 Nec cotton count. Hank rovings ofdifferent linear densities were prepared using thesame processing parameters. 16 Nec 100% cottonyarn was prepared using the roving of different lineardensities.
EXPERIMENTAL WORK
Materials and method
In this study 100% cotton fibers, table 1, was used asraw material. Rieter blow room consisting of mixingbale opener, Uniclean B11, Mixing opener MO,Uniflex B60 were used for opening and cleaning ofcotton fibres. Fibres were then processed on CardC51 to produce sliver of 56 grains/yard. The cardedslivers were doubled twice on draw frame to achievehomogeneous sliver. The drawing was carried out onRieter RSB D35, 6 sliver were doubled to form asingle sliver of 63 grains/yard. Slivers were againpassed through the draw frame to achieve betterhomogeneity 6 slivers of 63 grains/yard were dou-bled to form 63 grains/yard sliver. The drawn sliverswere then processed on Simplex FA 415A to from therovings of 0.82 Nec, 0.87 Nec, 0.92 Nec, 0.97 Necand 1.02 Nec. The twist factor (TM) of all the rovingswas kept same i.e. 1.25. 16 Nec. Yarn samples wereproduced from 0.82 Nec, 0.87 Nec, 0.92 Nec, 0.97Nec and 1.02 Nec rovings on ring frame EJM 168,the adjustments of the machine are shown in table 2. Yarn samples were conditioned at 20 ± 2°C and 65 ±5% relative humidity for 24 hours before testingaccording to ISO standard. The samples were thentested on Uster Evenness Tester 4 equipped withcapacitive sensor and optical sensors to determinethe mass variation, evenness and imperfection at thespeed of 400 m/min as per ISO 16549:2004 testmetho, each result shows an average of 10 resultstaken from 10 different packages. Uster Tensorepid-4 was used to measure single yarn strength andelongation, 20 measurements were taken from eachbobbin (total 10 bobbins).
RESULTS AND DISCUSSION
The results of 16 Nec yarns U%, thick places, thinplaces, neps, tenacity and B-work spun with 0.82,0.87, 0.92, 0.97 and 1.02 rovings are given in table 3.
Comparison of yarn evenness
Yarn evenness is very important yarn quality param-eter. It represents the variation in weight per unitlength of yarn. Uster tester 4 uses the capacitive sen-sors to measure unevenness in the yarn passedbetween two conductors separated by an air gap theyarn acts as dielectric hence any difference in themass variation reflects on the conductive plates [7].The irregularity in the yarn mass is represented bypercent variation from the mean value of the sampletested. The irregularity (U%) (figure 1) of the testedsamples showed direct relation with the decrease inthe roving density. Samples produced from 0.97 hankroving showed 20% improvement compared to sam-ples produced from 0.82 HR. However furtherdecrease in the roving density increased the irregular -ity. This increase in the irregularity could be the resultof lower draft present, the presence of lesser numberof fibres in the feed leads to the lesser interfibre
436industria textila 2017, vol. 68, nr. 6˘
YARN QUALITY PARAMETERS AGAINST ROVING LINEAR DENSITY
0.82 Nec 0.87 Nec 0.92 Nec 0.97 Nec 1.02 Nec
U% 13.19 12.5 11.45 10.46 12.04
Thin –50% 9 9 7 5 6
Thick +50% 129 125 123.3 111 90
Nep +200% 6.8 6.8 4.5 4.3 6.5
IPI 144.8 140.8 134.8 120.3 112.5
B-Force 654.8 685.7 668.2 666.4 652.3
Tenacity CN/Tex 17.74 18.58 18.1 18.06 17.67
B-Work 862.0 904.3 863.2 887.2 857.7
Table 3
50% span length (inch) 0.5432
2.5% span length (inch) 1.0956
Floating fibre %age 17.05
Fibre Fineness 5.10
Fibre strength (Pressley value) 85
Table 1
Hankroving
0.82 Nec 0.87 Nec 0.92 Nec 0.97 Nec 1.02 Nec
BreakDraft
1.38 1.38 1.38 1.38 1.38
TotalDraft
20.5 19.34 18.49 17.46 16.8
TM 4.2 4.2 4.2 4.2 4.2
TPI 16.8 16.8 16.8 16.8 16.8
Table 2
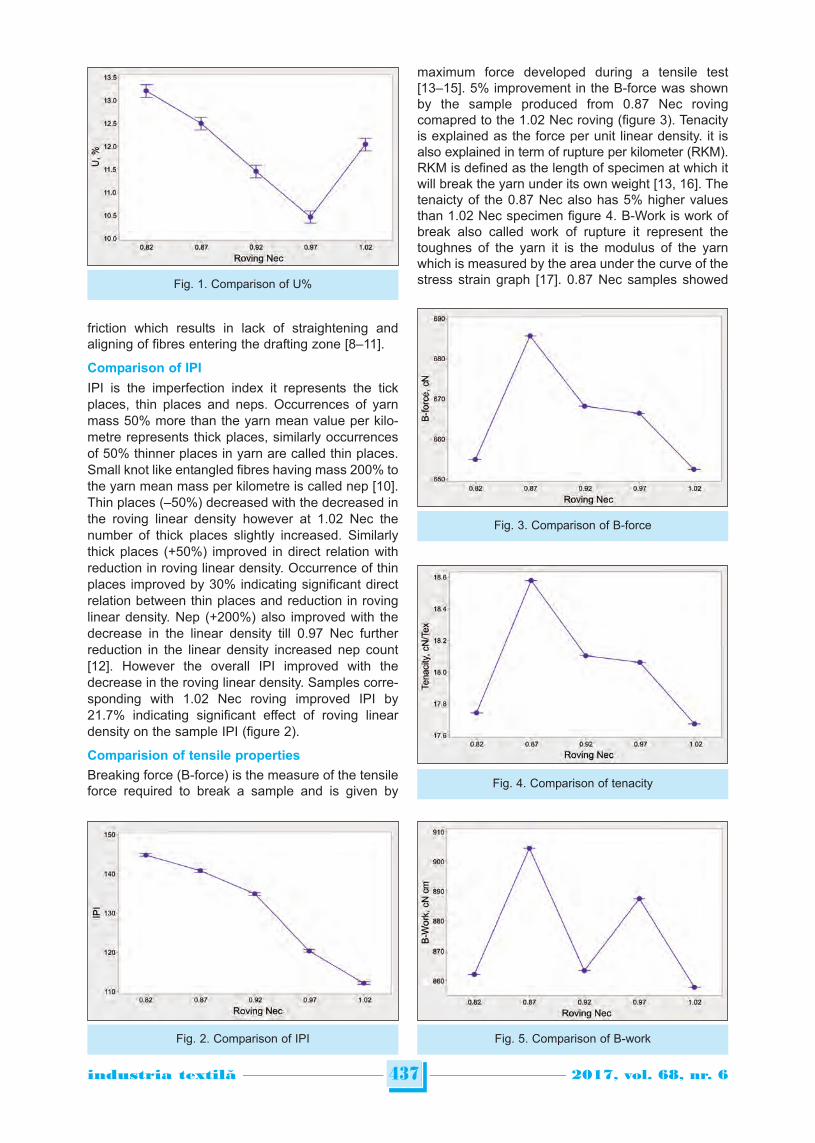
friction which results in lack of straightening andaligning of fibres entering the drafting zone [8–11].
Comparison of IPI
IPI is the imperfection index it represents the tickplaces, thin places and neps. Occurrences of yarnmass 50% more than the yarn mean value per kilo-metre represents thick places, similarly occurrencesof 50% thinner places in yarn are called thin places.Small knot like entangled fibres having mass 200% tothe yarn mean mass per kilometre is called nep [10].Thin places (–50%) decreased with the decreased inthe roving linear density however at 1.02 Nec thenumber of thick places slightly increased. Similarlythick places (+50%) improved in direct relation withreduction in roving linear density. Occurrence of thinplaces improved by 30% indicating significant directrelation between thin places and reduction in rovinglinear density. Nep (+200%) also improved with thedecrease in the linear density till 0.97 Nec furtherreduction in the linear density increased nep count[12]. However the overall IPI improved with thedecrease in the roving linear density. Samples corre-sponding with 1.02 Nec roving improved IPI by21.7% indicating significant effect of roving lineardensity on the sample IPI (figure 2).
Comparision of tensile properties
Breaking force (B-force) is the measure of the tensileforce required to break a sample and is given by
maximum force developed during a tensile test[13–15]. 5% improvement in the B-force was shownby the sample produced from 0.87 Nec rovingcomapred to the 1.02 Nec roving (figure 3). Tenacityis explained as the force per unit linear density. it isalso explained in term of rupture per kilometer (RKM).RKM is defined as the length of specimen at which itwill break the yarn under its own weight [13, 16]. Thetenaicty of the 0.87 Nec also has 5% higher valuesthan 1.02 Nec specimen figure 4. B-Work is work ofbreak also called work of rupture it represent thetoughnes of the yarn it is the modulus of the yarnwhich is measured by the area under the curve of thestress strain graph [17]. 0.87 Nec samples showed
437industria textila 2017, vol. 68, nr. 6˘
Fig. 1. Comparison of U%
Fig. 3. Comparison of B-force
Fig. 4. Comparison of tenacity
Fig. 5. Comparison of B-workFig. 2. Comparison of IPI
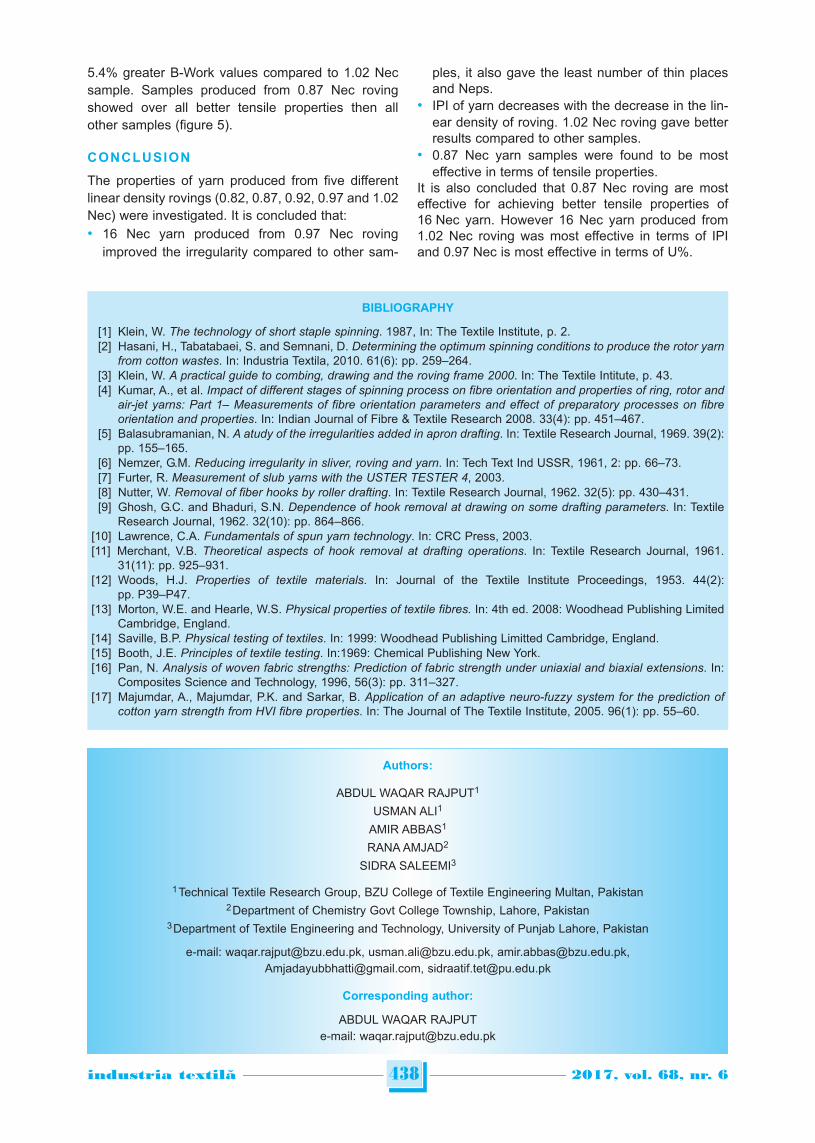
5.4% greater B-Work values compared to 1.02 Necsample. Samples produced from 0.87 Nec rovingshowed over all better tensile properties then allother samples (figure 5).
CONCLUSION
The properties of yarn produced from five differentlinear density rovings (0.82, 0.87, 0.92, 0.97 and 1.02Nec) were investigated. It is concluded that:• 16 Nec yarn produced from 0.97 Nec roving
improved the irregularity compared to other sam-
ples, it also gave the least number of thin placesand Neps.
• IPI of yarn decreases with the decrease in the lin-ear density of roving. 1.02 Nec roving gave betterresults compared to other samples.
• 0.87 Nec yarn samples were found to be mosteffective in terms of tensile properties.
It is also concluded that 0.87 Nec roving are mosteffective for achieving better tensile properties of16 Nec yarn. However 16 Nec yarn produced from1.02 Nec roving was most effective in terms of IPIand 0.97 Nec is most effective in terms of U%.
438industria textila 2017, vol. 68, nr. 6˘
BIBLIOGRAPHY
[1] Klein, W. The technology of short staple spinning. 1987, In: The Textile Institute, p. 2.[2] Hasani, H., Tabatabaei, S. and Semnani, D. Determining the optimum spinning conditions to produce the rotor yarn
from cotton wastes. In: Industria Textila, 2010. 61(6): pp. 259–264.[3] Klein, W. A practical guide to combing, drawing and the roving frame 2000. In: The Textile Intitute, p. 43.[4] Kumar, A., et al. Impact of different stages of spinning process on fibre orientation and properties of ring, rotor and
air-jet yarns: Part 1– Measurements of fibre orientation parameters and effect of preparatory processes on fibreorientation and properties. In: Indian Journal of Fibre & Textile Research 2008. 33(4): pp. 451–467.
[5] Balasubramanian, N. A atudy of the irregularities added in apron drafting. In: Textile Research Journal, 1969. 39(2):pp. 155–165.
[6] Nemzer, G.M. Reducing irregularity in sliver, roving and yarn. In: Tech Text Ind USSR, 1961, 2: pp. 66–73.[7] Furter, R. Measurement of slub yarns with the USTER TESTER 4, 2003.[8] Nutter, W. Removal of fiber hooks by roller drafting. In: Textile Research Journal, 1962. 32(5): pp. 430–431.[9] Ghosh, G.C. and Bhaduri, S.N. Dependence of hook removal at drawing on some drafting parameters. In: Textile
Research Journal, 1962. 32(10): pp. 864–866.[10] Lawrence, C.A. Fundamentals of spun yarn technology. In: CRC Press, 2003.[11] Merchant, V.B. Theoretical aspects of hook removal at drafting operations. In: Textile Research Journal, 1961.
31(11): pp. 925–931.[12] Woods, H.J. Properties of textile materials. In: Journal of the Textile Institute Proceedings, 1953. 44(2):
pp. P39–P47.[13] Morton, W.E. and Hearle, W.S. Physical properties of textile fibres. In: 4th ed. 2008: Woodhead Publishing Limited
Cambridge, England.[14] Saville, B.P. Physical testing of textiles. In: 1999: Woodhead Publishing Limitted Cambridge, England.[15] Booth, J.E. Principles of textile testing. In:1969: Chemical Publishing New York.[16] Pan, N. Analysis of woven fabric strengths: Prediction of fabric strength under uniaxial and biaxial extensions. In:
Composites Science and Technology, 1996, 56(3): pp. 311–327.[17] Majumdar, A., Majumdar, P.K. and Sarkar, B. Application of an adaptive neuro-fuzzy system for the prediction of
cotton yarn strength from HVI fibre properties. In: The Journal of The Textile Institute, 2005. 96(1): pp. 55–60.
Authors:
ABDUL WAQAR RAJPUT1
USMAN ALI1
AMIR ABBAS1
RANA AMJAD2
SIDRA SALEEMI3
1 Technical Textile Research Group, BZU College of Textile Engineering Multan, Pakistan2 Department of Chemistry Govt College Township, Lahore, Pakistan
3 Department of Textile Engineering and Technology, University of Punjab Lahore, Pakistan
e-mail: [email protected], [email protected], [email protected],[email protected], [email protected]
Corresponding author:
ABDUL WAQAR RAJPUTe-mail: [email protected]
INTRODUCTION
Noise is a risk factor that has harmful effects on thehuman body, depending on the level of intensitynoise, spectral component, duration and distributionof noise exposure during a working day, the total life-time exposure [5]. The action may lead to harmfulnoise: auditory organ disorders; disorders of variousorgans and body apparatuses; reduce labor produc-tivity; reduce the intelligibility of speech [6]. Dailynoise exposure limit at work is 87 dB(A).For a sustainable development of the automotiveindustry, in this case – textile industry, it is necessaryto pursue a solution in support of a better life, byremoving textile waste, which returned to a specificmanufacturing process becomes plates textiles andaims to obtain laminated composite materials withthis textiles plates, used to encapsulate industrialnoise sources and so to obtain noise reduction towork [1–4].Have been studied textile plates made of recoveredtextile fiber (woolen and synthetic fibers), in terms ofabsorbing properties [1–3].
PRESENTATION OF THE MEASURING SYSTEMAND THE TYPES OF MATERIALS
For the experiment there were necessary: Readingimpedance tube type 4206 A, Brüel & Kjaer 2 micro-phones, type 4187 (figure 1); a signal generator; apower amplifier type 2716-C; PULSE acquisition sys-tem with 5 channels and a PC with software controland data acquisition PULSE v12,5. Specialized soft-ware license: PULSE, Acoustic testing material in thetube, type 7758 is used to determine the acousticcharacteristics of materials. Acoustic measurementsare made in the frequency 100 Hz ÷ 3.2 kHz [23, 24].Reading impedance tube type 4206 has 2 micro-phones so that they can measure the sound absorp-tion coefficient, reflectivity acoustic impedance ratioin the ranges given above (100 Hz and 3.2 kHz). Themeasurement method is in accordance with standardEN ISO 10534-2 which states the conditions for usingacoustic interferometer (Kundt tube) [23].Out the measurements: atmospheric pressure –1035.00 hPa, temperature – 28.00 °C, relative humid-ity – 46.00 %, sound speed – 347.89 m/s, air density– 1195 kg/m3, air characteristic impedance: 415.8Pa/(m/s).
439industria textila 2017, vol. 68, nr. 6˘
Analysis on the influence of the use of recovered textiles on the acousticproperties of composite materials
IULIANA IAŞNICU (STAMATE) VIVIANA FILIPGHEORGHIŢA TOMESCU SIMONA MIHAIOVIDIU VASILE
REZUMAT – ABSTRACT
Analiza influenței utilizării materialelor textile recuperate asupra proprietăților acusticeale materialelor compozite
Prezenta lucrare contribuie cu soluţii de valorificare a unor deşeuri textile în reducerea zgomotului la locul de muncă.Reducerea nivelului de zgomot din secţiile de producţie se poate face şi prin carcasarea sursei de zgomot, în principala motorului şi a transmisiilor către organele de lucru, cu plăci de materiale în structură simplă sau în structură compozită.Prin testarea mai multor tipuri de plăci stratificate din materiale compozite, conţinând un strat din deşeuri textile, s-austabilit valorile coeficienţilor de absorbţie fonică, s-a determinat nivelul presiunii acustice și a factorului de directivitatepentru zgomotul de fond și eficienţa acestor materiale ca izolatoare fonice.Utilizarea materialelor compozite stratificate studiate, în domeniul reducerii zgomotului industrial, ca factor de riscimportant, ajută la îndeplinirea cerinţelor de protecţie a mediului (prin reutilizarea deşeurilor textile) şi a omului (prinreducerea nivelului de zgomot în clădirile industriale).
Cuvinte-cheie: plăci din materiale textile recuperate, proprietăţi fonoabsorbante
Analysis on the influence of the use of recovered textiles on the acoustic properties of composite materials
This paper comes to bring ways of harnessing the noise reduction properties of textile waste in the workplace. Noisereduction from the production sections can be achieved by encapsulating the noise source, mainly the engine andtransmission to the components of work using plates of material in simple structure or composite structure.By testing multiple types of composite laminated plates containing a layer of textile waste, sound absorption coefficientvalues, determination of sound power and directivity characteristic full sound sources and effectiveness of thesematerials as soundproofing were established.Using these studied layered composite materials in the field of industrial noise reduction, as an important risk factor,helps to meet the requirements of environmental protection (by reusing waste textiles) and human protection (byreducing noise in industrial halls).
Keywords: recovered textile fiber plate, sound-absorbing properties
DOI: 10.35530/IT.068.06.1463
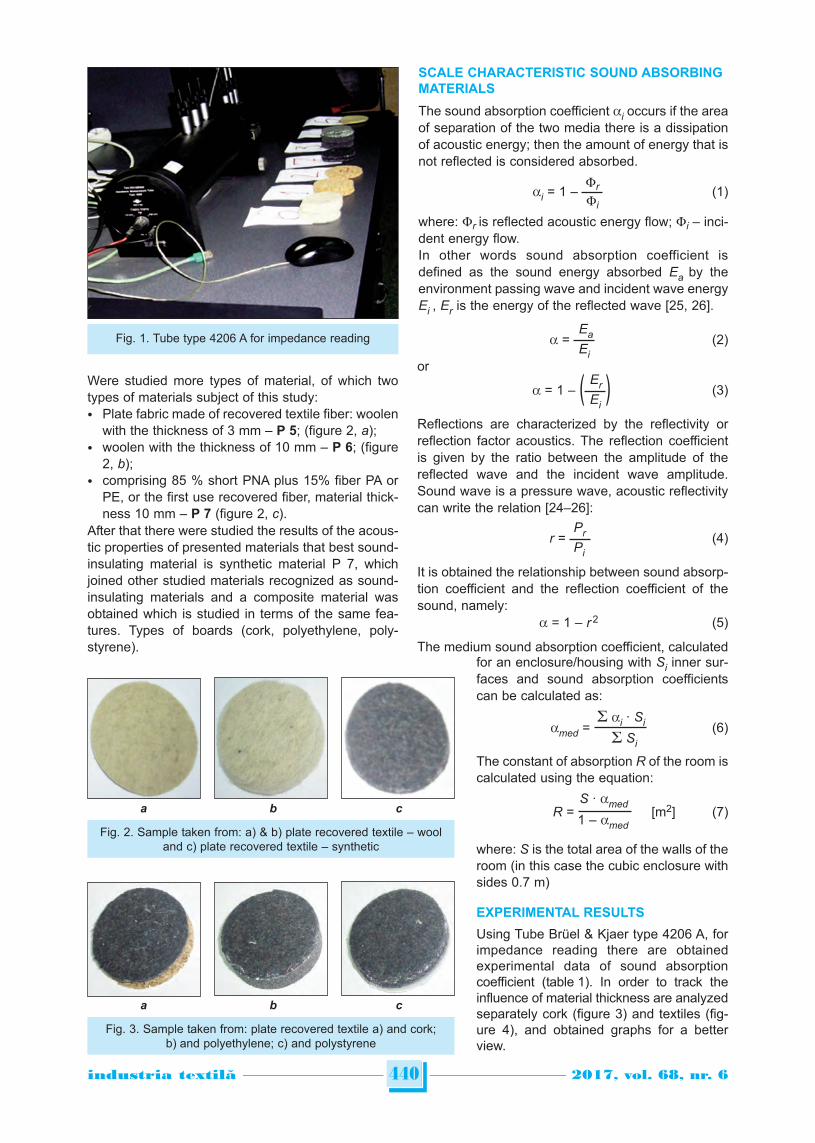
Were studied more types of material, of which twotypes of materials subject of this study:• Plate fabric made of recovered textile fiber: woolen
with the thickness of 3 mm – P 5; (figure 2, a);• woolen with the thickness of 10 mm – P 6; (figure
2, b);• comprising 85 % short PNA plus 15% fiber PA or
PE, or the first use recovered fiber, material thick-ness 10 mm – P 7 (figure 2, c).
After that there were studied the results of the acous-tic properties of presented materials that best sound-insulating material is synthetic material P 7, whichjoined other studied materials recognized as sound-insulating materials and a composite material wasobtained which is studied in terms of the same fea-tures. Types of boards (cork, polyethylene, poly -styrene).
SCALE CHARACTERISTIC SOUND ABSORBINGMATERIALS
The sound absorption coefficient ai occurs if the areaof separation of the two media there is a dissipationof acoustic energy; then the amount of energy that isnot reflected is considered absorbed.
rai = 1 – (1)
i
where: r is reflected acoustic energy flow; i – inci-dent energy flow.In other words sound absorption coefficient isdefined as the sound energy absorbed Ea by theenvironment passing wave and incident wave energyEi , Er is the energy of the reflected wave [25, 26].
Eaa = (2)
Eior
Era = 1 – ( ) (3)
Ei
Reflections are characterized by the reflectivity orreflection factor acoustics. The reflection coefficientis given by the ratio between the amplitude of thereflected wave and the incident wave amplitude.Sound wave is a pressure wave, acoustic reflectivitycan write the relation [24–26]:
Prr = (4)Pi
It is obtained the relationship between sound absorp-tion coefficient and the reflection coefficient of thesound, namely:
a = 1 – r 2 (5)
The medium sound absorption coefficient, calculated
440industria textila 2017, vol. 68, nr. 6˘
Fig. 1. Tube type 4206 A for impedance reading
Fig. 2. Sample taken from: a) & b) plate recovered textile – wooland c) plate recovered textile – synthetic
a b c
Fig. 3. Sample taken from: plate recovered textile a) and cork;b) and polyethylene; c) and polystyrene
a b c
for an enclosure/housing with Si inner sur-faces and sound absorption coefficientscan be calculated as:
ai · Siamed = (6)
Si
The constant of absorption R of the room iscalculated using the equation:
S · amedR = [m2] (7)
1 – amed
where: S is the total area of the walls of theroom (in this case the cubic enclosure withsides 0.7 m)
EXPERIMENTAL RESULTS
Using Tube Brüel & Kjaer type 4206 A, forimpedance reading there are obtainedexperimental data of sound absorptioncoefficient (table 1). In order to track theinfluence of material thickness are analyzedseparately cork (figure 3) and textiles (fig-ure 4), and obtained graphs for a betterview.
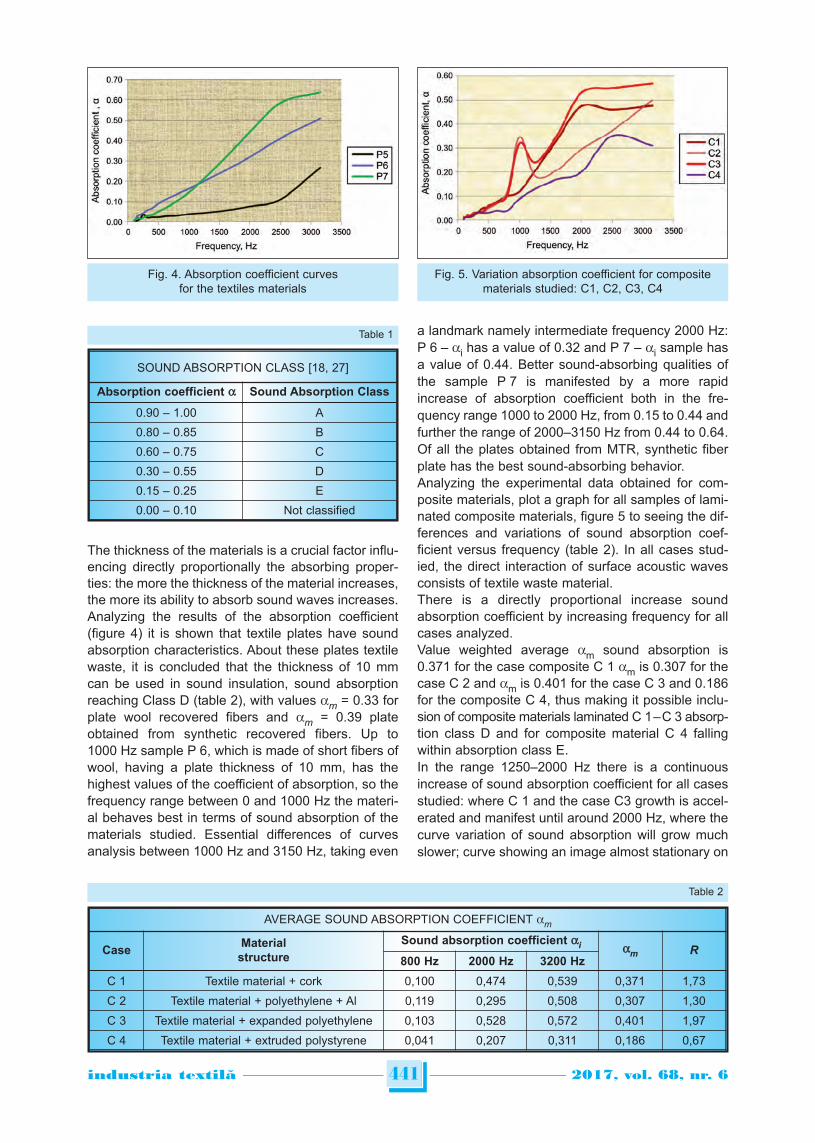
The thickness of the materials is a crucial factor influ-encing directly proportionally the absorbing proper-ties: the more the thickness of the material increases,the more its ability to absorb sound waves increases.Analyzing the results of the absorption coefficient(figure 4) it is shown that textile plates have soundabsorption characteristics. About these plates textilewaste, it is concluded that the thickness of 10 mmcan be used in sound insulation, sound absorptionreaching Class D (table 2), with values am = 0.33 forplate wool recovered fibers and am = 0.39 plateobtained from synthetic recovered fibers. Up to1000 Hz sample P 6, which is made of short fibers ofwool, having a plate thickness of 10 mm, has thehighest values of the coefficient of absorption, so thefrequency range between 0 and 1000 Hz the materi-al behaves best in terms of sound absorption of thematerials studied. Essential differences of curvesanalysis between 1000 Hz and 3150 Hz, taking even
a landmark namely intermediate frequency 2000 Hz:P 6 – ai has a value of 0.32 and P 7 – ai sample hasa value of 0.44. Better sound-absorbing qualities ofthe sample P 7 is manifested by a more rapidincrease of absorption coefficient both in the fre-quency range 1000 to 2000 Hz, from 0.15 to 0.44 andfurther the range of 2000–3150 Hz from 0.44 to 0.64.Of all the plates obtained from MTR, synthetic fiberplate has the best sound-absorbing behavior.Analyzing the experimental data obtained for com-posite materials, plot a graph for all samples of lami-nated composite materials, figure 5 to seeing the dif-ferences and variations of sound absorption coef-ficient versus frequency (table 2). In all cases stud-ied, the direct interaction of surface acoustic wavesconsists of textile waste material.There is a directly proportional increase soundabsorption coefficient by increasing frequency for allcases analyzed.Value weighted average am sound absorption is0.371 for the case composite C 1 am is 0.307 for thecase C 2 and am is 0.401 for the case C 3 and 0.186for the composite C 4, thus making it possible inclu-sion of composite materials laminated C 1 – C 3 absorp-tion class D and for composite material C 4 fallingwithin absorption class E.In the range 1250–2000 Hz there is a continuousincrease of sound absorption coefficient for all casesstudied: where C 1 and the case C3 growth is accel-erated and manifest until around 2000 Hz, where thecurve variation of sound absorption will grow muchslower; curve showing an image almost stationary on
441industria textila 2017, vol. 68, nr. 6˘
Fig. 4. Absorption coefficient curvesfor the textiles materials
Fig. 5. Variation absorption coefficient for compositematerials studied: C1, C2, C3, C4
SOUND ABSORPTION CLASS [18, 27]
Absorption coefficient a Sound Absorption Class
0.90 – 1.00 A
0.80 – 0.85 B
0.60 – 0.75 C
0.30 – 0.55 D
0.15 – 0.25 E
0.00 – 0.10 Not classified
Table 1
AVERAGE SOUND ABSORPTION COEFFICIENT am
CaseMaterialstructure
Sound absorption coefficient ai am R
800 Hz 2000 Hz 3200 Hz
C 1 Textile material + cork 0,100 0,474 0,539 0,371 1,73
C 2 Textile material + polyethylene + Al 0,119 0,295 0,508 0,307 1,30
C 3 Textile material + expanded polyethylene 0,103 0,528 0,572 0,401 1,97
C 4 Textile material + extruded polystyrene 0,041 0,207 0,311 0,186 0,67
Table 2
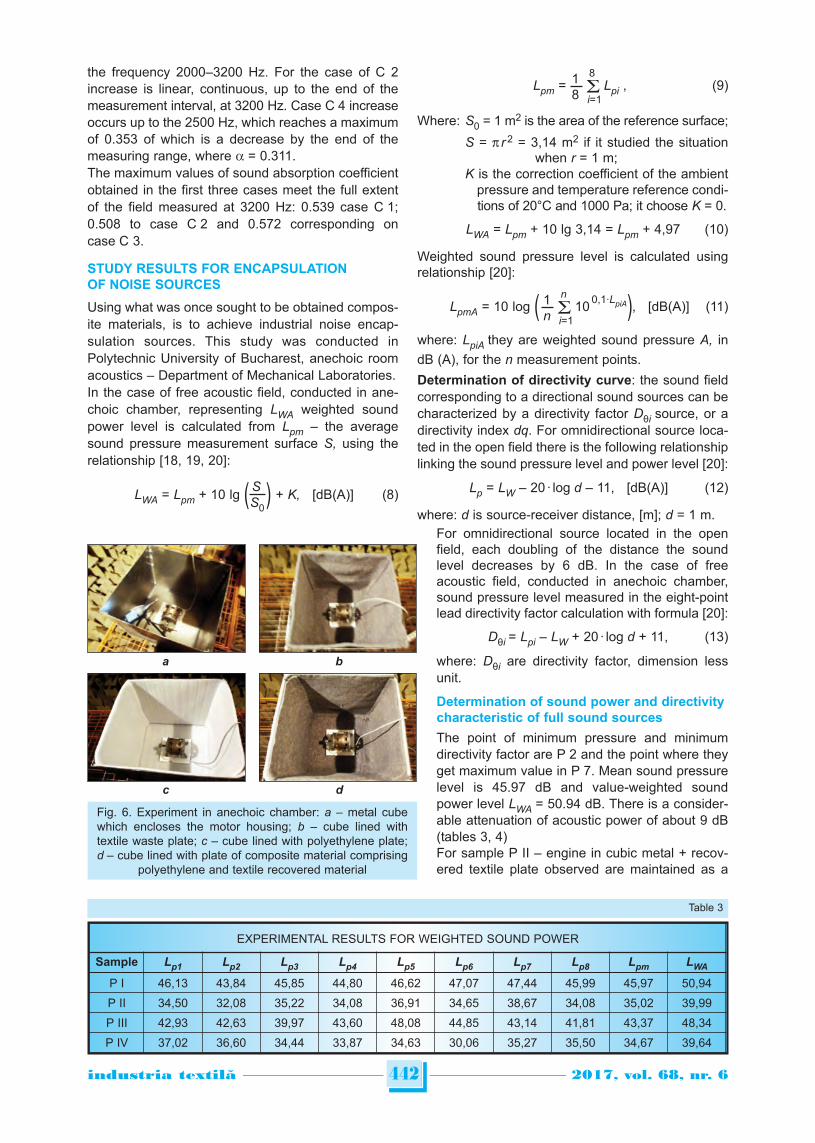
the frequency 2000–3200 Hz. For the case of C 2increase is linear, continuous, up to the end of themeasurement interval, at 3200 Hz. Case C 4 increaseoccurs up to the 2500 Hz, which reaches a maximumof 0.353 of which is a decrease by the end of themeasuring range, where a = 0.311.The maximum values of sound absorption coefficientobtained in the first three cases meet the full extentof the field measured at 3200 Hz: 0.539 case C 1;0.508 to case C 2 and 0.572 corresponding oncase C 3.
STUDY RESULTS FOR ENCAPSULATIONOF NOISE SOURCES
Using what was once sought to be obtained compos-ite materials, is to achieve industrial noise encap-sulation sources. This study was conducted inPolytechnic University of Bucharest, anechoic roomacoustics – Department of Mechanical Laboratories.In the case of free acoustic field, conducted in ane-choic chamber, representing LWA weighted soundpower level is calculated from Lpm – the averagesound pressure measurement surface S, using therelationship [18, 19, 20]:
SLWA = Lpm + 10 lg ( ) + K, [dB(A)] (8)
S0
1 8Lpm = Lpi , (9)
8 i=1
Where: S0 = 1 m2 is the area of the reference surface;
S = p r 2 = 3,14 m2 if it studied the situationwhen r = 1 m;
K is the correction coefficient of the ambientpressure and temperature reference condi-tions of 20°C and 1000 Pa; it choose K = 0.
LWA = Lpm + 10 lg 3,14 = Lpm + 4,97 (10)
Weighted sound pressure level is calculated usingrelationship [20]:
1 nLpmA = 10 log ( 10
0,1·LpiA), [dB(A)] (11)n i=1
where: LpiA they are weighted sound pressure A, in
dB (A), for the n measurement points.
Determination of directivity curve: the sound fieldcorresponding to a directional sound sources can becharacterized by a directivity factor Dθi source, or adirectivity index dq. For omnidirectional source loca-ted in the open field there is the following relationshiplinking the sound pressure level and power level [20]:
Lp = LW – 20 · log d – 11, [dB(A)] (12)
where: d is source-receiver distance, [m]; d = 1 m.
442industria textila 2017, vol. 68, nr. 6˘
Fig. 6. Experiment in anechoic chamber: a – metal cubewhich encloses the motor housing; b – cube lined withtextile waste plate; c – cube lined with polyethylene plate;d – cube lined with plate of composite material comprising
polyethylene and textile recovered material
c d
a b
EXPERIMENTAL RESULTS FOR WEIGHTED SOUND POWER
Sample Lp1 Lp2 Lp3 Lp4 Lp5 Lp6 Lp7 Lp8 Lpm LWA
P I 46,13 43,84 45,85 44,80 46,62 47,07 47,44 45,99 45,97 50,94
P II 34,50 32,08 35,22 34,08 36,91 34,65 38,67 34,08 35,02 39,99
P III 42,93 42,63 39,97 43,60 48,08 44,85 43,14 41,81 43,37 48,34
P IV 37,02 36,60 34,44 33,87 34,63 30,06 35,27 35,50 34,67 39,64
Table 3
For omnidirectional source located in the openfield, each doubling of the distance the soundlevel decreases by 6 dB. In the case of freeacoustic field, conducted in anechoic chamber,sound pressure level measured in the eight-pointlead directivity factor calculation with formula [20]:
Dθi = Lpi – LW + 20 · log d + 11, (13)
where: Dθi are directivity factor, dimension lessunit.
Determination of sound power and directivitycharacteristic of full sound sources
The point of minimum pressure and minimumdirectivity factor are P 2 and the point where theyget maximum value in P 7. Mean sound pressurelevel is 45.97 dB and value-weighted soundpower level LWA = 50.94 dB. There is a consider-able attenuation of acoustic power of about 9 dB(tables 3, 4)For sample P II – engine in cubic metal + recov-ered textile plate observed are maintained as a
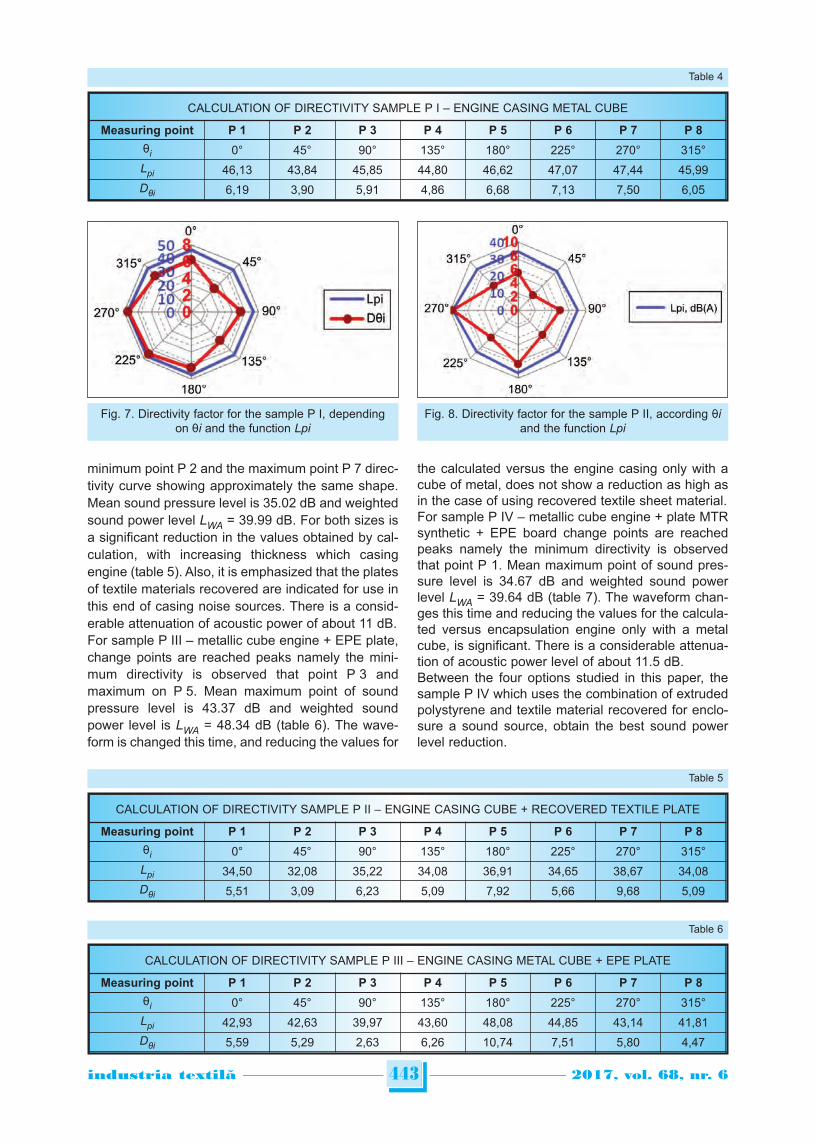
minimum point P 2 and the maximum point P 7 direc-tivity curve showing approximately the same shape.Mean sound pressure level is 35.02 dB and weightedsound power level LWA = 39.99 dB. For both sizes isa significant reduction in the values obtained by cal-culation, with increasing thickness which casingengine (table 5). Also, it is emphasized that the platesof textile materials recovered are indicated for use inthis end of casing noise sources. There is a consid-erable attenuation of acoustic power of about 11 dB.For sample P III – metallic cube engine + EPE plate,change points are reached peaks namely the mini-mum directivity is observed that point P 3 andmaximum on P 5. Mean maximum point of soundpressure level is 43.37 dB and weighted soundpower level is LWA = 48.34 dB (table 6). The wave-form is changed this time, and reducing the values for
the calculated versus the engine casing only with acube of metal, does not show a reduction as high asin the case of using recovered textile sheet material.For sample P IV – metallic cube engine + plate MTRsynthetic + EPE board change points are reachedpeaks namely the minimum directivity is observedthat point P 1. Mean maximum point of sound pres-sure level is 34.67 dB and weighted sound powerlevel LWA = 39.64 dB (table 7). The waveform chan-ges this time and reducing the values for the calcula-ted versus encapsulation engine only with a metalcube, is significant. There is a considerable attenua-tion of acoustic power level of about 11.5 dB. Between the four options studied in this paper, thesample P IV which uses the combination of extrudedpolystyrene and textile material recovered for enclo-sure a sound source, obtain the best sound powerlevel reduction.
443industria textila 2017, vol. 68, nr. 6˘
CALCULATION OF DIRECTIVITY SAMPLE P I – ENGINE CASING METAL CUBE
Measuring point P 1 P 2 P 3 P 4 P 5 P 6 P 7 P 8
θi 0° 45° 90° 135° 180° 225° 270° 315°
Lpi 46,13 43,84 45,85 44,80 46,62 47,07 47,44 45,99
Dθi 6,19 3,90 5,91 4,86 6,68 7,13 7,50 6,05
Table 4
Fig. 7. Directivity factor for the sample P I, dependingon θi and the function Lpi
Fig. 8. Directivity factor for the sample P II, according θiand the function Lpi
CALCULATION OF DIRECTIVITY SAMPLE P II – ENGINE CASING CUBE + RECOVERED TEXTILE PLATE
Measuring point P 1 P 2 P 3 P 4 P 5 P 6 P 7 P 8
θi 0° 45° 90° 135° 180° 225° 270° 315°
Lpi 34,50 32,08 35,22 34,08 36,91 34,65 38,67 34,08
Dθi 5,51 3,09 6,23 5,09 7,92 5,66 9,68 5,09
Table 5
CALCULATION OF DIRECTIVITY SAMPLE P III – ENGINE CASING METAL CUBE + EPE PLATE
Measuring point P 1 P 2 P 3 P 4 P 5 P 6 P 7 P 8
θi 0° 45° 90° 135° 180° 225° 270° 315°
Lpi 42,93 42,63 39,97 43,60 48,08 44,85 43,14 41,81
Dθi 5,59 5,29 2,63 6,26 10,74 7,51 5,80 4,47
Table 6
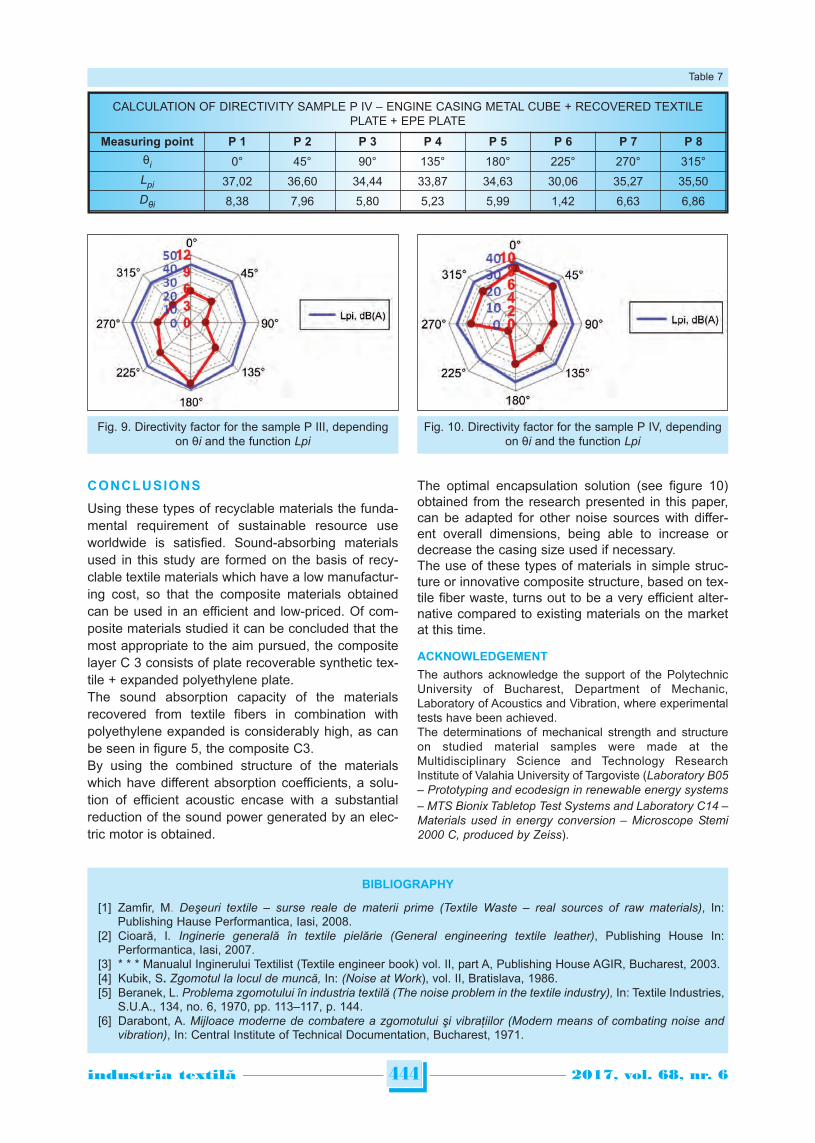
CONCLUSIONS
Using these types of recyclable materials the funda-mental requirement of sustainable resource useworldwide is satisfied. Sound-absorbing materialsused in this study are formed on the basis of recy-clable textile materials which have a low manufactur-ing cost, so that the composite materials obtainedcan be used in an efficient and low-priced. Of com-posite materials studied it can be concluded that themost appropriate to the aim pursued, the compositelayer C 3 consists of plate recoverable synthetic tex-tile + expanded polyethylene plate.The sound absorption capacity of the materialsrecovered from textile fibers in combination withpolyethylene expanded is considerably high, as canbe seen in figure 5, the composite C3.By using the combined structure of the materialswhich have different absorption coefficients, a solu-tion of efficient acoustic encase with a substantialreduction of the sound power generated by an elec-tric motor is obtained.
The optimal encapsulation solution (see figure 10)obtained from the research presented in this paper,can be adapted for other noise sources with differ-ent overall dimensions, being able to increase ordecrease the casing size used if necessary. The use of these types of materials in simple struc-ture or innovative composite structure, based on tex-tile fiber waste, turns out to be a very efficient alter-native compared to existing materials on the marketat this time.
ACKNOWLEDGEMENT
The authors acknowledge the support of the PolytechnicUniversity of Bucharest, Department of Mechanic,Laboratory of Acoustics and Vibration, where experimentaltests have been achieved.The determinations of mechanical strength and structureon studied material samples were made at theMultidisciplinary Science and Technology ResearchInstitute of Valahia University of Targoviste (Laboratory B05– Prototyping and ecodesign in renewable energy systems– MTS Bionix Tabletop Test Systems and Laboratory C14 –Materials used in energy conversion – Microscope Stemi2000 C, produced by Zeiss).
444industria textila 2017, vol. 68, nr. 6˘
CALCULATION OF DIRECTIVITY SAMPLE P IV – ENGINE CASING METAL CUBE + RECOVERED TEXTILEPLATE + EPE PLATE
Measuring point P 1 P 2 P 3 P 4 P 5 P 6 P 7 P 8
θi 0° 45° 90° 135° 180° 225° 270° 315°
Lpi 37,02 36,60 34,44 33,87 34,63 30,06 35,27 35,50
Dθi 8,38 7,96 5,80 5,23 5,99 1,42 6,63 6,86
Table 7
Fig. 9. Directivity factor for the sample P III, dependingon θi and the function Lpi
Fig. 10. Directivity factor for the sample P IV, dependingon θi and the function Lpi
BIBLIOGRAPHY
[1] Zamfir, M. Deşeuri textile – surse reale de materii prime (Textile Waste – real sources of raw materials), In:Publishing Hause Performantica, Iasi, 2008.
[2] Cioară, I. Inginerie generală în textile pielărie (General engineering textile leather), Publishing House In:Performantica, Iasi, 2007.
[3] * * * Manualul Inginerului Textilist (Textile engineer book) vol. II, part A, Publishing House AGIR, Bucharest, 2003.[4] Kubik, S. Zgomotul la locul de muncă, In: (Noise at Work), vol. II, Bratislava, 1986.[5] Beranek, L. Problema zgomotului în industria textilă (The noise problem in the textile industry), In: Textile Industries,
S.U.A., 134, no. 6, 1970, pp. 113–117, p. 144.[6] Darabont, A. Mijloace moderne de combatere a zgomotului şi vibraţiilor (Modern means of combating noise and
vibration), In: Central Institute of Technical Documentation, Bucharest, 1971.
445industria textila 2017, vol. 68, nr. 6˘
[7] Hadăr, A. Structuri din compozite stratificate (Stratified Composite Structures), In: Publishing House AGIR,Bucharest, 2002.
[8] Alămoreanu, E., Constantinescu, D. M. Proiectarea placilor compozite laminate (The design of laminated compositeplates), In: Publishing House Academiei Române, Bucuresti, 2005.
[9] Stamate I., Materiale compozite stratificate cu conţinut textil (Composite laminated materials containing textile),In: Publishing House Aureo, Oradea, 2015.
[10] Tiuc, A., Vasile, O., Gabor, T. Determination of antivibrational and acoustical properties of some materials madefrom recycled rubber particles and sawdust, In: Romanian Journal of Acoustics and Vibration, vol. XI, no. 1, 2014,pp. 47–52
[11] Youneung, L., Changwhan, J. Sound absorption properties of recycled polyester fibrous assembly absorbers, In:Autex Research Journal, vol. 3, no. 2, 2003.
[12] Gheorghe, A., Borlea (Tiuc), A.E. Evaluation of absorbing performances for composite plates made from recycledwaste, SISOM 2012 and Session of the commission of acoustics, Bucharest, 2012, pp. 307–313.
[13] Hh Zhou, B. Li, G. Huang, J. He A novel composite sound absorber with recycled rubber particles, In: Journal ofSound and Vibration, vol. 304, 2007, pp. 400–406.
[14] Terciu, O.M., Curtu, I., Cerbu, C., Stan, G.I. Research on mechanical properties of composites materials reinforcedwith lignocellulosic fibers, In: The 8th International Conference “Wood science and engineering in the thirdmillenium”, ICWSE, Brasov, Romania, 2011, pp. 345–352.
[15] Ersoy, S., Kucuk, H. Investigation of industrial tea-leaf-fibre waste material for its sound absorption properties, In:Applied Acoustics, vol. 70, 2009, pp. 215–220.
[16] Koizumi, T., Tsujiuchi, N., Adachi, A. The development of sound absorbing materials using natural bamboo fibers,High performance, In: WIT Press, 2002.
[17] Fatima, S., Mohanty, A.R. Acoustical and fire-retardant properties of jute composite materials, In: Applied acoustics,vol. 72, 2011, pp. 108–114.
[18] Curtu, I., Stanciu, M.D., Coşereanu, C, Vasile, O. Assessment of acoustic properties of biodegradable compositematerials with textile inserts, In: Materiale plastice, vol. 49, no. I, 2012, pp. 68–72.
[19] Bratu, P. Tracing curves for the sound absorbing characteristics in case of composites consisting of textile materials,In: Romanian Journal Of Acoustics And Vibrations, vol. 4, no. 1, 2007, pp. 23–26.
[20] Nastac, S., Anghelache, D., Stanciu, M., Curtu, I., On acoustic panels with high performances for pollutant individualworking place insulation, In: 8th International DAAAM Baltic Conference Industria Engeneering, Tallinn, Estonia,2012, pp. 69–73.
[21] Anghelache, D. About phonic isolation of the mobile equipment cabin, In: The Annals of “Dunarea de Jos” Universityof Galati, Fascicle XIV Mechanical Engineering, vol. 1, 2008.
[22] Bratu, P., Dragan, N., Vasile, O. Experimental studies of sound absorption coefficient of composite materials usedfor acoustic treatments of the cabins, In the 11-th International Congress on Automotive and Transport EngineeringCONAT 2010, Proceedings – Volume III “Automotive Vehicles and Environment”, 2010, pp. 177–181.
[23] EN ISO 10534-2:2005 Acoustics. Determination of sound absorption coefficient and acoustic impedance with theinterferometer, Part 2. Transfer function method, 2005.
[24] Vasile, O., Gillich, G.R., Influence of absorbtion and insulation properties for phonic treatment of public worksequipment, In: Analele Universitatii “Eftimie Murgu” Reşita, vol. XIX, no. 1, 2012, pp. 335–344.
[25] Bratu, P., Acustică interioară pentru constructii şi maşini (Indoor Acoustics for construction and equipment), In:Publishing House Impuls, Bucharest, 2002.
[26] Enescu, N., Magheti, I., Sârbu, M. A., Acustică tehnică (Technical acoustics), In: Publishing House ICPE, Bucharest,1998.
[27] ISO 11654 Acoustics. Acoustic absorbers for use in buildings. Evaluation of acoustic absorption, 2002.
Authors:
Chief of works Ph.D. eng. IULIANA IAŞNICU (STAMATE)1
sl. Ph.D. eng. GHEORGHIŢA TOMESCU2
Conf. Ph.D. eng. OVIDIU VASILE2
Prof. Ph.D. eng. VIVIANA FILIP3
Ph.D. eng. SIMONA MIHAI4
1 Gheorghe Asachi Technical College, Bucharest, no. 24 Aleea Pravat2 Polytechnic University of Bucharest, no. 313, Splaiul Independenței, Bucharest
3 Valahia University of Targoviste, Bd. Carol I, Targoviste and Multidisciplinary Science and Technology ResearchInstitute of VALAHIA University of Targoviste
4 Multidisciplinary Science and Technology Research Institute of VALAHIA University of Targoviste
e-mail: [email protected]; [email protected]; [email protected];[email protected]; [email protected]
Corresponding author:
Ph.D. eng. IULIANA IAŞNICU (STAMATE)e-mail: [email protected]
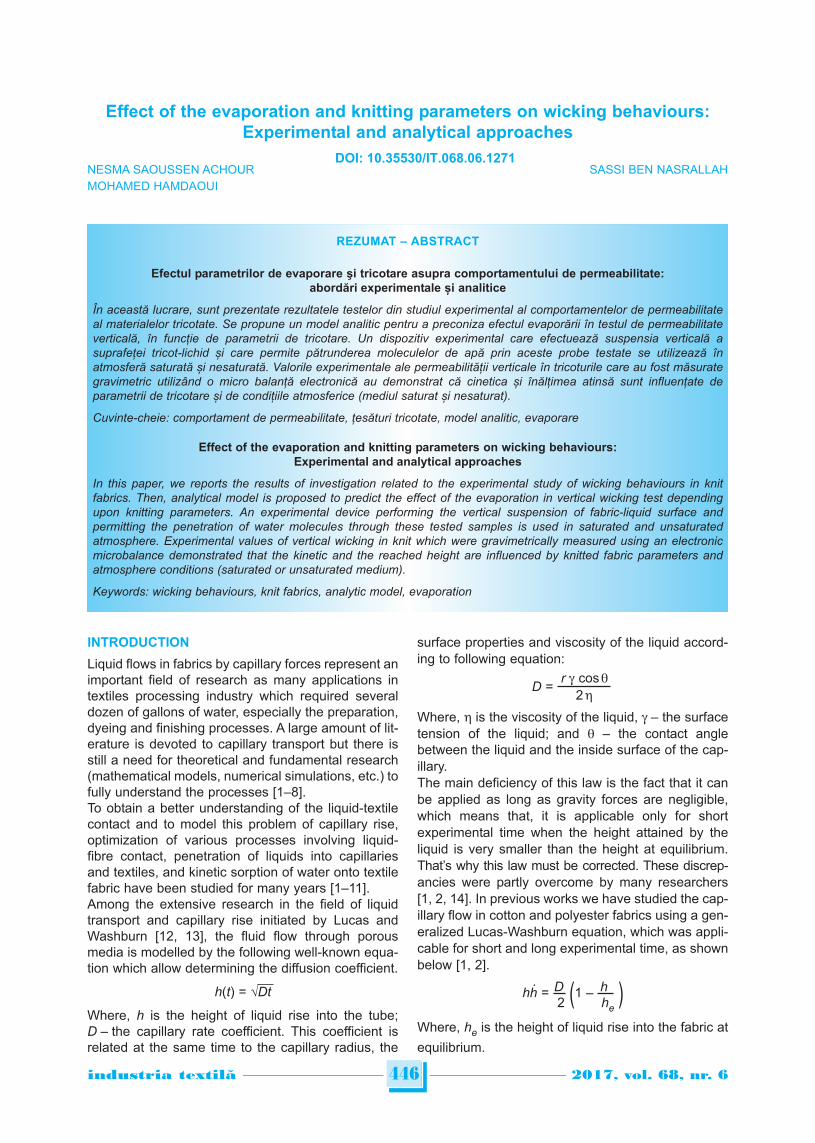
INTRODUCTION
Liquid flows in fabrics by capillary forces represent animportant field of research as many applications intextiles processing industry which required severaldozen of gallons of water, especially the preparation,dyeing and finishing processes. A large amount of lit-erature is devoted to capillary transport but there isstill a need for theoretical and fundamental research(mathematical models, numerical simulations, etc.) tofully understand the processes [1–8].To obtain a better understanding of the liquid-textilecontact and to model this problem of capillary rise,optimization of various processes involving liquid-fibre contact, penetration of liquids into capillariesand textiles, and kinetic sorption of water onto textilefabric have been studied for many years [1–11]. Among the extensive research in the field of liquidtransport and capillary rise initiated by Lucas andWashburn [12, 13], the fluid flow through porousmedia is modelled by the following well-known equa-tion which allow determining the diffusion coefficient.
h(t) = √Dt
Where, h is the height of liquid rise into the tube;D – the capillary rate coefficient. This coefficient isrelated at the same time to the capillary radius, the
surface properties and viscosity of the liquid accord-ing to following equation:
r g cos qD =
2 h
Where, h is the viscosity of the liquid, g – the surfacetension of the liquid; and q – the contact anglebetween the liquid and the inside surface of the cap-illary.The main deficiency of this law is the fact that it canbe applied as long as gravity forces are negligible,which means that, it is applicable only for shortexperimental time when the height attained by theliquid is very smaller than the height at equilibrium.That’s why this law must be corrected. These discrep-an cies were partly overcome by many researchers[1, 2, 14]. In previous works we have studied the cap-illary flow in cotton and polyester fabrics using a gen-eralized Lucas-Washburn equation, which was appli-cable for short and long experimental time, as shownbelow [1, 2].
. D hhh = (1 – )2 he
Where, he is the height of liquid rise into the fabric at
equilibrium.
Effect of the evaporation and knitting parameters on wicking behaviours:Experimental and analytical approaches
NESMA SAOUSSEN ACHOUR SASSI BEN NASRALLAHMOHAMED HAMDAOUI
REZUMAT – ABSTRACT
Efectul parametrilor de evaporare şi tricotare asupra comportamentului de permeabilitate:abordări experimentale și analitice
În această lucrare, sunt prezentate rezultatele testelor din studiul experimental al comportamentelor de permeabilitateal materialelor tricotate. Se propune un model analitic pentru a preconiza efectul evaporării în testul de permeabilitateverticală, în funcție de parametrii de tricotare. Un dispozitiv experimental care efectuează suspensia verticală asuprafeței tricot-lichid și care permite pătrunderea moleculelor de apă prin aceste probe testate se utilizează înatmosferă saturată și nesaturată. Valorile experimentale ale permeabilității verticale în tricoturile care au fost măsurategravimetric utilizând o micro balanță electronică au demonstrat că cinetica și înălțimea atinsă sunt influențate deparametrii de tricotare și de condițiile atmosferice (mediul saturat și nesaturat).
Cuvinte-cheie: comportament de permeabilitate, țesături tricotate, model analitic, evaporare
Effect of the evaporation and knitting parameters on wicking behaviours:Experimental and analytical approaches
In this paper, we reports the results of investigation related to the experimental study of wicking behaviours in knitfabrics. Then, analytical model is proposed to predict the effect of the evaporation in vertical wicking test dependingupon knitting parameters. An experimental device performing the vertical suspension of fabric-liquid surface andpermitting the penetration of water molecules through these tested samples is used in saturated and unsaturatedatmosphere. Experimental values of vertical wicking in knit which were gravimetrically measured using an electronicmicrobalance demonstrated that the kinetic and the reached height are influenced by knitted fabric parameters andatmosphere conditions (saturated or unsaturated medium).
Keywords: wicking behaviours, knit fabrics, analytic model, evaporation
446industria textila 2017, vol. 68, nr. 6˘
DOI: 10.35530/IT.068.06.1271
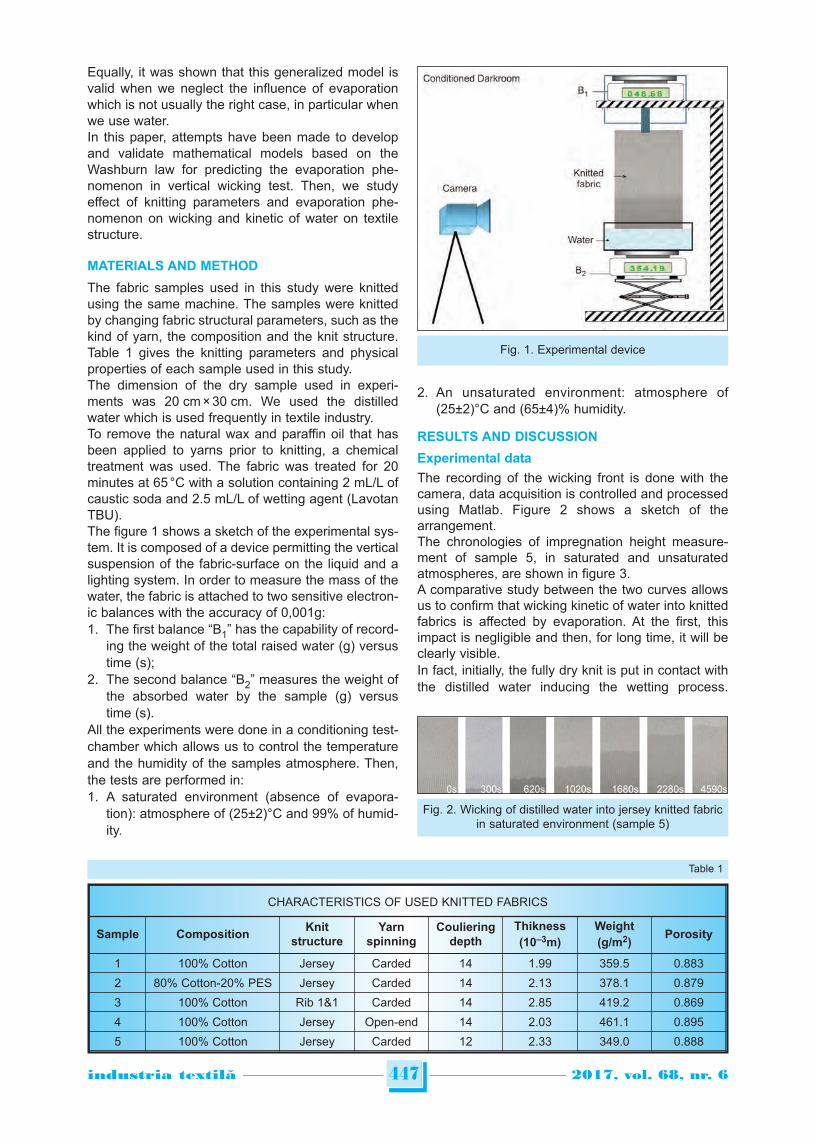
Equally, it was shown that this generalized model isvalid when we neglect the influence of evaporationwhich is not usually the right case, in particular whenwe use water.In this paper, attempts have been made to developand validate mathematical models based on theWashburn law for predicting the evaporation phe-nomenon in vertical wicking test. Then, we studyeffect of knitting parameters and evaporation phe-nomenon on wicking and kinetic of water on textilestructure.
MATERIALS AND METHOD
The fabric samples used in this study were knittedusing the same machine. The samples were knittedby changing fabric structural parameters, such as thekind of yarn, the composition and the knit structure.Table 1 gives the knitting parameters and physicalproperties of each sample used in this study.The dimension of the dry sample used in experi -ments was 20 cm × 30 cm. We used the distilledwater which is used frequently in textile industry.To remove the natural wax and paraffin oil that hasbeen applied to yarns prior to knitting, a chemicaltreatment was used. The fabric was treated for 20minutes at 65 °C with a solution containing 2 mL/L ofcaustic soda and 2.5 mL/L of wetting agent (LavotanTBU).The figure 1 shows a sketch of the experimental sys-tem. It is composed of a device permitting the verticalsuspension of the fabric-surface on the liquid and alighting system. In order to measure the mass of thewater, the fabric is attached to two sensitive electron-ic balances with the accuracy of 0,001g:1. The first balance “B1” has the capability of record-
ing the weight of the total raised water (g) versustime (s);
2. The second balance “B2” measures the weight ofthe absorbed water by the sample (g) versustime (s).
All the experiments were done in a conditioning test-chamber which allows us to control the temperatureand the humidity of the samples atmosphere. Then,the tests are performed in:1. A saturated environment (absence of evapora-
tion): atmosphere of (25±2)°C and 99% of humid-ity.
2. An unsaturated environment: atmosphere of(25±2)°C and (65±4)% humidity.
RESULTS AND DISCUSSION
Experimental data
The recording of the wicking front is done with thecamera, data acquisition is controlled and processedusing Matlab. Figure 2 shows a sketch of thearrangement.The chronologies of impregnation height measure-ment of sample 5, in saturated and unsaturatedatmospheres, are shown in figure 3. A comparative study between the two curves allowsus to confirm that wicking kinetic of water into knittedfabrics is affected by evaporation. At the first, thisimpact is negligible and then, for long time, it will beclearly visible. In fact, initially, the fully dry knit is put in contact withthe distilled water inducing the wetting process.
447industria textila 2017, vol. 68, nr. 6˘
CHARACTERISTICS OF USED KNITTED FABRICS
Sample CompositionKnit
structureYarn
spinningCouliering
depthThikness
(10–3m)
Weight
(g/m2)Porosity
1 100% Cotton Jersey Carded 14 1.99 359.5 0.883
2 80% Cotton-20% PES Jersey Carded 14 2.13 378.1 0.879
3 100% Cotton Rib 1&1 Carded 14 2.85 419.2 0.869
4 100% Cotton Jersey Open-end 14 2.03 461.1 0.895
5 100% Cotton Jersey Carded 12 2.33 349.0 0.888
Table 1
Fig. 1. Experimental device
Fig. 2. Wicking of distilled water into jersey knitted fabricin saturated environment (sample 5)
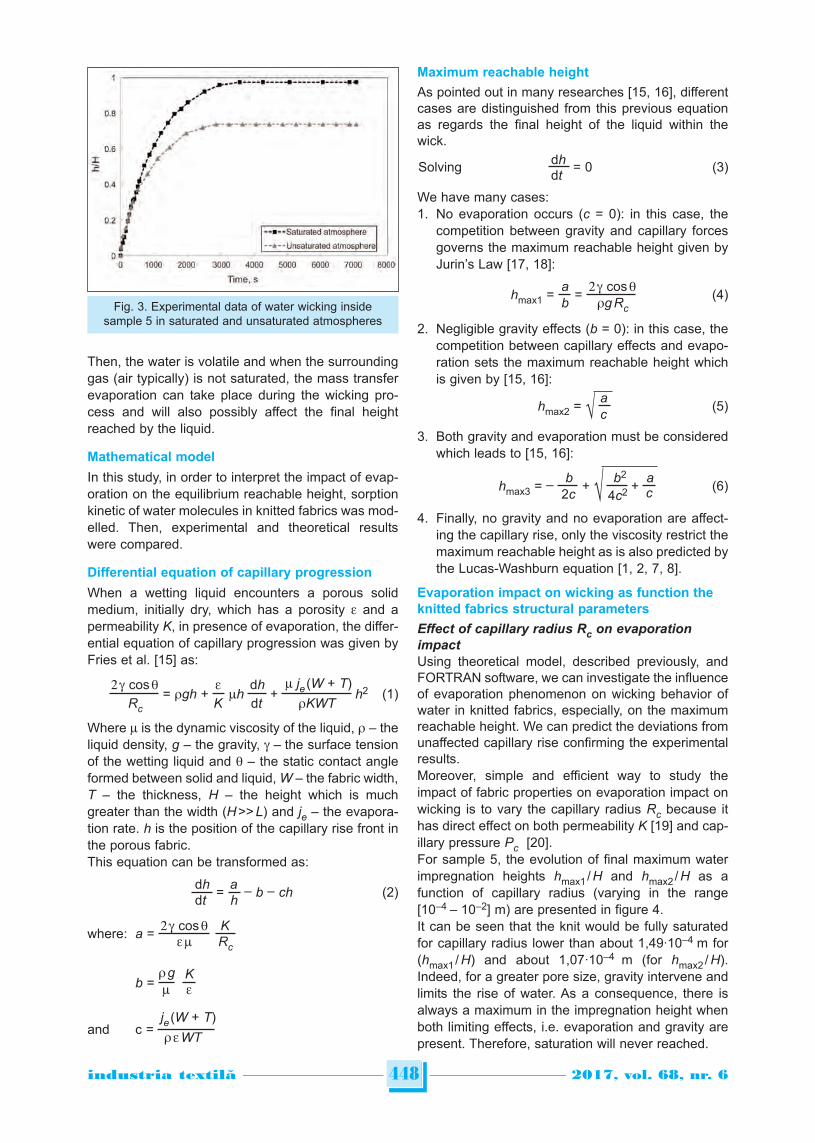
Then, the water is volatile and when the surroundinggas (air typically) is not saturated, the mass transferevaporation can take place during the wicking pro-cess and will also possibly affect the final heightreached by the liquid.
Mathematical model
In this study, in order to interpret the impact of evap-oration on the equilibrium reachable height, sorptionkinetic of water molecules in knitted fabrics was mod-elled. Then, experimental and theoretical resultswere compared.
Differential equation of capillary progression
When a wetting liquid encounters a porous solidmedium, initially dry, which has a porosity e and apermeability K, in presence of evaporation, the differ-ential equation of capillary progression was given byFries et al. [15] as:
2 g cos q e dh m je (W + T)= rgh + mh + h2 (1)
Rc K dt rKWT
Where m is the dynamic viscosity of the liquid, r – theliquid density, g – the gravity, g – the surface tensionof the wetting liquid and q – the static contact angleformed between solid and liquid, W – the fabric width,T – the thickness, H – the height which is muchgreater than the width (H >> L) and je – the evapora-tion rate. h is the position of the capillary rise front inthe porous fabric. This equation can be transformed as:
dh a = – b – ch (2)dt h
2 g cos q Kwhere: a = e m Rc
r g Kb =
m e
je (W + T)and c =
r e WT
Maximum reachable height
As pointed out in many researches [15, 16], differentcases are distinguished from this previous equationas regards the final height of the liquid within thewick.
dhSolving = 0 (3)dt
We have many cases:1. No evaporation occurs (c = 0): in this case, the
competition between gravity and capillary forcesgoverns the maximum reachable height given byJurin’s Law [17, 18]:
a 2 g cos qhmax1 = = (4)
b rgRc
2. Negligible gravity effects (b = 0): in this case, thecompetition between capillary effects and evapo-ration sets the maximum reachable height whichis given by [15, 16]:
ahmax2 = √ (5)
c
3. Both gravity and evaporation must be consideredwhich leads to [15, 16]:
b b2 ahmax3 = – + √ + (6)
2c 4c2 c
4. Finally, no gravity and no evaporation are affect-ing the capillary rise, only the viscosity restrict themaximum reachable height as is also predicted bythe Lucas-Washburn equation [1, 2, 7, 8].
Evaporation impact on wicking as function theknitted fabrics structural parameters
Effect of capillary radius Rc on evaporation
impact
Using theoretical model, described previously, andFORTRAN software, we can investigate the influenceof evaporation phenomenon on wicking behavior ofwater in knitted fabrics, especially, on the maximumreachable height. We can predict the deviations fromunaffected capillary rise confirming the experimentalresults.Moreover, simple and efficient way to study theimpact of fabric properties on evaporation impact onwicking is to vary the capillary radius Rc because ithas direct effect on both permeability K [19] and cap-illary pressure Pc [20].For sample 5, the evolution of final maximum waterimpregnation heights hmax1 / H and hmax2 / H as afunction of capillary radius (varying in the range[10–4 – 10–2] m) are presented in figure 4.It can be seen that the knit would be fully saturatedfor capillary radius lower than about 1,49·10–4 m for(hmax1 / H) and about 1,07·10–4 m (for hmax2 / H).Indeed, for a greater pore size, gravity intervene andlimits the rise of water. As a consequence, there isalways a maximum in the impregnation height whenboth limiting effects, i.e. evaporation and gravity arepresent. Therefore, saturation will never reached.
448industria textila 2017, vol. 68, nr. 6˘
Fig. 3. Experimental data of water wicking insidesample 5 in saturated and unsaturated atmospheres
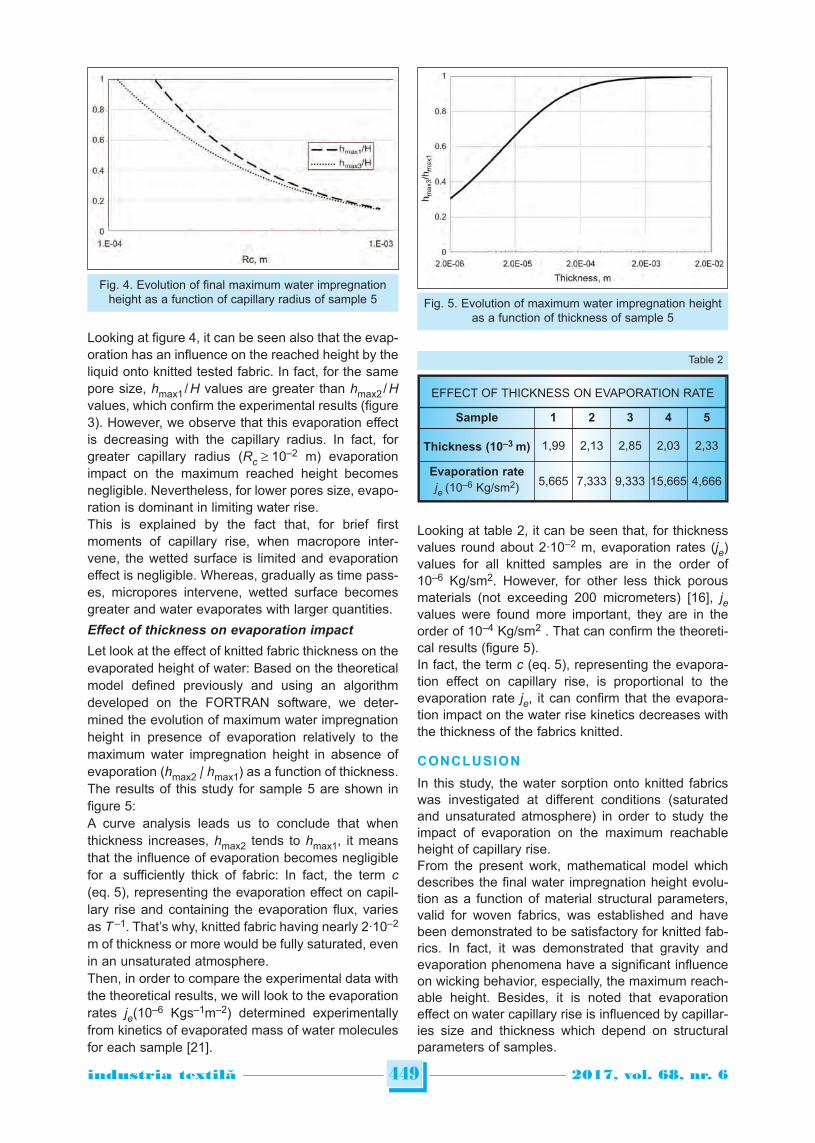
Looking at figure 4, it can be seen also that the evap-oration has an influence on the reached height by theliquid onto knitted tested fabric. In fact, for the samepore size, hmax1 / H values are greater than hmax2 / Hvalues, which confirm the experimental results (figure3). However, we observe that this evaporation effectis decreasing with the capillary radius. In fact, forgreater capillary radius (Rc 10–2 m) evaporationimpact on the maximum reached height becomesnegligible. Nevertheless, for lower pores size, evapo-ration is dominant in limiting water rise. This is explained by the fact that, for brief firstmoments of capillary rise, when macropore inter-vene, the wetted surface is limited and evaporationeffect is negligible. Whereas, gradually as time pass-es, micropores intervene, wetted surface becomesgreater and water evaporates with larger quantities.
Effect of thickness on evaporation impact
Let look at the effect of knitted fabric thickness on theevaporated height of water: Based on the theoreticalmodel defined previously and using an algorithmdeveloped on the FORTRAN software, we deter-mined the evolution of maximum water impregnationheight in presence of evaporation relatively to themaximum water impregnation height in absence ofevaporation (hmax2 / hmax1) as a function of thickness.The results of this study for sample 5 are shown infigure 5:A curve analysis leads us to conclude that whenthickness increases, hmax2 tends to hmax1, it meansthat the influence of evaporation becomes negligiblefor a sufficiently thick of fabric: In fact, the term c(eq. 5), representing the evaporation effect on capil-lary rise and containing the evaporation flux, variesas T –1. That’s why, knitted fabric having nearly 2·10–2
m of thickness or more would be fully saturated, evenin an unsaturated atmosphere. Then, in order to compare the experimental data withthe theoretical results, we will look to the evaporationrates je(10–6 Kgs–1m–2) determined experimentallyfrom kinetics of evaporated mass of water moleculesfor each sample [21].
Looking at table 2, it can be seen that, for thicknessvalues round about 2·10–2 m, evaporation rates (je)values for all knitted samples are in the order of10–6 Kg/sm2. However, for other less thick porousmaterials (not exceeding 200 micrometers) [16], jevalues were found more important, they are in theorder of 10–4 Kg/sm2 . That can confirm the theoreti-cal results (figure 5).In fact, the term c (eq. 5), representing the evapora-tion effect on capillary rise, is proportional to theevaporation rate je, it can confirm that the evapora-tion impact on the water rise kinetics decreases withthe thickness of the fabrics knitted.
CONCLUSION
In this study, the water sorption onto knitted fabricswas investigated at different conditions (saturatedand unsaturated atmosphere) in order to study theimpact of evaporation on the maximum reachableheight of capillary rise. From the present work, mathematical model whichdescribes the final water impregnation height evolu-tion as a function of material structural parameters,valid for woven fabrics, was established and havebeen demonstrated to be satisfactory for knitted fab-rics. In fact, it was demonstrated that gravity andevaporation phenomena have a significant influenceon wicking behavior, especially, the maximum reach-able height. Besides, it is noted that evaporationeffect on water capillary rise is influenced by capillar-ies size and thickness which depend on structuralparameters of samples.
449industria textila 2017, vol. 68, nr. 6˘
Fig. 4. Evolution of final maximum water impregnationheight as a function of capillary radius of sample 5 Fig. 5. Evolution of maximum water impregnation height
as a function of thickness of sample 5
EFFECT OF THICKNESS ON EVAPORATION RATE
Sample 1 2 3 4 5
Thickness (10–3 m) 1,99 2,13 2,85 2,03 2,33
Evaporation rate
je (10–6 Kg/sm2) 5,665 7,333 9,333 15,665 4,666
Table 2
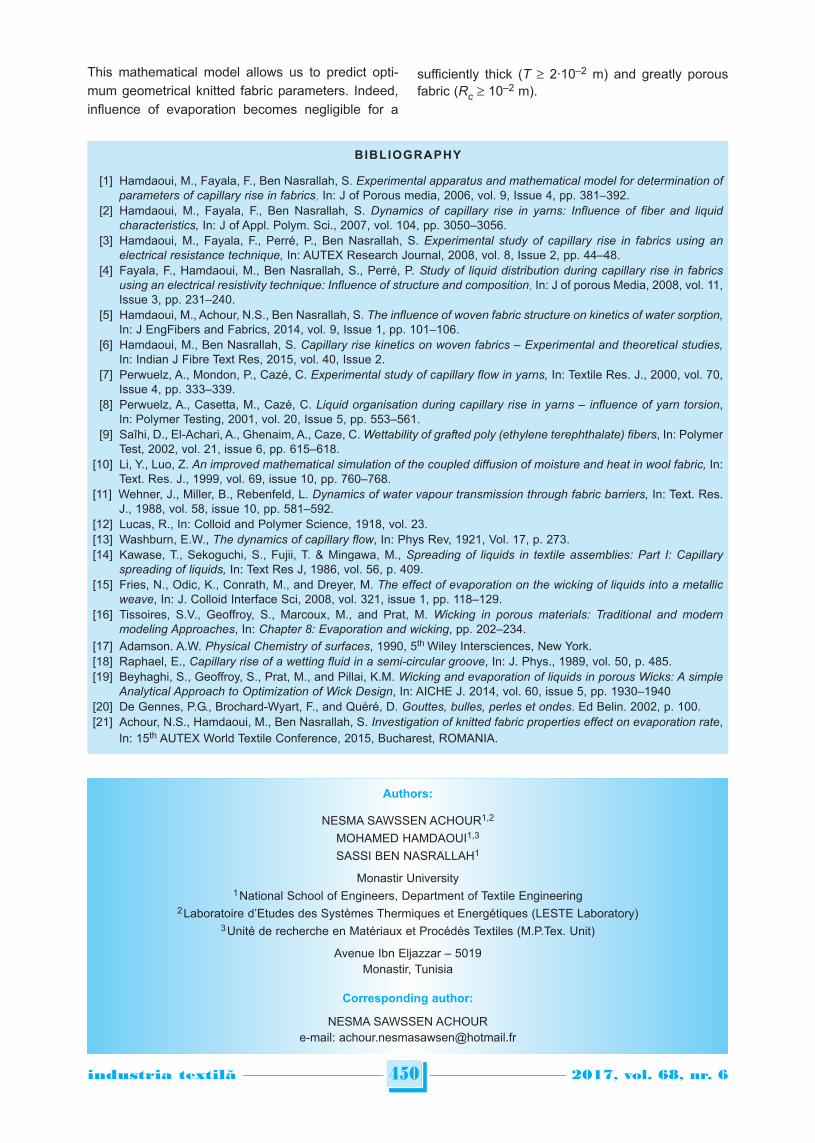
This mathematical model allows us to predict opti-mum geometrical knitted fabric parameters. Indeed,influence of evaporation becomes negligible for a
sufficiently thick (T 2·10–2 m) and greatly porousfabric (Rc 10–2 m).
450industria textila 2017, vol. 68, nr. 6˘
BIBLIOGRAPHY
[1] Hamdaoui, M., Fayala, F., Ben Nasrallah, S. Experimental apparatus and mathematical model for determination ofparameters of capillary rise in fabrics, In: J of Porous media, 2006, vol. 9, Issue 4, pp. 381–392.
[2] Hamdaoui, M., Fayala, F., Ben Nasrallah, S. Dynamics of capillary rise in yarns: Influence of fiber and liquidcharacteristics, In: J of Appl. Polym. Sci., 2007, vol. 104, pp. 3050–3056.
[3] Hamdaoui, M., Fayala, F., Perré, P., Ben Nasrallah, S. Experimental study of capillary rise in fabrics using anelectrical resistance technique, In: AUTEX Research Journal, 2008, vol. 8, Issue 2, pp. 44–48.
[4] Fayala, F., Hamdaoui, M., Ben Nasrallah, S., Perré, P. Study of liquid distribution during capillary rise in fabricsusing an electrical resistivity technique: Influence of structure and composition, In: J of porous Media, 2008, vol. 11,Issue 3, pp. 231–240.
[5] Hamdaoui, M., Achour, N.S., Ben Nasrallah, S. The influence of woven fabric structure on kinetics of water sorption,In: J EngFibers and Fabrics, 2014, vol. 9, Issue 1, pp. 101–106.
[6] Hamdaoui, M., Ben Nasrallah, S. Capillary rise kinetics on woven fabrics – Experimental and theoretical studies,In: Indian J Fibre Text Res, 2015, vol. 40, Issue 2.
[7] Perwuelz, A., Mondon, P., Cazé, C. Experimental study of capillary flow in yarns, In: Textile Res. J., 2000, vol. 70,Issue 4, pp. 333–339.
[8] Perwuelz, A., Casetta, M., Cazé, C. Liquid organisation during capillary rise in yarns – influence of yarn torsion,In: Polymer Testing, 2001, vol. 20, Issue 5, pp. 553–561.
[9] Saîhi, D., El-Achari, A., Ghenaim, A., Caze, C. Wettability of grafted poly (ethylene terephthalate) fibers, In: PolymerTest, 2002, vol. 21, issue 6, pp. 615–618.
[10] Li, Y., Luo, Z. An improved mathematical simulation of the coupled diffusion of moisture and heat in wool fabric, In:Text. Res. J., 1999, vol. 69, issue 10, pp. 760–768.
[11] Wehner, J., Miller, B., Rebenfeld, L. Dynamics of water vapour transmission through fabric barriers, In: Text. Res.J., 1988, vol. 58, issue 10, pp. 581–592.
[12] Lucas, R., In: Colloid and Polymer Science, 1918, vol. 23.[13] Washburn, E.W., The dynamics of capillary flow, In: Phys Rev, 1921, Vol. 17, p. 273.[14] Kawase, T., Sekoguchi, S., Fujii, T. & Mingawa, M., Spreading of liquids in textile assemblies: Part I: Capillary
spreading of liquids, In: Text Res J, 1986, vol. 56, p. 409.[15] Fries, N., Odic, K., Conrath, M., and Dreyer, M. The effect of evaporation on the wicking of liquids into a metallic
weave, In: J. Colloid Interface Sci, 2008, vol. 321, issue 1, pp. 118–129.[16] Tissoires, S.V., Geoffroy, S., Marcoux, M., and Prat, M. Wicking in porous materials: Traditional and modern
modeling Approaches, In: Chapter 8: Evaporation and wicking, pp. 202–234.[17] Adamson. A.W. Physical Chemistry of surfaces, 1990, 5th Wiley Intersciences, New York.[18] Raphael, E., Capillary rise of a wetting fluid in a semi-circular groove, In: J. Phys., 1989, vol. 50, p. 485.[19] Beyhaghi, S., Geoffroy, S., Prat, M., and Pillai, K.M. Wicking and evaporation of liquids in porous Wicks: A simple
Analytical Approach to Optimization of Wick Design, In: AICHE J. 2014, vol. 60, issue 5, pp. 1930–1940[20] De Gennes, P.G., Brochard-Wyart, F., and Quéré, D. Gouttes, bulles, perles et ondes. Ed Belin. 2002, p. 100.[21] Achour, N.S., Hamdaoui, M., Ben Nasrallah, S. Investigation of knitted fabric properties effect on evaporation rate,
In: 15th AUTEX World Textile Conference, 2015, Bucharest, ROMANIA.
Authors:
NESMA SAWSSEN ACHOUR1,2
MOHAMED HAMDAOUI1,3
SASSI BEN NASRALLAH1
Monastir University1 National School of Engineers, Department of Textile Engineering
2 Laboratoire d’Etudes des Systèmes Thermiques et Energétiques (LESTE Laboratory)3 Unité de recherche en Matériaux et Procédés Textiles (M.P.Tex. Unit)
Avenue Ibn Eljazzar – 5019Monastir, Tunisia
Corresponding author:
NESMA SAWSSEN ACHOURe-mail: [email protected]
INTRODUCTION
Textured yarns of high quality require a good selec-tion and compliance of production process parame-ters. The effect of temperature of the heater on theproperties of textured yarns has been the subject ofmany studies [1–8]. With the increase in heater tem-perature, the mechanical characteristics of the yarnbefore and after the twisting zone slightly decline. Toachieve good crimp a high temperature of the heateris required; on the other hand, to achieve the desired
strength it is necessary to lower the temperature ofheaters [9–13].The dependence of elasticity modulus on tempera-ture for PA6.6 fibers is presented in (figure 1). Fourimportant regions of thermal transitions are observedwith polyamide PA6.6 fibers: at about 100°C, 200°C,260°C and 300°C. Temperature values are approxi-mate, since the transitions are broad and the peakpositions depend on the changes rates and other fac-tors [14]. The effects at 200°C (a little lower for PA6),are the key factors in the production of textured yarn.
451industria textila 2017, vol. 68, nr. 6˘
Influence of heater temperature and texturing speedon the physical-mechanical properties of polyamide textured yarns
in false-twist texturing process
MARİJA SAVIC DUSAN TRAJKOVIC JOVAN STEPANOVICPETAR STOJANOVIC MİRJANA KOSTIC DİVNA MAJSTOROVIC
REZUMAT – ABSTRACT
Influenţa temperaturii şi vitezei de texturare asupra caracteristicilor fizico-mecanice ale firelor de poliamidătexturate prin procedeul de falsă torsiune
În prezentul articol a fost studiat efectul parametrilor tehnici și tehnologici în texturarea prin falsă torsiune asupraproprietăților fizico-mecanice ale firelor de poliamidă. Multifilamentul orientat parțial (POY) cu finețe de 22f07x1 dtex afost texturat pe o mașină de texturat cu fricțiune ICBT, modelul FT 15 E3. Utilizând tuneluri lungi cu temperatură scăzută,a fost investigată influența temperaturii și a vitezei de texturare asupra caracteristicilor de ondulare, contracție și ruperea firelor. Astfel, valorile pentru raportul dintre viteza de suprafață a discurilor și viteza liniară a firelor (D/Y) de 1,9 șitensiunea din zona de texturare (întindere) de 1,305 și din zona de înfășurare de 0,954 au fost menținute constante.Parametrii de texturare investigați afectează modificarea acestor caracteristici la grade diferite. Pentru temperaturile de200, 210 și 220°C, s-a constatat o corelație negativă între viteza de texturare, indicatorul de ondulare și viteza detexturare și caracteristicile de rupere, în timp ce a fost stabilită o corelație pozitivă între viteza de texturare și contracție.A fost determinat factorul de corelație între parametrii procesului de texturare și proprietățile analizate ale firelor. Pe bazarezultatelor obținute, se poate concluziona că, odată cu corelația stabilită între viteza de texturare și proprietățileinvestigate ale firelor, factorul de corelație crește odată cu creșterea temperaturii la 210°C. Cu toate acestea, latemperatura de 220°C, în general, în majoritatea cazurilor, această valoare scade. Temperatura optimă a încălzitoruluieste de 210°C, luând în considerare selectarea altor valori ale parametrilor raportului dintre D/Y și întindere.
Cuvinte-cheie: proprietăți fizico-mecanice, fire texturate, temperatură
Influence of heater temperature and texturing speed on the physical-mechanical propertiesof polyamide textured yarns in false-twist texturing process
In this paper, the effect of technical and technological parameters in false twist texturing on physical-mechanicalproperties of polyamide yarns was studied. Partially oriented (POY) multifilament with fineness of 22f07x1 dtex wastextured under factory conditions on a friction texturing ICBT model FT 15 E3 machine. Using low temperature longheaters the influence of heater temperature and texturing speed on crimping, shrinking and breaking characteristics ofyarn was investigated. Thereby, the values for the ratio of surface speed of disks to linear yarn speed, (D/Y), of 1.9, andtension in texturing zone (stretching) of 1.305 and in winding zone of 0.954, were kept constant. The investigatedtexturing parameters affect the change of these characteristics to varying degrees. For heater temperatures of 200, 210and 220°C, linear negative correlation was found between the texturing speed, indicator of crimping and texturing speedand breaking characteristics, while the positive correlation was established between the speed of texturing andshrinkage. It was determined the correlation factor between the texturing process parameters and the analysedproperties of the yarn. Based on the obtained results it can be concluded that with the established correlation betweenthe speed of texturing and the investigated properties of the yarn, the correlation factor increases with the increase inheater temperature to 210°C. However, at the temperature of 220°C, generally in most cases this value decreases.Therefore, in this study, the optimum temperature of the heater is 210°C, taking into account the selection of otherparameter values of the D/Y ratio and stretching.
Keywords: physical-mechanical properties, textured yarns, heater temperature
DOI: 10.35530/IT.068.06.1482
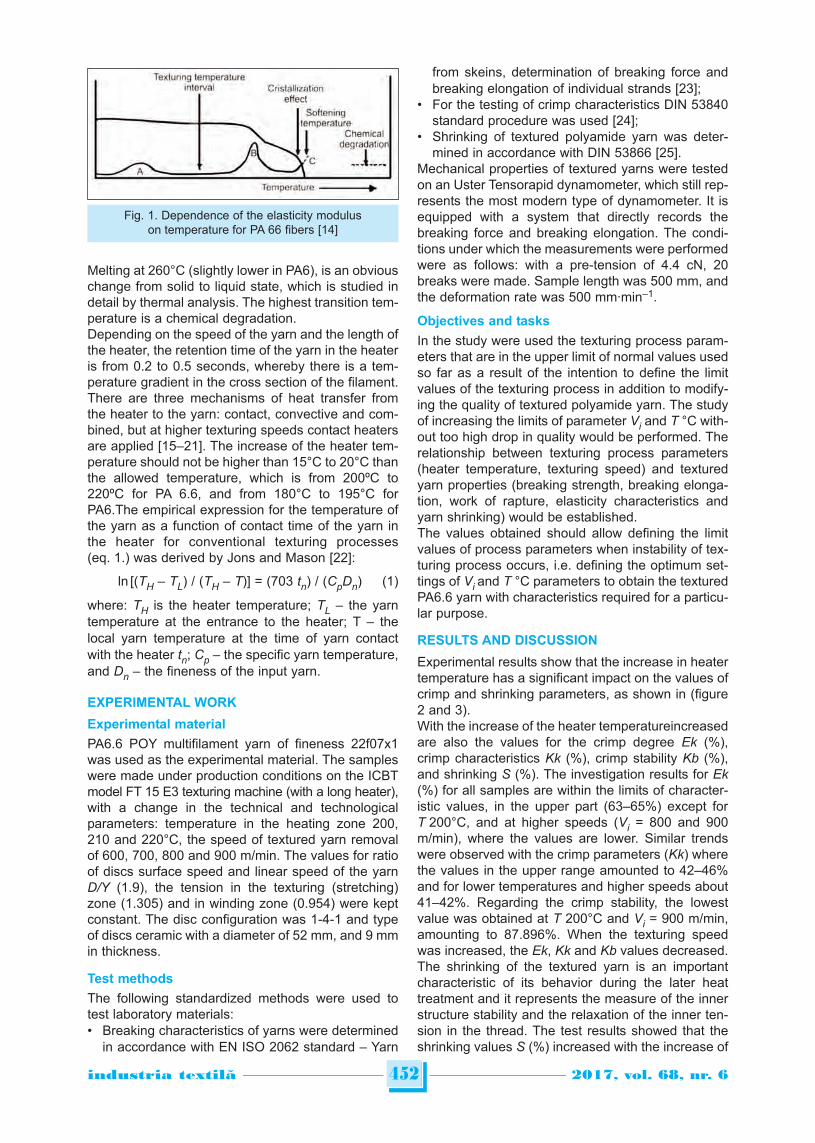
452industria textila 2017, vol. 68, nr. 6˘
Melting at 260°C (slightly lower in PA6), is an obviouschange from solid to liquid state, which is studied indetail by thermal analysis. The highest transition tem-perature is a chemical degradation.Depending on the speed of the yarn and the length ofthe heater, the retention time of the yarn in the heateris from 0.2 to 0.5 seconds, whereby there is a tem-perature gradient in the cross section of the filament.There are three mechanisms of heat transfer fromthe heater to the yarn: contact, convective and com-bined, but at higher texturing speeds contact heatersare applied [15–21]. The increase of the heater tem-perature should not be higher than 15°C to 20°C thanthe allowed temperature, which is from 200ºC to220ºC for PA 6.6, and from 180°C to 195°C forPA6.The empirical expression for the temperature ofthe yarn as a function of contact time of the yarn inthe heater for conventional texturing processes(eq. 1.) was derived by Jons and Mason [22]:
ln [(TH – TL) / (TH – T)] = (703 tn) / (CpDn) (1)
where: TH is the heater temperature; TL – the yarntemperature at the entrance to the heater; T – thelocal yarn temperature at the time of yarn contactwith the heater tn; Cp – the specific yarn temperature,and Dn – the fineness of the input yarn.
EXPERIMENTAL WORK
Experimental material
PA6.6 POY multifilament yarn of fineness 22f07x1was used as the experimental material. The sampleswere made under production conditions on the ICBTmodel FT 15 E3 texturing machine (with a long heater),with a change in the technical and technologicalparameters: temperature in the heating zone 200,210 and 220°C, the speed of textured yarn removalof 600, 700, 800 and 900 m/min. The values for ratioof discs surface speed and linear speed of the yarnD/Y (1.9), the tension in the texturing (stretching)zone (1.305) and in winding zone (0.954) were keptconstant. The disc configuration was 1-4-1 and typeof discs ceramic with a diameter of 52 mm, and 9 mmin thickness.
Test methods
The following standardized methods were used totest laboratory materials:• Breaking characteristics of yarns were determined
in accordance with EN ISO 2062 standard – Yarn
from skeins, determination of breaking force andbreaking elongation of individual strands [23];
• For the testing of crimp characteristics DIN 53840standard procedure was used [24];
• Shrinking of textured polyamide yarn was deter-mined in accordance with DIN 53866 [25].
Mechanical properties of textured yarns were testedon an Uster Tensorapid dynamometer, which still rep-resents the most modern type of dynamometer. It isequipped with a system that directly records thebreaking force and breaking elongation. The condi-tions under which the measurements were performedwere as follows: with a pre-tension of 4.4 cN, 20breaks were made. Sample length was 500 mm, andthe deformation rate was 500 mm·min–1.
Objectives and tasks
In the study were used the texturing process param-eters that are in the upper limit of normal values usedso far as a result of the intention to define the limitvalues of the texturing process in addition to modify-ing the quality of textured polyamide yarn. The studyof increasing the limits of parameter Vi and T °C with-out too high drop in quality would be performed. Therelationship between texturing process parameters(heater temperature, texturing speed) and texturedyarn properties (breaking strength, breaking elonga-tion, work of rapture, elasticity characteristics andyarn shrinking) would be established.The values obtained should allow defining the limitvalues of process parameters when instability of tex-turing process occurs, i.e. defining the optimum set-tings of Vi and T °C parameters to obtain the texturedPA6.6 yarn with characteristics required for a particu-lar purpose.
RESULTS AND DISCUSSION
Experimental results show that the increase in heatertemperature has a significant impact on the values ofcrimp and shrinking parameters, as shown in (figure2 and 3).With the increase of the heater temperatureincreasedare also the values for the crimp degree Ek (%),crimp characteristics Kk (%), crimp stability Kb (%),and shrinking S (%). The investigation results for Ek(%) for all samples are within the limits of character-istic values, in the upper part (63–65%) except forT 200°C, and at higher speeds (Vi = 800 and 900m/min), where the values are lower. Similar trendswere observed with the crimp parameters (Kk) wherethe values in the upper range amounted to 42–46%and for lower temperatures and higher speeds about41–42%. Regarding the crimp stability, the lowestvalue was obtained at T 200°C and Vi = 900 m/min,amounting to 87.896%. When the texturing speedwas increased, the Ek, Kk and Kb values decreased.The shrinking of the textured yarn is an importantcharacteristic of its behavior during the later heattreatment and it represents the measure of the innerstructure stability and the relaxation of the inner ten-sion in the thread. The test results showed that theshrinking values S (%) increased with the increase of
Fig. 1. Dependence of the elasticity moduluson temperature for PA 66 fibers [14]
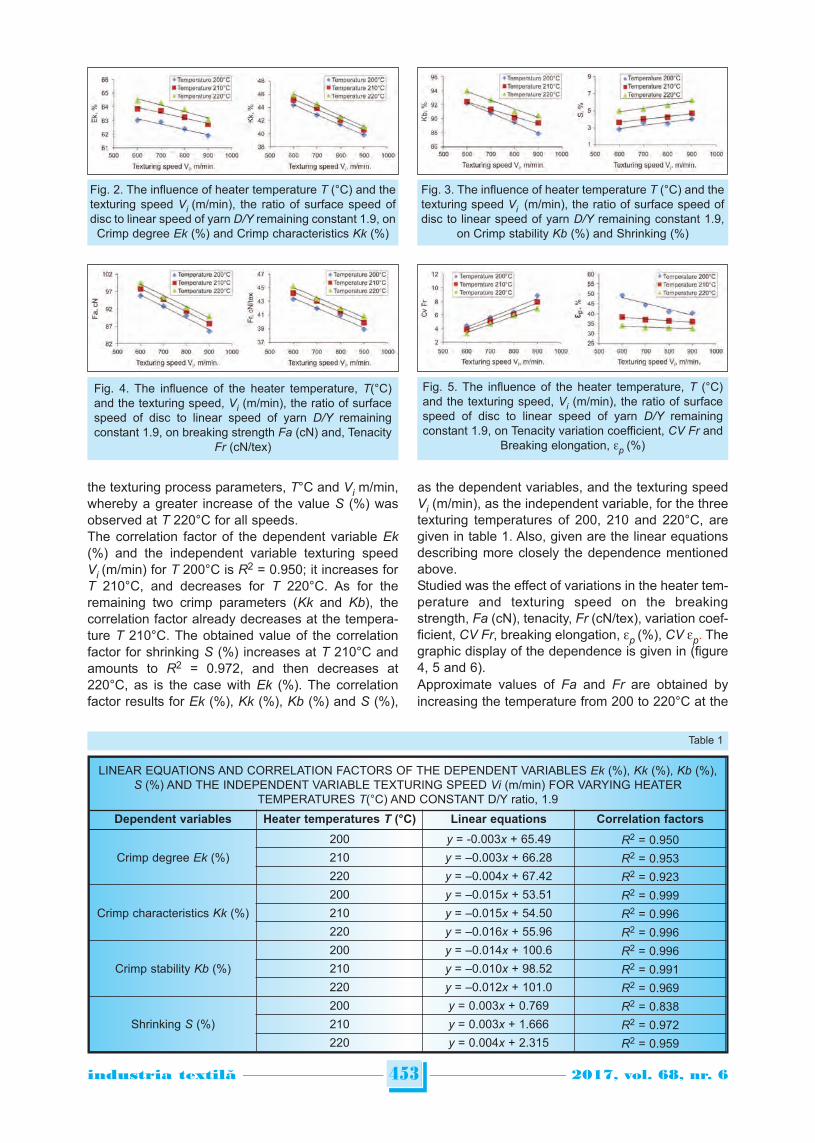
453industria textila 2017, vol. 68, nr. 6˘
the texturing process parameters, T°C and Vi m/min,whereby a greater increase of the value S (%) wasobserved at T 220°C for all speeds.The correlation factor of the dependent variable Ek(%) and the independent variable texturing speedVi (m/min) for T 200°C is R2 = 0.950; it increases forT 210°C, and decreases for T 220°C. As for theremaining two crimp parameters (Kk and Kb), thecorrelation factor already decreases at the tempera-ture T 210°C. The obtained value of the correlationfactor for shrinking S (%) increases at T 210°C andamounts to R2 = 0.972, and then decreases at220°C, as is the case with Ek (%). The correlationfactor results for Ek (%), Kk (%), Kb (%) and S (%),
as the dependent variables, and the texturing speedVi (m/min), as the independent variable, for the threetexturing temperatures of 200, 210 and 220°C, aregiven in table 1. Also, given are the linear equationsdescribing more closely the dependence mentionedabove.Studied was the effect of variations in the heater tem-perature and texturing speed on the breakingstrength, Fa (cN), tenacity, Fr (cN/tex), variation coef-ficient, CV Fr, breaking elongation, ep (%), CV ep. Thegraphic display of the dependence is given in (figure4, 5 and 6). Approximate values of Fa and Fr are obtained byincreasing the temperature from 200 to 220°C at the
Fig. 2. The influence of heater temperature T (°C) and thetexturing speed Vi (m/min), the ratio of surface speed ofdisc to linear speed of yarn D/Y remaining constant 1.9, on
Crimp degree Ek (%) and Crimp characteristics Kk (%)
Fig. 3. The influence of heater temperature T (°C) and thetexturing speed Vi (m/min), the ratio of surface speed ofdisc to linear speed of yarn D/Y remaining constant 1.9,
on Crimp stability Kb (%) and Shrinking (%)
Fig. 4. The influence of the heater temperature, T(°C)and the texturing speed, Vi (m/min), the ratio of surfacespeed of disc to linear speed of yarn D/Y remainingconstant 1.9, on breaking strength Fa (cN) and, Tenacity
Fr (cN/tex)
Fig. 5. The influence of the heater temperature, T (°C)and the texturing speed, Vi (m/min), the ratio of surfacespeed of disc to linear speed of yarn D/Y remainingconstant 1.9, on Tenacity variation coefficient, CV Fr and
Breaking elongation, ep (%)
LINEAR EQUATIONS AND CORRELATION FACTORS OF THE DEPENDENT VARIABLES Ek (%), Kk (%), Kb (%),S (%) AND THE INDEPENDENT VARIABLE TEXTURING SPEED Vi (m/min) FOR VARYING HEATER
TEMPERATURES T(°C) AND CONSTANT D/Y ratio, 1.9
Dependent variables Heater temperatures T (°C) Linear equations Correlation factors
Crimp degree Ek (%)
200 y = -0.003x + 65.49 R2 = 0.950210 y = –0.003x + 66.28 R2 = 0.953220 y = –0.004x + 67.42 R2 = 0.923
Crimp characteristics Kk (%)
200 y = –0.015x + 53.51 R2 = 0.999210 y = –0.015x + 54.50 R2 = 0.996220 y = –0.016x + 55.96 R2 = 0.996
Crimp stability Kb (%)
200 y = –0.014x + 100.6 R2 = 0.996210 y = –0.010x + 98.52 R2 = 0.991220 y = –0.012x + 101.0 R2 = 0.969
Shrinking S (%)
200 y = 0.003x + 0.769 R2 = 0.838210 y = 0.003x + 1.666 R2 = 0.972220 y = 0.004x + 2.315 R2 = 0.959
Table 1
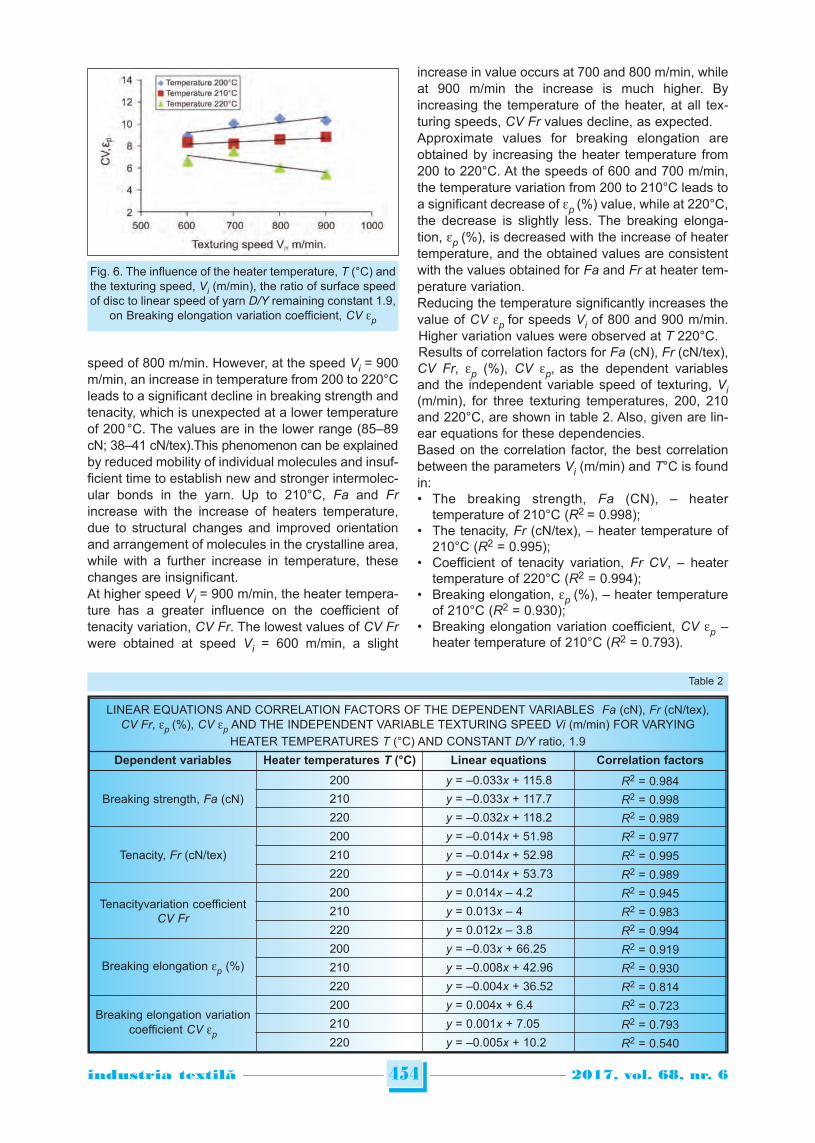
speed of 800 m/min. However, at the speed Vi = 900m/min, an increase in temperature from 200 to 220°Cleads to a significant decline in breaking strength andtenacity, which is unexpected at a lower temperatureof 200 °C. The values are in the lower range (85–89cN; 38–41 cN/tex).This phenomenon can be explainedby reduced mobility of individual molecules and insuf-ficient time to establish new and stronger intermolec-ular bonds in the yarn. Up to 210°C, Fa and Frincrease with the increase of heaters temperature,due to structural changes and improved orientationand arrangement of molecules in the crystalline area,while with a further increase in temperature, thesechanges are insignificant.At higher speed Vi = 900 m/min, the heater tempera-ture has a greater influence on the coefficient oftenacity variation, CV Fr. The lowest values of CV Frwere obtained at speed Vi = 600 m/min, a slight
increase in value occurs at 700 and 800 m/min, whileat 900 m/min the increase is much higher. Byincreasing the temperature of the heater, at all tex-turing speeds, CV Fr values decline, as expected.Approximate values for breaking elongation areobtained by increasing the heater temperature from200 to 220°C. At the speeds of 600 and 700 m/min,the temperature variation from 200 to 210°C leads toa significant decrease of ep (%) value, while at 220°C,the decrease is slightly less. The breaking elonga-tion, ep (%), is decreased with the increase of heatertemperature, and the obtained values are consistentwith the values obtained for Fa and Fr at heater tem-perature variation.Reducing the temperature significantly increases thevalue of CV ep for speeds Vi of 800 and 900 m/min.Higher variation values were observed at T 220°C.Results of correlation factors for Fa (cN), Fr (cN/tex),CV Fr, ep (%), CV ep, as the dependent variablesand the independent variable speed of texturing, Vi(m/min), for three texturing temperatures, 200, 210and 220°C, are shown in table 2. Also, given are lin-ear equations for these dependencies.Based on the correlation factor, the best correlationbetween the parameters Vi (m/min) and T°C is foundin:• The breaking strength, Fa (CN), – heater
temperature of 210°C (R2 = 0.998);• The tenacity, Fr (cN/tex), – heater temperature of
210°C (R2 = 0.995);• Coefficient of tenacity variation, Fr CV, – heater
temperature of 220°C (R2 = 0.994);• Breaking elongation, ep (%), – heater temperature
of 210°C (R2 = 0.930);• Breaking elongation variation coefficient, CV ep –
heater temperature of 210°C (R2 = 0.793).
454industria textila 2017, vol. 68, nr. 6˘
Fig. 6. The influence of the heater temperature, T (°C) andthe texturing speed, Vi (m/min), the ratio of surface speedof disc to linear speed of yarn D/Y remaining constant 1.9,
on Breaking elongation variation coefficient, CV ep
LINEAR EQUATIONS AND CORRELATION FACTORS OF THE DEPENDENT VARIABLES Fa (cN), Fr (cN/tex),CV Fr, ep (%), CV ep AND THE INDEPENDENT VARIABLE TEXTURING SPEED Vi (m/min) FOR VARYING
HEATER TEMPERATURES T (°C) AND CONSTANT D/Y ratio, 1.9
Dependent variables Heater temperatures T (°C) Linear equations Correlation factors
Breaking strength, Fa (cN)
200 y = –0.033x + 115.8 R2 = 0.984210 y = –0.033x + 117.7 R2 = 0.998220 y = –0.032x + 118.2 R2 = 0.989
Tenacity, Fr (cN/tex)
200 y = –0.014x + 51.98 R2 = 0.977210 y = –0.014x + 52.98 R2 = 0.995220 y = –0.014x + 53.73 R2 = 0.989
Tenacityvariation coefficientCV Fr
200 y = 0.014x – 4.2 R2 = 0.945210 y = 0.013x – 4 R2 = 0.983220 y = 0.012x – 3.8 R2 = 0.994
Breaking elongation ep (%)200 y = –0.03x + 66.25 R2 = 0.919210 y = –0.008x + 42.96 R2 = 0.930220 y = –0.004x + 36.52 R2 = 0.814
Breaking elongation variationcoefficient CV ep
200 y = 0.004x + 6.4 R2 = 0.723210 y = 0.001x + 7.05 R2 = 0.793220 y = –0.005x + 10.2 R2 = 0.540
Table 2
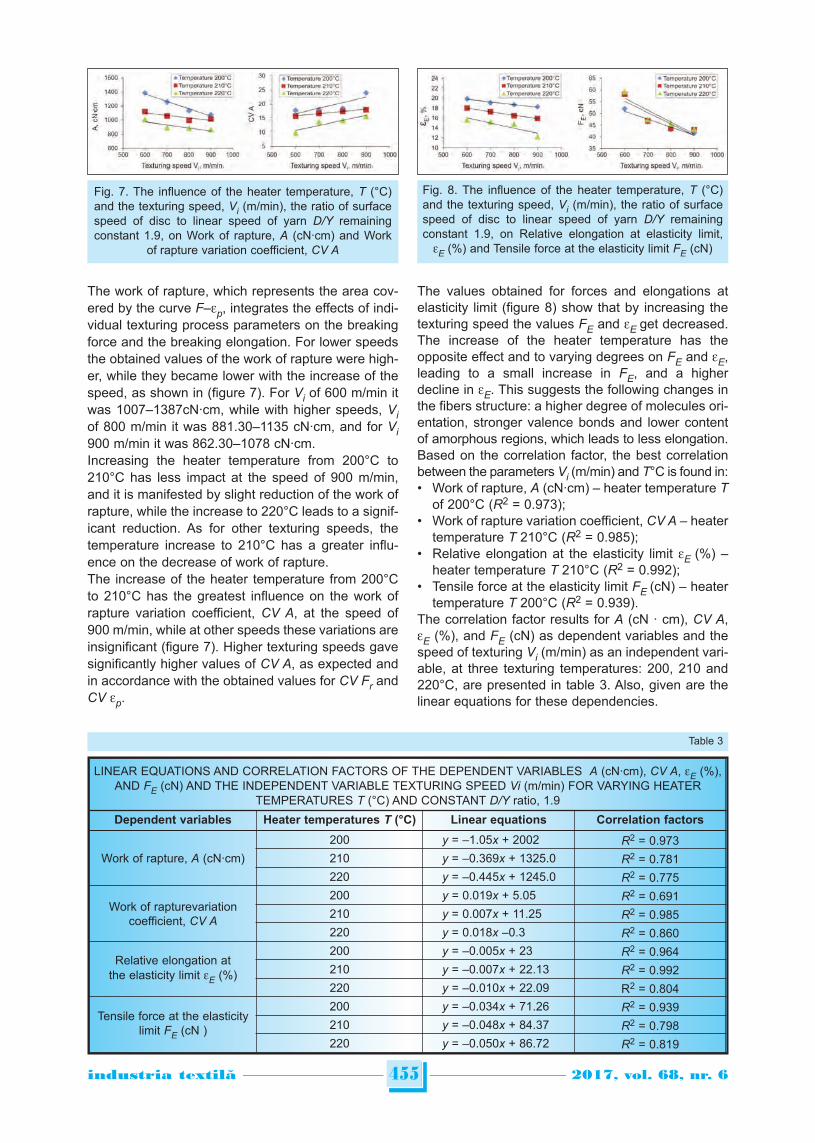
The work of rapture, which represents the area cov-ered by the curve F–ep, integrates the effects of indi-vidual texturing process parameters on the breakingforce and the breaking elongation. For lower speedsthe obtained values of the work of rapture were high-er, while they became lower with the increase of thespeed, as shown in (figure 7). For Vi of 600 m/min itwas 1007–1387cN·cm, while with higher speeds, Viof 800 m/min it was 881.30–1135 cN·cm, and for Vi900 m/min it was 862.30–1078 cN·cm. Increasing the heater temperature from 200°C to210°C has less impact at the speed of 900 m/min,and it is manifested by slight reduction of the work ofrapture, while the increase to 220°C leads to a signif-icant reduction. As for other texturing speeds, thetemperature increase to 210°C has a greater influ-ence on the decrease of work of rapture.The increase of the heater temperature from 200°Cto 210°C has the greatest influence on the work ofrapture variation coefficient, CV A, at the speed of900 m/min, while at other speeds these variations areinsignificant (figure 7). Higher texturing speeds gavesignificantly higher values of CV A, as expected andin accordance with the obtained values for CV Fr andCV ep.
The values obtained for forces and elongations atelasticity limit (figure 8) show that by increasing thetexturing speed the values FE and eE get decreased.The increase of the heater temperature has theopposite effect and to varying degrees on FE and eE,leading to a small increase in FE, and a higherdecline in eE. This suggests the following changes inthe fibers structure: a higher degree of molecules ori-entation, stronger valence bonds and lower contentof amorphous regions, which leads to less elongation.Based on the correlation factor, the best correlationbetween the parameters Vi (m/min) and T°C is found in:• Work of rapture, A (cN·cm) – heater temperature T
of 200°C (R2 = 0.973);• Work of rapture variation coefficient, CV A – heater
temperature T 210°C (R2 = 0.985);• Relative elongation at the elasticity limit eE (%) –
heater temperature T 210°C (R2 = 0.992);• Tensile force at the elasticity limit FE (cN) – heater
temperature T 200°C (R2 = 0.939).The correlation factor results for A (cN · cm), CV A,eE (%), and FE (cN) as dependent variables and thespeed of texturing Vi (m/min) as an independent vari-able, at three texturing temperatures: 200, 210 and220°C, are presented in table 3. Also, given are thelinear equations for these dependencies.
455industria textila 2017, vol. 68, nr. 6˘
LINEAR EQUATIONS AND CORRELATION FACTORS OF THE DEPENDENT VARIABLES A (cN·cm), CV A, eE (%),AND FE (cN) AND THE INDEPENDENT VARIABLE TEXTURING SPEED Vi (m/min) FOR VARYING HEATER
TEMPERATURES T (°C) AND CONSTANT D/Y ratio, 1.9
Dependent variables Heater temperatures T (°C) Linear equations Correlation factors
Work of rapture, A (cN·cm)
200 y = –1.05x + 2002 R2 = 0.973210 y = –0.369x + 1325.0 R2 = 0.781220 y = –0.445x + 1245.0 R2 = 0.775
Work of rapturevariationcoefficient, CV A
200 y = 0.019x + 5.05 R2 = 0.691210 y = 0.007x + 11.25 R2 = 0.985220 y = 0.018x –0.3 R2 = 0.860
Relative elongation atthe elasticity limit eE (%)
200 y = –0.005x + 23 R2 = 0.964210 y = –0.007x + 22.13 R2 = 0.992220 y = –0.010x + 22.09 R2 = 0.804
Tensile force at the elasticitylimit FE (cN )
200 y = –0.034x + 71.26 R2 = 0.939210 y = –0.048x + 84.37 R2 = 0.798220 y = –0.050x + 86.72 R2 = 0.819
Table 3
Fig. 7. The influence of the heater temperature, T (°C)and the texturing speed, Vi (m/min), the ratio of surfacespeed of disc to linear speed of yarn D/Y remainingconstant 1.9, on Work of rapture, A (cN·cm) and Work
of rapture variation coefficient, CV A
Fig. 8. The influence of the heater temperature, T (°C)and the texturing speed, Vi (m/min), the ratio of surfacespeed of disc to linear speed of yarn D/Y remainingconstant 1.9, on Relative elongation at elasticity limit,
eE (%) and Tensile force at the elasticity limit FE (cN)
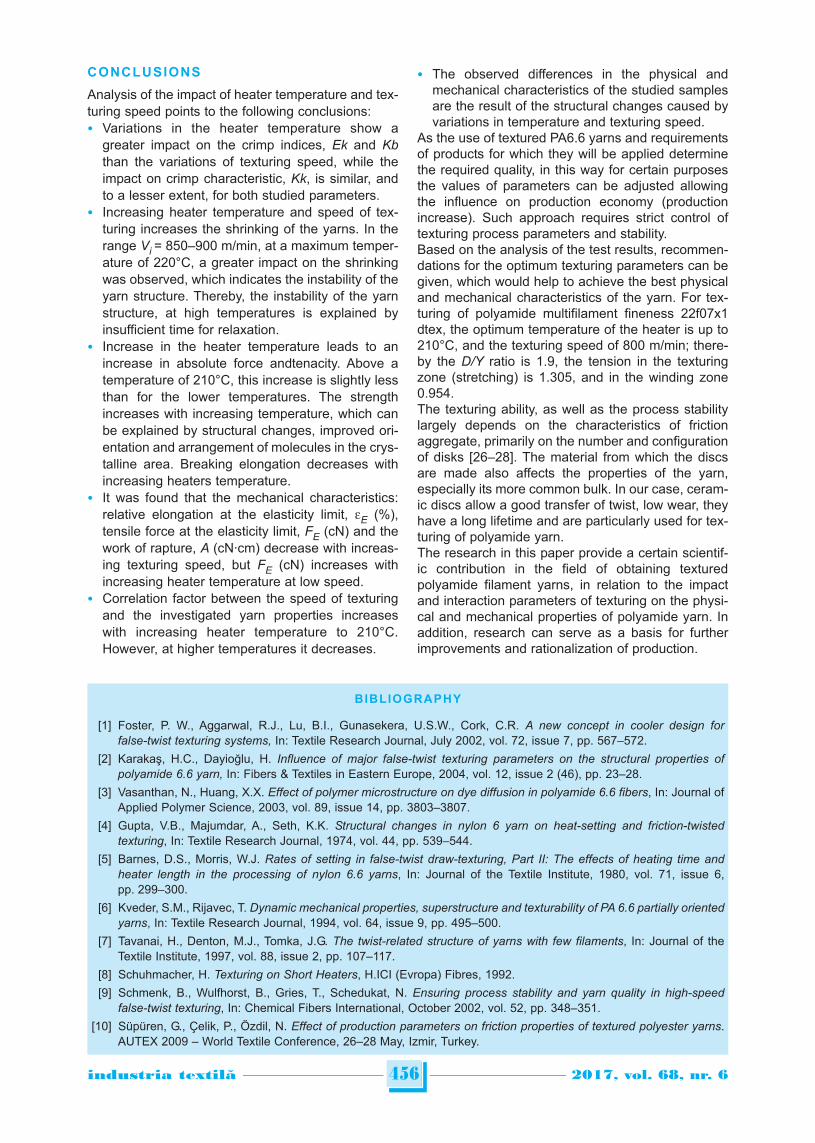
CONCLUSIONS
Analysis of the impact of heater temperature and tex-turing speed points to the following conclusions:• Variations in the heater temperature show a
greater impact on the crimp indices, Ek and Kbthan the variations of texturing speed, while theimpact on crimp characteristic, Kk, is similar, andto a lesser extent, for both studied parameters.
• Increasing heater temperature and speed of tex-turing increases the shrinking of the yarns. In therange Vi = 850–900 m/min, at a maximum temper-ature of 220°C, a greater impact on the shrinkingwas observed, which indicates the instability of theyarn structure. Thereby, the instability of the yarnstructure, at high temperatures is explained byinsufficient time for relaxation.
• Increase in the heater temperature leads to anincrease in absolute force andtenacity. Above atemperature of 210°C, this increase is slightly lessthan for the lower temperatures. The strengthincreases with increasing temperature, which canbe explained by structural changes, improved ori-entation and arrangement of molecules in the crys-talline area. Breaking elongation decreases withincreasing heaters temperature.
• It was found that the mechanical characteristics:relative elongation at the elasticity limit, eE (%),tensile force at the elasticity limit, FE (cN) and thework of rapture, A (cN·cm) decrease with increas-ing texturing speed, but FE (cN) increases withincreasing heater temperature at low speed.
• Correlation factor between the speed of texturingand the investigated yarn properties increaseswith increasing heater temperature to 210°C.However, at higher temperatures it decreases.
• The observed differences in the physical andmechanical characteristics of the studied samplesare the result of the structural changes caused byvariations in temperature and texturing speed.
As the use of textured PA6.6 yarns and requirementsof products for which they will be applied determinethe required quality, in this way for certain purposesthe values of parameters can be adjusted allowingthe influence on production economy (productionincrease). Such approach requires strict control oftexturing process parameters and stability. Based on the analysis of the test results, recommen-dations for the optimum texturing parameters can begiven, which would help to achieve the best physicaland mechanical characteristics of the yarn. For tex-turing of polyamide multifilament fineness 22f07x1dtex, the optimum temperature of the heater is up to210°C, and the texturing speed of 800 m/min; there-by the D/Y ratio is 1.9, the tension in the texturingzone (stretching) is 1.305, and in the winding zone0.954.The texturing ability, as well as the process stabilitylargely depends on the characteristics of frictionaggregate, primarily on the number and configurationof disks [26–28]. The material from which the discsare made also affects the properties of the yarn,especially its more common bulk. In our case, ceram-ic discs allow a good transfer of twist, low wear, theyhave a long lifetime and are particularly used for tex-turing of polyamide yarn.The research in this paper provide a certain scientif-ic contribution in the field of obtaining texturedpolyamide filament yarns, in relation to the impactand interaction parameters of texturing on the physi-cal and mechanical properties of polyamide yarn. Inaddition, research can serve as a basis for furtherimprovements and rationalization of production.
456industria textila 2017, vol. 68, nr. 6˘
BIBLIOGRAPHY
[1] Foster, P. W., Aggarwal, R.J., Lu, B.I., Gunasekera, U.S.W., Cork, C.R. A new concept in cooler design forfalse-twist texturing systems, In: Textile Research Journal, July 2002, vol. 72, issue 7, pp. 567–572.
[2] Karakaş, H.C., Dayioğlu, H. Influence of major false-twist texturing parameters on the structural properties ofpolyamide 6.6 yarn, In: Fibers & Textiles in Eastern Europe, 2004, vol. 12, issue 2 (46), pp. 23–28.
[3] Vasanthan, N., Huang, X.X. Effect of polymer microstructure on dye diffusion in polyamide 6.6 fibers, In: Journal ofApplied Polymer Science, 2003, vol. 89, issue 14, pp. 3803–3807.
[4] Gupta, V.B., Majumdar, A., Seth, K.K. Structural changes in nylon 6 yarn on heat-setting and friction-twistedtexturing, In: Textile Research Journal, 1974, vol. 44, pp. 539–544.
[5] Barnes, D.S., Morris, W.J. Rates of setting in false-twist draw-texturing, Part II: The effects of heating time andheater length in the processing of nylon 6.6 yarns, In: Journal of the Textile Institute, 1980, vol. 71, issue 6,pp. 299–300.
[6] Kveder, S.M., Rijavec, T. Dynamic mechanical properties, superstructure and texturability of PA 6.6 partially orientedyarns, In: Textile Research Journal, 1994, vol. 64, issue 9, pp. 495–500.
[7] Tavanai, H., Denton, M.J., Tomka, J.G. The twist-related structure of yarns with few filaments, In: Journal of theTextile Institute, 1997, vol. 88, issue 2, pp. 107–117.
[8] Schuhmacher, H. Texturing on Short Heaters, H.ICI (Evropa) Fibres, 1992.
[9] Schmenk, B., Wulfhorst, B., Gries, T., Schedukat, N. Ensuring process stability and yarn quality in high-speedfalse-twist texturing, In: Chemical Fibers Inter national, October 2002, vol. 52, pp. 348–351.
[10] Süpüren, G., Çelik, P., Özdil, N. Effect of production parameters on friction properties of textured polyester yarns.AUTEX 2009 – World Textile Conference, 26–28 May, Izmir, Turkey.
457industria textila 2017, vol. 68, nr. 6˘
[11] Rengasamy, R.S., Kothari, V.K., Patnaik, A. Effect of process variables and feeder yarn properties on the propertiesof core-and-effect and normal air-jet textured yarns, In: Textile Research Journal, 2004, vol. 74, issue 3,pp. 259–264.
[12] Kothari, V.K., Isthiaque, S.M., Ogale, V.G. Tensile properties of polyester/cotton blended yarns, In: Indian Journal ofFibre & Textile Research, 2002, vol. 27, issue 1, p. 48.
[13] Schmenk, B., Wulfhorst, B., Gries, T., Schedukat, N. New developments for online quality control in high-speedfalse-twist texturing, In: Chemical Fibers International, October 2002, vol. 52, pp. 352–353.
[14] Hearle, J.W.S., Hollick, L., Wilson, D.K. Yarn Texturing Technology, Woodhead Pub: Cambridge, 2001.
[15] Wulfhorst, B., Meier, K. Investigations on a short high temperature heater, In: Chemiefasern – Textilindustrie,January/February 1993, vol. 43/95, p.40.
[16] Demir, A., Behery, H.M. Synthetic Filament Yarn Texturing Technology, Prentice Hall: New Jersey, 1997.
[17] Karakaş, H.C., Dayioğlu, H., Veit, D. Performance of polyester POY on false-twist texturing machines withhigh-temperature heater, In: Chemical Fibers International, 1998, vol. 48, p. 527.
[18] Yildirim, K., Altun, S., Ulcay, Y. Relationship between yarn properties and process parameters in false-twist texturedyarn, In: Journal of Engineered Fibers and Fabrics, 2009, vol. 4, issue 2, pp. 26–32.
[19] Wang, Q., Jiankun Wang, J., Cheng, L. Analysis of factors to influence yarn dynamical mechanical property, In:Modern applied science, 2009, vol. 3, issue 1, p. 117.
[20] Çelik, P., Özdil, N., Süpüre, G. Experimental investigation on the static and dynamic strength of false twist texturedpolyester yarns, In: Industria Textilã, 2011, vol. 62, issue 1, p. 38–43.
[21] Eskin, N. Analysis of a high temperature heater in a false twist texturing process, In: Energy Conversion andManagement, September 2003, vol. 44, issue 16, pp. 2531–2547.
[22] Jones, C.R., Mason, T. 9-Heat transfer in a false-twist-bulking process, In: Journal of the Textile Institute, March1971,vol. 62, issue 3, pp. 147–165
[23] SRPS EN ISO 2062 – Pređa u namotajima, određivanje prekidne sile i prekidnog izduženja pojedinačnih niti, 2012,pp. 1–19
[24] DIN 53840 – Determination of parameters for the crimp of textured filament yarns, november 1983, (in two parts).
[25] DIN 53866 – Testing of textiles; shrinkage of single and plied yarns, determination of shrinkage in water, 1979.
[26] Endo, T., Shintaku, S., Kinari, T. Mechanics of disk-type false twisting, Part I: Yarn path and friction force on a singledisk, In: Textile Research Journal, February 2003; vol. 73, pp. 139–146.
[27] Endo, T., Shintaku, S., Kinari, T. Mechanics of disk-type false twisting, Part II: Yarn path and yarn inclination anglein a multiple-disk spindle unit, In: Textile Research Journal, 2003, vol. 73, pp. 192–199
[28] Weinsdörfer, H. Measures for increasing output in texturing, In: Chemical Fibers International, October 2001,vol. 51, pp. 370–372.
Authors:
MARIJA SAVIC1
PhD Full Professor DUSAN TRAJKOVIC1
PhD Full Professor JOVAN STEPANOVIC1
PETAR STOJANOVIC2
PhD Full Professor MIRJANA KOSTIC3
PhD Research Associate DIVNA MAJSTOROVIC4
1 University of Niš – Faculty of TechnologyBulevar oslobođenja 124, 16 000 Leskovac, Serbia
2 Dunav a.d., Grocka, SerbiaBulevar revolucije 15, 11306 Grocka, Serbia
3 University of Belgrade – Faculty of Technology and MetallurgyDepartment of Textile Engineering
Karnegijeva 4, 11000 Belgrade, Serbia4 Institute of General and Physical Chemistry
Studentski trg 12, 11158 Belgrade, Serbia
Corresponding author:
MARIJA SAVICe-mail: [email protected]
INTRODUCTION
Men’s jacket is constructed of many parts, items. It isa multi-layered garment made of main fabric, linings,interlinings, shoulder pad and body canvas interlin-ing. The first layer is the main fabric, the second layeris the interlining and the third layer is the lining.Adhesive interlining is generally used in parts such asthe front, side, upper shoulder and hemline of jacketsto increase textile rigidity [1]. The interlining is pro-duced in various types according to the fabric prop-erties and usage place. Interlining consists of wovensurface and dot type adhesive material placed onsurface and used to increase fabric rigidity [1].Number of adhesive dots in per square centimeter islocated over the interlining is a factor in classifyingthe interlining. The lining of a garment can commonly be used andbest described as a supportive fabric [2]. The lining ofthe suit jacket can be categorized into two generalgroups: natural andsynthetic [2–3].Consumers require from clothing not only looks butalso feeling good. Comfort is getting more and moreimportant key parameter in clothing [4]. Consumersrequire from clothing; lightweight, optimal thermaland humidity transport capability, air permeable fabriclayers, a pattern that allows you move comfortably,no skin irritation (interaction between fabric surface
structure and the skin of user, often expressed asfeelings of softness, smoothness, prickliness etc.) [5].There are many studies about the thermal comfort ofproperties of interlining, lining and jacket fabrics per-formance and comfort properties in the literature[1–3, 6–10]. But in many studies lining, interlining andfabrics are evaluated with their own performanceparameters. In addition to these studies all these fab-rics and materials also should be evaluated togetheras multilayer conditions to measure their thermo-physiological comfort properties and to understandthe real condition comfort of jacket.The aim of this study was to evaluate thermal comfortproperties of men’s jacket fabrics and supportivematerials (lining, interlining) as mono and multilayer.We have investigated and compared the air perme-ability, thermal resistance, thermal conductivity andrelative water vapour permeability properties of jacketfabrics with different adhesive interlinings and linings.
EXPERIMENTAL
Materials and methods
In this study six types of fabrics, four types of inter-linings and two types of linings commonly used inmen’s jacket production were tested. Tested fabrics,interlinings and linings properties were given intable 1–3.
Investigating the thermal comfort properties of men’s jacket as singleand multiple layered material
AKCAGUN ENGIN YILMAZ ABDURRAHIMÖZ CEVIZ NURAY MAZARI ADNAN
REZUMAT – ABSTRACT
Investigarea proprietăților de confort termic ale jachetelor bărbătești din materiale mono- și multistrat
Jacheta pentru bărbați este o îmbrăcăminte realizată prin combinarea țesăturilor, a materialelor de umplere și acăptușelii. Aceste materiale au propriile lor caracteristici de confort termic. În această lucrare, sunt investigateproprietățile de confort termic ale materialelor, monostrat și multistrat din componența jachetei. Materialele monostratau fost testste în prima configurație. Apoi materialele de umplere au fost fixate pe țesături și au fost efectuate teste cudublu strat. În cele din urmă, țesăturile, materialul de umplutură și căptușeala au fost testate ca triplu strat. Conformrezultatelor testelor, creșterea numărului de straturi determină scăderea permeabilității la aer și la vaporii de apă șidetermină o creștere a rezistenței termice a materialului.
Cuvinte-cheie: jachetă bărbătească, material de umplere, căptușeală, confort termic
Investigating the thermal comfort properties of men’s jacket as single and multiple layered material
Men’s jacket is a garment made by combining fabrics, interlining and lining materials. These materials have their ownthermal comfort features. In this work, the thermal comfort properties of the materials forming the jacket are investigatedas mono layer and multilayer. The materials were tested as a single layer in first configuration. Then interlinings werefixed to fabrics and tests have been carried out as two layers. Finally, fabrics, interlinings and linings were tested as triplelayer. According to the test results, the increase in the number of layers causes the decrease in air and water vapourpermeability, and causes increase in the thermal resistance of the material.
Keywords: men’s jacket, fabric, interlining, lining, thermal comfort
458industria textila 2017, vol. 68, nr. 6˘
DOI: 10.35530/IT.068.06.1501
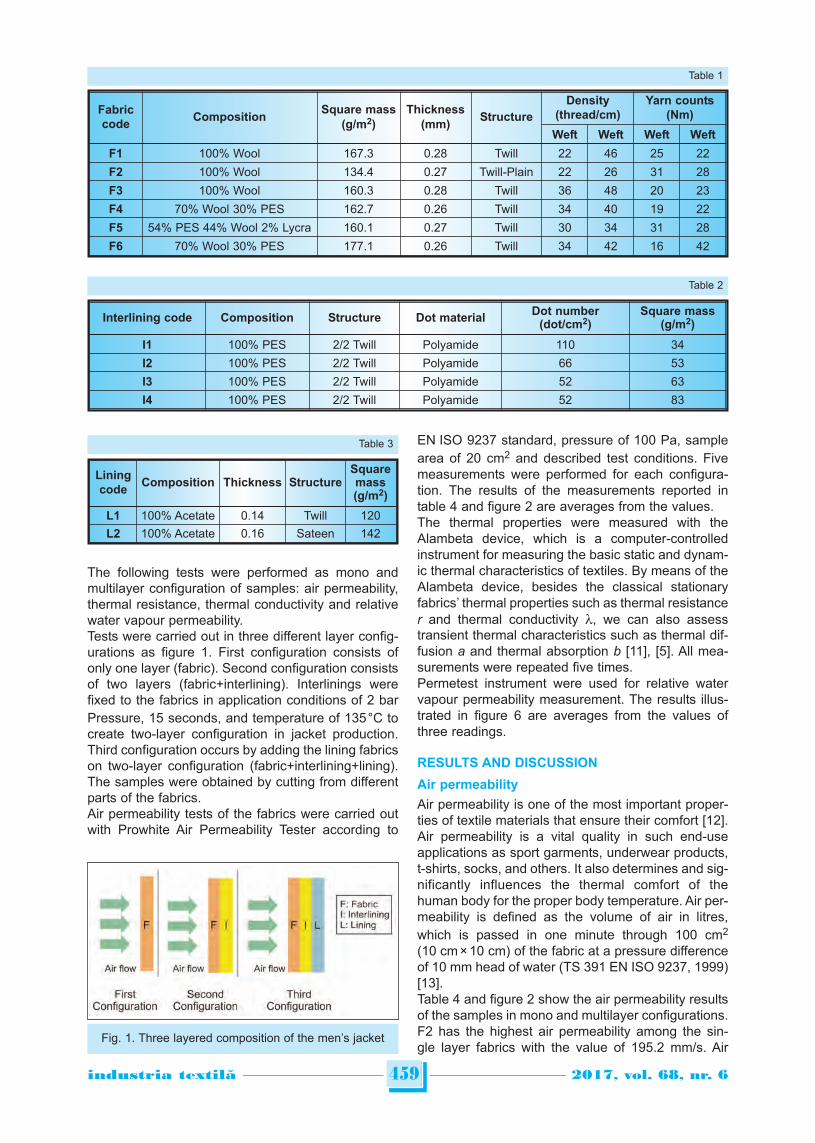
The following tests were performed as mono andmultilayer configuration of samples: air permeability,thermal resistance, thermal conductivity and relativewater vapour permeability.Tests were carried out in three different layer config-urations as figure 1. First configuration consists ofonly one layer (fabric). Second configuration consistsof two layers (fabric+interlining). Interlinings werefixed to the fabrics in application conditions of 2 barPressure, 15 seconds, and temperature of 135°C tocreate two-layer configuration in jacket production.Third configuration occurs by adding the lining fabricson two-layer configuration (fabric+interlining+lining).The samples were obtained by cutting from differentparts of the fabrics.Air permeability tests of the fabrics were carried outwith Prowhite Air Permeability Tester according to
EN ISO 9237 standard, pressure of 100 Pa, samplearea of 20 cm2 and described test conditions. Fivemeasurements were performed for each configura-tion. The results of the measurements reported intable 4 and figure 2 are averages from the values.The thermal properties were measured with theAlambeta device, which is a computer-controlledinstrument for measuring the basic static and dynam-ic thermal characteristics of textiles. By means of theAlambeta device, besides the classical stationaryfabrics’ thermal properties such as thermal resistancer and thermal conductivity l, we can also assesstransient thermal characteristics such as thermal dif-fusion a and thermal absorption b [11], [5]. All mea-surements were repeated five times. Permetest instrument were used for relative watervapour permeability measurement. The results illus-trated in figure 6 are averages from the values ofthree readings.
RESULTS AND DISCUSSION
Air permeability
Air permeability is one of the most important proper-ties of textile materials that ensure their comfort [12].Air permeability is a vital quality in such end-useapplications as sport garments, underwear products,t-shirts, socks, and others. It also determines and sig-nificantly influences the thermal comfort of thehuman body for the proper body temperature. Air per-meability is defined as the volume of air in litres,which is passed in one minute through 100 cm2
(10 cm × 10 cm) of the fabric at a pressure differenceof 10 mm head of water (TS 391 EN ISO 9237, 1999)[13].Table 4 and figure 2 show the air permeability resultsof the samples in mono and multilayer configurations.F2 has the highest air permeability among the sin-gle layer fabrics with the value of 195.2 mm/s. Air
459industria textila 2017, vol. 68, nr. 6˘
Fig. 1. Three layered composition of the men’s jacket
Liningcode
Composition Thickness StructureSquaremass(g/m2)
L1 100% Acetate 0.14 Twill 120L2 100% Acetate 0.16 Sateen 142
Table 3
Fabriccode
CompositionSquare mass
(g/m2)Thickness
(mm)Structure
Density(thread/cm)
Yarn counts(Nm)
Weft Weft Weft Weft
F1 100% Wool 167.3 0.28 Twill 22 46 25 22
F2 100% Wool 134.4 0.27 Twill-Plain 22 26 31 28
F3 100% Wool 160.3 0.28 Twill 36 48 20 23
F4 70% Wool 30% PES 162.7 0.26 Twill 34 40 19 22
F5 54% PES 44% Wool 2% Lycra 160.1 0.27 Twill 30 34 31 28
F6 70% Wool 30% PES 177.1 0.26 Twill 34 42 16 42
Table 1
Interlining code Composition Structure Dot materialDot number
(dot/cm2)Square mass
(g/m2)
I1 100% PES 2/2 Twill Polyamide 110 34
I2 100% PES 2/2 Twill Polyamide 66 53
I3 100% PES 2/2 Twill Polyamide 52 63
I4 100% PES 2/2 Twill Polyamide 52 83
Table 2
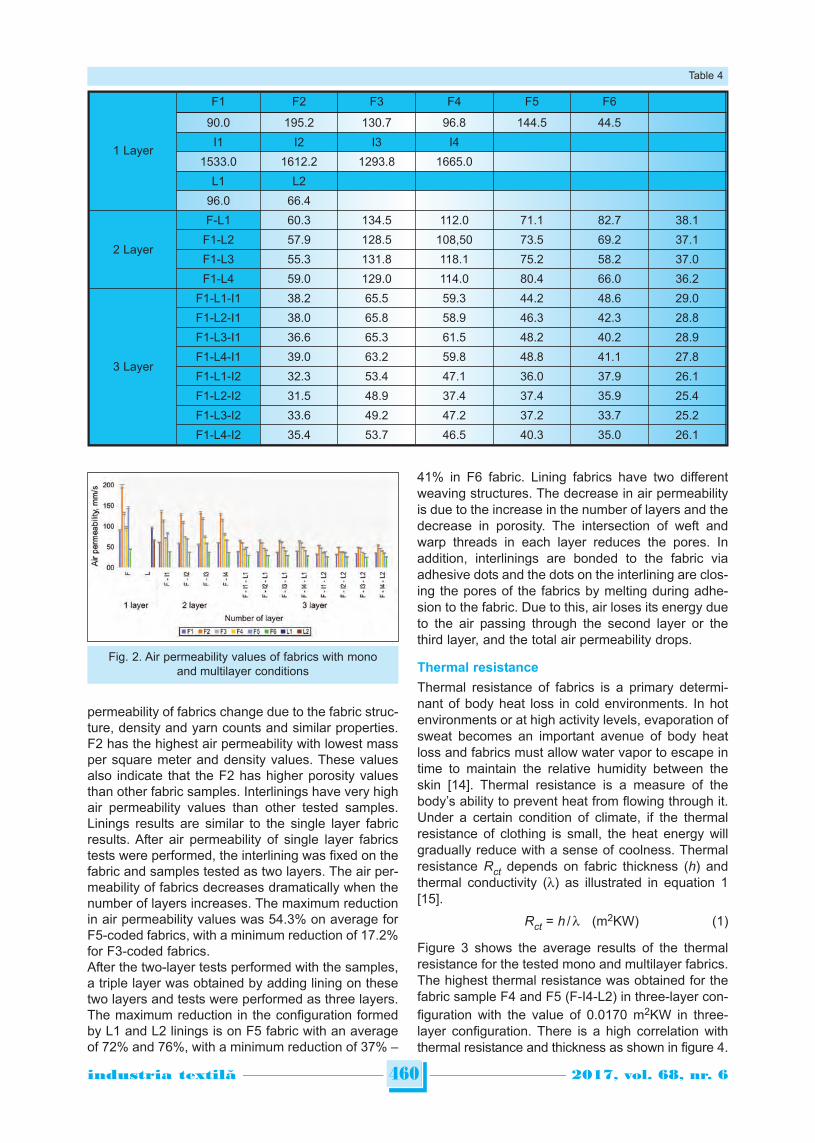
permeability of fabrics change due to the fabric struc-ture, density and yarn counts and similar properties.F2 has the highest air permeability with lowest massper square meter and density values. These valuesalso indicate that the F2 has higher porosity valuesthan other fabric samples. Interlinings have very highair permeability values than other tested samples.Linings results are similar to the single layer fabricresults. After air permeability of single layer fabricstests were performed, the interlining was fixed on thefabric and samples tested as two layers. The air per-meability of fabrics decreases dramatically when thenumber of layers increases. The maximum reductionin air permeability values was 54.3% on average forF5-coded fabrics, with a minimum reduction of 17.2%for F3-coded fabrics.After the two-layer tests performed with the samples,a triple layer was obtained by adding lining on thesetwo layers and tests were performed as three layers.The maximum reduction in the configuration formedby L1 and L2 linings is on F5 fabric with an averageof 72% and 76%, with a minimum reduction of 37% –
41% in F6 fabric. Lining fabrics have two differentweaving structures. The decrease in air permeabilityis due to the increase in the number of layers and thedecrease in porosity. The intersection of weft andwarp threads in each layer reduces the pores. Inaddition, interlinings are bonded to the fabric viaadhesive dots and the dots on the interlining are clos-ing the pores of the fabrics by melting during adhe-sion to the fabric. Due to this, air loses its energy dueto the air passing through the second layer or thethird layer, and the total air permeability drops.
Thermal resistance
Thermal resistance of fabrics is a primary determi-nant of body heat loss in cold environments. In hotenvironments or at high activity levels, evaporation ofsweat becomes an important avenue of body heatloss and fabrics must allow water vapor to escape intime to maintain the relative humidity between theskin [14]. Thermal resistance is a measure of thebody’s ability to prevent heat from flowing through it.Under a certain condition of climate, if the thermalresistance of clothing is small, the heat energy willgradually reduce with a sense of coolness. Thermalresistance Rct depends on fabric thickness (h) andthermal conductivity (l) as illustrated in equation 1[15].
Rct = h / l (m2KW) (1)
Figure 3 shows the average results of the thermalresistance for the tested mono and multilayer fabrics.The highest thermal resistance was obtained for thefabric sample F4 and F5 (F-I4-L2) in three-layer con-figuration with the value of 0.0170 m2KW in three-layer configuration. There is a high correlation withthermal resistance and thickness as shown in figure 4.
460industria textila 2017, vol. 68, nr. 6˘
Fig. 2. Air permeability values of fabrics with monoand multilayer conditions
Table 4
1 Layer
F1 F2 F3 F4 F5 F6
90.0 195.2 130.7 96.8 144.5 44.5
I1 I2 I3 I4
1533.0 1612.2 1293.8 1665.0
L1 L2
96.0 66.4
2 Layer
F-L1 60.3 134.5 112.0 71.1 82.7 38.1
F1-L2 57.9 128.5 108,50 73.5 69.2 37.1
F1-L3 55.3 131.8 118.1 75.2 58.2 37.0
F1-L4 59.0 129.0 114.0 80.4 66.0 36.2
3 Layer
F1-L1-I1 38.2 65.5 59.3 44.2 48.6 29.0
F1-L2-I1 38.0 65.8 58.9 46.3 42.3 28.8
F1-L3-I1 36.6 65.3 61.5 48.2 40.2 28.9
F1-L4-I1 39.0 63.2 59.8 48.8 41.1 27.8
F1-L1-I2 32.3 53.4 47.1 36.0 37.9 26.1
F1-L2-I2 31.5 48.9 37.4 37.4 35.9 25.4
F1-L3-I2 33.6 49.2 47.2 37.2 33.7 25.2
F1-L4-I2 35.4 53.7 46.5 40.3 35.0 26.1
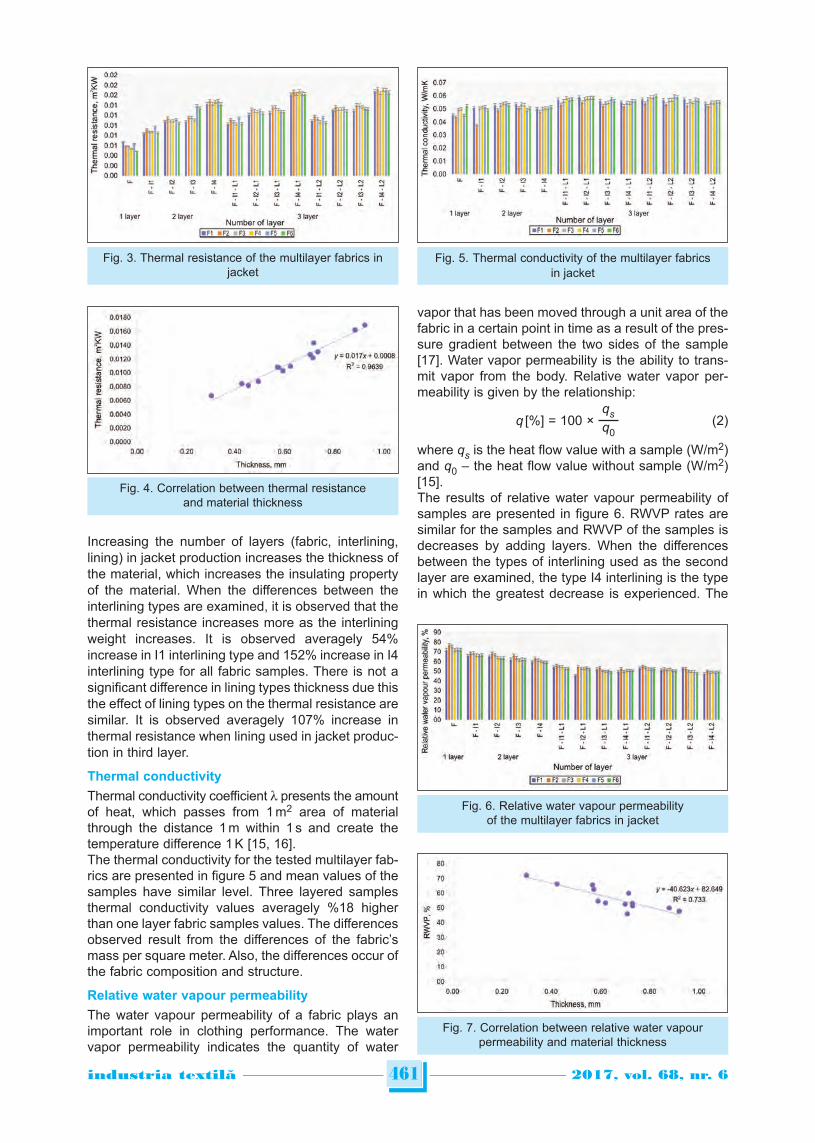
Increasing the number of layers (fabric, interlining,lining) in jacket production increases the thickness ofthe material, which increases the insulating propertyof the material. When the differences between theinterlining types are examined, it is observed that thethermal resistance increases more as the interliningweight increases. It is observed averagely 54%increase in I1 interlining type and 152% increase in I4interlining type for all fabric samples. There is not asignificant difference in lining types thickness due thisthe effect of lining types on the thermal resistance aresimilar. It is observed averagely 107% increase inthermal resistance when lining used in jacket produc-tion in third layer.
Thermal conductivity
Thermal conductivity coefficient l presents the amountof heat, which passes from 1 m2 area of materialthrough the distance 1 m within 1 s and create thetemperature difference 1 K [15, 16].The thermal conductivity for the tested multilayer fab-rics are presented in figure 5 and mean values of thesamples have similar level. Three layered samplesthermal conductivity values averagely %18 higherthan one layer fabric samples values. The differencesobserved result from the differences of the fabric’smass per square meter. Also, the differences occur ofthe fabric composition and structure.
Relative water vapour permeability
The water vapour permeability of a fabric plays animportant role in clothing performance. The watervapor permeability indicates the quantity of water
vapor that has been moved through a unit area of thefabric in a certain point in time as a result of the pres-sure gradient between the two sides of the sample[17]. Water vapor permeability is the ability to trans-mit vapor from the body. Relative water vapor per-meability is given by the relationship:
qsq [%] = 100 × (2)q0
where qs is the heat flow value with a sample (W/m2)and q0 – the heat flow value without sample (W/m2)[15].The results of relative water vapour permeability ofsamples are presented in figure 6. RWVP rates aresimilar for the samples and RWVP of the samples isdecreases by adding layers. When the differencesbetween the types of interlining used as the secondlayer are examined, the type I4 interlining is the typein which the greatest decrease is experienced. The
461industria textila 2017, vol. 68, nr. 6˘
Fig. 5. Thermal conductivity of the multilayer fabricsin jacket
Fig. 6. Relative water vapour permeabilityof the multilayer fabrics in jacket
Fig. 7. Correlation between relative water vapourpermeability and material thickness
Fig. 3. Thermal resistance of the multilayer fabrics injacket
Fig. 4. Correlation between thermal resistanceand material thickness
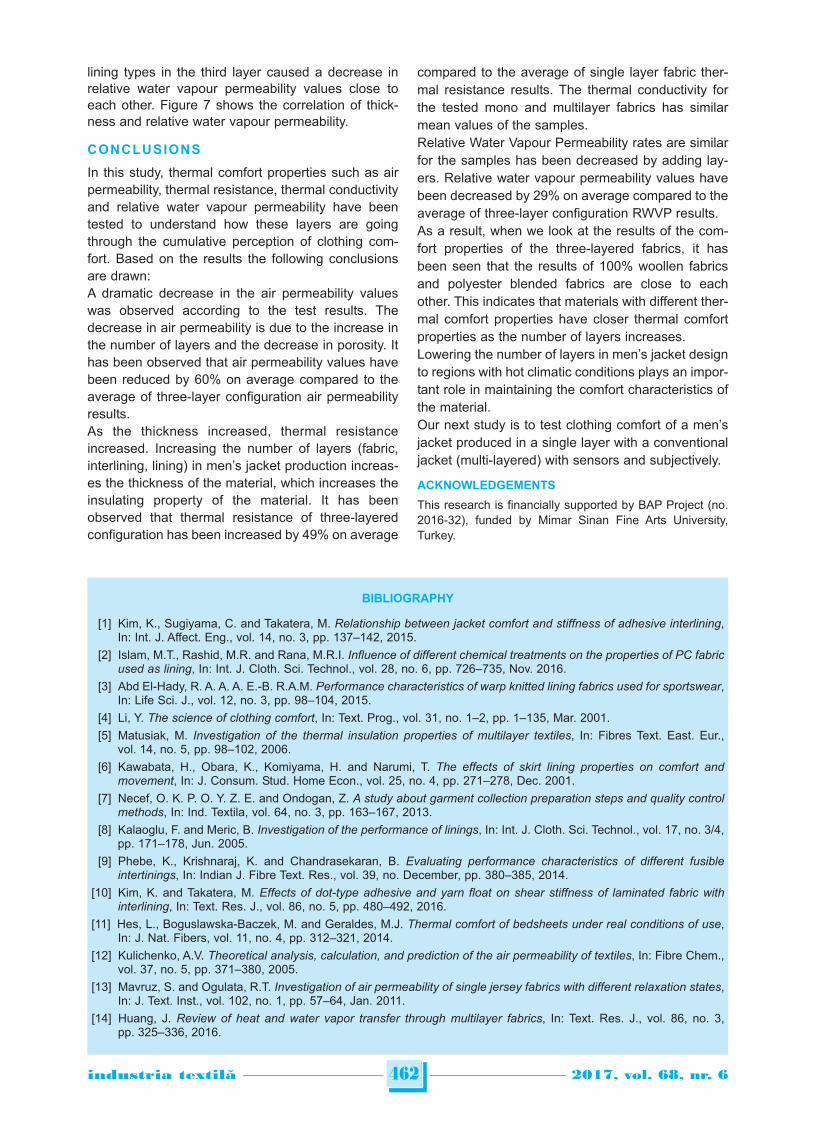
lining types in the third layer caused a decrease inrelative water vapour permeability values close toeach other. Figure 7 shows the correlation of thick-ness and relative water vapour permeability.
CONCLUSIONS
In this study, thermal comfort properties such as airpermeability, thermal resistance, thermal conductivityand relative water vapour permeability have beentested to understand how these layers are goingthrough the cumulative perception of clothing com-fort. Based on the results the following conclusionsare drawn:A dramatic decrease in the air permeability valueswas observed according to the test results. Thedecrease in air permeability is due to the increase inthe number of layers and the decrease in porosity. Ithas been observed that air permeability values havebeen reduced by 60% on average compared to theaverage of three-layer configuration air permeabilityresults.As the thickness increased, thermal resistanceincreased. Increasing the number of layers (fabric,interlining, lining) in men’s jacket production increas-es the thickness of the material, which increases theinsulating property of the material. It has beenobserved that thermal resistance of three-layeredconfiguration has been increased by 49% on average
compared to the average of single layer fabric ther-mal resistance results. The thermal conductivity forthe tested mono and multilayer fabrics has similarmean values of the samples. Relative Water Vapour Permeability rates are similarfor the samples has been decreased by adding lay-ers. Relative water vapour permeability values havebeen decreased by 29% on average compared to theaverage of three-layer configuration RWVP results.As a result, when we look at the results of the com-fort properties of the three-layered fabrics, it hasbeen seen that the results of 100% woollen fabricsand polyester blended fabrics are close to eachother. This indicates that materials with different ther-mal comfort properties have closer thermal comfortproperties as the number of layers increases.Lowering the number of layers in men’s jacket designto regions with hot climatic conditions plays an impor-tant role in maintaining the comfort characteristics ofthe material.Our next study is to test clothing comfort of a men’sjacket produced in a single layer with a conventionaljacket (multi-layered) with sensors and subjectively.
ACKNOWLEDGEMENTS
This research is financially supported by BAP Project (no.2016-32), funded by Mimar Sinan Fine Arts University,Turkey.
462industria textila 2017, vol. 68, nr. 6˘
BIBLIOGRAPHY
[1] Kim, K., Sugiyama, C. and Takatera, M. Relationship between jacket comfort and stiffness of adhesive interlining,In: Int. J. Affect. Eng., vol. 14, no. 3, pp. 137–142, 2015.
[2] Islam, M.T., Rashid, M.R. and Rana, M.R.I. Influence of different chemical treatments on the properties of PC fabricused as lining, In: Int. J. Cloth. Sci. Technol., vol. 28, no. 6, pp. 726–735, Nov. 2016.
[3] Abd El-Hady, R. A. A. A. E.-B. R.A.M. Performance characteristics of warp knitted lining fabrics used for sportswear,In: Life Sci. J., vol. 12, no. 3, pp. 98–104, 2015.
[4] Li, Y. The science of clothing comfort, In: Text. Prog., vol. 31, no. 1–2, pp. 1–135, Mar. 2001.[5] Matusiak, M. Investigation of the thermal insulation properties of multilayer textiles, In: Fibres Text. East. Eur.,
vol. 14, no. 5, pp. 98–102, 2006.[6] Kawabata, H., Obara, K., Komiyama, H. and Narumi, T. The effects of skirt lining properties on comfort and
movement, In: J. Consum. Stud. Home Econ., vol. 25, no. 4, pp. 271–278, Dec. 2001.[7] Necef, O. K. P. O. Y. Z. E. and Ondogan, Z. A study about garment collection preparation steps and quality control
methods, In: Ind. Textila, vol. 64, no. 3, pp. 163–167, 2013.[8] Kalaoglu, F. and Meric, B. Investigation of the performance of linings, In: Int. J. Cloth. Sci. Technol., vol. 17, no. 3/4,
pp. 171–178, Jun. 2005.[9] Phebe, K., Krishnaraj, K. and Chandrasekaran, B. Evaluating performance characteristics of different fusible
intertinings, In: Indian J. Fibre Text. Res., vol. 39, no. December, pp. 380–385, 2014.[10] Kim, K. and Takatera, M. Effects of dot-type adhesive and yarn float on shear stiffness of laminated fabric with
interlining, In: Text. Res. J., vol. 86, no. 5, pp. 480–492, 2016.[11] Hes, L., Boguslawska-Baczek, M. and Geraldes, M.J. Thermal comfort of bedsheets under real conditions of use,
In: J. Nat. Fibers, vol. 11, no. 4, pp. 312–321, 2014.[12] Kulichenko, A.V. Theoretical analysis, calculation, and prediction of the air permeability of textiles, In: Fibre Chem.,
vol. 37, no. 5, pp. 371–380, 2005.[13] Mavruz, S. and Ogulata, R.T. Investigation of air permeability of single jersey fabrics with different relaxation states,
In: J. Text. Inst., vol. 102, no. 1, pp. 57–64, Jan. 2011.[14] Huang, J. Review of heat and water vapor transfer through multilayer fabrics, In: Text. Res. J., vol. 86, no. 3,
pp. 325–336, 2016.
463industria textila 2017, vol. 68, nr. 6˘
Authors:
AKCAGUN ENGIN1
YILMAZ ABDURRAHIM1
ÖZ CEVIZ NURAY2
MAZARI ADNAN3
1 Mimar Sinan Fine Arts University, Vocational School
Cumhuriyet Dist. Silahsor St. No:71, Istanbul, Turkey
2 Marmara University, Vocational School of Technical Sciences
MU Goztepe Campus, Kadikoy, 34722, Istanbul, Turkey
3 Technical University of Liberec, Faculty of Textile Engineering
Department of Textile Clothing
Studentska 2, Liberec, 461 17, Czech Republic
Corresponding author:
YILMAZ [email protected]
MAZARI ADNAN
[15] Ertekin, G. and Marmaralı, A. Heat, air and water vapor transfer properties of circular knitted spacer fabrics,In: Tekst. ve Konfeksiyon, vol. 21, no. 4, pp. 369–373, 2011.
[16] Hes, L. and Loghin, C. Heat, moisture and air transfer properties of selected woven fabrics in wet state, In: J. FiberBioeng. Informatics, vol. 2, no. 3, pp. 141–149, 2009.
[17] Kanakaraj, P., Dasaradan, B.S. and Ramachandran, R. The influence of double layer knit fabric structures on airand water vapor permeability, In: J. Text. Apparel, Technol. Manag., vol. 8, no. 3, pp. 1–9, 2013.
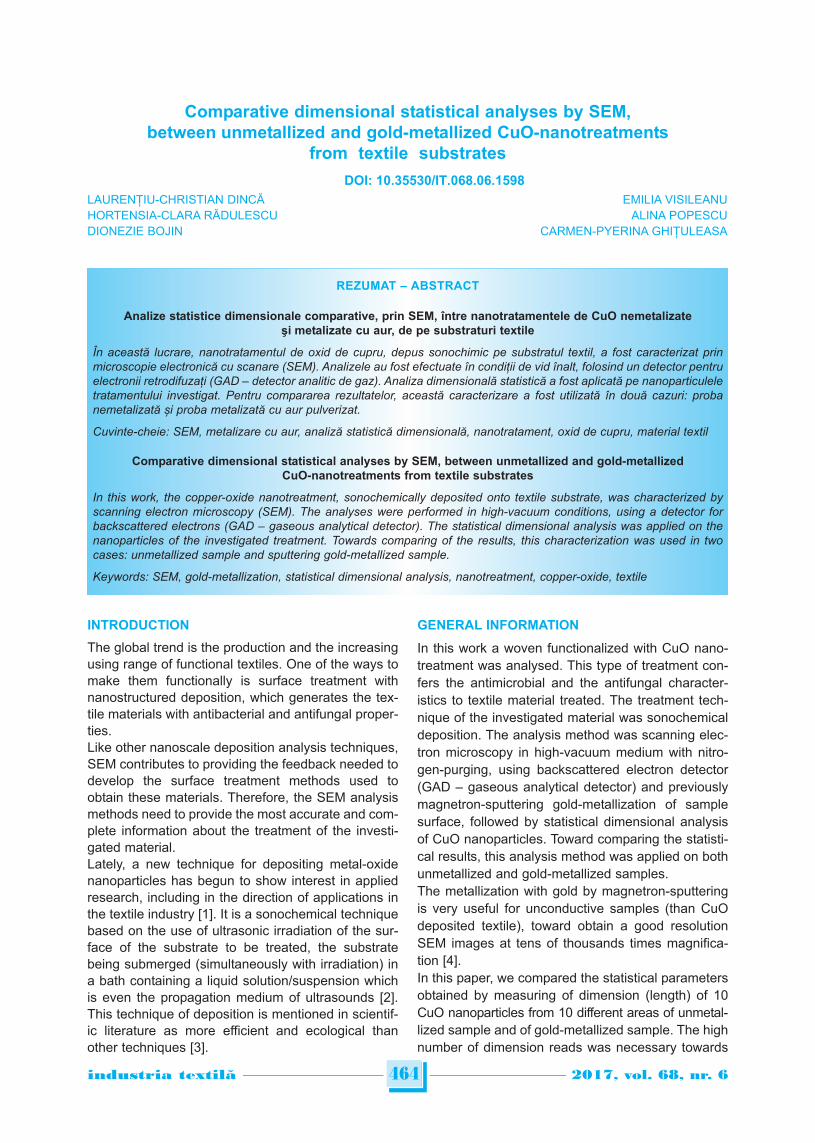
INTRODUCTION
The global trend is the production and the increasingusing range of functional textiles. One of the ways tomake them functionally is surface treatment withnanostructured deposition, which generates the tex-tile materials with antibacterial and antifungal proper-ties.Like other nanoscale deposition analysis techniques,SEM contributes to providing the feedback needed todevelop the surface treatment methods used toobtain these materials. Therefore, the SEM analysismethods need to provide the most accurate and com-plete information about the treatment of the investi-gated material.Lately, a new technique for depositing metal-oxidenanoparticles has begun to show interest in appliedresearch, including in the direction of applications inthe textile industry [1]. It is a sonochemical techniquebased on the use of ultrasonic irradiation of the sur-face of the substrate to be treated, the substratebeing submerged (simultaneously with irradiation) ina bath containing a liquid solution/suspension whichis even the propagation medium of ultrasounds [2].This technique of deposition is mentioned in scientif-ic literature as more efficient and ecological thanother techniques [3].
GENERAL INFORMATION
In this work a woven functionalized with CuO nano -treatment was analysed. This type of treatment con-fers the antimicrobial and the antifungal character-istics to textile material treated. The treatment tech-nique of the investigated material was sonochemicaldeposition. The analysis method was scanning elec-tron microscopy in high-vacuum medium with nitro-gen-purging, using backscattered electron detector(GAD – gaseous analytical detector) and previouslymagnetron-sputtering gold-metallization of samplesurface, followed by statistical dimensional analysisof CuO nanoparticles. Toward comparing the statisti-cal results, this analysis method was applied on bothunmetallized and gold-metallized samples.The metallization with gold by magnetron-sputteringis very useful for unconductive samples (than CuOdeposited textile), toward obtain a good resolutionSEM images at tens of thousands times magnifica-tion [4].In this paper, we compared the statistical parametersobtained by measuring of dimension (length) of 10CuO nanoparticles from 10 different areas of unmetal-lized sample and of gold-metallized sample. The highnumber of dimension reads was necessary towards
Comparative dimensional statistical analyses by SEM,between unmetallized and gold-metallized CuO-nanotreatments
from textile substrates
LAURENŢIU-CHRISTIAN DINCĂ EMILIA VISILEANUHORTENSIA-CLARA RĂDULESCU ALINA POPESCUDIONEZIE BOJIN CARMEN-PYERINA GHIȚULEASA
REZUMAT – ABSTRACT
Analize statistice dimensionale comparative, prin SEM, între nanotratamentele de CuO nemetalizateşi metalizate cu aur, de pe substraturi textile
În această lucrare, nanotratamentul de oxid de cupru, depus sonochimic pe substratul textil, a fost caracterizat prinmicroscopie electronică cu scanare (SEM). Analizele au fost efectuate în condiții de vid înalt, folosind un detector pentruelectronii retrodifuzați (GAD – detector analitic de gaz). Analiza dimensională statistică a fost aplicată pe nanoparticuleletratamentului investigat. Pentru compararea rezultatelor, această caracterizare a fost utilizată în două cazuri: probanemetalizată și proba metalizată cu aur pulverizat.
Cuvinte-cheie: SEM, metalizare cu aur, analiză statistică dimensională, nanotratament, oxid de cupru, material textil
Comparative dimensional statistical analyses by SEM, between unmetallized and gold-metallizedCuO-nanotreatments from textile substrates
In this work, the copper-oxide nanotreatment, sonochemically deposited onto textile substrate, was characterized byscanning electron microscopy (SEM). The analyses were performed in high-vacuum conditions, using a detector forbackscattered electrons (GAD – gaseous analytical detector). The statistical dimensional analysis was applied on thenanoparticles of the investigated treatment. Towards comparing of the results, this characterization was used in twocases: unmetallized sample and sputtering gold-metallized sample.
Keywords: SEM, gold-metallization, statistical dimensional analysis, nanotreatment, copper-oxide, textile
464industria textila 2017, vol. 68, nr. 6˘
DOI: 10.35530/IT.068.06.1598
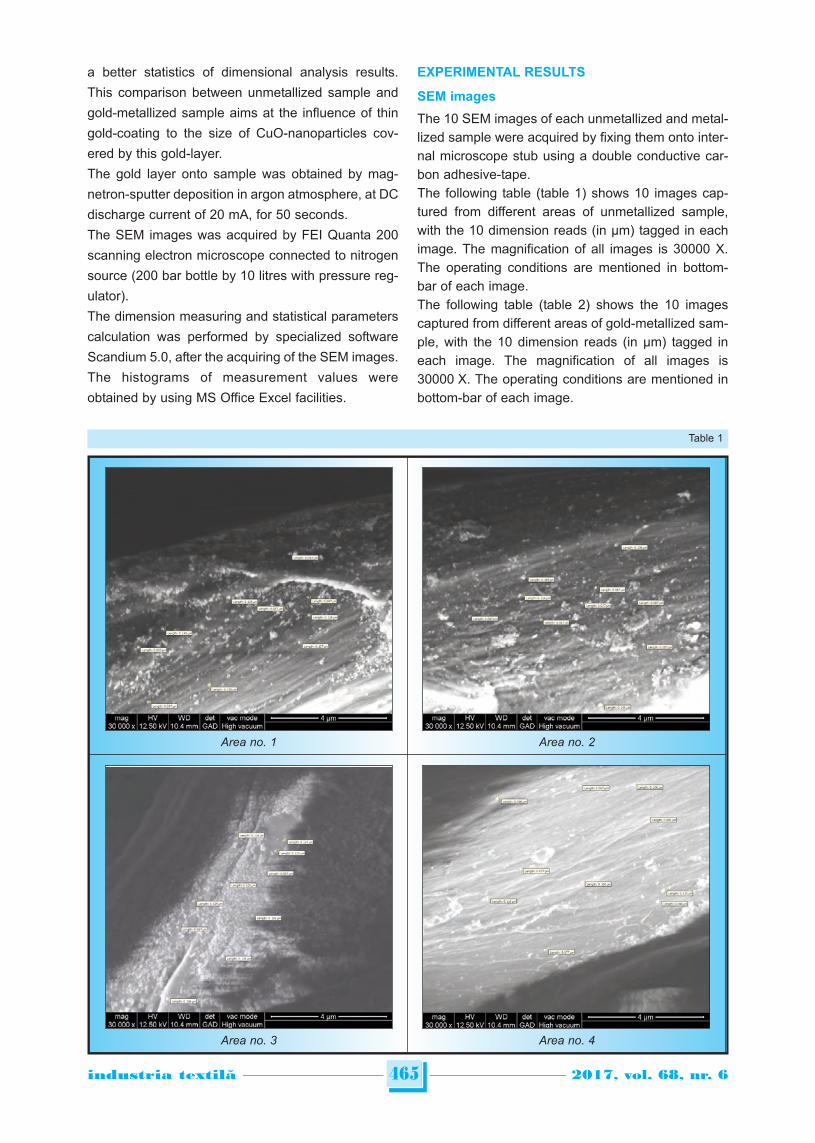
a better statistics of dimensional analysis results.
This comparison between unmetallized sample and
gold-metallized sample aims at the influence of thin
gold-coating to the size of CuO-nanoparticles cov-
ered by this gold-layer.
The gold layer onto sample was obtained by mag-
netron-sputter deposition in argon atmosphere, at DC
discharge current of 20 mA, for 50 seconds.
The SEM images was acquired by FEI Quanta 200
scanning electron microscope connected to nitrogen
source (200 bar bottle by 10 litres with pressure reg-
ulator).
The dimension measuring and statistical parameters
calculation was performed by specialized software
Scandium 5.0, after the acquiring of the SEM images.
The histograms of measurement values were
obtained by using MS Office Excel facilities.
EXPERIMENTAL RESULTS
SEM images
The 10 SEM images of each unmetallized and metal-lized sample were acquired by fixing them onto inter-nal microscope stub using a double conductive car-bon adhesive-tape.The following table (table 1) shows 10 images cap-tured from different areas of unmetallized sample,with the 10 dimension reads (in μm) tagged in eachimage. The magnification of all images is 30000 X.The operating conditions are mentioned in bottom-bar of each image.The following table (table 2) shows the 10 imagescaptured from different areas of gold-metallized sam-ple, with the 10 dimension reads (in μm) tagged ineach image. The magnification of all images is30000 X. The operating conditions are mentioned inbottom-bar of each image.
465industria textila 2017, vol. 68, nr. 6˘
Area no. 1 Area no. 2
Area no. 3 Area no. 4
Table 1
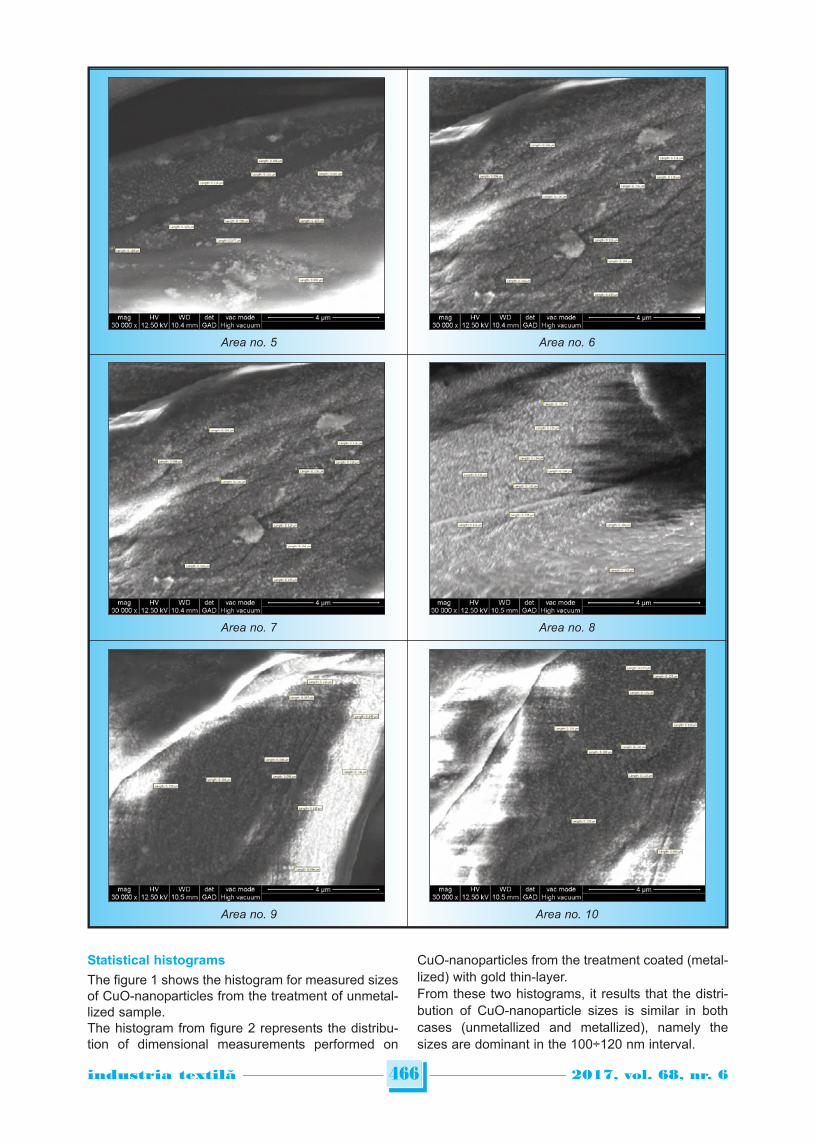
466industria textila 2017, vol. 68, nr. 6˘
Area no. 5 Area no. 6
Area no. 7 Area no. 8
Area no. 9 Area no. 10
Statistical histograms
The figure 1 shows the histogram for measured sizesof CuO-nanoparticles from the treatment of unmetal-lized sample.The histogram from figure 2 represents the distribu-tion of dimensional measurements performed on
CuO-nanoparticles from the treatment coated (metal-lized) with gold thin-layer.From these two histograms, it results that the distri-bution of CuO-nanoparticle sizes is similar in bothcases (unmetallized and metallized), namely thesizes are dominant in the 100÷120 nm interval.
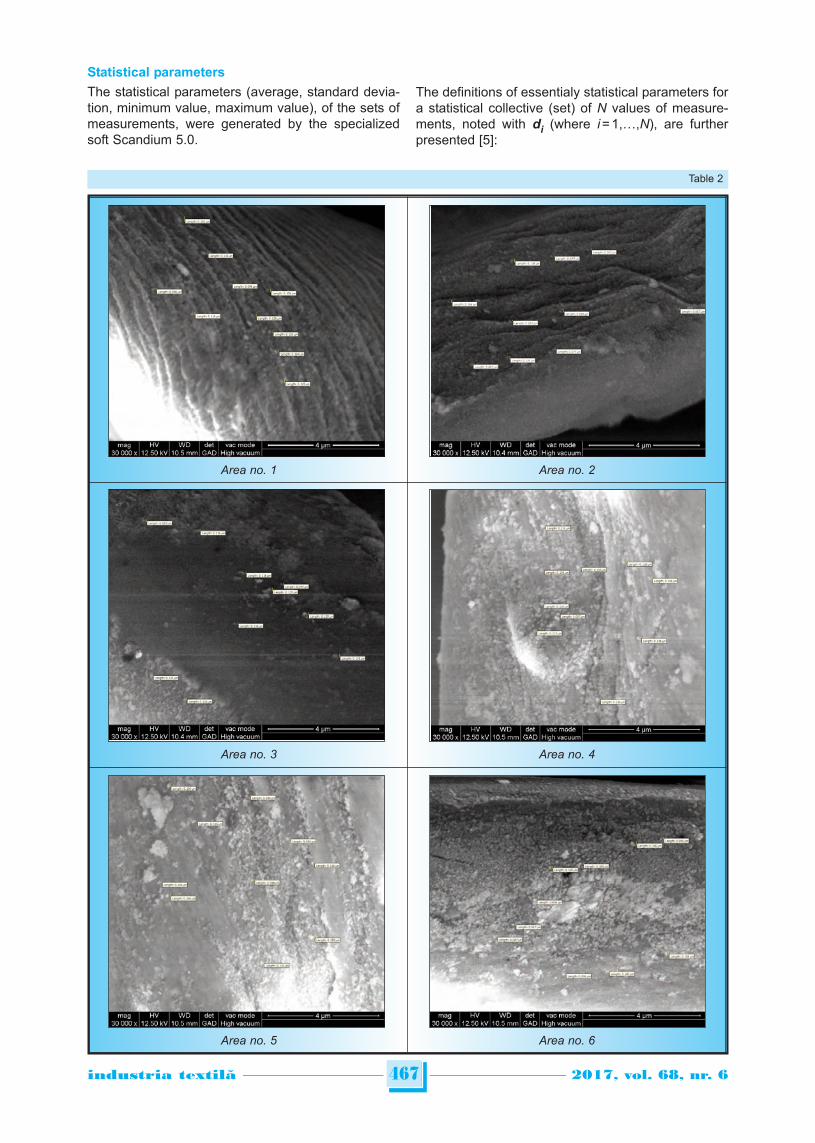
467industria textila 2017, vol. 68, nr. 6˘
Area no. 1 Area no. 2
Area no. 3 Area no. 4
Area no. 5 Area no. 6
Table 2
Statistical parameters
The statistical parameters (average, standard devia-tion, minimum value, maximum value), of the sets ofmeasurements, were generated by the specializedsoft Scandium 5.0.
The definitions of essentialy statistical parameters fora statistical collective (set) of N values of measure-ments, noted with di (where i = 1,…,N), are furtherpresented [5]:
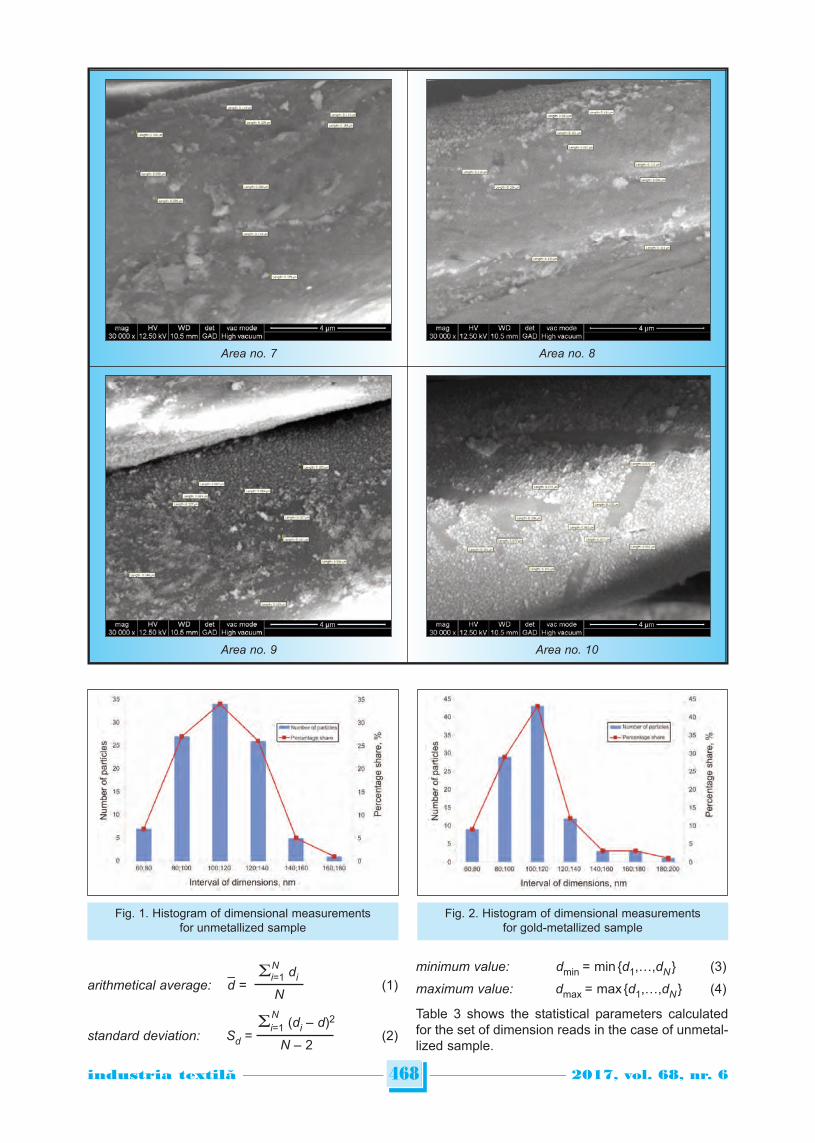
468industria textila 2017, vol. 68, nr. 6˘
Area no. 7 Area no. 8
Area no. 9 Area no. 10
Fig. 1. Histogram of dimensional measurementsfor unmetallized sample
Fig. 2. Histogram of dimensional measurementsfor gold-metallized sample
Ni=1 diarithmetical average: d = (1)
NN
i=1 (di – d)2
standard deviation: Sd = (2)N – 2
minimum value: dmin = min {d1,…,dN } (3)
maximum value: dmax = max {d1,…,dN } (4)
Table 3 shows the statistical parameters calculatedfor the set of dimension reads in the case of unmetal-lized sample.
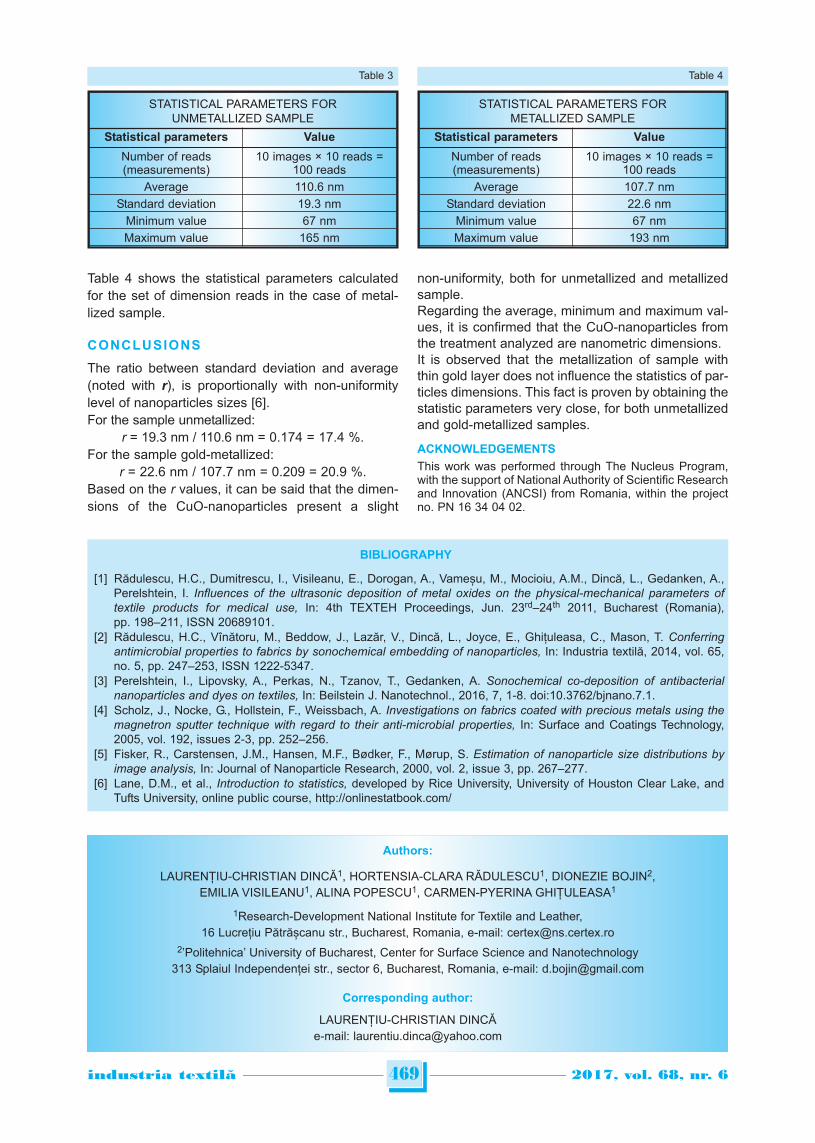
Table 4 shows the statistical parameters calculatedfor the set of dimension reads in the case of metal-lized sample.
CONCLUSIONS
The ratio between standard deviation and average(noted with r), is proportionally with non-uniformitylevel of nanoparticles sizes [6].For the sample unmetallized:
r = 19.3 nm / 110.6 nm = 0.174 = 17.4 %.For the sample gold-metallized:
r = 22.6 nm / 107.7 nm = 0.209 = 20.9 %.Based on the r values, it can be said that the dimen-sions of the CuO-nanoparticles present a slight
non-uniformity, both for unmetallized and metallizedsample.Regarding the average, minimum and maximum val-ues, it is confirmed that the CuO-nanoparticles fromthe treatment analyzed are nanometric dimensions.It is observed that the metallization of sample withthin gold layer does not influence the statistics of par-ticles dimensions. This fact is proven by obtaining thestatistic parameters very close, for both unmetallizedand gold-metallized samples.
ACKNOWLEDGEMENTS
This work was performed through The Nucleus Program,with the support of National Authority of Scientific Researchand Innovation (ANCSI) from Romania, within the projectno. PN 16 34 04 02.
469industria textila 2017, vol. 68, nr. 6˘
STATISTICAL PARAMETERS FORUNMETALLIZED SAMPLE
Statistical parameters Value
Number of reads(measurements)
10 images × 10 reads =100 reads
Average 110.6 nmStandard deviation 19.3 nm
Minimum value 67 nmMaximum value 165 nm
Table 3
STATISTICAL PARAMETERS FORMETALLIZED SAMPLE
Statistical parameters Value
Number of reads(measurements)
10 images × 10 reads =100 reads
Average 107.7 nmStandard deviation 22.6 nm
Minimum value 67 nmMaximum value 193 nm
Table 4
BIBLIOGRAPHY
[1] Rădulescu, H.C., Dumitrescu, I., Visileanu, E., Dorogan, A., Vameșu, M., Mocioiu, A.M., Dincă, L., Gedanken, A.,Perelshtein, I. Influences of the ultrasonic deposition of metal oxides on the physical-mechanical parameters oftextile products for medical use, In: 4th TEXTEH Proceedings, Jun. 23rd–24th 2011, Bucharest (Romania),pp. 198–211, ISSN 20689101.
[2] Rădulescu, H.C., Vînătoru, M., Beddow, J., Lazăr, V., Dincă, L., Joyce, E., Ghiţuleasa, C., Mason, T. Conferringantimicrobial properties to fabrics by sonochemical embedding of nanoparticles, In: Industria textilă, 2014, vol. 65,no. 5, pp. 247–253, ISSN 1222-5347.
[3] Perelshtein, I., Lipovsky, A., Perkas, N., Tzanov, T., Gedanken, A. Sonochemical co-deposition of antibacterialnanoparticles and dyes on textiles, In: Beilstein J. Nanotechnol., 2016, 7, 1-8. doi:10.3762/bjnano.7.1.
[4] Scholz, J., Nocke, G., Hollstein, F., Weissbach, A. Investigations on fabrics coated with precious metals using themagnetron sputter technique with regard to their anti-microbial properties, In: Surface and Coatings Technology,2005, vol. 192, issues 2-3, pp. 252–256.
[5] Fisker, R., Carstensen, J.M., Hansen, M.F., Bødker, F., Mørup, S. Estimation of nanoparticle size distributions byimage analysis, In: Journal of Nanoparticle Research, 2000, vol. 2, issue 3, pp. 267–277.
[6] Lane, D.M., et al., Introduction to statistics, developed by Rice University, University of Houston Clear Lake, andTufts University, online public course, http://onlinestatbook.com/
Authors:
LAURENŢIU-CHRISTIAN DINCĂ1, HORTENSIA-CLARA RĂDULESCU1, DIONEZIE BOJIN2,EMILIA VISILEANU1, ALINA POPESCU1, CARMEN-PYERINA GHIȚULEASA1
1Research-Development National Institute for Textile and Leather,16 Lucrețiu Pătrășcanu str., Bucharest, Romania, e-mail: [email protected]
2’Politehnica’ University of Bucharest, Center for Surface Science and Nanotechnology313 Splaiul Independenței str., sector 6, Bucharest, Romania, e-mail: [email protected]
Corresponding author:
LAURENŢIU-CHRISTIAN DINCĂe-mail: [email protected]
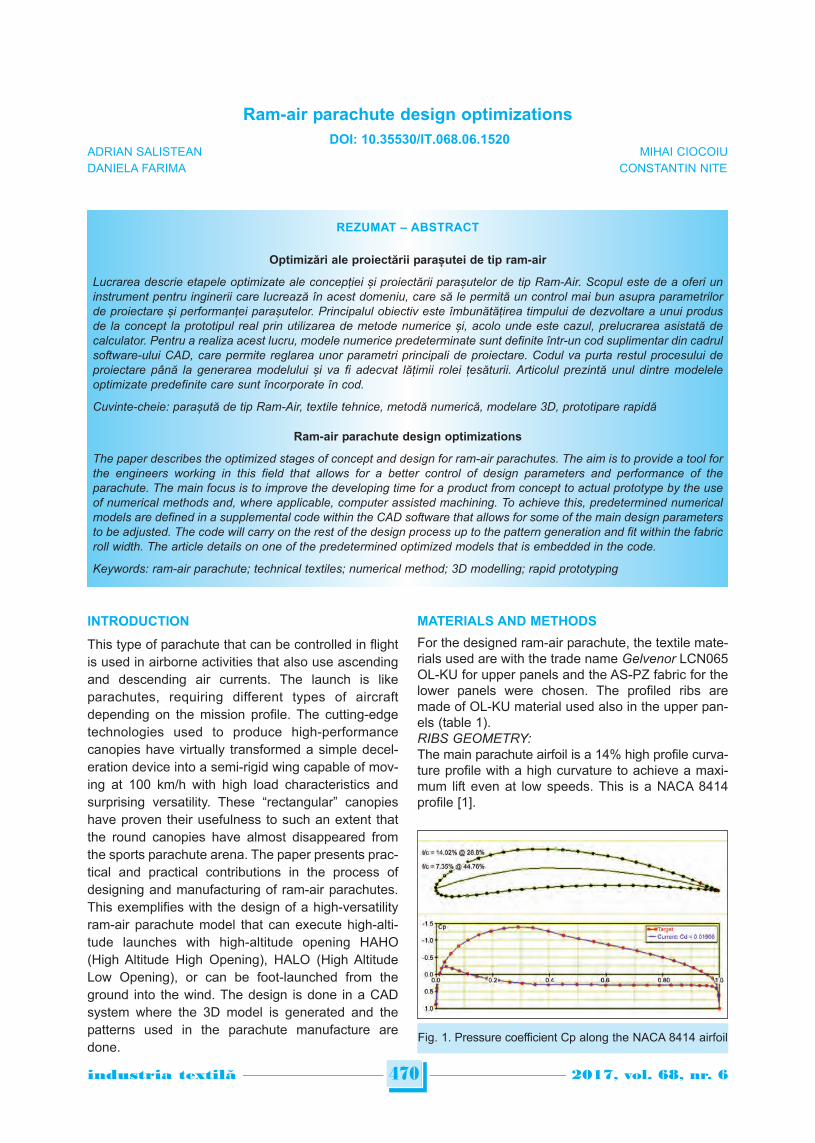
INTRODUCTION
This type of parachute that can be controlled in flightis used in airborne activities that also use ascendingand descending air currents. The launch is likeparachutes, requiring different types of aircraftdepending on the mission profile. The cutting-edgetechnologies used to produce high-performancecanopies have virtually transformed a simple decel-eration device into a semi-rigid wing capable of mov-ing at 100 km/h with high load characteristics andsurprising versatility. These “rectangular” canopieshave proven their usefulness to such an extent thatthe round canopies have almost disappeared fromthe sports parachute arena. The paper presents prac-tical and practical contributions in the process ofdesigning and manufacturing of ram-air parachutes.This exemplifies with the design of a high-versatilityram-air parachute model that can execute high-alti-tude launches with high-altitude opening HAHO(High Altitude High Opening), HALO (High AltitudeLow Opening), or can be foot-launched from theground into the wind. The design is done in a CADsystem where the 3D model is generated and thepatterns used in the parachute manufacture aredone.
MATERIALS AND METHODS
For the designed ram-air parachute, the textile mate-rials used are with the trade name Gelvenor LCN065OL-KU for upper panels and the AS-PZ fabric for thelower panels were chosen. The profiled ribs aremade of OL-KU material used also in the upper pan-els (table 1).RIBS GEOMETRY:The main parachute airfoil is a 14% high profile curva-ture profile with a high curvature to achieve a maxi-mum lift even at low speeds. This is a NACA 8414profile [1].
470industria textila 2017, vol. 68, nr. 6˘
Ram-air parachute design optimizations
ADRIAN SALISTEAN MIHAI CIOCOIUDANIELA FARIMA CONSTANTIN NITE
REZUMAT – ABSTRACT
Optimizări ale proiectării parașutei de tip ram-air
Lucrarea descrie etapele optimizate ale concepției și proiectării parașutelor de tip Ram-Air. Scopul este de a oferi uninstrument pentru inginerii care lucrează în acest domeniu, care să le permită un control mai bun asupra parametrilorde proiectare și performanței parașutelor. Principalul obiectiv este îmbunătățirea timpului de dezvoltare a unui produsde la concept la prototipul real prin utilizarea de metode numerice și, acolo unde este cazul, prelucrarea asistată decalculator. Pentru a realiza acest lucru, modele numerice predeterminate sunt definite într-un cod suplimentar din cadrulsoftware-ului CAD, care permite reglarea unor parametri principali de proiectare. Codul va purta restul procesului deproiectare până la generarea modelului și va fi adecvat lățimii rolei țesăturii. Articolul prezintă unul dintre modeleleoptimizate predefinite care sunt încorporate în cod.
Cuvinte-cheie: parașută de tip Ram-Air, textile tehnice, metodă numerică, modelare 3D, prototipare rapidă
Ram-air parachute design optimizations
The paper describes the optimized stages of concept and design for ram-air parachutes. The aim is to provide a tool forthe engineers working in this field that allows for a better control of design parameters and performance of theparachute. The main focus is to improve the developing time for a product from concept to actual prototype by the useof numerical methods and, where applicable, computer assisted machining. To achieve this, predetermined numericalmodels are defined in a supplemental code within the CAD software that allows for some of the main design parametersto be adjusted. The code will carry on the rest of the design process up to the pattern generation and fit within the fabricroll width. The article details on one of the predetermined optimized models that is embedded in the code.
Keywords: ram-air parachute; technical textiles; numerical method; 3D modelling; rapid prototyping
Fig. 1. Pressure coefficient Cp along the NACA 8414 airfoil
DOI: 10.35530/IT.068.06.1520
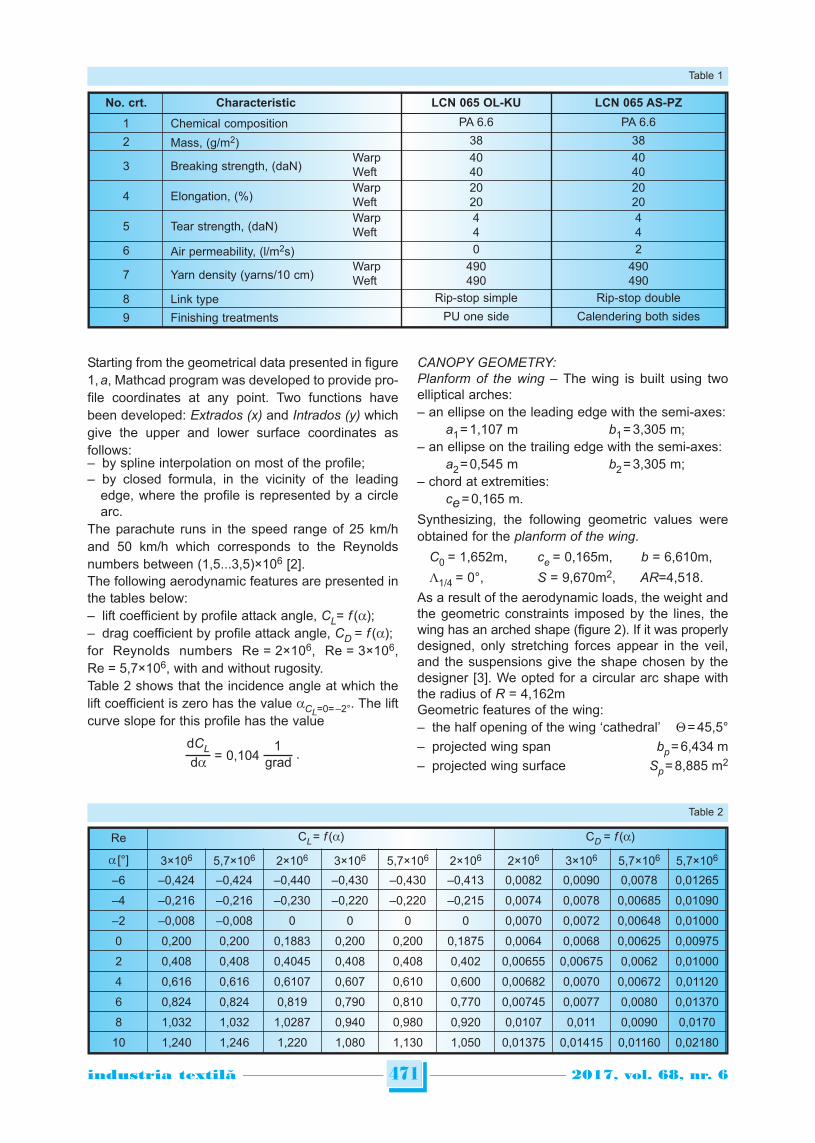
Starting from the geometrical data presented in figure1, a, Mathcad program was developed to provide pro-file coordinates at any point. Two functions havebeen developed: Extrados (x) and Intrados (y) whichgive the upper and lower surface coordinates asfollows:– by spline interpolation on most of the profile;– by closed formula, in the vicinity of the leading
edge, where the profile is represented by a circlearc.
The parachute runs in the speed range of 25 km/hand 50 km/h which corresponds to the Reynoldsnumbers between (1,5...3,5)×106 [2].The following aerodynamic features are presented inthe tables below:– lift coefficient by profile attack angle, CL= f (a);– drag coefficient by profile attack angle, CD = f (a);for Reynolds numbers Re = 2×10⁶, Re = 3×10⁶,Re = 5,7×10⁶, with and without rugosity.Table 2 shows that the incidence angle at which thelift coefficient is zero has the value aCL=0= –2°. The liftcurve slope for this profile has the value
dCL 1 = 0,104 . da grad
CANOPY GEOMETRY:Planform of the wing – The wing is built using twoelliptical arches:– an ellipse on the leading edge with the semi-axes:
a1 = 1,107 m b1 = 3,305 m;– an ellipse on the trailing edge with the semi-axes:
a2 = 0,545 m b2 = 3,305 m;– chord at extremities:
ce = 0,165 m.
Synthesizing, the following geometric values wereobtained for the planform of the wing.
C0 = 1,652m, ce = 0,165m, b = 6,610m,
L1/4 = 0°, S = 9,670m2, AR=4,518.
As a result of the aerodynamic loads, the weight andthe geometric constraints imposed by the lines, thewing has an arched shape (figure 2). If it was properlydesigned, only stretching forces appear in the veil,and the suspensions give the shape chosen by thedesigner [3]. We opted for a circular arc shape withthe radius of R = 4,162mGeometric features of the wing:– the half opening of the wing ‘cathedral’ Q = 45,5°– projected wing span bp = 6,434 m– projected wing surface Sp = 8,885 m2
471industria textila 2017, vol. 68, nr. 6˘
Re CL = f (a) CD = f (a)
a [°] 3×10⁶ 5,7×10⁶ 2×10⁶ 3×10⁶ 5,7×10⁶ 2×10⁶ 2×10⁶ 3×10⁶ 5,7×10⁶ 5,7×10⁶
–6 –0,424 –0,424 –0,440 –0,430 –0,430 –0,413 0,0082 0,0090 0,0078 0,01265
–4 –0,216 –0,216 –0,230 –0,220 –0,220 –0,215 0,0074 0,0078 0,00685 0,01090
–2 –0,008 –0,008 0 0 0 0 0,0070 0,0072 0,00648 0,01000
0 0,200 0,200 0,1883 0,200 0,200 0,1875 0,0064 0,0068 0,00625 0,00975
2 0,408 0,408 0,4045 0,408 0,408 0,402 0,00655 0,00675 0,0062 0,01000
4 0,616 0,616 0,6107 0,607 0,610 0,600 0,00682 0,0070 0,00672 0,01120
6 0,824 0,824 0,819 0,790 0,810 0,770 0,00745 0,0077 0,0080 0,01370
8 1,032 1,032 1,0287 0,940 0,980 0,920 0,0107 0,011 0,0090 0,0170
10 1,240 1,246 1,220 1,080 1,130 1,050 0,01375 0,01415 0,01160 0,02180
Table 2
No. crt. Characteristic LCN 065 OL-KU LCN 065 AS-PZ
1 Chemical composition PA 6.6 PA 6.6
2 Mass, (g/m2) 38 38
3 Breaking strength, (daN)WarpWeft
4040
4040
4 Elongation, (%)WarpWeft
2020
2020
5 Tear strength, (daN)WarpWeft
44
44
6 Air permeability, (l/m2s) 0 2
7 Yarn density (yarns/10 cm)WarpWeft
490490
490490
8 Link type Rip-stop simple Rip-stop double
9 Finishing treatments PU one side Calendering both sides
Table 1
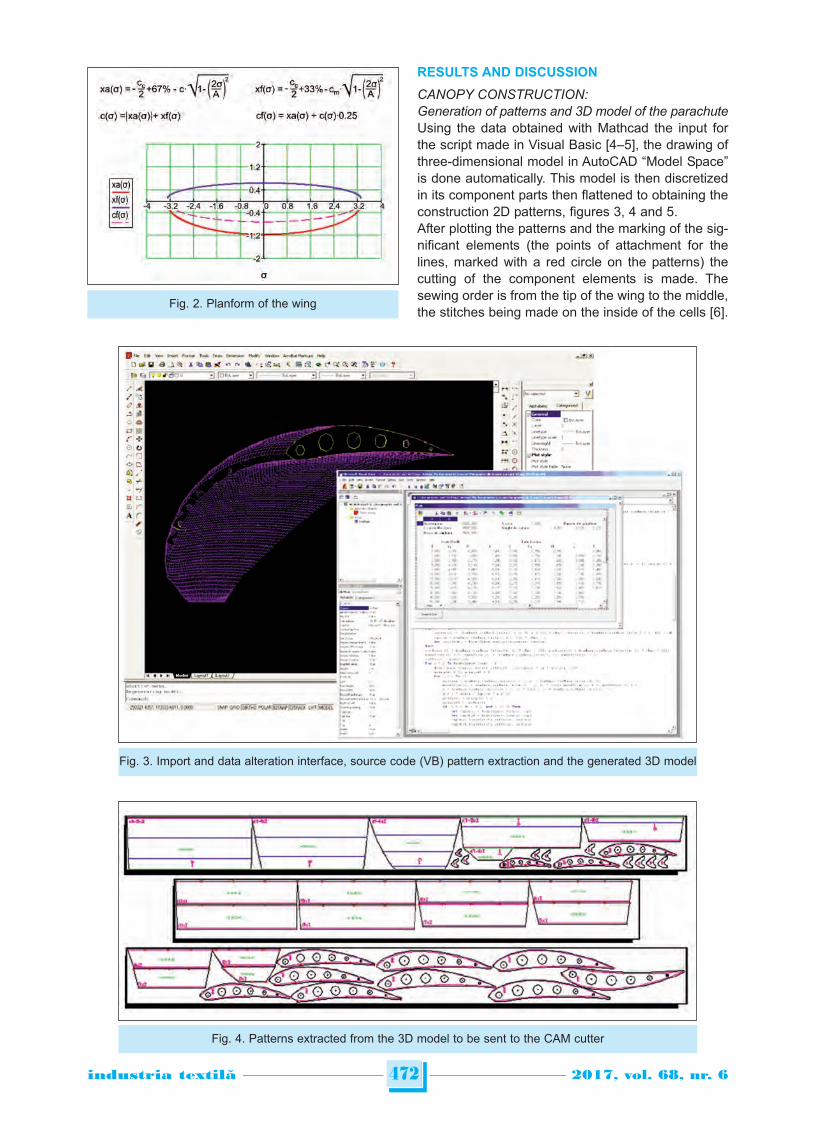
RESULTS AND DISCUSSION
CANOPY CONSTRUCTION:Generation of patterns and 3D model of the parachuteUsing the data obtained with Mathcad the input forthe script made in Visual Basic [4–5], the drawing ofthree-dimensional model in AutoCAD “Model Space”is done automatically. This model is then discretizedin its component parts then flattened to obtaining theconstruction 2D patterns, figures 3, 4 and 5.After plotting the patterns and the marking of the sig-nificant elements (the points of attachment for thelines, marked with a red circle on the patterns) thecutting of the component elements is made. Thesewing order is from the tip of the wing to the middle,the stitches being made on the inside of the cells [6].
472industria textila 2017, vol. 68, nr. 6˘
Fig. 3. Import and data alteration interface, source code (VB) pattern extraction and the generated 3D model
Fig. 4. Patterns extracted from the 3D model to be sent to the CAM cutter
Fig. 2. Planform of the wing
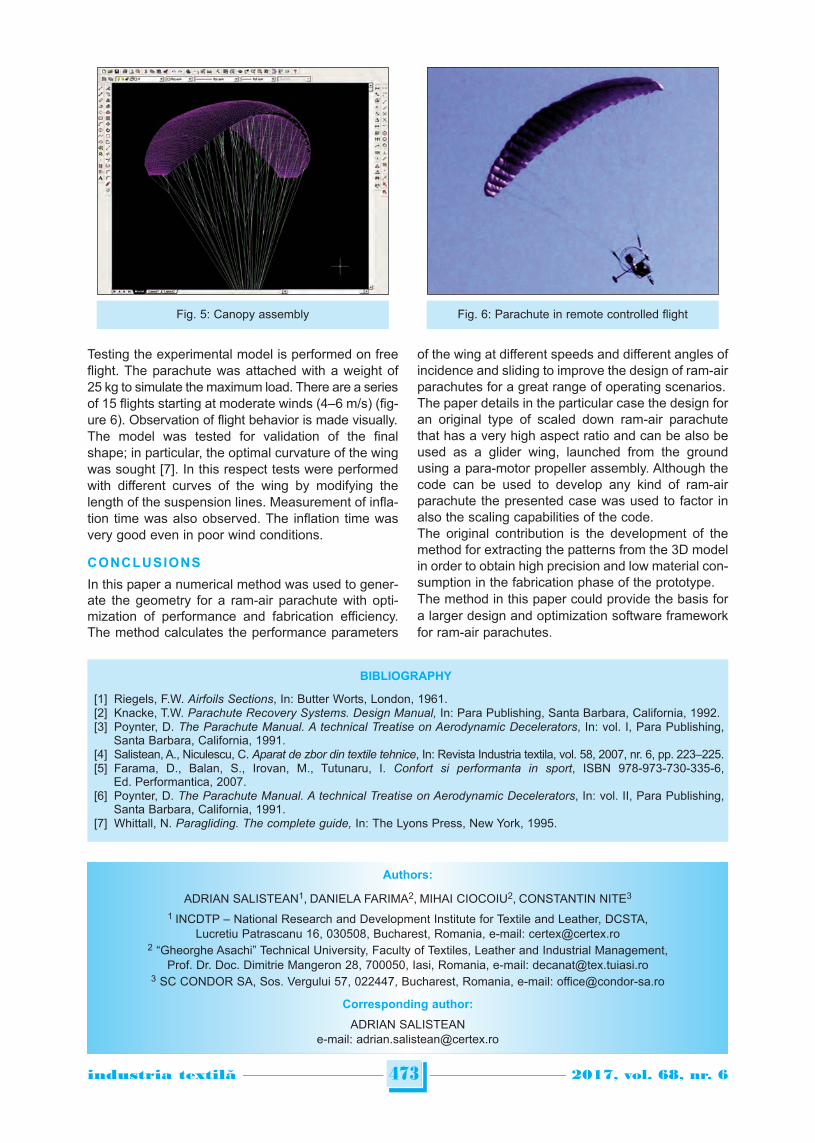
Testing the experimental model is performed on freeflight. The parachute was attached with a weight of25 kg to simulate the maximum load. There are a seriesof 15 flights starting at moderate winds (4–6 m/s) (fig-ure 6). Observation of flight behavior is made visually.The model was tested for validation of the finalshape; in particular, the optimal curvature of the wingwas sought [7]. In this respect tests were performedwith different curves of the wing by modifying thelength of the suspension lines. Measurement of infla-tion time was also observed. The inflation time wasvery good even in poor wind conditions.
CONCLUSIONS
In this paper a numerical method was used to gener-ate the geometry for a ram-air parachute with opti-mization of performance and fabrication efficiency.The method calculates the performance parameters
of the wing at different speeds and different angles ofincidence and sliding to improve the design of ram-airparachutes for a great range of operating scenarios. The paper details in the particular case the design foran original type of scaled down ram-air parachutethat has a very high aspect ratio and can be also beused as a glider wing, launched from the groundusing a para-motor propeller assembly. Although thecode can be used to develop any kind of ram-airparachute the presented case was used to factor inalso the scaling capabilities of the code.The original contribution is the development of themethod for extracting the patterns from the 3D modelin order to obtain high precision and low material con-sumption in the fabrication phase of the prototype.The method in this paper could provide the basis fora larger design and optimization software frameworkfor ram-air parachutes.
473industria textila 2017, vol. 68, nr. 6˘
BIBLIOGRAPHY
[1] Riegels, F.W. Airfoils Sections, In: Butter Worts, London, 1961.[2] Knacke, T.W. Parachute Recovery Systems. Design Manual, In: Para Publishing, Santa Barbara, California, 1992.[3] Poynter, D. The Parachute Manual. A technical Treatise on Aerodynamic Decelerators, In: vol. I, Para Publishing,
Santa Barbara, California, 1991.[4] Salistean, A., Niculescu, C. Aparat de zbor din textile tehnice, In: Revista Industria textila, vol. 58, 2007, nr. 6, pp. 223–225.[5] Farama, D., Balan, S., Irovan, M., Tutunaru, I. Confort si performanta in sport, ISBN 978-973-730-335-6,
Ed. Performantica, 2007.[6] Poynter, D. The Parachute Manual. A technical Treatise on Aerodynamic Decelerators, In: vol. II, Para Publishing,
Santa Barbara, California, 1991.[7] Whittall, N. Paragliding. The complete guide, In: The Lyons Press, New York, 1995.
Authors:
ADRIAN SALISTEAN1, DANIELA FARIMA2, MIHAI CIOCOIU2, CONSTANTIN NITE3
1 INCDTP – National Research and Development Institute for Textile and Leather, DCSTA, Lucretiu Patrascanu 16, 030508, Bucharest, Romania, e-mail: [email protected]
2 “Gheorghe Asachi” Technical University, Faculty of Textiles, Leather and Industrial Management, Prof. Dr. Doc. Dimitrie Mangeron 28, 700050, Iasi, Romania, e-mail: [email protected]
3 SC CONDOR SA, Sos. Vergului 57, 022447, Bucharest, Romania, e-mail: [email protected]
Corresponding author:
ADRIAN SALISTEANe-mail: [email protected]
Fig. 5: Canopy assembly Fig. 6: Parachute in remote controlled flight
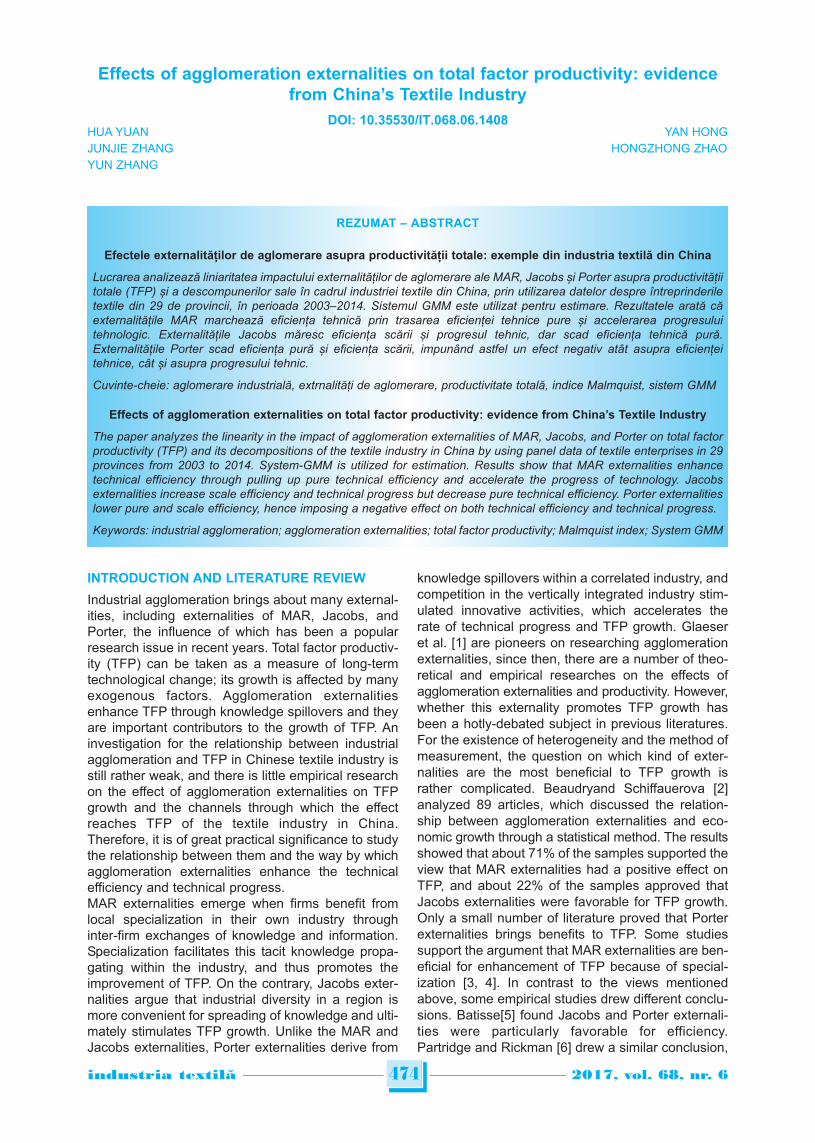
INTRODUCTION AND LITERATURE REVIEW
Industrial agglomeration brings about many external-ities, including externalities of MAR, Jacobs, andPorter, the influence of which has been a popularresearch issue in recent years. Total factor productiv-ity (TFP) can be taken as a measure of long-termtechnological change; its growth is affected by manyexogenous factors. Agglomeration externalitiesenhance TFP through knowledge spillovers and theyare important contributors to the growth of TFP. Aninvestigation for the relationship between industrialagglomeration and TFP in Chinese textile industry isstill rather weak, and there is little empirical researchon the effect of agglomeration externalities on TFPgrowth and the channels through which the effectreaches TFP of the textile industry in China.Therefore, it is of great practical significance to studythe relationship between them and the way by whichagglomeration externalities enhance the technicalefficiency and technical progress.MAR externalities emerge when firms benefit fromlocal specialization in their own industry throughinter-firm exchanges of knowledge and information.Specialization facilitates this tacit knowledge propa-gating within the industry, and thus promotes theimprovement of TFP. On the contrary, Jacobs exter-nalities argue that industrial diversity in a region ismore convenient for spreading of knowledge and ulti-mately stimulates TFP growth. Unlike the MAR andJacobs externalities, Porter externalities derive from
knowledge spillovers within a correlated industry, andcompetition in the vertically integrated industry stim-ulated innovative activities, which accelerates therate of technical progress and TFP growth. Glaeseret al. [1] are pioneers on researching agglomerationexternalities, since then, there are a number of theo-retical and empirical researches on the effects ofagglomeration externalities and productivity. However,whether this externality promotes TFP growth hasbeen a hotly-debated subject in previous literatures.For the existence of heterogeneity and the method ofmeasurement, the question on which kind of exter-nalities are the most beneficial to TFP growth israther complicated. Beaudryand Schiffauerova [2]analyzed 89 articles, which discussed the relation-ship between agglomeration externalities and eco-nomic growth through a statistical method. The resultsshowed that about 71% of the samples supported theview that MAR externalities had a positive effect onTFP, and about 22% of the samples approved thatJacobs externalities were favorable for TFP growth.Only a small number of literature proved that Porterexternalities brings benefits to TFP. Some studiessupport the argument that MAR externalities are ben-eficial for enhancement of TFP because of special-ization [3, 4]. In contrast to the views mentionedabove, some empirical studies drew different conclu-sions. Batisse[5] found Jacobs and Porter externali-ties were particularly favorable for efficiency.Partridge and Rickman [6] drew a similar conclusion,
474industria textila 2017, vol. 68, nr. 6˘
Effects of agglomeration externalities on total factor productivity: evidencefrom China’s Textile Industry
HUA YUAN YAN HONGJUNJIE ZHANG HONGZHONG ZHAOYUN ZHANG
REZUMAT – ABSTRACT
Efectele externalităților de aglomerare asupra productivității totale: exemple din industria textilă din China
Lucrarea analizează liniaritatea impactului externalităților de aglomerare ale MAR, Jacobs și Porter asupra productivitățiitotale (TFP) și a descompunerilor sale în cadrul industriei textile din China, prin utilizarea datelor despre întreprinderiletextile din 29 de provincii, în perioada 2003–2014. Sistemul GMM este utilizat pentru estimare. Rezultatele arată căexternalitățile MAR marchează eficiența tehnică prin trasarea eficienței tehnice pure și accelerarea progresuluitehnologic. Externalitățile Jacobs măresc eficiența scării și progresul tehnic, dar scad eficiența tehnică pură.Externalitățile Porter scad eficiența pură și eficiența scării, impunând astfel un efect negativ atât asupra eficiențeitehnice, cât și asupra progresului tehnic.
Cuvinte-cheie: aglomerare industrială, extrnalități de aglomerare, productivitate totală, indice Malmquist, sistem GMM
Effects of agglomeration externalities on total factor productivity: evidence from China’s Textile Industry
The paper analyzes the linearity in the impact of agglomeration externalities of MAR, Jacobs, and Porter on total factorproductivity (TFP) and its decompositions of the textile industry in China by using panel data of textile enterprises in 29provinces from 2003 to 2014. System-GMM is utilized for estimation. Results show that MAR externalities enhancetechnical efficiency through pulling up pure technical efficiency and accelerate the progress of technology. Jacobsexternalities increase scale efficiency and technical progress but decrease pure technical efficiency. Porter externalitieslower pure and scale efficiency, hence imposing a negative effect on both technical efficiency and technical progress.
Keywords: industrial agglomeration; agglomeration externalities; total factor productivity; Malmquist index; System GMM
DOI: 10.35530/IT.068.06.1408
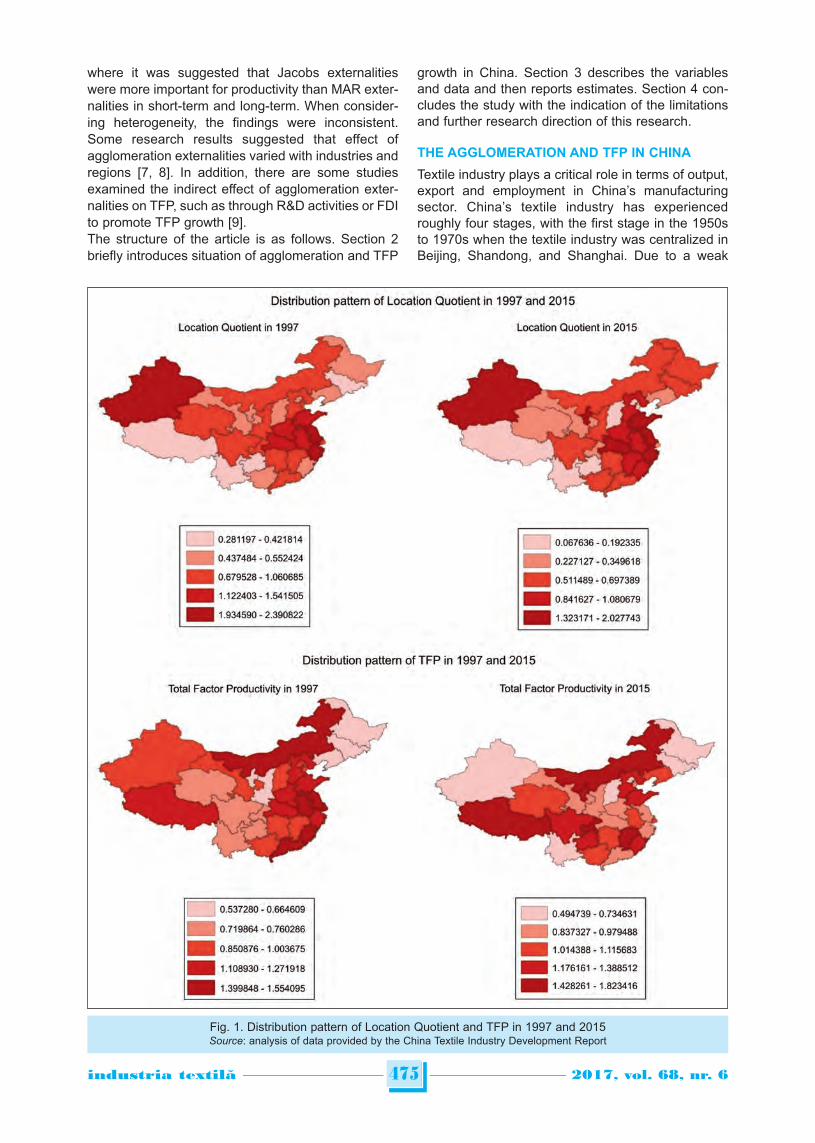
where it was suggested that Jacobs externalitieswere more important for productivity than MAR exter-nalities in short-term and long-term. When consider-ing heterogeneity, the findings were inconsistent.Some research results suggested that effect ofagglomeration externalities varied with industries andregions [7, 8]. In addition, there are some studiesexamined the indirect effect of agglomeration exter-nalities on TFP, such as through R&D activities or FDIto promote TFP growth [9].The structure of the article is as follows. Section 2briefly introduces situation of agglomeration and TFP
growth in China. Section 3 describes the variablesand data and then reports estimates. Section 4 con-cludes the study with the indication of the limitationsand further research direction of this research.
THE AGGLOMERATION AND TFP IN CHINA
Textile industry plays a critical role in terms of output,export and employment in China’s manufacturingsector. China’s textile industry has experiencedroughly four stages, with the first stage in the 1950sto 1970s when the textile industry was centralized inBeijing, Shandong, and Shanghai. Due to a weak
475industria textila 2017, vol. 68, nr. 6˘
Fig. 1. Distribution pattern of Location Quotient and TFP in 1997 and 2015Source: analysis of data provided by the China Textile Industry Development Report
industrial base, coupled with the implementation ofpolicies in a centralized planned economic system,during this period, the government invested heavily intextile enterprises in these areas. The second stagewas from the 1970s to 1990s, after the reform andopening up policy, many textile enterprises choselocations close to consumers and labor markets inorder to reduce the cost and obtain comparativeadvantages; therefore, textile enterprises gathered inGuangdong, Fujian and other areas along theSoutheast Coast. The 1990s to 2005 was the thirdstage. In 1998, China’s textile industry faced theproblems of excess productive capacities, insufficientsupply of raw materials and difficulty selling its prod-ucts. To solve these problems, the capacity reductionpolicies were implemented. Then there were fivelarge industrial clusters formed in Zhejiang, Jiangsu,Guangdong, Shandong, and Shanghai. Fourth stagewas 2006 until now. With the cancellation of textilequota and rising land rents in coastal areas, the tex-tile industry began to diffuse from Zhejiang, Jiangsu,and Guangdong to Jiangxi, Henan, Liaoning, Hubei,Hunan, Anhui, Sichuan, Hebei and other central andwestern regions. Taking Jiangxi as an example,industrial added value growth of the textile industryincreased 1.3 times from 2009 to 2012.Figure 1 shows the change of Location Quotient (LQ)of the textile industry from 1997 to 2015. Agglomerationpattern shows that since the1990s, the textile indus-try has shown a trend of changing from concentrationto diffusion. Centralized regions have transferredfrom southeast coastal regions to central and west-ern regions. In addition, it is worth noting that aregion, such as Xinjiang, which is close to interna-tional market, also has a high LQ. Mean while, figure 1demonstrated TFP in central and western regions,such as Inner Mongolia, Ningxia, Jiangxi, andChongqing, has been increasing year by year. There are some kinds of connections between TFPand LQ, but this relationship is not obvious. Afterfurther correlation analysis, the result displays thatthere is a significant correlation at 0.05 levels (bilat-eral) between the rates of change of TFP and LQ,with a correlation coefficient of 0.407. In other words,the externalities of industrial agglomeration do havea significant impact on TFP changes.
EMPIRICAL STRATEGY
Model and hypothesis
Based on the literature analysis, this paper will con-sider three dimensions, which are respectively indus-try, time and geography. In this way, we will studythe effect of agglomeration externalities on TFP.Externalities of industry dimension include special-ization, diversification, and competition. Time dimen-sion analyzes the externalities from the dynamicpoint of view, and the geographical dimension is ana-lyzes the aspects of location. Firstly, by reference toGriliches and Jaffe’s approach [10, 11], agglomera-tion externalities are introduced into the production
function. Assuming that the production function is inthe form of Cobb-Douglas function, there is a techni-cal knowledge input S in addition to the inputs of cap-ital and the labor, whose function expression is:
Y = AKaLbSd (1)
The expression for the total factor productivity is:
YTFP = = ASd (2)
KaLb
Since the technical knowledge is influenced by MAR,Jacobs, and Porter externalities, can be written as afunction of three externalities, i.e.:
Sd = F(mar, jac, por) (3)
This study is based on the hypothesis that there is alinear relationship between agglomeration externali-ties, time factor tand the regional factor i, then eq. (2)can be written as:
TFPi,t = Ai,t × (mari,t )j1 × (jaci,t )
j2 × (pori,t )j3 (4)
And the changing rate of TFP in region i is:r1 r2 r3TFPCi,t = ACi,t × MARCi,t × JACCi,t × PORCi,t (5)
On both sides of the logarithm, eq. (5) can be writtenas follows:
ln TFPCi,t = ln ACi,t + r1 ln MARC i,t +
+ r2 ln JACC i,t + r3 ln PORC i,t
(6)
From “time dimension” aspect, lag of TFP is addedinto the equation, and the geographical factors areput into the equation as dummy variables, then theeq. (6) can be changed into:
ln TFPCi,t = ln ACi,t + s1 ln TFPCi,t–2 + s2 ln TFPCi,t–1 +
+ r1 ln MARCi,t + r2 ln JACCi,t + r3 ln PORCi,t +
+ w1DUME + w2DUMM + ei,t (7)
Herein: TFPCi,t is a changing rate of TFP in region ifrom time t to t+1. TFPCi,t–2, TFPi,t–1 are lag variablesof TFP. MARCi,t indicates the changes in degree ofspecialization of region i. JACCi,t represents thechanges in the degree of diversity in region i, PORCi,timplies the level of competition in region i, ACi,t is aconstant term, DUME, DUMM are the region dummyvariables for the eastern and middle regions, ei,t is arandom error term, and i and t respectively indicatethe region and time.In order to understand the way by which agglomera-tion externalities affects change rate of TFP, wedecompose TFP into two parts: technical efficiencychange (EFC) and technological progress change(TEC). Then technical efficiency change is dividedinto pure technical efficiency change (PEC) and scaleefficiency change (SEC), based on the eq. (7). Themetrological expression of the agglomeration exter-nalities and TFP decompositions can be constructedas follows:
476industria textila 2017, vol. 68, nr. 6˘
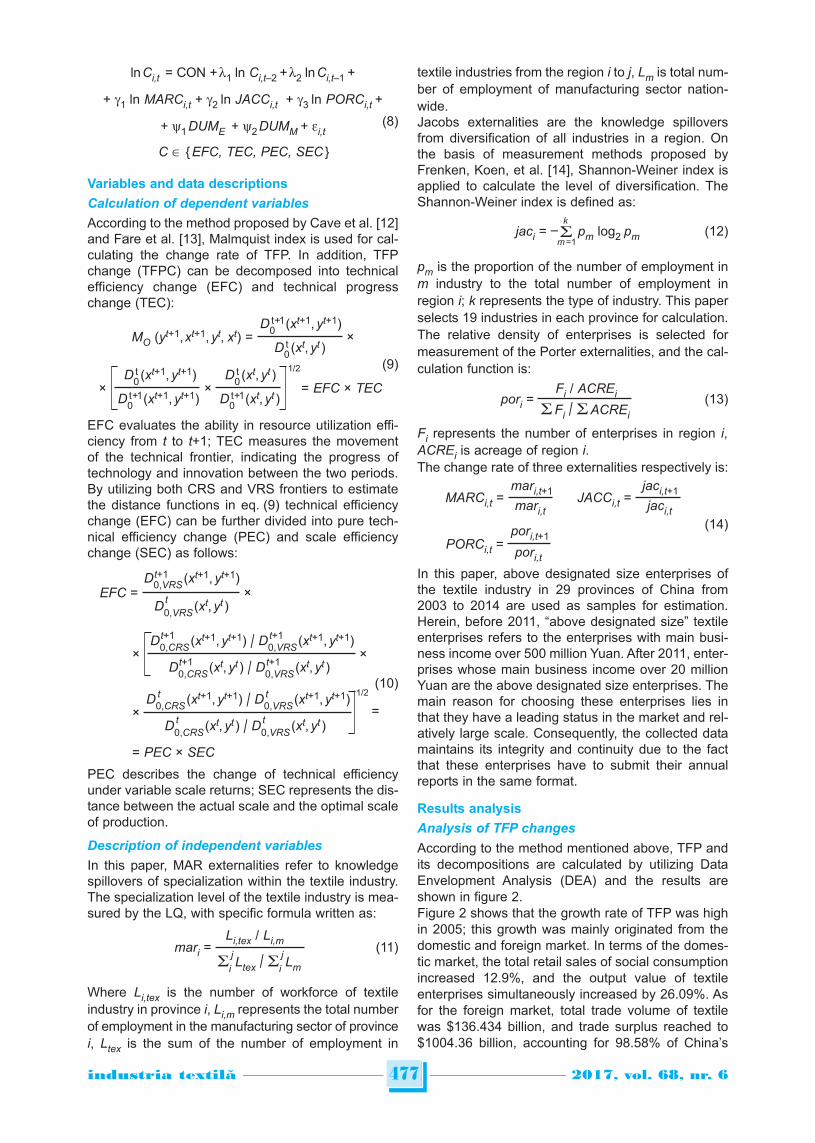
ln Ci,t = CON + l1 ln Ci,t–2 + l2 ln Ci,t–1 +
+ g1 ln MARCi,t + g2 ln JACCi,t + g3 ln PORCi,t +
+ y1DUME + y2DUMM + ei,t
C { EFC, TEC, PEC, SEC }
(8)
Variables and data descriptions
Calculation of dependent variables
According to the method proposed by Cave et al. [12]and Fa�re et al. [13], Malmquist index is used for cal-culating the change rate of TFP. In addition, TFPchange (TFPC) can be decomposed into technicalefficiency change (EFC) and technical progresschange (TEC):
D0t+1 (xt+1, yt+1)
MO (yt+1,xt+1, yt, xt) = ×D0
t (xt, yt )
D0t (xt+1, yt+1) D0
t (xt, yt ) 1/2
× × = EFC × TEC
(9)
D0t+1 (xt+1, yt+1) D0
t+1 (xt, yt )
EFC evaluates the ability in resource utilization effi-ciency from t to t+1; TEC measures the movementof the technical frontier, indicating the progress oftechnology and innovation between the two periods.By utilizing both CRS and VRS frontiers to estimatethe distance functions in eq. (9) technical efficiencychange (EFC) can be further divided into pure tech-nical efficiency change (PEC) and scale efficiencychange (SEC) as follows:
t+1D0,VRS (xt+1, yt+1)EFC = ×tD0,VRS (xt, yt )
t+1 t+1D0,CRS (xt+1, yt+1) / D0,VRS (xt+1, yt+1)× ×
t+1 t+1D0,CRS (xt, yt ) / D0,VRS (xt, yt )
t t (10)
D0,CRS (xt+1, yt+1) / D0,VRS (xt+1, yt+1) 1/2
× =t tD0,CRS (xt, yt ) / D0,VRS (xt, yt )
= PEC × SEC
PEC describes the change of technical efficiencyunder variable scale returns; SEC represents the dis-tance between the actual scale and the optimal scaleof production.
Description of independent variables
In this paper, MAR externalities refer to knowledgespillovers of specialization within the textile industry.The specialization level of the textile industry is mea-sured by the LQ, with specific formula written as:
Li,tex / Li,mmari = (11)i
jLtex / i
jLm
Where Li,tex is the number of workforce of textileindustry in province i, Li,m represents the total numberof employment in the manufacturing sector of provincei, Ltex is the sum of the number of employment in
textile industries from the region i to j, Lm is total num-ber of employment of manufacturing sector nation-wide.Jacobs externalities are the knowledge spilloversfrom diversification of all industries in a region. Onthe basis of measurement methods proposed byFrenken, Koen, et al. [14], Shannon-Weiner index isapplied to calculate the level of diversification. TheShannon-Weiner index is defined as:
kjaci = – pm log2 pm (12)
m =1
pm is the proportion of the number of employment inm industry to the total number of employment inregion i; k represents the type of industry. This paperselects 19 industries in each province for calculation.The relative density of enterprises is selected formeasurement of the Porter externalities, and the cal-culation function is:
Fi / ACREipori = (13) Fi / ACREi
Fi represents the number of enterprises in region i,ACREi is acreage of region i. The change rate of three externalities respectively is:
mari,t+1 jaci,t+1MARCi,t = JACCi,t =
(14)mari,t jaci,t
pori,t+1PORCi,t = pori,t
In this paper, above designated size enterprises ofthe textile industry in 29 provinces of China from2003 to 2014 are used as samples for estimation.Herein, before 2011, “above designated size” textileenterprises refers to the enterprises with main busi-ness income over 500 million Yuan. After 2011, enter-prises whose main business income over 20 millionYuan are the above designated size enterprises. Themain reason for choosing these enterprises lies inthat they have a leading status in the market and rel-atively large scale. Consequently, the collected datamaintains its integrity and continuity due to the factthat these enterprises have to submit their annualreports in the same format.
Results analysis
Analysis of TFP changes
According to the method mentioned above, TFP andits decompositions are calculated by utilizing DataEnvelopment Analysis (DEA) and the results areshown in figure 2.Figure 2 shows that the growth rate of TFP was highin 2005; this growth was mainly originated from thedomestic and foreign market. In terms of the domes-tic market, the total retail sales of social consumptionincreased 12.9%, and the output value of textileenterprises simultaneously increased by 26.09%. Asfor the foreign market, total trade volume of textilewas $136.434 billion, and trade surplus reached to$1004.36 billion, accounting for 98.58% of China’s
477industria textila 2017, vol. 68, nr. 6˘
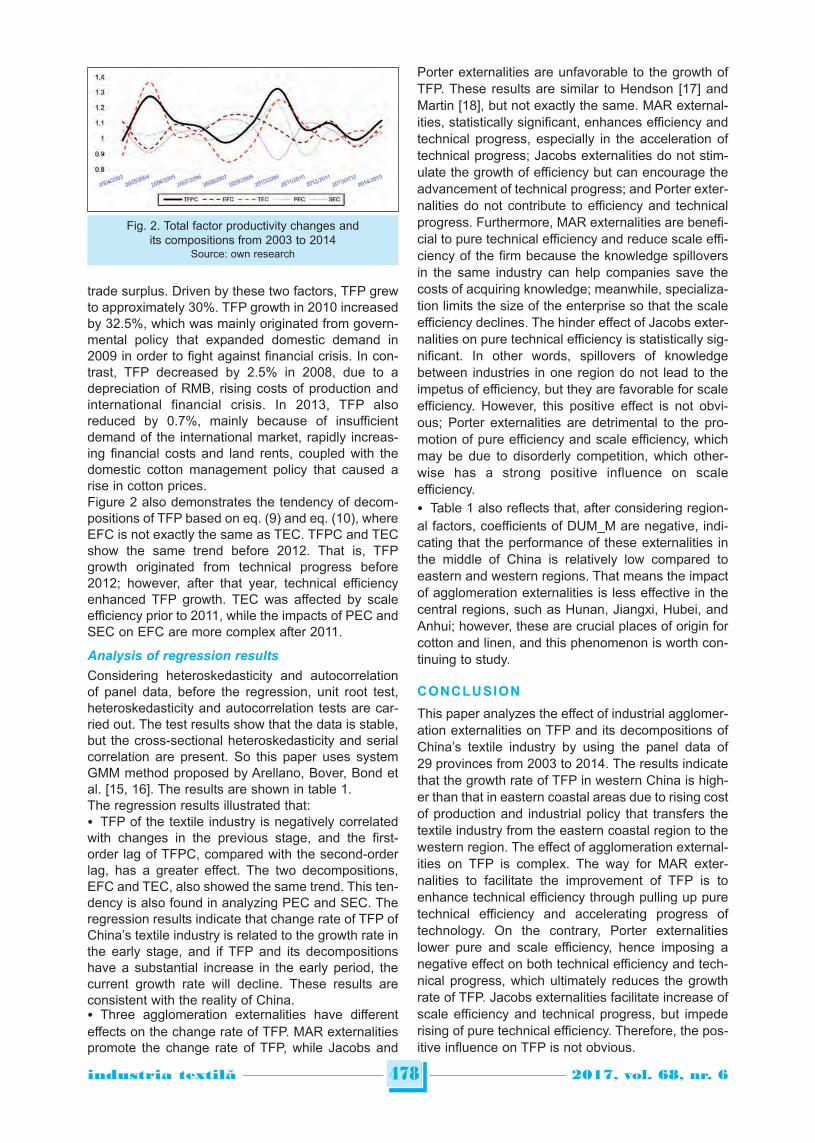
trade surplus. Driven by these two factors, TFP grewto approximately 30%. TFP growth in 2010 increasedby 32.5%, which was mainly originated from govern-mental policy that expanded domestic demand in2009 in order to fight against financial crisis. In con-trast, TFP decreased by 2.5% in 2008, due to adepreciation of RMB, rising costs of production andinternational financial crisis. In 2013, TFP alsoreduced by 0.7%, mainly because of insufficientdemand of the international market, rapidly increas-ing financial costs and land rents, coupled with thedomestic cotton management policy that caused arise in cotton prices.Figure 2 also demonstrates the tendency of decom-positions of TFP based on eq. (9) and eq. (10), whereEFC is not exactly the same as TEC. TFPC and TECshow the same trend before 2012. That is, TFPgrowth originated from technical progress before2012; however, after that year, technical efficiencyenhanced TFP growth. TEC was affected by scaleefficiency prior to 2011, while the impacts of PEC andSEC on EFC are more complex after 2011.
Analysis of regression results
Considering heteroskedasticity and autocorrelationof panel data, before the regression, unit root test,heteroskedasticity and autocorrelation tests are car-ried out. The test results show that the data is stable,but the cross-sectional heteroskedasticity and serialcorrelation are present. So this paper uses systemGMM method proposed by Arellano, Bover, Bond etal. [15, 16]. The results are shown in table 1.The regression results illustrated that:• TFP of the textile industry is negatively correlatedwith changes in the previous stage, and the first-order lag of TFPC, compared with the second-orderlag, has a greater effect. The two decompositions,EFC and TEC, also showed the same trend. This ten-dency is also found in analyzing PEC and SEC. Theregression results indicate that change rate of TFP ofChina’s textile industry is related to the growth rate inthe early stage, and if TFP and its decompositionshave a substantial increase in the early period, thecurrent growth rate will decline. These results areconsistent with the reality of China. • Three agglomeration externalities have differenteffects on the change rate of TFP. MAR externalitiespromote the change rate of TFP, while Jacobs and
Porter externalities are unfavorable to the growth ofTFP. These results are similar to Hendson [17] andMartin [18], but not exactly the same. MAR external-ities, statistically significant, enhances efficiency andtechnical progress, especially in the acceleration oftechnical progress; Jacobs externalities do not stim-ulate the growth of efficiency but can encourage theadvancement of technical progress; and Porter exter-nalities do not contribute to efficiency and technicalprogress. Furthermore, MAR externalities are benefi-cial to pure technical efficiency and reduce scale effi-ciency of the firm because the knowledge spilloversin the same industry can help companies save thecosts of acquiring knowledge; meanwhile, specializa-tion limits the size of the enterprise so that the scaleefficiency declines. The hinder effect of Jacobs exter-nalities on pure technical efficiency is statistically sig-nificant. In other words, spillovers of knowledgebetween industries in one region do not lead to theimpetus of efficiency, but they are favorable for scaleefficiency. However, this positive effect is not obvi-ous; Porter externalities are detrimental to the pro-motion of pure efficiency and scale efficiency, whichmay be due to disorderly competition, which other-wise has a strong positive influence on scaleefficiency.• Table 1 also reflects that, after considering region-al factors, coefficients of DUM_M are negative, indi-cating that the performance of these externalities inthe middle of China is relatively low compared toeastern and western regions. That means the impactof agglomeration externalities is less effective in thecentral regions, such as Hunan, Jiangxi, Hubei, andAnhui; however, these are crucial places of origin forcotton and linen, and this phenomenon is worth con-tinuing to study.
CONCLUSION
This paper analyzes the effect of industrial agglomer-ation externalities on TFP and its decompositions ofChina’s textile industry by using the panel data of29 provinces from 2003 to 2014. The results indicatethat the growth rate of TFP in western China is high-er than that in eastern coastal areas due to rising costof production and industrial policy that transfers thetextile industry from the eastern coastal region to thewestern region. The effect of agglomeration external-ities on TFP is complex. The way for MAR exter-nalities to facilitate the improvement of TFP is toenhance technical efficiency through pulling up puretechnical efficiency and accelerating progress oftechnology. On the contrary, Porter externalitieslower pure and scale efficiency, hence imposing anegative effect on both technical efficiency and tech-nical progress, which ultimately reduces the growthrate of TFP. Jacobs externalities facilitate increase ofscale efficiency and technical progress, but impederising of pure technical efficiency. Therefore, the pos-itive influence on TFP is not obvious.
478industria textila 2017, vol. 68, nr. 6˘
Fig. 2. Total factor productivity changes andits compositions from 2003 to 2014
Source: own research
The location has little effect on the three externalitiesexcept for pure technical efficiency.Conclusions can be drawn as follows: At present,enhancement of TFP of China’s textile industry ismore dependent on MAR externalities, namely spe-cialization. Specialization promotes the efficiency andtechnical progress through the diffusion of tacit andtechnical knowledge, thus contributing to the growthof TFP. Jacobs externalities have insufficient impact
on the textile industry. However, Porter externalitieshamper the development of TFP.There are some limits of this research: (1) we onlyselected data with designated size of Chinese textileenterprises as samples, (2) this paper only studiedthe effects of agglomeration externalities on TFP, and(3) the reason for impediment of Porter externalitieson TFP were not discussed intensively due to thecontext limit. Further work will focus on these limits.
479industria textila 2017, vol. 68, nr. 6˘
VARIABLES
(1) (2) (3) (4) (5)
lnTFPC lnEFC lnTEC lnPEC lnSEC
lnMARC0.105 0.0340 0.168* 0.109 –0.164*
(0.115) (0.110) (0.0876) (0.106) (0.0894)
lnJACC–0.160 –0.371 0.156 –0.464** 0.236
(0.258) (0.249) (0.154) (0.189) (0.248)
lnPORC–0.0982 –0.230** –0.0129 –0.0838 –0.124
(0.111) (0.108) (0.0649) (0.139) (0.140)
DUM_E0.111 0.198 0.0475 –0.0826 0.338
(0.196) (0.234) (0.127) (0.128) (0.478)
DUM_M–0.391 –0.361 –0.120 –0.337** –0.836
(0.279) (0.273) (0.182) (0.148) (0.559)
L.lnTFPC–0.478***(0.0371)
L2.lnTFPC–0.158**(0.0678)
L.lnEFC–0.413***(0.0809)
L2.lnEFC–0.0602(0.0972)
L.lnTEC–0.149*(0.0816)
L2.lnTEC–0.208***(0.0536)
L.lnPEC–0.559***(0.137)
L2.lnPEC–0.149(0.105)
L.lnSEC–0.328*(0.176)
L2.lnSEC–0.184**(0.0811)
Constant0.226** 0.125 0.0613 0.169*** 0.157*
(0.108) (0.0936) (0.0531) (0.0510) (0.0842)
Observations 261 261 261 261 261
Number of firm 29 29 29 29 29
Arellano-Bond test forAR(2) (pr>z) 0.981 0.770 0.419 0.908 0.740
Hansen test of overid.(prob>chi2) 0.160 0.209 0.116 0.193 0.134
Wald chi2 277.16 85.01 21.39 60.82 55.97
Table 1
Standard errors in parentheses: *** p < 0.01, ** p < 0.05, * p < 0.1
480industria textila 2017, vol. 68, nr. 6˘
BIBLIOGRAPHY
[1] Glaeser, E.L., Kallal, H.D., Scheinkman, J.A. et al., Growth in cities, In: Journal of Political Economy, 1992, vol. 100,no. Volume 100, Number 6, pp. 1126–1152.
[2] Beaudry, C., and Schiffauerova, A., Who’s right, Marshall or Jacobs? The localization versus urbanization debate,In: Research Policy, 2009, vol. 38, no. 2, pp. 318–337.
[3] Escriba-Perez, F.J., and Murgui-Garcia, M.J., Time varying agglomeration effects on total factor productivity inSpanish regions (1995–2008), In: Regional & Sectoral Economic Studies, 2014, vol. 14, no. 2, pp. 75–90.
[4] Widodo, W., Salim, R., and Bloch, H. Agglomeration economies and productivity growth in manufacturing industry:Empirical evidence from Indonesia, In: Economic Record, 2014, vol. 90, no. Supplement, pp. 41–58.
[5] Batisse, C. Dynamic externalities and local growth: A panel data analysis applied to Chinese provinces, In: ChinaEconomic Review, 2002, vol. 13, no. 2–3, pp. 231–251.
[6] Partridge, C., and Dan, S.R., Static and dynamic externalities, industry composition, and state labor productivity:A panel study of states, In: Southern Economic Journal, 1999, vol. 66, no. 2, pp. 319–335.
[7] Lee, B.S., Sosin, K., and Hong, S.H. Sectoral manufacturing productivity growth in Korean regions, In: UrbanStudies, 2005, vol. 42, no. 42, pp. 1201–1219.
[8] Agovino, M., and Rapposelli, A. Agglomeration externalities and technical efficiency in Italian regions, In: Quality &Quantity, 2015, vol. 49, no. 5, pp. 1–20.
[9] Florescu, M.S., and Ivanov, F. Globalization as a factor of influence on the R&D activity and the case of the textileindustry in Romania, In: Industria Textila, 2016, vol. 67, no. 5, pp. 345–350.
[10] Griliches, Z. Issues in Assessing the contribution of research and development to productivity growth, In: BellJournal of Economics, 1979, vol. 10, no. 1, pp. 92–116.
[11] Jaffe, A.B. Real effects of academic research, In: American Economic Review, 1989, vol. 79, no. 5, pp. 957–970.[12] Caves, D.W., Christensen, L.R., and Diewert, W.E. The economic theory of index numbers and the measurement
of input, output, and productivity, In: Econometrica, 1982, vol. 50, no. 6, pp. 1393–1414.[13] Färe, R., and Grosskopf, S. Malmquist productivity indexes and Fisher ideal indexes, In: Economic Journal, 1992,
vol. 102, no. 410, pp. 158–160.[14] Frenken, K., Van Oort, F.G., Verburg T. et al., Variety and regional economic growth in the Netherlands, In: Ssrn
Electronic Journal, 2004, vol. 144, no. 2, pp. 179–80.[15] Arellano, M., and Bover, O., Another look at instrumental variable estimation of error component models, In: Journal
of Econometrics, 1990, vol. 68, no. 1, pp. 29–51.[16] Blundell, R., and Bond, S. Initial conditions and moment restrictions in dynamic panel data models, In: Journal of
Econometrics, 1998, vol. 87, no. 1, pp. 115–143.[17] Henderson, J.V. Marshall’s scale economies, In: Journal of Urban Economics, 2003, vol. 53, no. 1, pp. 1–28.[18] Martin, P., Mayer, T., and Mayneris, F. Spatial concentration and plant-level productivity in France, In: Journal of
Urban Economics, 2011, vol. 69, no. 2, pp. 182–195.
Authors:
HUA YUAN1, JUNJIE ZHANG2, YUN ZHANG3, YAN HONG4, HONGZHONG ZHAO1
1 Wuhan University of Technology, School of economicsHongshan District, Luo Shi Road, No. 122, 430070, Wuhan, China
e-mail: [email protected] Wuhan Textile University, Department of Mathematics and Computer
430000, Wuhan, Chinae-mail: [email protected]
3 Wuhan Donghu University, School of EconomicsJiangxia District, Wenhua Road 301, 430212, Wuhan, China
e-mail: [email protected] Soochow University, College of Textile and Clothing Engineering
215012, Suzhou, Chinae-mail: [email protected]
Corresponding author:
JUNJIE ZHANG
e-mail: [email protected]