industria textila nr 3-2019 web.pdfindustria textila˘ 204 2019, vol. 70, nr. 3 205 211 216 223 229...
TRANSCRIPT
IndustriaTextila
ISSN 1222–5347
3/2019
COLEGIULDE REDACTIE:
Dr. ing. CARMEN GHIŢULEASACS I – DIRECTOR GENERAL
Institutul Naţional de Cercetare-Dezvoltare pentru Textile şi Pielărie – Bucureşti
Dr. ing. EMILIA VISILEANUCS I – EDITOR ŞEF
Institutul Naţional de Cercetare-Dezvoltare pentru Textile şi Pielărie – Bucureşti
Conf. univ. dr. ing. MARIANA URSACHEDECAN
Facultatea de Textile-Pielărieşi Management Industrial, Universitatea
Tehnică „Ghe. Asachi“ – Iaşi
Prof. dr. GELU ONOSECS I
Universitatea de Medicină şi Farmacie„Carol Davila“ – Bucureşti
Prof. dr. ing. ERHAN ÖNERMarmara University – Turcia
Prof. dr. S. MUGE YUKSELOGLUMarmara University – Turcia
Prof. univ. dr. DOINA I. POPESCUAcademia de Studii Economice – Bucureşti
Prof. univ. dr. ing. CARMEN LOGHINPRO-RECTOR
Universitatea Tehnică „Ghe. Asachi“ – Iaşi
Prof. univ. dr. MARGARETA STELEA FLORESCUAcademia de Studii Economice – Bucureşti
Prof. dr. ing. LUIS ALMEIDAUniversity of Minho – Portugal
Prof. dr. LUCIAN CONSTANTIN HANGANUUniversitatea Tehnică „Ghe. Asachi“ – Iaşi
Dr. AMINODDIN HAJI PhD, MSc, BSc, Textile Chemistry
and Fiber ScienceASSISTANT PROFESSOR
Textile Engineering DepartmentYazd University
Yazd, Iran
Dr. ADNAN MAZARIASSISTANT PROFESSOR
Department of Textile Clothing Faculty of Textile Engineering
Technical University of LiberecCzech Republic
205–210
211–215
216–222
223–228
229–235
236–241
242–247
RALUCA MARIA AILENI, RAZVAN ION RADULESCU, LAURA CHIRIAC, LILIOARA SURDU Evaluarea ciclului de viață al textilelor electroconductoare funcționalizate prin tehnologii avansate (plasmă) și depunere de micro/nanoparticule metalice
MOHSIN MUHAMMAD, NAI-WEN LI, AUNJAM SOHAIL MUHAMMAD, MAJEED KASHIF MUHAMMADInvestigarea diferiților factori care influențează coeficientul de frecare al firelor folosind metoda Taguchi
MUSA KILIC, GONCA BALCI KILIC, EFLATUN TIRYAKI, H. KÜBRA KAYNAK, MURAT DEMIREfectele utilizării deșeurilor de bumbac asupra proprietăților firelor filate cu rotor OE și ale materialelor tricotate
RALUCA MARIA AILENI, LAURA CHIRIAC, SILVIA ALBICI, ADRIANA SUBTIRICA, LAURENTIU CRISTIAN DINCAAspecte ale sustenabilității efectului hidrofob obținut în plasmă pentru țesăturile din bumbac
YAO LU, SI CHEN, NAN-NAN LI, BIN HU, YOU-KAI CHEN, SHUANG-LIN ZHOU Prepararea plasei PDO și studio privind parametrii de fabricare
LAURA CHIRILA, CARMEN GAIDAU, MALVINA STROE, MIHAELA BAIBARAC, MARIA STANCA, DENISA MARIA RĂDULESCU, DIANA ELENA RĂDULESCU, COSMIN-ANDREI ALEXEProprietățile materialelor textile și din piele tratate cu noi nanocompozite hibride pe bază de SiO2/TiO2/poli(2,2’-bitiofen)
MIHAI-ALEXANDRU PĂUN, ADRIAN FRUNZĂ, ELENA-LUMINIȚA STĂNCIULESCU, TIBERIU-CIPRIAN MUNTEANU, IOAN CRISTESCU, SABINA GRAMA, ALEXANDRA ENE, CARMEN MIHAI, ALEXANDRU CHIOTOROIUUtilizarea plaselor din polipropilenă acoperite cu collagen pentru chirurgia reconstructivă nazală
ONUR UGUR CINKO, BEHCET BECERIRDependența formulelor de diferență a culorii asupra modificărilor coordonatelor de culoare în spațiul de culoare CIELAB 248–254
RIZA ATAV, A. ÖZGÜR AĞIRGAN, DERMAN VATANSEVER BAYRAMOL, AYLIN YILDIZComplecși de incluziune ai β-ciclodextrinei cu Fe3O4@HA@AgPartea I: Preparare și caracterizare 255–258
SÜMEYYE ÜSTÜNTAĞ, HÜSEYIN GAZI TÜRKSOYOptimizarea parametrilor de acoperire pentru permeabilitatea la aer a țesăturilor denim prin metoda Taguchi 259–264
JOSÉ-VICENTE TOMÁS-MIQUEL, MANUEL EXPÓSITO-LANGA, GABRIEL BRĂTUCU, OANA BĂRBULESCUStudiu privind efectele rețelelor interorganizaționale asupra inovării din industria textilă. Cazul unui cluster din Valencia, Spania 265–271
TEODOR HADA, NICOLETA BĂRBUŢĂ-MIŞU, TEODORA MARIA AVRAMEvaluarea performanței financiare a firmelor din industria textilă din România 272–277
GAMZE SÜPÜREN MENGÜÇ, EYLEN SEMA DALBAŞI, ARIF TANER ÖZGÜNEY, NILGÜN ÖZDİLStudiu comparativ al tușeului țesăturilor din bambus și bumbac 278–284
MANOJ KUMAR PARAS, ANTONELA CURTEZA, RUDRAJEET PAL, LICHUAN WANG, YAN CHENUn studiu de caz din România privind valorificarea îmbrăcămintei și a accesoriilor 285–290
YUSUF KAYA, GIZEM GÜNAYDIN KARAKAN, EMILIA VISILEANUImpactul mișcărilor de schimb valutar asupra sectorului textil din Turcia 291–296
Editatã în 6 nr./an, indexatã ºi recenzatã în:Edited in 6 issues per year, indexed and abstracted in:
Science Citation Index Expanded (SciSearch®), Materials ScienceCitation Index®, Journal Citation Reports/Science Edition, World Textile
Abstracts, Chemical Abstracts, VINITI, Scopus, Toga FIZ technikProQuest Central, Crossref DOI
Editatã cu sprijinul Ministerului Cercetãrii ºi Inovãrii
Revistã cotatã ISI ºi inclusã în Master Journal List a Institutului pentruªtiinþa Informãrii din Philadelphia – S.U.A., începând cu vol. 58, nr. 1/2007/ISI rated magazine, included in the ISI Master Journal List of the Instituteof Science Information, Philadelphia, USA, starting with vol. 58, no. 1/2007
¸
˘
203industria textila 2019, vol. 70, nr. 3˘
Recunoscutã în România, în domeniul ªtiinþelor inginereºti, de cãtre
Consiliul Naþional al Cercetãrii ªtiinþifice din Învãþãmântul Superior(C.N.C.S.I.S.), în grupa A /
Aknowledged in Romania, in the engineering sciences domain,
by the National Council of the Scientific Research from the Higher Education
(CNCSIS), in group A
204industria textila 2019, vol. 70, nr. 3˘
205
211
216
223
229
236
242
248
255
259
265
272
278
285
291
Life cycle assessment of the electroconductive textiles functionalized by advanced technologies(plasma) and metallic micro/nanoparticles deposition
Investigation of various factors affecting the coefficient of friction of yarn by using Taguchi method
Effects of waste cotton usage on properties of OE-rotor yarns and knitted fabrics
Aspects of the hydrophobic effect sustainability obtained in plasma for cotton fabrics
Preparation of PDO mesh and research on its fabrication parameters
Properties of textile and leather materials treated with new hybrid SiO2/TiO2/poly(2,2’-bithiophene)nanocomposites
The use of collagen-coated polypropylene meshes for nasal reconstructive surgery
Dependence of colour difference formulae on regular changes of colour coordinates in CIELABcolour space
Inclusion complexes of �-cyclodextrine with Fe3O4@HA@Ag Part I: Preparation and characterization
Optimization of coating parameters for air permeability of denim fabrics through Taguchi method
Unravelling the effects of interorganizational networks on innovation in the textile industry. Thecase of the Valencian cluster in Spain
Evaluating firms’ financial performance in textile industry of Romania
A comparative study on handle properties of bamboo and cotton fabrics
A Romanian case study of clothes and accessories upcycling
The impact of foreign exchange movements on Turkish textile sector
EDITORIAL STAFF
Editor-in-chief: Dr. eng. Emilia Visileanu
Graphic designer: Florin Prisecaru
e-mail: [email protected]
Scientific reviewers for the papers published in this number :
The INDUSTRIA TEXTILA magazine, edited by INCDTP BUCHAREST, implements and respects Regulation 2016/679/EU on the protection of individuals with
regard to the processing of personal data and on the free movement of such data (“RGPD”). For information, please visit the Personal Data Processing Protection
Policy link: E-mail DPO [email protected]
Contents
Journal edited in colaboration with Editura AGIR , 118 Calea Victoriei, sector 1, Bucharest, tel./fax: 021-316.89.92; 021-316.89.93;
e-mail: [email protected], www.edituraagir.ro
Prof. Ciocoiu Mihai, “Gh. Asachi” Technical University, Iasi, RomaniaDr. Sajjad Ahmad Baig, National Textile University Faisalabad, Pakistan
Prof. Pablo Diaz Garcia, Polytechnic University of Valencia, SpainDr. Geetika Varshneya, Development Management Institute, Bihar, India
Dr. Concepció Casas, A3 Leather Innovation Center, SpainDr. Bojana Voncina, University of Maribor, Slovenia
Assoc. Prof. Dr. Ercan Şenyiğit, Erciyes University, Engineering Faculty, Industrial Engineering Department, Kayseri, TurkyProf. Josep Capo-Vicedo, Universitat Politècnica de València, Spain
Assoc. Prof. Dr. Hatice Harmankaya, Selçuk University, Department of Fashion Design, Selcuk, Turky
RALUCA MARIA AILENI, RAZVAN ION RADULESCU, LAURA CHIRIAC, LILIOARA SURDU
MOHSIN MUHAMMAD, NAI-WEN LI, AUNJAM SOHAIL MUHAMMAD, MAJEED KASHIF MUHAMMAD
MUSA KILIC, GONCA BALCI KILIC, EFLATUN TIRYAKI, H. KÜBRA KAYNAK, MURAT DEMIR
RALUCA MARIA AILENI, LAURA CHIRIAC, SILVIA ALBICI, ADRIANA SUBTIRICA, LAURENTIU CRISTIAN DINCA
YAO LU, SI CHEN, NAN-NAN LI, BIN HU, YOU-KAI CHEN, SHUANG-LIN ZHOU
LAURA CHIRILA, CARMEN GAIDAU, MALVINA STROE, MIHAELA BAIBARAC, MARIA STANCA, DENISA MARIA RĂDULESCU, DIANA ELENA RĂDULESCU, COSMIN-ANDREI ALEXE
MIHAI-ALEXANDRU PĂUN, ADRIAN FRUNZĂ, ELENA-LUMINIȚA STĂNCIULESCU, TIBERIU-CIPRIAN MUNTEANU, IOAN CRISTESCU, SABINA GRAMA, ALEXANDRA ENE, CARMEN MIHAI, ALEXANDRU CHIOTOROIU
ONUR UGUR CINKO, BEHCET BECERIR
RIZA ATAV, A. ÖZGÜR AĞIRGAN, DERMAN VATANSEVER BAYRAMOL, AYLIN YILDIZ
SÜMEYYE ÜSTÜNTAĞ, HÜSEYIN GAZI TÜRKSOY
JOSÉ-VICENTE TOMÁS-MIQUEL, MANUEL EXPÓSITO-LANGA, GABRIEL BRĂTUCU, OANA BĂRBULESCU
TEODOR HADA, NICOLETA BĂRBUŢĂ-MIŞU, TEODORA MARIA AVRAM
GAMZE SÜPÜREN MENGÜÇ, EYLEN SEMA DALBAŞI, ARIF TANER ÖZGÜNEY, NILGÜN ÖZDİL
MANOJ KUMAR PARAS, ANTONELA CURTEZA, RUDRAJEET PAL, LICHUAN WANG, YAN CHEN
YUSUF KAYA, GIZEM GÜNAYDIN KARAKAN EMILIA VISILEANU
INTRODUCTION
The recent studies concerning the harmful effect ofchemicals for health, land, water, air or GES (green -house gases) disposal in the atmosphere, concludethat is a direct influence between industrial rev olu -tions and occurrence of the diseases such as can-cers and climatic changes. According to GlobalClimate Report, NOAA, 2018, in 2018, 11 months atglobal land and ocean level, the temperature depar-tures from average ranked among the five warmestfor their respective months. Also, the years2015–2017 each had a global temperature departurefrom average that was more than 1.0°C above the1880–1900 average, a period that represents thepre-industrial conditions [1]. The greenhouse gasessuch as carbon dioxide, methane, nitrous oxide, andfluorinated gases, when are emitted become trapped
in the Earth ‘atmosphere, and therefore, the heatbecomes trapped inside greenhouse [2].However, from the end of the 1700s, the net globaleffect of human activities has generated a continualincrease in greenhouse gas concentrations and glob-al warming of the past 50 years [3–5]. The green-house gases affect climate, including surface air andocean temperatures, precipitation, and sea levels.Besides, human health, agriculture, water resources,forests, wildlife, and coastal areas are all vulnerableto climate change [5]. The greenhouse gases remainin the atmosphere for tens to hundreds of years afterbeing released [4–5]. Also, emissions in the atmosphere decrease theozone layer, and this promotes increased UV-B levelthat has adverse effects on human health because it
Life cycle assessment of the electroconductive textiles functionalized byadvanced technologies (plasma) and metallic micro/nanoparticles deposition
DOI: 10.35530/IT.070.03.1476
RALUCA MARIA AILENI LAURA CHIRIACRAZVAN ION RADULESCU LILIOARA SURDU
REZUMAT – ABSTRACT
Evaluarea ciclului de viață al textilelor electroconductoare funcționalizate prin tehnologii avansate (plasmă)și depunere de micro/nanoparticule metalice
Această lucrare prezintă mai multe aspecte privind evaluarea ciclului de viață al textilelor electroconductoare funcțio -nalizate prin tehnologia avansată cu plasmă RF pe bază de argon și oxigen și depunerea de micro/nanoparticulelemetalice. Pentru a obține textile cu proprietăți electroconductoare, planul nostru preliminar a constat în funcționalizareatextilelor prin utilizarea tehnologiei cu plasmă RF pe bază de argon și oxigen și a proceselor de depunere amicro/nanoparticulelor, cum ar fi fulardarea, imprimarea directă și depunerea de pelicule subțiri. S-a analizat inventarulciclului de viață (LCI) și s-a elaborat studiul pentru evaluarea ciclului de viață (LCA) folosind software-ul SimaPro șiEco-indicator 99. Pentru a obține LCI, s-au utilizat datele tehnice de intrare și ieșire din procesele cu plasmă și software-ulSimaPro pentru generarea LCI și LCA. Datele de intrare despre materia primă, energia, substanțele chimice au fostcolectate prin măsurători directe pe echipamente, manuale de utilizare și specificațiile echipamentelor (cărți tehnice) șiprocese. Datele de ieșire au fost obținute utilizând software-ul SimaPro conectat la baze de date de pe internet. Obiectivulstudiului a fost studierea evaluării ciclului de viață al textilelor electroconductoare funcționalizate prin tehnologia cu plasmăRF în comparație cu tratamentele de funcționalizare clasice.
Cuvinte-cheie: tehnologia cu plasmă, microundă, microparticule, electroconductor, LCA, textile
Life cycle assessment of the electroconductive textiles functionalized by advanced technologies (plasma) andmetallic micro/nanoparticles deposition
This paper presents aspects concerning the life cycle assessment of the electroconductive textile functionalized byadvanced RF plasma technology based on argon and oxygen gases and deposition of the metallic micro/nanoparticles. Inorder to obtain the textiles with electroconductive properties, the preliminary plan consisted functionalization of the textilesby using RF plasma technology based on argon and oxygen gases and processes for micro/nanoparticles deposition suchas foulard, direct printing, and thin film position. It was analyzed the life-cycle inventory (LCI) and was provided the studyfor life-cycle assessment (LCA) using SimaPro software and Eco-indicator 99. In order to obtain the LCI, we used to inputand output technical data, from the plasma process, and the SimaPro software for generating the LCI and LCA. The inputdata about raw material, energy, chemical substances, have been collected by direct measurements on machinery, devicelog, and specifications of the equipment (technical books) and processes. The output data was obtained using SimaProsoftware connected to internet-specific databases. The purpose of our research has been to study the life cycleassessment of the electroconductive textiles functionalized by RF plasma technology in comparison with classicalfunctionalization treatments.
Keywords: plasma technology, microwave, microparticles, electroconductive, LCA, textile
205industria textila 2019, vol. 70, nr. 3˘
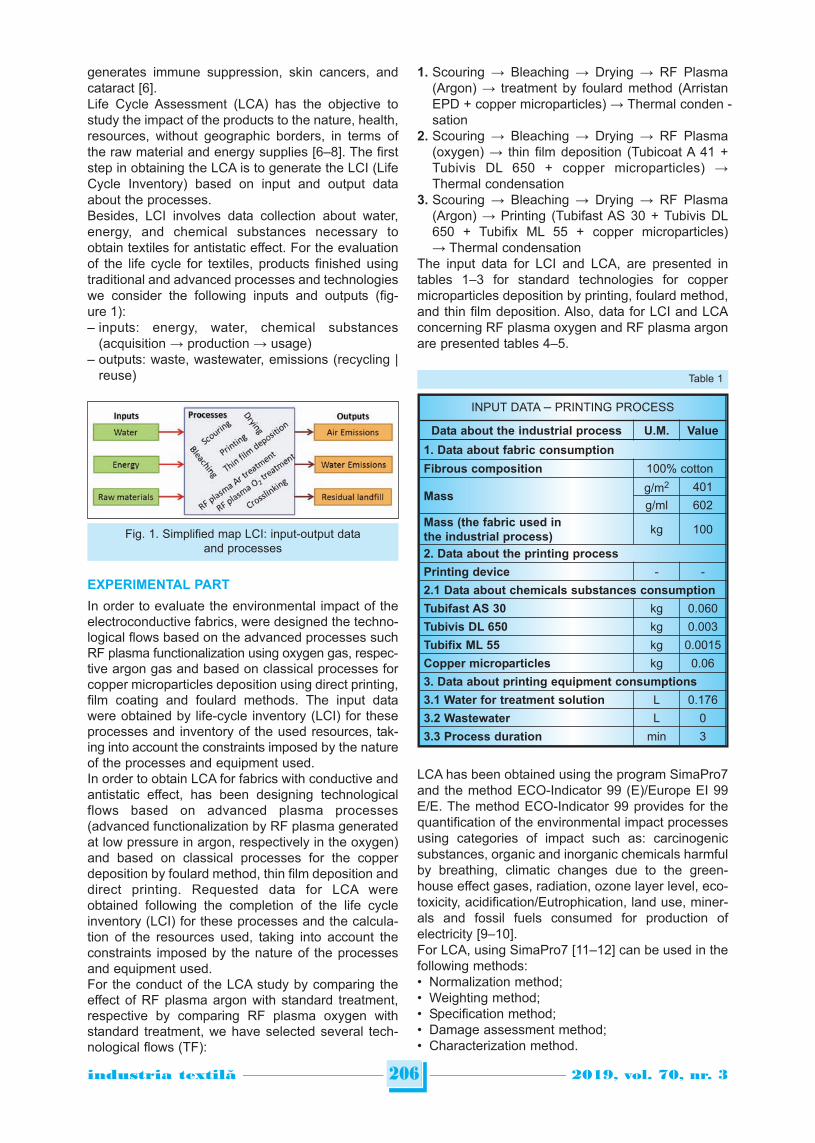
generates immune suppression, skin cancers, andcataract [6].Life Cycle Assessment (LCA) has the objective tostudy the impact of the products to the nature, health,resources, without geographic borders, in terms ofthe raw material and energy supplies [6–8]. The firststep in obtaining the LCA is to generate the LCI (LifeCycle Inventory) based on input and output dataabout the processes.Besides, LCI involves data collection about water,energy, and chemical substances necessary toobtain textiles for antistatic effect. For the evaluationof the life cycle for textiles, products finished usingtraditional and advanced processes and technologieswe consider the following inputs and outputs (fig-ure 1):– inputs: energy, water, chemical substances
(acquisition → production → usage)– outputs: waste, wastewater, emissions (recycling |
reuse)
EXPERIMENTAL PART
In order to evaluate the environmental impact of theelectroconductive fabrics, were designed the techno-logical flows based on the advanced processes suchRF plasma functionalization using oxygen gas, respec-tive argon gas and based on classical processes forcopper microparticles deposition using direct printing,film coating and foulard methods. The input datawere obtained by life-cycle inventory (LCI) for theseprocesses and inventory of the used resources, tak-ing into account the constraints imposed by the natureof the processes and equipment used. In order to obtain LCA for fabrics with conductive andantistatic effect, has been designing technologicalflows based on advanced plasma processes(advanced functionalization by RF plasma generatedat low pressure in argon, respectively in the oxygen)and based on classical processes for the copperdeposition by foulard method, thin film deposition anddirect printing. Requested data for LCA wereobtained following the completion of the life cycleinventory (LCI) for these processes and the calcula-tion of the resources used, taking into account theconstraints imposed by the nature of the processesand equipment used. For the conduct of the LCA study by comparing theeffect of RF plasma argon with standard treatment,respective by comparing RF plasma oxygen withstandard treatment, we have selected several tech-nological flows (TF):
1. Scouring → Bleaching → Drying → RF Plasma(Argon) → treatment by foulard method (ArristanEPD + copper microparticles) → Thermal conden -sation
2. Scouring → Bleaching → Drying → RF Plasma(oxygen) → thin film deposition (Tubicoat A 41 +Tubivis DL 650 + copper microparticles) →Thermal condensation
3. Scouring → Bleaching → Drying → RF Plasma(Argon) → Printing (Tubifast AS 30 + Tubivis DL650 + Tubifix ML 55 + copper microparticles)→ Thermal condensation
The input data for LCI and LCA, are presented intables 1–3 for standard technologies for coppermicro particles deposition by printing, foulard method,and thin film deposition. Also, data for LCI and LCAconcerning RF plasma oxygen and RF plasma argonare presented tables 4–5.
LCA has been obtained using the program SimaPro7and the method ECO-Indicator 99 (E)/Europe EI 99E/E. The method ECO-Indicator 99 provides for thequantification of the environmental impact processesusing categories of impact such as: carcinogenicsubstances, organic and inorganic chemicals harmfulby breathing, climatic changes due to the green-house effect gases, radiation, ozone layer level, eco-toxicity, acidification/Eutrophication, land use, miner-als and fossil fuels consumed for production ofelectricity [9–10].For LCA, using SimaPro7 [11–12] can be used in thefollowing methods:• Normalization method;• Weighting method;• Specification method; • Damage assessment method; • Characterization method.
206industria textila 2019, vol. 70, nr. 3˘
Fig. 1. Simplified map LCI: input-output dataand processes
INPUT DATA – PRINTING PROCESS
Data about the industrial process U.M. Value
1. Data about fabric consumption
Fibrous composition 100% cotton
Massg/m2 401
g/ml 602
Mass (the fabric used in the industrial process)
kg 100
2. Data about the printing process
Printing device - -
2.1 Data about chemicals substances consumption
Tubifast AS 30 kg 0.060
Tubivis DL 650 kg 0.003
Tubifix ML 55 kg 0.0015
Copper microparticles kg 0.06
3. Data about printing equipment consumptions
3.1 Water for treatment solution L 0.176
3.2 Wastewater L 0
3.3 Process duration min 3
Table 1
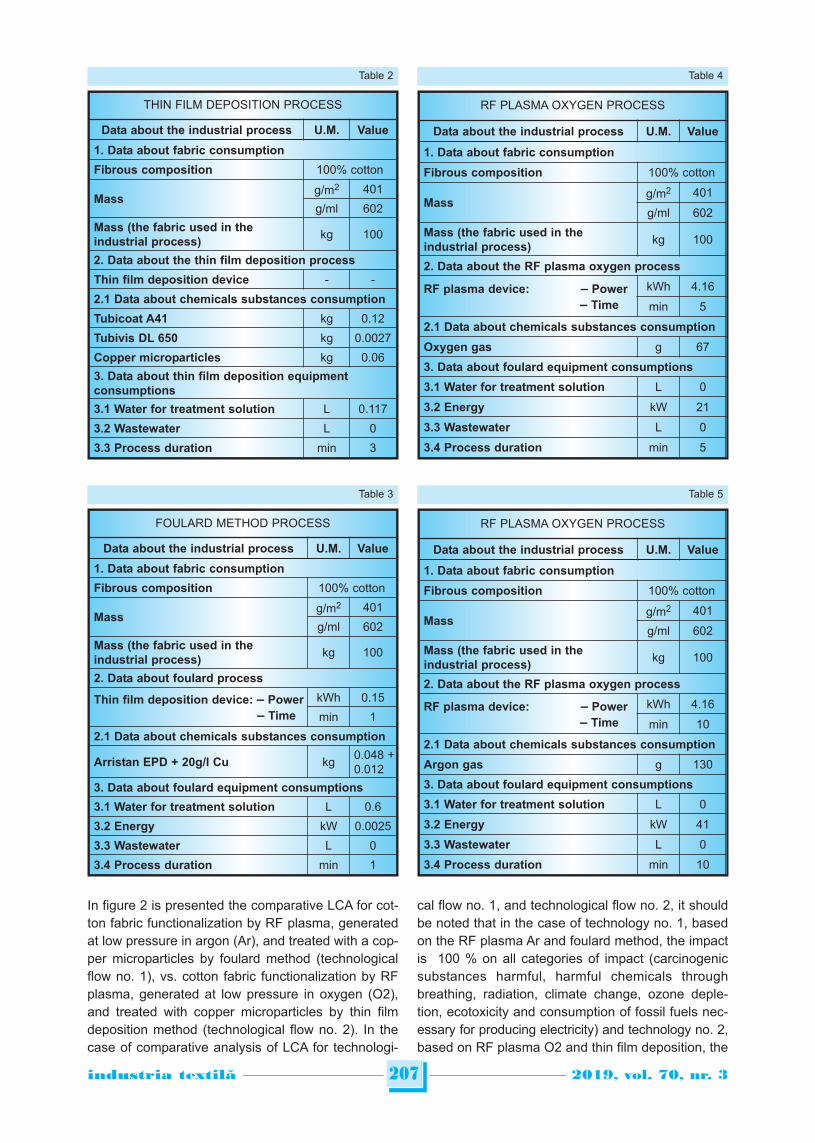
In figure 2 is presented the comparative LCA for cot-ton fabric functionalization by RF plasma, generatedat low pressure in argon (Ar), and treated with a cop-per microparticles by foulard method (technologicalflow no. 1), vs. cotton fabric functionalization by RFplasma, generated at low pressure in oxygen (O2),and treated with copper microparticles by thin filmdeposition method (technological flow no. 2). In thecase of comparative analysis of LCA for technologi-
cal flow no. 1, and technological flow no. 2, it shouldbe noted that in the case of technology no. 1, basedon the RF plasma Ar and foulard method, the impactis 100 % on all categories of impact (carcinogenicsubstances harmful, harmful chemicals throughbreathing, radiation, climate change, ozone deple-tion, ecotoxicity and consumption of fossil fuels nec-essary for producing electricity) and technology no. 2,based on RF plasma O2 and thin film deposition, the
207industria textila 2019, vol. 70, nr. 3˘
FOULARD METHOD PROCESS
Data about the industrial process U.M. Value
1. Data about fabric consumption
Fibrous composition 100% cotton
Massg/m2 401
g/ml 602
Mass (the fabric used in the industrial process)
kg 100
2. Data about foulard process
Thin film deposition device: – Power
– Time
kWh 0.15
min 1
2.1 Data about chemicals substances consumption
Arristan EPD + 20g/l Cu kg0.048 +0.012
3. Data about foulard equipment consumptions
3.1 Water for treatment solution L 0.6
3.2 Energy kW 0.0025
3.3 Wastewater L 0
3.4 Process duration min 1
Table 3
RF PLASMA OXYGEN PROCESS
Data about the industrial process U.M. Value
1. Data about fabric consumption
Fibrous composition 100% cotton
Massg/m2 401
g/ml 602
Mass (the fabric used in the industrial process)
kg 100
2. Data about the RF plasma oxygen process
RF plasma device: – Power
– Time
kWh 4.16
min 10
2.1 Data about chemicals substances consumption
Argon gas g 130
3. Data about foulard equipment consumptions
3.1 Water for treatment solution L 0
3.2 Energy kW 41
3.3 Wastewater L 0
3.4 Process duration min 10
Table 5
RF PLASMA OXYGEN PROCESS
Data about the industrial process U.M. Value
1. Data about fabric consumption
Fibrous composition 100% cotton
Massg/m2 401
g/ml 602
Mass (the fabric used in the industrial process)
kg 100
2. Data about the RF plasma oxygen process
RF plasma device: – Power
– Time
kWh 4.16
min 5
2.1 Data about chemicals substances consumption
Oxygen gas g 67
3. Data about foulard equipment consumptions
3.1 Water for treatment solution L 0
3.2 Energy kW 21
3.3 Wastewater L 0
3.4 Process duration min 5
Table 4
THIN FILM DEPOSITION PROCESS
Data about the industrial process U.M. Value
1. Data about fabric consumption
Fibrous composition 100% cotton
Massg/m2 401
g/ml 602
Mass (the fabric used in the industrial process)
kg 100
2. Data about the thin film deposition process
Thin film deposition device - -
2.1 Data about chemicals substances consumption
Tubicoat A41 kg 0.12
Tubivis DL 650 kg 0.0027
Copper microparticles kg 0.06
3. Data about thin film deposition equipment consumptions
3.1 Water for treatment solution L 0.117
3.2 Wastewater L 0
3.3 Process duration min 3
Table 2
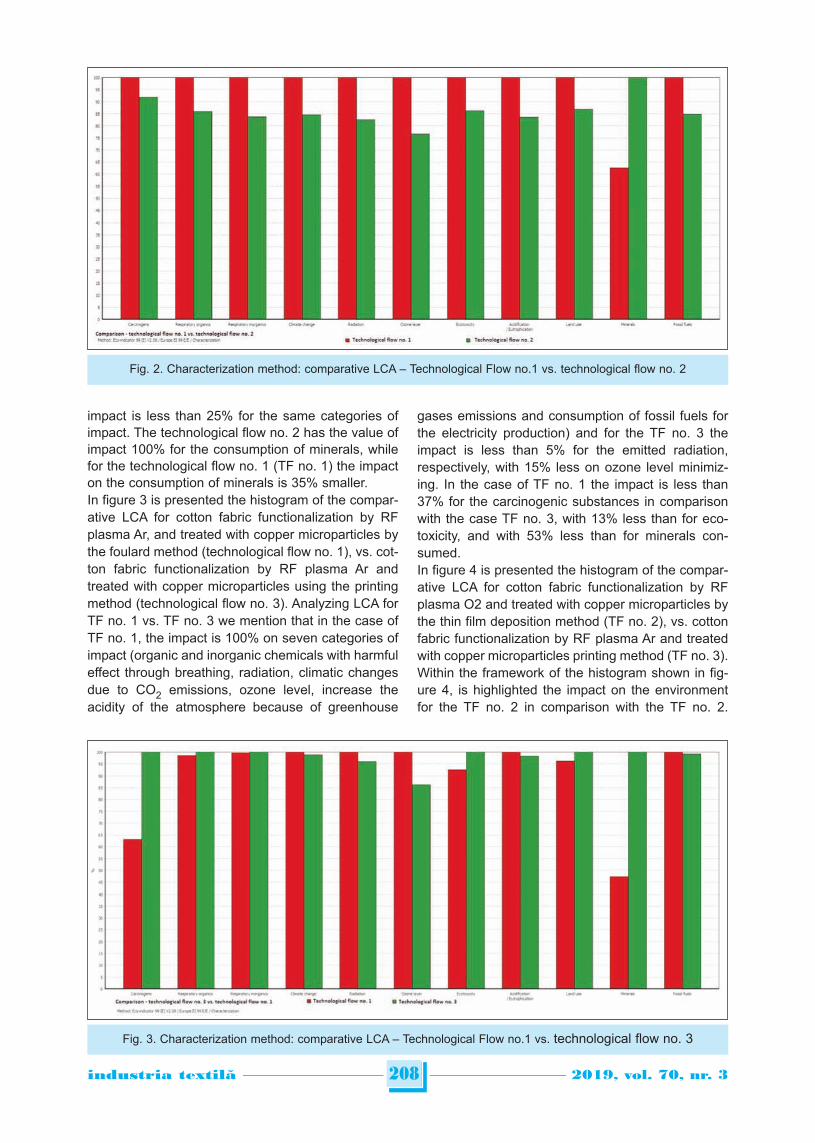
impact is less than 25% for the same categories ofimpact. The technological flow no. 2 has the value ofimpact 100% for the consumption of minerals, whilefor the technological flow no. 1 (TF no. 1) the impacton the consumption of minerals is 35% smaller.In figure 3 is presented the histogram of the compar-ative LCA for cotton fabric functionalization by RFplasma Ar, and treated with copper microparticles bythe foulard method (technological flow no. 1), vs. cot-ton fabric functionalization by RF plasma Ar andtreated with copper microparticles using the printingmethod (technological flow no. 3). Analyzing LCA forTF no. 1 vs. TF no. 3 we mention that in the case ofTF no. 1, the impact is 100% on seven categories ofimpact (organic and inorganic chemicals with harmfuleffect through breathing, radiation, climatic changesdue to CO2 emissions, ozone level, increase theacidity of the atmosphere because of greenhouse
gases emissions and consumption of fossil fuels forthe electricity production) and for the TF no. 3 theimpact is less than 5% for the emitted radiation,respectively, with 15% less on ozone level minimiz-ing. In the case of TF no. 1 the impact is less than37% for the carcinogenic substances in comparisonwith the case TF no. 3, with 13% less than for eco-toxicity, and with 53% less than for minerals con-sumed.In figure 4 is presented the histogram of the compar-ative LCA for cotton fabric functionalization by RFplasma O2 and treated with copper microparticles bythe thin film deposition method (TF no. 2), vs. cottonfabric functionalization by RF plasma Ar and treatedwith copper microparticles printing method (TF no. 3).Within the framework of the histogram shown in fig-ure 4, is highlighted the impact on the environmentfor the TF no. 2 in comparison with the TF no. 2.
208industria textila 2019, vol. 70, nr. 3˘
Fig. 2. Characterization method: comparative LCA – Technological Flow no.1 vs. technological flow no. 2
Fig. 3. Characterization method: comparative LCA – Technological Flow no.1 vs. technological flow no. 3
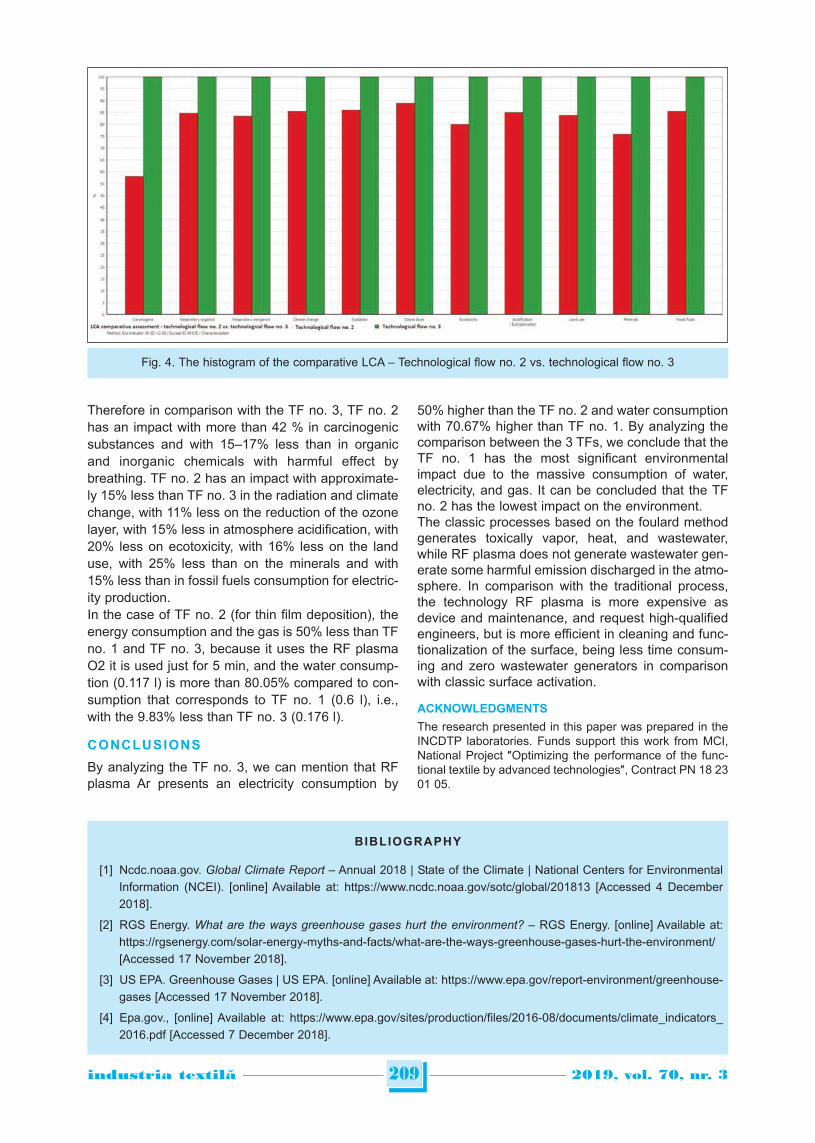
Therefore in comparison with the TF no. 3, TF no. 2has an impact with more than 42 % in carcinogenicsubstances and with 15–17% less than in organicand inorganic chemicals with harmful effect bybreathing. TF no. 2 has an impact with approximate-ly 15% less than TF no. 3 in the radiation and climatechange, with 11% less on the reduction of the ozonelayer, with 15% less in atmosphere acidification, with20% less on ecotoxicity, with 16% less on the landuse, with 25% less than on the minerals and with15% less than in fossil fuels consumption for electric-ity production.In the case of TF no. 2 (for thin film deposition), theenergy consumption and the gas is 50% less than TFno. 1 and TF no. 3, because it uses the RF plasmaO2 it is used just for 5 min, and the water consump-tion (0.117 l) is more than 80.05% compared to con-sumption that corresponds to TF no. 1 (0.6 l), i.e.,with the 9.83% less than TF no. 3 (0.176 l).
CONCLUSIONS
By analyzing the TF no. 3, we can mention that RFplasma Ar presents an electricity consumption by
50% higher than the TF no. 2 and water consumptionwith 70.67% higher than TF no. 1. By analyzing thecomparison between the 3 TFs, we conclude that theTF no. 1 has the most significant environmentalimpact due to the massive consumption of water,electricity, and gas. It can be concluded that the TFno. 2 has the lowest impact on the environment.The classic processes based on the foulard methodgenerates toxically vapor, heat, and wastewater,while RF plasma does not generate wastewater gen-erate some harmful emission discharged in the atmo-sphere. In comparison with the traditional process,the technology RF plasma is more expensive asdevice and maintenance, and request high-qualifiedengineers, but is more efficient in cleaning and func-tionalization of the surface, being less time consum-ing and zero wastewater generators in comparisonwith classic surface activation.
ACKNOWLEDGMENTS
The research presented in this paper was prepared in theINCDTP laboratories. Funds support this work from MCI,National Project ″Optimizing the performance of the func-tional textile by advanced technologies″, Contract PN 18 2301 05.
209industria textila 2019, vol. 70, nr. 3˘
BIBLIOGRAPHY
[1] Ncdc.noaa.gov. Global Climate Report – Annual 2018 | State of the Climate | National Centers for Environmental
Information (NCEI). [online] Available at: https://www.ncdc.noaa.gov/sotc/global/201813 [Accessed 4 December
2018].
[2] RGS Energy. What are the ways greenhouse gases hurt the environment? – RGS Energy. [online] Available at:
https://rgsenergy.com/solar-energy-myths-and-facts/what-are-the-ways-greenhouse-gases-hurt-the-environment/
[Accessed 17 November 2018].
[3] US EPA. Greenhouse Gases | US EPA. [online] Available at: https://www.epa.gov/report-environment/greenhouse-
gases [Accessed 17 November 2018].
[4] Epa.gov., [online] Available at: https://www.epa.gov/sites/production/files/2016-08/documents/climate_indicators_
2016.pdf [Accessed 7 December 2018].
Fig. 4. The histogram of the comparative LCA – Technological flow no. 2 vs. technological flow no. 3
210industria textila 2019, vol. 70, nr. 3˘
[5] Nca2009.globalchange.gov, Global Climate Change | Global Climate Change Impacts in the United States 2009Report Legacy site. [online] Available at: https://nca2009.globalchange.gov/global-climate-change/index.html[Accessed 7 December 2018].
[6] ILCD Handbook: Recommendations for Life Cycle Impact Assessment in the European context, European Union,ISBN �978-92-79-17451-3, 2011.
[7] Corti, A. and Lombardi, L. End life types: Alternative final disposal processes compared by LCA, In: Energy, 2004,29(12-15), pp. 2089–2108.
[8] Muthu, S.S. ed. Handbook of life cycle assessment (LCA) of textiles and clothing, Woodhead Publishing, 2015.
[9] Mary, A. C. Life Cycle Assessment Handbook, Wiley Publishing, USA, 2012.
[10] Suh, S. and Huppes, G. Methods for life cycle inventory of a product, In: Journal of Cleaner Production, 2005, 13(7),pp. 687–697.
[11] Walter, K., Birgit, G. Life Cycle Assessment (LCA), Wiley, 2014.
[12] SimaPro8. [online] Available at: http://www.simapro.co.uk/simapro8.html [Accessed 6 November 2018].
Authors:
RALUCA MARIA AILENIRAZVAN ION RADULESCU
LAURA CHIRIAC LILIOARA SURDU
National Research & Development Institute for Textiles and Leather, Lucretiu Patrascanu no.16, 030508 Bucharest, Romania
Corresponding author:
RALUCA MARIA AILENIe-mail: [email protected]
INTRODUCTION
In this modern era of 21st century, textile technologiesare designed for higher rates of productivity to fulfillone of the basic needs of increasing human popula-tion, clothing. This imposes some serious restrictionson materials and equipment to produce quality prod-uct with highest efficiency and low downtimes. COFof yarns play an important role in textile fabrication,particularly in knitting where a combination of nee-dles works together at high speeds and yarns passthrough the hooks of needles. To produce faultlessquality product, increase life of knitting needle andreduce yarn fluff in knitting process, COF of yarnsmust be lowest and within the tolerance level. In knit-ting, in our opinion, type of yarn material, spinningprocess and finishing method are the major impactfactors need to be measured.
RELATED LITERATURE
Yarn formation is not as simple as its definition; itinvolves vast technologies, materials and influencingfactors and used to produce wide range of textileproducts [1]. Frictional forces between yarns andknitting needles produce heat cause breakage ofknitting needles and yarns [2]. An increase in yarnfriction results in high end breakage rate at knittingand weaving [3]. Fiber parameters, yarn structural andbulk parameters, operational parameters and finishes
are the major factors to affect the yarn frictionalparameters [4]. Yarn twist is inversely while com-pressibility is found directly proportional to COF ofyarn [5]. Rougher yarns have high COF in case ofyarn-to-yarn while low COF in case of yarn to metalfriction [6]. COF could be measured by Twist frictionmethod, Capstan method, Amonton’s law method,Lindberg and Gralen method [7]. Yarns with higherfrictional properties gave fabrics whose frictionalproperties are proportionally higher [8].Robust Design method, also called the Taguchimethod, pioneered by Dr. Genichi Taguchi, focus onthe effective application of engineering strategies,facilitates flexible designs and concurrent engineer-ing [9].Taguchi is a 4-phase process: Planning, Conducting,Analysis and Validation. Major tools used in Taguchianalysis are main effects plot for means, S/N ratioplots and results prediction for validation [10].
DESIGN OF EXPERIMENT
Rotor spun yarns are not waxed and compared toring spun at single twist level that’s why Taguchi isused twice, separate for ring and rotor spun yarns.Taguchi process is followed as:Planning Phase – The problem is high COF causingtroubles in sub-sequent knitting process and spinningcomplaints. The identified variables are; cotton type,yarn quality, yarn finish, linear density of yarn, twist
211industria textila 2019, vol. 70, nr. 3˘
Investigation of various factors affecting the coefficient of friction of yarnby using Taguchi method
DOI: 10.35530/IT.070.03.1555
MOHSIN MUHAMMAD AUNJAM SOHAIL MUHAMMADNAI-WEN LI MAJEED KASHIF MUHAMMAD
REZUMAT – ABSTRACT
Investigarea diferiților factori care influențează coeficientul de frecare al firelor folosind metoda Taguchi
Acest studiu are ca obiectiv analiza influenței tipului de bumbac, calității, tehnicii de filare, torsiunii, densității liniare șifinisării firelor asupra coeficientului de frecare al firelor, utilizând metoda Taguchi. Pentru evaluarea nivelurilor și factorilorde răspuns, au fost realizate 72 de experimente utilizând proiectarea ortogonală L36 de două ori pentru abordarea Taguchi.Rezultatele au arătat că firele formate din fibre fine, pieptănate, tratate cu parafină, filate cu rotor, cu torsiune optimă șidensitate liniară scăzută au cel mai mic coeficient de frecare al firelor, îmbunătățind în cele din urmă procesele textileulterioare și calitățile produsului.
Cuvinte-cheie: coeficient de frecare, proiectare ortogonală L36, densitate liniară, abordare Taguchi, fir
Investigation of various factors affecting the coefficient of friction of yarn by using Taguchi method
This research aims to analyze certain effects of yarn characteristics such as: cotton type, yarn quality, yarn spinningtechnique, yarn twist and linear density and yarn finish on coefficient of friction of yarn by using Taguchi approach. Forevaluation of levels and response factors, 72 experiments are performed by using L36 orthogonal design twice for Taguchiapproach. The results show that yarns comprising of finer fibers, combed, waxed, Rotor spun, optimum twist and low lineardensity have lowest coefficient of friction of yarn, which ultimately improves subsequent textile processes and improveproduct qualities.
Keywords: Coefficient of friction, L36 orthogonal design, linear density, Taguchi approach, yarn
212industria textila 2019, vol. 70, nr. 3˘
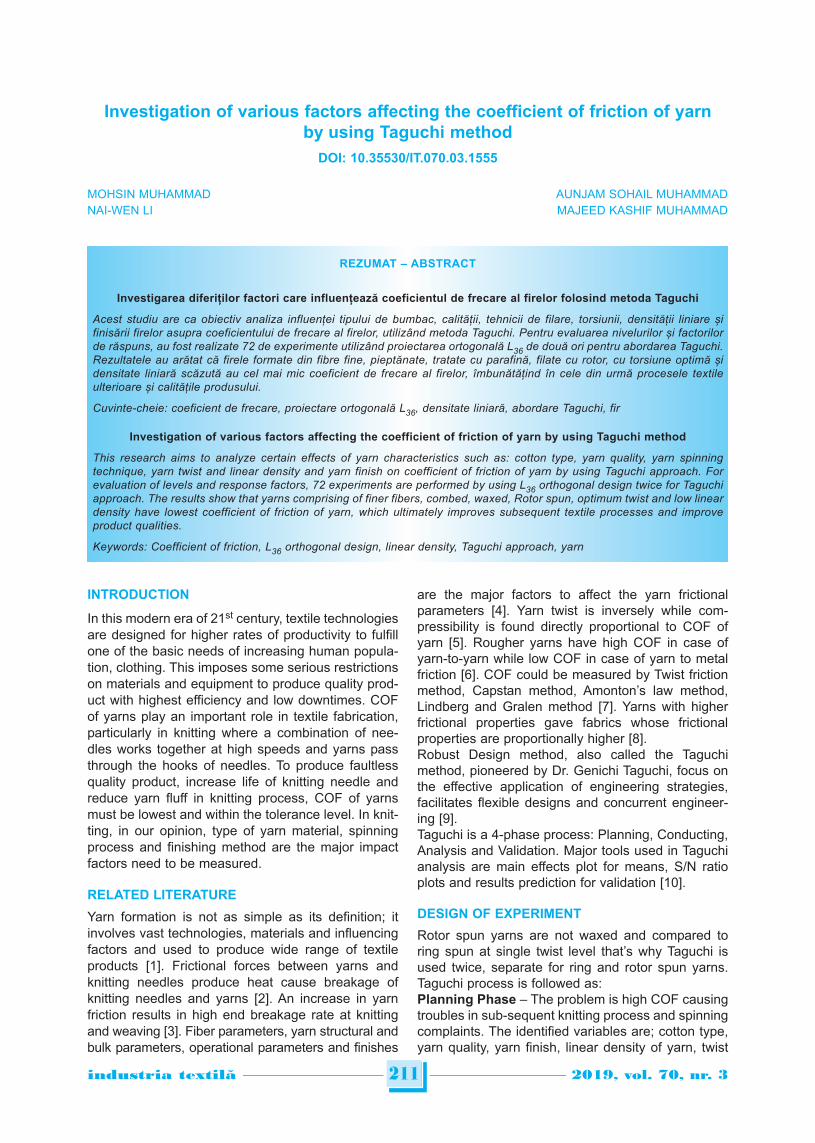
level and yarn spinning technique. Five factorsTaguchi is used for ring spun yarns while four factorsdesign is used to compare ring spun and rotor spunyarns. Effecting variables and response factor forboth designs is elaborated below.Taguchi design for Ring spun yarns involve:
Taguchi L36 orthogonal array DOE is selected forboth conditions.Conducting Phase – As per DOEs, 72 experimentsare performed to analyze their impact on COF of yarn.Experiments are performed under experimental labconditions and tested according to ASTM Standards.Analysis Phase – Testing results are inserted inresponse factor column of Taguchi DOE and Taguchiis analyzed for means and S/N ratios. Taguchi analy-sis shows effect of each variable on response factorand indicates optimum factors to achieve best results.Validation Phase – Results are validated by com-paring nine random predicted values with Taguchiformulas and to actual experimental results.
MATERIALS & METHODS
Raw cotton is tested for fiber parameters on USTERHVI 1000. 72 yarn samples are prepared accordingto Taguchi DOE. Samples development process flowis shown in figure 1.
Testing
Every sample is tested for Yarn Lea Strength,Tenacity on USTER Tensorapid, and COF on MESDANATTRIFIL-II, Uniformity and IPI on USTER UT-5 andyarn surface characteristics through SEM. Samplesare tested for COF of yarn under ASTM-D1308 stan-dard (table 3).
ANALYSIS & RESULTS
Testing results are analyzed by using TaguchiMethod in Minitab. COF of yarns is inserted inresponse column and analyzed against identifiedvariables. Analysis results are explained below.Graph 1 shows that yarns spun from PAK Cottonhave more friction than IND cotton. IND cotton hasMic. Value of 3.94 in contrast to 4.70 of PAK. High
Fig. 1. Yarn Spinning Methods
DOE FOR RING SPUN YARNS
Effectingfactors
LevelsResponse
factor
Cotton Type Pakistani Indian
COF of Yarns
Yarn Quality Carded Combed
Yarn Finish Wax Un-Wax
T.M Level 3.7 3.9 4.1
Count 16s 20s 24s
Table 1
DOE FOR RING VS ROTOR SPUN YARN
Effectingfactors
LevelsResponse
factor
Cotton Type Pakistani Indian
COF of YarnsYarn Quality Carded Combed
SpinningTechnique
Ring Rotor
Count 16s 20s 24s
Table 2
Rotor spun vs Ring spun yarns design involve:
COF Testing Parameter Value
Number of tests each bobbin 1
Sample length 50 m
Deviation among Tests 10 m
Input Tension 20.0 cN
Sliding Speed 150 m/min
Table 3
213industria textila 2019, vol. 70, nr. 3˘
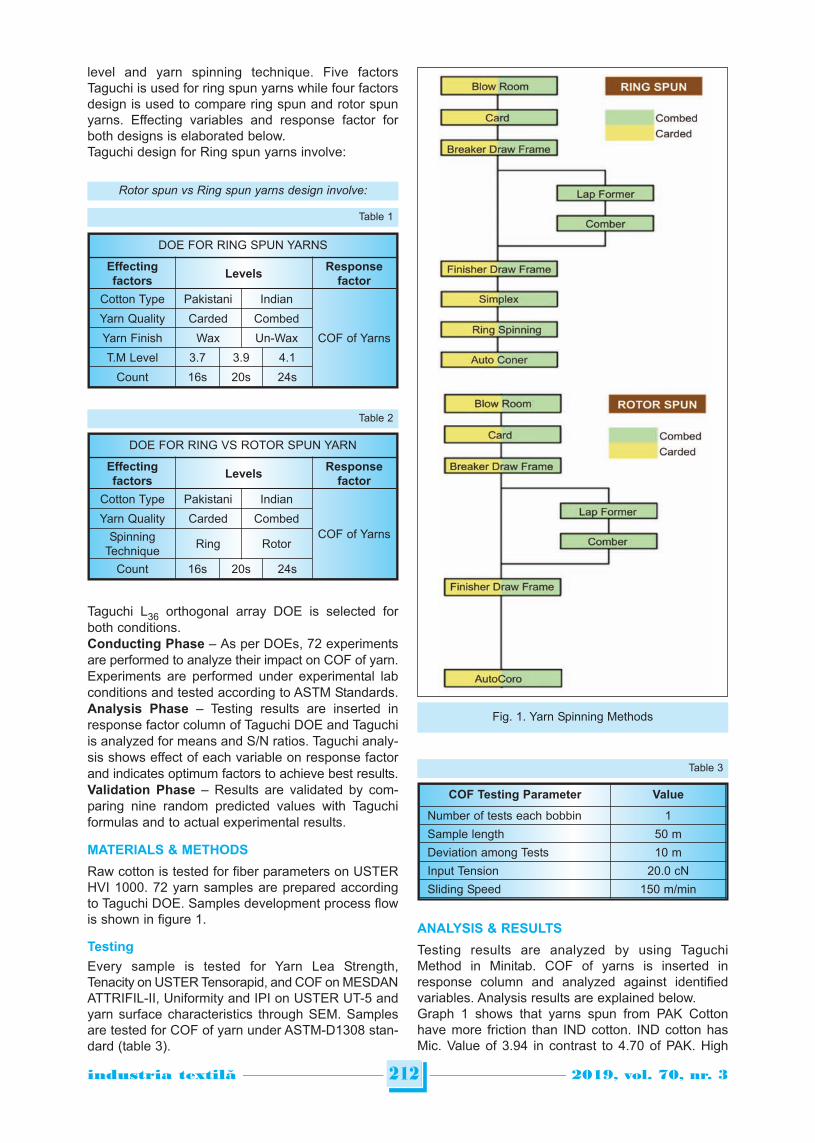
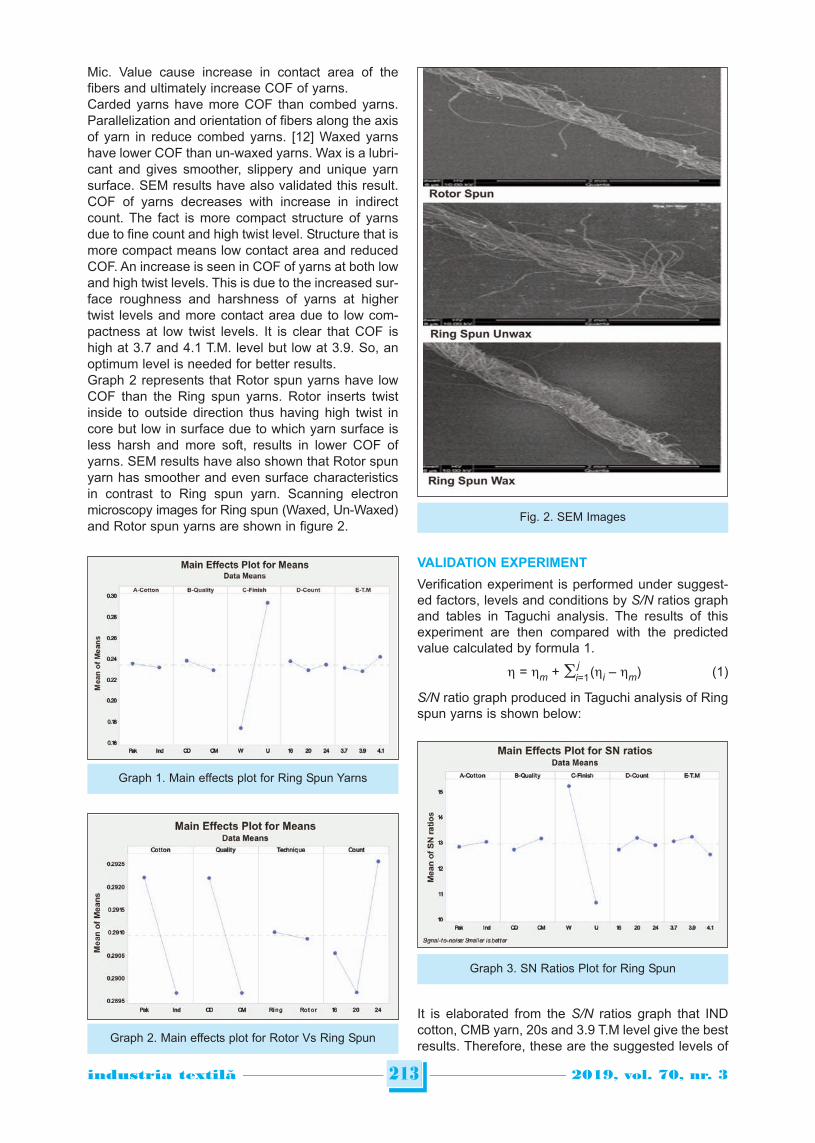
Mic. Value cause increase in contact area of thefibers and ultimately increase COF of yarns. Carded yarns have more COF than combed yarns.Parallelization and orientation of fibers along the axisof yarn in reduce combed yarns. [12] Waxed yarnshave lower COF than un-waxed yarns. Wax is a lubri-cant and gives smoother, slippery and unique yarnsurface. SEM results have also validated this result.COF of yarns decreases with increase in indirectcount. The fact is more compact structure of yarnsdue to fine count and high twist level. Structure that ismore compact means low contact area and reducedCOF. An increase is seen in COF of yarns at both lowand high twist levels. This is due to the increased sur-face roughness and harshness of yarns at highertwist levels and more contact area due to low com-pactness at low twist levels. It is clear that COF ishigh at 3.7 and 4.1 T.M. level but low at 3.9. So, anoptimum level is needed for better results.Graph 2 represents that Rotor spun yarns have lowCOF than the Ring spun yarns. Rotor inserts twistinside to outside direction thus having high twist incore but low in surface due to which yarn surface isless harsh and more soft, results in lower COF ofyarns. SEM results have also shown that Rotor spunyarn has smoother and even surface characteristicsin contrast to Ring spun yarn. Scanning electronmicroscopy images for Ring spun (Waxed, Un-Waxed)and Rotor spun yarns are shown in figure 2.
VALIDATION EXPERIMENT
Verification experiment is performed under suggest-ed factors, levels and conditions by S/N ratios graphand tables in Taguchi analysis. The results of thisexperiment are then compared with the predictedvalue calculated by formula 1.
jh = hm + (hi – hm) (1)i=1
S/N ratio graph produced in Taguchi analysis of Ringspun yarns is shown below:
It is elaborated from the S/N ratios graph that INDcotton, CMB yarn, 20s and 3.9 T.M level give the bestresults. Therefore, these are the suggested levels of
Graph 1. Main effects plot for Ring Spun Yarns
Graph 3. SN Ratios Plot for Ring Spun
Fig. 2. SEM Images
Graph 2. Main effects plot for Rotor Vs Ring Spun
impact factors. The mean value hm of multiple S/Nratios in all experiments is 13.015 in graph.Response table for suggested S/N ratios generatedby Minitab in Taguchi analysis is:
It is clear from the table that finish is ranked 1st as aneffecting factor for COF while cotton is ranked last.So, the best optimum parameters combination isA2:B2: C1:D2: E2 which means IND: CMB: Wax:20s:3.9. Now the predicted value is calculated by theformula as:
ho = 13.015 + (13.04 – 13.015)+ (13.15 – 13.015) + (15.23 – 13.015)+ (13.18 – 13.015)+ (13.22 – 13.015)= 15.76
Now the S/N value is known and predicted value forCOF of yarn at this S/N ratio is calculated by follow-ing formula 2:
1 n 2S/N = – 10 log ( yi ) (2)n i=1
The predicted value is:
1 n215.76 = – 10 log ( yi ) yi = 0.1632
36 i=1
Now experimental value of COF of sample (IND:CMB: Wax: 20s:3.9) is measured and the COF valueof yarn is 0.1535 which is close and better to the pre-dicted value by Taguchi design (0.1632).S/N ratio graph produced in Taguchi analysis of RingVs Rotor spun yarns is shown bellow:
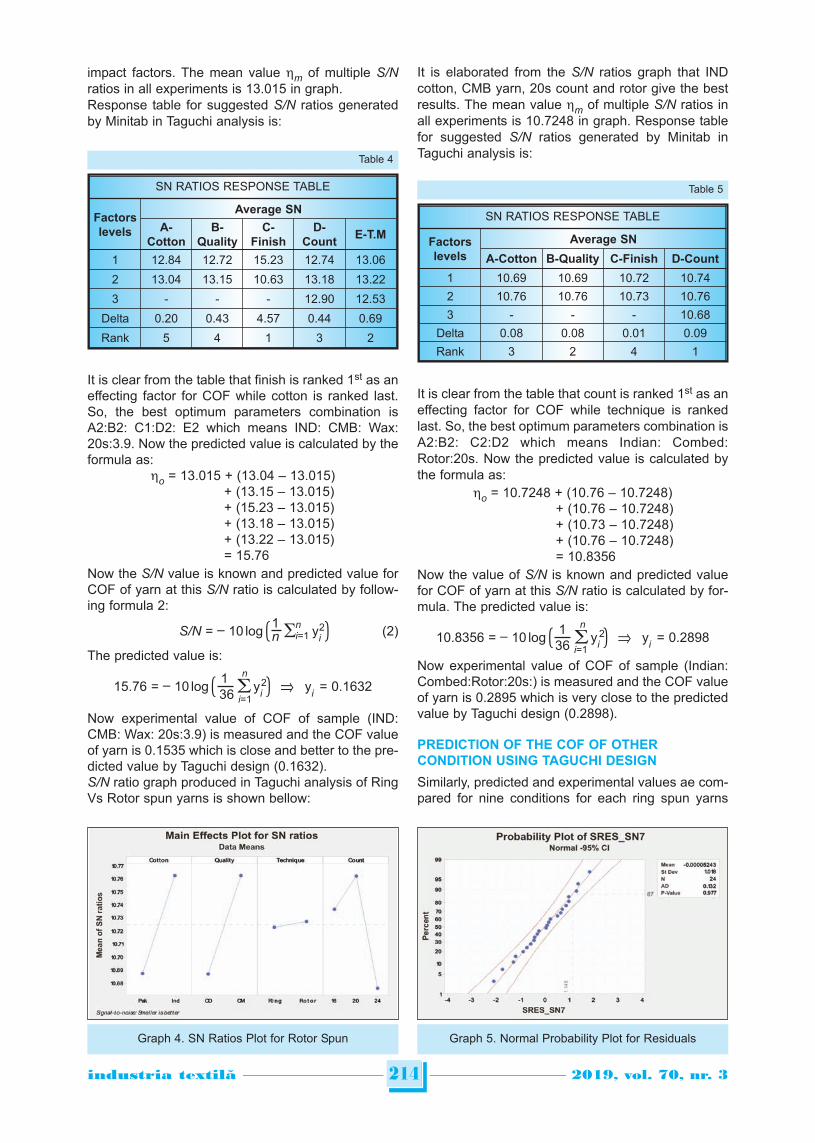
It is elaborated from the S/N ratios graph that INDcotton, CMB yarn, 20s count and rotor give the bestresults. The mean value hm of multiple S/N ratios inall experiments is 10.7248 in graph. Response tablefor suggested S/N ratios generated by Minitab inTaguchi analysis is:
It is clear from the table that count is ranked 1st as aneffecting factor for COF while technique is rankedlast. So, the best optimum parameters combination isA2:B2: C2:D2 which means Indian: Combed:Rotor:20s. Now the predicted value is calculated bythe formula as:
ho = 10.7248 + (10.76 – 10.7248)+ (10.76 – 10.7248) + (10.73 – 10.7248)+ (10.76 – 10.7248)= 10.8356
Now the value of S/N is known and predicted valuefor COF of yarn at this S/N ratio is calculated by for-mula. The predicted value is:
1 n210.8356 = – 10 log ( yi ) yi = 0.2898
36 i=1
Now experimental value of COF of sample (Indian:Combed:Rotor:20s:) is measured and the COF valueof yarn is 0.2895 which is very close to the predictedvalue by Taguchi design (0.2898).
PREDICTION OF THE COF OF OTHERCONDITION USING TAGUCHI DESIGN
Similarly, predicted and experimental values ae com-pared for nine conditions for each ring spun yarns
214industria textila 2019, vol. 70, nr. 3˘
SN RATIOS RESPONSE TABLE
Factorslevels
Average SN
A-Cotton
B-Quality
C-Finish
D-Count
E-T.M
1 12.84 12.72 15.23 12.74 13.06
2 13.04 13.15 10.63 13.18 13.22
3 - - - 12.90 12.53
Delta 0.20 0.43 4.57 0.44 0.69
Rank 5 4 1 3 2
Table 4
SN RATIOS RESPONSE TABLE
Factorslevels
Average SN
A-Cotton B-Quality C-Finish D-Count
1 10.69 10.69 10.72 10.74
2 10.76 10.76 10.73 10.76
3 - - - 10.68
Delta 0.08 0.08 0.01 0.09
Rank 3 2 4 1
Table 5
Graph 4. SN Ratios Plot for Rotor Spun Graph 5. Normal Probability Plot for Residuals
which shows 3.35% variation and ring vs rotor spunyarns which shows 0.37% variation.Normal probability plot has shown that residuals gen-erally fall in a straight line and errors are distributednormally inside the outer limits. So, relative percent-age errors are low and all experimental results arenormal.
CONCLUSIONS
It is concluded that: the fineness, parallelization andcompactness of fibers inside yarn structure aredirectly proportional to the COF of yarns, alsodemonstrated in a recent research [13]. Anotherresearch validates the yarn smoothness due to fine-ness and compactness [11]. SEM images and COF
results have elaborated that wax reduces COF ofyarns acting as an effective lubricant. Best COF val-ues of yarns achieved at optimum twist level not toolow or high depicts that COF of yarns increase atboth low and high twist levels. Yarn structure andtwisting technique show robust impact on COF ofyarns as rotor spun yarns were found superior thanthe ring spun yarns in case of COF. Experimental ver-ification and graphs have shown that there are verylittle errors between experimental and predicted val-ues. Moreover, Taguchi design is proved as a power-ful tool to analyze, predict, compare and find errors.At the end the normal probability plot for residualselaborate that all the results lie on the straight linewithin the normal limits. These results are also sup-ported by previous researches [4–6].
215industria textila 2019, vol. 70, nr. 3˘
BIBLIOGRAPHY
[1] Sheppard, Laurel M. How yarn is made – material, manufacture, making, history, used, processing, parts, industry,machine, History, 2008. [Online]. Available: http://www.madehow.com/Volume-3/Yarn.html. [Accessed: 13-Aug-2016].
[2] Tia Ghose, S. W. What is Friction? | Friction Definition, 2013. [Online]. Available: http://www.livescience.com/37161-what-is-friction.html. [Accessed: 12-Aug-2016].
[3] USTER, “Friction measurement,” March, 2010.[4] Yarn friction & its importance, theory, factors, measurement | Spinning & Weaving | Features | The ITJ. [Online].
Available: http://www.indiantextilejournal.com/articles/FAdetails.asp?id=4199. [Accessed: 31-Dec-2015].[5] Road, A. and Design, A. Studies on friction in cotton textiles : Part I – A study on the relationship between physical
properties and frictional characteristics of cotton fibres and yarns, In: Indian J. Fiber Text. Res., vol. 38, September,pp. 244–250, 2013.
[6] Ghosh, A., Patanaik, A., Anandjiwala, R. D. and Rengasamy, R. S. A study on dynamic friction of different spunyarns, In: Applied Polymer, vol. 108, pp. 3233–3238, 2008.
[7] Study of yarn coefficient of friciton to smoothness hand value, 2010.[8] Ajayi, R. and Studies, C. Comparative studies of yarn and fabric friction, In: Journal of Testing and Evaluation,
vol. 22, no. 5, pp. 465–469, 1994.[9] Phadke, Madhav S. Introduction to robust design (Taguchi Method), 2015. [Online]. Available:
https://www.isixsigma.com/methodology/robust-design-taguchi-method/introduction-robust-design-taguchi-method/.[Accessed: 12-Aug-2016].
[10] Mavruz, S. and Ogulata, R. T. Taguchi approach for the optimisation of the bursting strength of knitted fabrics, In:Fibres Text. East. Eur., vol. 79, no. 2, pp. 78–83, 2010.
[11] Unal, G. P., & Nilgun, O. Analysis of cotton ring spun yarn diameter using regression and artifical neural network,In: Industria Textila, 2015, Vol. 66, no. 6, pp. 317–721.
[12] Hosseinali, F. Variability of fiber friction among cotton varieties: Influence of salient fiber physical metrics, In:Tribology International, vol. 127, pp. 443–445, 2018.
[13] Azam Alirezazadeh, Mohammad Zarrebini, Mohammad Ghane & Parham Soltani, Fiber-on-fiber friction measurementusing hanging, In: The Journal of The Textile Institute, vol. 109, no. 5, pp. 636–646, 2017.
Authors:
MOHSIN MUHAMMAD1, NAI-WEN LI2, SOHAIL ANJUM MUHAMMAD3,
KASHIF MAJEED MUHAMMAD4
1PhD Scholar College of Business Administration Liaoning Technical University, Liaoning, 125105, China2College of Business Administration, Liaoning Technical University, Liaoning, 125105, China
3officer Knitting, Textile Engineer & Researcher at Interloop Ltd. Texlan Center Pvt. Ltd. Sir Lanka4PhD Scholar Liaoning Technical University, Liaoning, 125105, China
Corresponding author:
MOHSIN MUHAMMAD
e-mail: [email protected]
INTRODUCTION
Textile industry is one of the major sectors that scopeall over the world and consumption level of textileproducts have been rising year by year as a conse-quence of growth of the world population andimprovements of living standards [1]. Cotton keeps itsposition as a main raw material for textile industrydespite of recent improvements of synthetic andregenerated fibres [2]. The other point of view, pro-duction level of cotton has been fluctuated for recentyears, and because of strict relation with geographi-cal condition, it is hard to estimate production level ofcotton for upcoming years [3].
By the relation with cotton position in textile industry,efficient waste management plays major role for costof textile product. In order to reduce production costsand obtain sustainable and ecological productionprocesses as well as to prevent harmful effects ofcotton farming such as release of carbon dioxide,water and energy consumption, many multinationaltextile suppliers begin to use recycled or waste cotton[4–6]. With the rising concern of global warming andreduces of natural sources, some protocols i.e. Kyotoand Montreal are put into effect in order to protectenvironment and prevent release of greenhousegases. Moreover, international organisations such asGlobal Organic Textile Standard (GOTS), Better
Effects of waste cotton usage on properties of OE-rotor yarnsand knitted fabrics
DOI: 10.35530/IT.070.03.1560
MUSA KILIC H. KÜBRA KAYNAKGONCA BALCI KILIC MURAT DEMIREFLATUN TIRYAKI
REZUMAT – ABSTRACT
Efectele utilizării deșeurilor de bumbac asupra proprietăților firelor filate cu rotor OE și ale materialelor tricotate
Utilizarea materialelor reciclate a câștigat o importanță masivă atât în sectorul textil, precum și în alte sectoare, deoareceefectele reducerii surselor naturale sunt resimțite peste tot în lume. În acest studiu, s-a urmărit analizarea efectelor utilizăriibumbacului reciclat asupra proprietăților firelor filate cu rotor OE și a tricoturilor realizate din aceste fire. În acest scop,firele filate cu rotor OE au fost produse în diferite amestecuri de bumbac virgin și deșeuri de bumbac care provin din bataj,în proporție de 25%, 50%, 75%, și respectiv 100%. Pentru o evaluare mai bună, proprietățile firelor filate cu rotor OE careconțin deșeuri de bumbac au fost comparate cu firele filate cu rotor OE din bumbac virgin. Proprietățile fizice, structuraleși mecanice, cum ar fi neuniformitatea, imperfecțiunile, pilozitatea, forța de rupere, alungirea, frecarea fir-fir, frecareafir-metal și frecarea fir-ceramică, au fost măsurate cu Uster Tester 4 SX, Uster Zweigle Hairiness Tester 5, UsterTensorapid 3 și CTT Lawson Hemphill. În cea de-a doua parte a studiului, au fost realizate tricoturi glat din firele filate curotor OE. Au fost evaluate, de asemenea, efectele ponderii deșeurilor reciclate asupra proprietăților țesăturii tricotate, cumar fi pilingul, rezistența la abraziune, rezistența la plesnire și permeabilitatea la aer. Rezultatele au arătat că utilizarea apână la 75% în amestec a bumbacului reciclat nu prezintă diferențe semnificative din punct de vedere statistic în ceea ceprivește proprietățile firelor și țesăturilor.
Cuvinte-cheie: bumbac reciclat, deșeuri de bumbac, filare cu rotor OE, fire în amestec, proces sustenabil de producție
Effects of waste cotton usage on properties of OE-rotor yarns and knitted fabric
The use of recycled materials has gained massive importance in textile sector as well as in other sectors as the effects ofreduction of natural sources are felt all over the world. In this study, it was aimed to analyse the effects of recycled cottonusage on properties of OE-rotor spun yarns and knitted fabrics produced from these yarns. For this purpose, OE-rotoryarns were produced at different proportion levels of virgin cotton and waste cotton that derived from blowroom 25%, 50%,75%, 100%, respectively. For better assessment, properties of OE-rotor yarns that contain waste cotton were comparedwith 100% virgin cotton OE rotor yarn. Physical, structural and mechanical properties such as unevenness, imperfections,hairiness, breaking force, elongation, yarn-to-yarn friction, yarn-to-metal friction and yarn-to-ceramic friction weremeasured by Uster Tester 4 SX, Uster Zweigle Hairiness Tester 5, Uster Tensorapid 3 and CTT by Lawson Hemphill. Atthe second part of the study, single-jersey knitted fabrics were produced from OE-rotor spun yarns. Effects of waste cottonproportion on knitted fabric properties such as pilling, abrasion resistance, bursting strength and air permeability were alsoevaluated. Results showed that, the use of up to 75% per cent of waste cotton blended yarns show no statisticallysignificant differences on yarn and fabric properties.
Keywords: recycled cotton, waste cotton, OE-rotor spinning, blended yarns, sustainable production process
216industria textila 2019, vol. 70, nr. 3˘
Cotton Iniative (BCI), e3 Sustainably Grown Cotton,Cotton Leads focus on sustainable production pro-cess of textile products as well as provide cottonfarming in better ecologic environment. On the otherhand, products that produced from recycled materialsfind position between many consumers’ first con-sumption choices and create their own market shareknown as “green market” or “environmental market-ing” [7].In the literature, it is seen that many researchers pro-duced open-end rotor spun yarns by using recycledcotton. It can be related with the reason of capabilityof rotor spun technology to produce yarn from cottonwaste at high twist level unlike other spinning tech-nologies. Hassani et al. investigated the optimumspinning conditions for rotor spun yarns that differentproportional cotton wastes derived from ginningmachines blended with secondary raw material [8].Khan et al. studied on the prediction of the propertiesof cotton/waste blended OE rotor spun yarns usingTaguchi OA design [9]. They concluded that the pro-portion amount of waste cotton is the most influentialparameter on the properties of cotton/waste blendedyarns. Taher et al. analysed the influence of spinningparameters and recover fibres from cotton waste onthe uniformity and hairiness of rotor spun yarns [10].They indicated that yarn count, rotor parameterssuch as diameter, form and rotor speed have con-siderable effects as much as waste proportion.Furthermore, they also denoted that using 25% ofrecycle fibre does not change the uniformity andappearance of rotor spun yarn in their study. Halimiet al. also examined the effect of cotton waste andspinning parameters on the rotor yarn quality [11].Results of their study also verified that up to between15% and 25% cotton waste ratio does not cause anychange on rotor yarn quality with the optimum spin-ning parameters. Hassani and Tabatabei focused onoptimising of spinning variables in order to reducehairiness of rotor yarn produced from waste fibresthat collected from ginning process [12]. According toconclusions of study, rotor diameter and navel typehave significantly higher effect than other productionparameters on the hairiness of rotor spun yarn withall proportion levels (65%, 50%, 35%) of waste cot-ton. Halimi et al. investigated proportion of goodfibres inside cotton wastes that derived from blowroom and card machines using both of the qualitativeand quantitative methods [13]. In order to determinecotton wastes as a good fibre, OE rotor yarns pro-duced and analysed. Results showed that between15% and 25% cotton wastes can be blended with vir-gin cottons without noticeable drawbacks on rotoryarn quality. Celep et al. presented an experimentalstudy on the thermal comfort properties of single jer-sey knitted fabrics that produced from 100% virgincotton, %100 recycled cotton, 50%-50% recycled-vir-gin cotton OE yarns [14]. Regarding the comparativeanalysis between samples, it is seen that thermalconductivity, thermal absorptivity, air permeabilitydecreased and thermal resistance increased with the
increased proportion of recycled cotton fibres.Vadicherla and Saravanan were also studied thermalcomfort properties of single jersey knitted fabrics thatcontain different ratios of recycled polyester and cot-ton blended yarns [15]. It was seen from their studythat fabrics become thinner, lighter, more porous withhigher thermal conductivity, air permeability and lessthermal resistance with increasing ratio of recycledpolyester.Aim of this study is to investigate how cotton wasteproportion effects yarn and fabric quality and proposean optimum blend ratio for effective waste manage-ment. For this purpose, OE-rotor spun yarns wereproduced at different proportions of virgin and wastecotton that was obtained from blow-room and singlejersey knitted fabrics were also produced from allyarn types.
EXPERIMENTAL
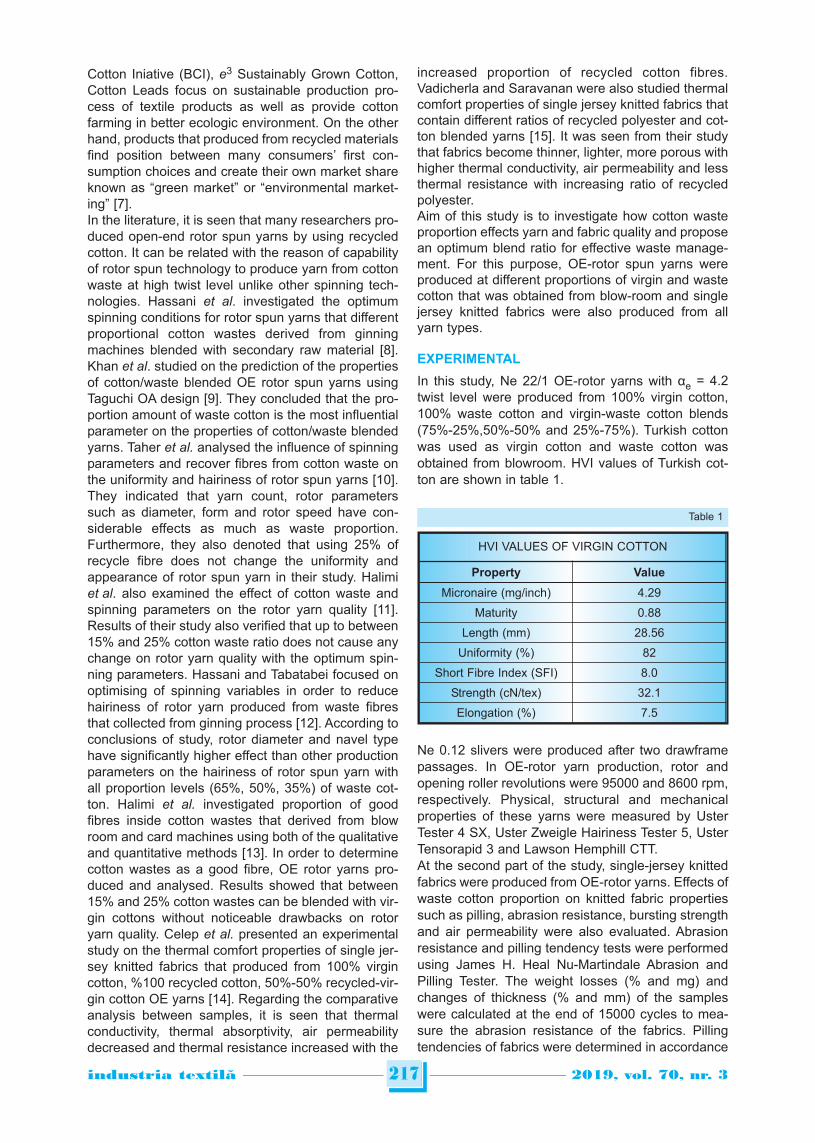
In this study, Ne 22/1 OE-rotor yarns with αe = 4.2twist level were produced from 100% virgin cotton,100% waste cotton and virgin-waste cotton blends(75%-25%,50%-50% and 25%-75%). Turkish cottonwas used as virgin cotton and waste cotton wasobtained from blowroom. HVI values of Turkish cot-ton are shown in table 1.
Ne 0.12 slivers were produced after two drawframepassages. In OE-rotor yarn production, rotor andopening roller revolutions were 95000 and 8600 rpm,respectively. Physical, structural and mechanicalproperties of these yarns were measured by UsterTester 4 SX, Uster Zweigle Hairiness Tester 5, UsterTensorapid 3 and Lawson Hemphill CTT.At the second part of the study, single-jersey knittedfabrics were produced from OE-rotor yarns. Effects ofwaste cotton proportion on knitted fabric propertiessuch as pilling, abrasion resistance, bursting strengthand air permeability were also evaluated. Abrasionresistance and pilling tendency tests were performedusing James H. Heal Nu-Martindale Abrasion andPilling Tester. The weight losses (% and mg) andchanges of thickness (% and mm) of the sampleswere calculated at the end of 15000 cycles to mea-sure the abrasion resistance of the fabrics. Pillingtendencies of fabrics were determined in accordance
217industria textila 2019, vol. 70, nr. 3˘
HVI VALUES OF VIRGIN COTTON
Property Value
Micronaire (mg/inch) 4.29
Maturity 0.88
Length (mm) 28.56
Uniformity (%) 82
Short Fibre Index (SFI) 8.0
Strength (cN/tex) 32.1
Elongation (%) 7.5
Table 1
with ISO 12945:2. In this method, ratings for testedsamples were determined by comparing with stan-dard photographs. “5” rating shows that there is novisible change on the surface of the fabric. Burstingstrength tests were performed by James H. HealTruBurst Bursting Strength Tester by using 7.3 cm2
test area according to ASTM D3786/D3786M-13. Airpermeability values of fabrics were measured inaccordance with ISO 9237 using 20 cm2 test areaand 100 Pa test pressure.
RESULTS AND DISCUSSION
Evaluation of yarn properties
For a better understanding of how usage of wastecotton affects quality of OE-rotor spun yarns, proper-ties such as unevenness, imperfections, hairiness,breaking force, breaking elongation and friction(yarn-to-yarn, yarn-to-metal and yarn-to-ceramic)were analysed statistically using ANOVA and confi-dence interval graphs at 95% confidence level.
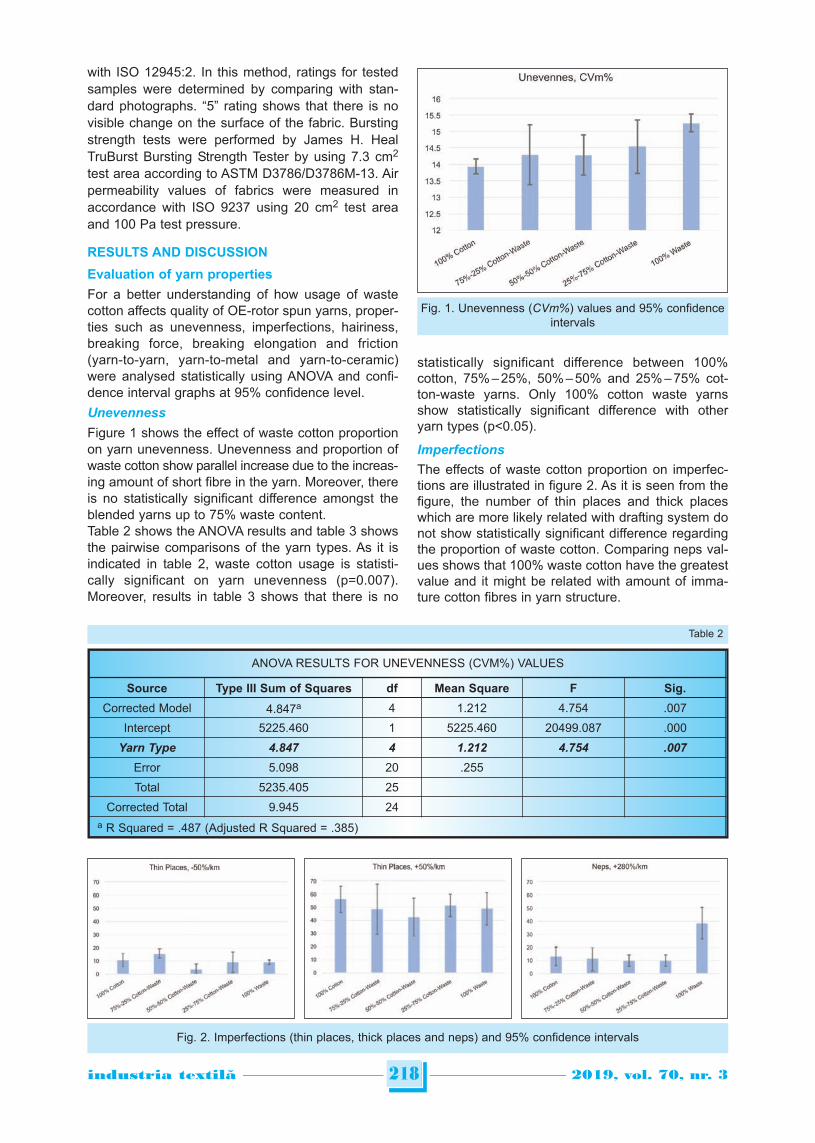
Unevenness
Figure 1 shows the effect of waste cotton proportionon yarn unevenness. Unevenness and proportion ofwaste cotton show parallel increase due to the increas-ing amount of short fibre in the yarn. Moreover, thereis no statistically significant difference amongst theblended yarns up to 75% waste content.Table 2 shows the ANOVA results and table 3 showsthe pairwise comparisons of the yarn types. As it isindicated in table 2, waste cotton usage is statisti-cally significant on yarn unevenness (p=0.007).Moreover, results in table 3 shows that there is no
statistically significant difference between 100%cotton, 75% – 25%, 50% – 50% and 25% – 75% cot-ton-waste yarns. Only 100% cotton waste yarnsshow statistically significant difference with otheryarn types (p<0.05).
Imperfections
The effects of waste cotton proportion on imperfec-tions are illustrated in figure 2. As it is seen from thefigure, the number of thin places and thick placeswhich are more likely related with drafting system donot show statistically significant difference regardingthe proportion of waste cotton. Comparing neps val-ues shows that 100% waste cotton have the greatestvalue and it might be related with amount of imma-ture cotton fibres in yarn structure.
218industria textila 2019, vol. 70, nr. 3˘
ANOVA RESULTS FOR UNEVENNESS (CVM%) VALUES
Source Type III Sum of Squares df Mean Square F Sig.
Corrected Model 4.847a 4 1.212 4.754 .007
Intercept 5225.460 1 5225.460 20499.087 .000
Yarn Type 4.847 4 1.212 4.754 .007
Error 5.098 20 .255
Total 5235.405 25
Corrected Total 9.945 24a R Squared = .487 (Adjusted R Squared = .385)
Table 2
Fig. 1. Unevenness (CVm%) values and 95% confidenceintervals
Fig. 2. Imperfections (thin places, thick places and neps) and 95% confidence intervals
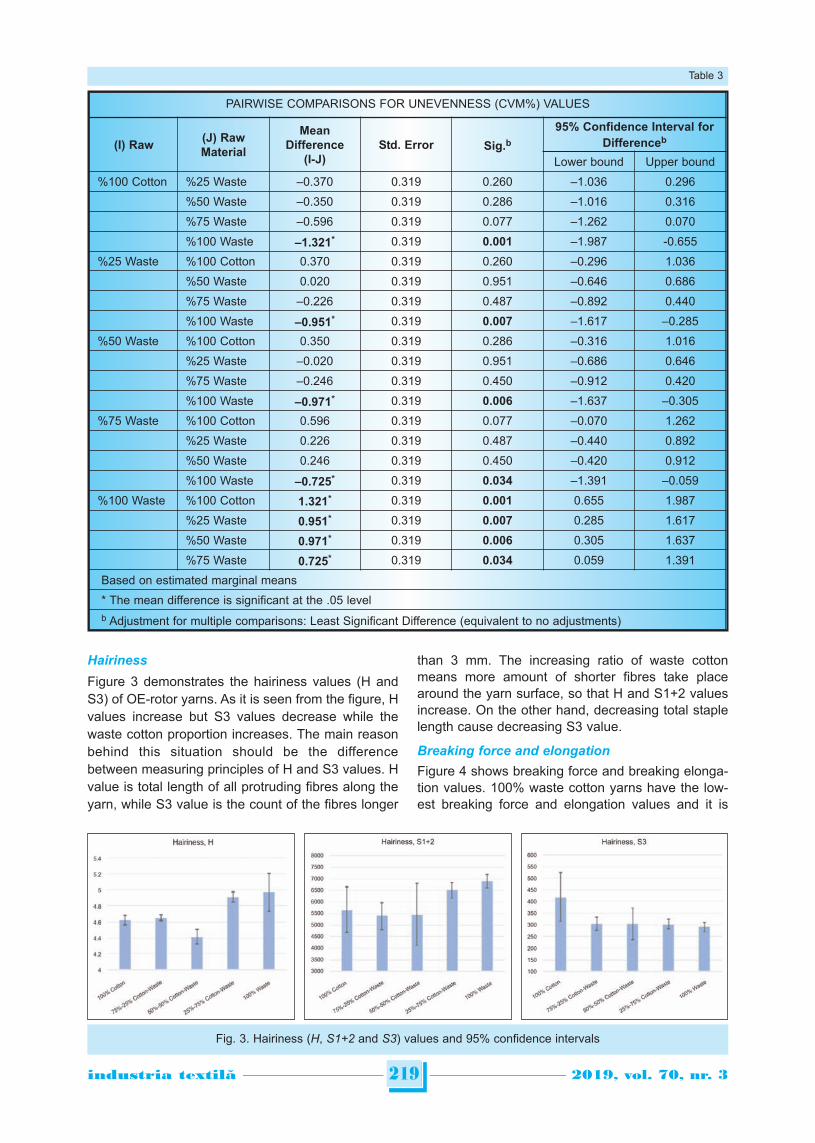
Hairiness
Figure 3 demonstrates the hairiness values (H andS3) of OE-rotor yarns. As it is seen from the figure, Hvalues increase but S3 values decrease while thewaste cotton proportion increases. The main reasonbehind this situation should be the differencebetween measuring principles of H and S3 values. Hvalue is total length of all protruding fibres along theyarn, while S3 value is the count of the fibres longer
than 3 mm. The increasing ratio of waste cottonmeans more amount of shorter fibres take placearound the yarn surface, so that H and S1+2 valuesincrease. On the other hand, decreasing total staplelength cause decreasing S3 value.
Breaking force and elongation
Figure 4 shows breaking force and breaking elonga-tion values. 100% waste cotton yarns have the low-est breaking force and elongation values and it is
219industria textila 2019, vol. 70, nr. 3˘
Fig. 3. Hairiness (H, S1+2 and S3) values and 95% confidence intervals
PAIRWISE COMPARISONS FOR UNEVENNESS (CVM%) VALUES
(I) Raw(J) RawMaterial
MeanDifference
(I-J)Std. Error Sig.b
95% Confidence Interval for
Differenceb
Lower bound Upper bound
%100 Cotton %25 Waste –0.370 0.319 0.260 –1.036 0.296
%50 Waste –0.350 0.319 0.286 –1.016 0.316
%75 Waste –0.596 0.319 0.077 –1.262 0.070
%100 Waste –1.321* 0.319 0.001 –1.987 -0.655
%25 Waste %100 Cotton 0.370 0.319 0.260 –0.296 1.036
%50 Waste 0.020 0.319 0.951 –0.646 0.686
%75 Waste –0.226 0.319 0.487 –0.892 0.440
%100 Waste –0.951* 0.319 0.007 –1.617 –0.285
%50 Waste %100 Cotton 0.350 0.319 0.286 –0.316 1.016
%25 Waste –0.020 0.319 0.951 –0.686 0.646
%75 Waste –0.246 0.319 0.450 –0.912 0.420
%100 Waste –0.971* 0.319 0.006 –1.637 –0.305
%75 Waste %100 Cotton 0.596 0.319 0.077 –0.070 1.262
%25 Waste 0.226 0.319 0.487 –0.440 0.892
%50 Waste 0.246 0.319 0.450 –0.420 0.912
%100 Waste –0.725* 0.319 0.034 –1.391 –0.059
%100 Waste %100 Cotton 1.321* 0.319 0.001 0.655 1.987
%25 Waste 0.951* 0.319 0.007 0.285 1.617
%50 Waste 0.971* 0.319 0.006 0.305 1.637
%75 Waste 0.725* 0.319 0.034 0.059 1.391
Based on estimated marginal means
* The mean difference is significant at the .05 levelb Adjustment for multiple comparisons: Least Significant Difference (equivalent to no adjustments)
Table 3
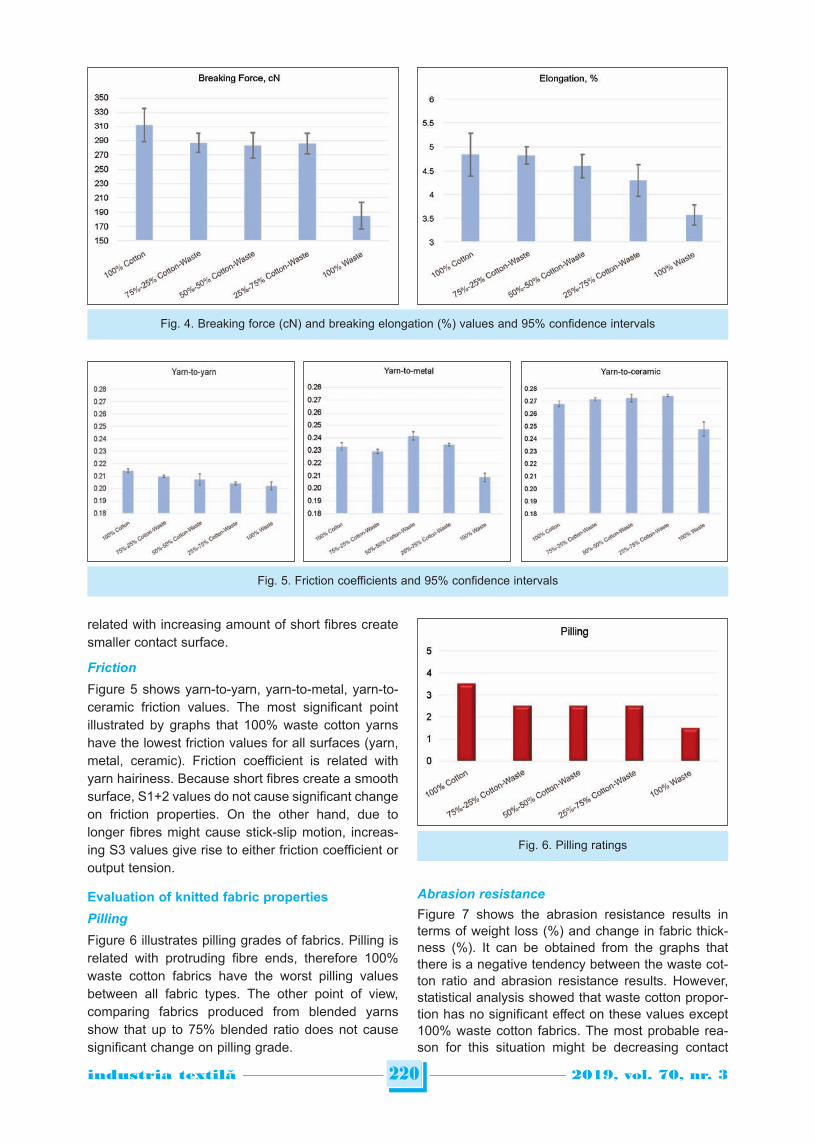
related with increasing amount of short fibres createsmaller contact surface.
Friction
Figure 5 shows yarn-to-yarn, yarn-to-metal, yarn-to-ceramic friction values. The most significant pointillustrated by graphs that 100% waste cotton yarnshave the lowest friction values for all surfaces (yarn,metal, ceramic). Friction coefficient is related withyarn hairiness. Because short fibres create a smoothsurface, S1+2 values do not cause significant changeon friction properties. On the other hand, due tolonger fibres might cause stick-slip motion, increas-ing S3 values give rise to either friction coefficient oroutput tension.
Evaluation of knitted fabric properties
Pilling
Figure 6 illustrates pilling grades of fabrics. Pilling isrelated with protruding fibre ends, therefore 100%waste cotton fabrics have the worst pilling valuesbetween all fabric types. The other point of view,comparing fabrics produced from blended yarnsshow that up to 75% blended ratio does not causesignificant change on pilling grade.
Abrasion resistance
Figure 7 shows the abrasion resistance results interms of weight loss (%) and change in fabric thick-ness (%). It can be obtained from the graphs thatthere is a negative tendency between the waste cot-ton ratio and abrasion resistance results. However,statistical analysis showed that waste cotton propor-tion has no significant effect on these values except100% waste cotton fabrics. The most probable rea-son for this situation might be decreasing contact
220industria textila 2019, vol. 70, nr. 3˘
Fig. 6. Pilling ratings
Fig. 5. Friction coefficients and 95% confidence intervals
Fig. 4. Breaking force (cN) and breaking elongation (%) values and 95% confidence intervals
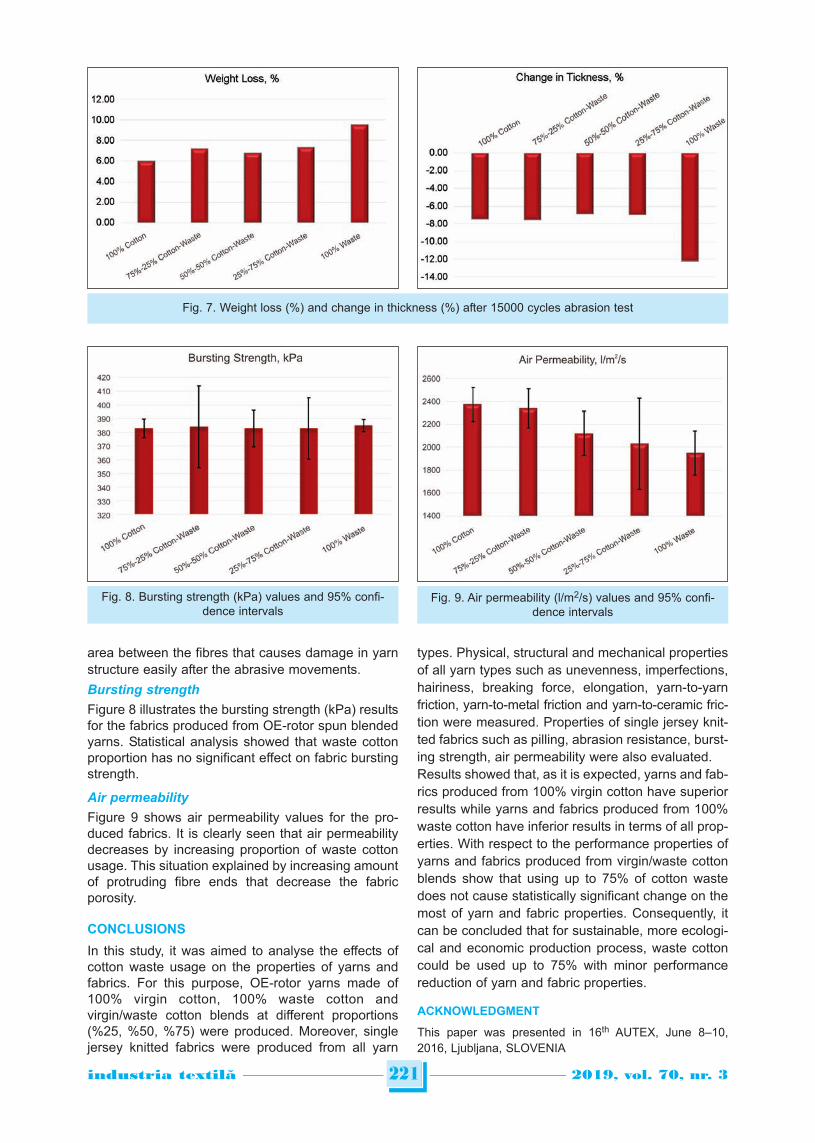
area between the fibres that causes damage in yarnstructure easily after the abrasive movements.
Bursting strength
Figure 8 illustrates the bursting strength (kPa) resultsfor the fabrics produced from OE-rotor spun blendedyarns. Statistical analysis showed that waste cottonproportion has no significant effect on fabric burstingstrength.
Air permeability
Figure 9 shows air permeability values for the pro-duced fabrics. It is clearly seen that air permeabilitydecreases by increasing proportion of waste cottonusage. This situation explained by increasing amountof protruding fibre ends that decrease the fabricporosity.
CONCLUSIONS
In this study, it was aimed to analyse the effects ofcotton waste usage on the properties of yarns andfabrics. For this purpose, OE-rotor yarns made of100% virgin cotton, 100% waste cotton andvirgin/waste cotton blends at different proportions(%25, %50, %75) were produced. Moreover, singlejersey knitted fabrics were produced from all yarn
types. Physical, structural and mechanical propertiesof all yarn types such as unevenness, imperfections,hairiness, breaking force, elongation, yarn-to-yarnfriction, yarn-to-metal friction and yarn-to-ceramic fric-tion were measured. Properties of single jersey knit-ted fabrics such as pilling, abrasion resistance, burst-ing strength, air permeability were also evaluated.Results showed that, as it is expected, yarns and fab-rics produced from 100% virgin cotton have superiorresults while yarns and fabrics produced from 100%waste cotton have inferior results in terms of all prop-erties. With respect to the performance properties ofyarns and fabrics produced from virgin/waste cottonblends show that using up to 75% of cotton wastedoes not cause statistically significant change on themost of yarn and fabric properties. Consequently, itcan be concluded that for sustainable, more ecologi-cal and economic production process, waste cottoncould be used up to 75% with minor performancereduction of yarn and fabric properties.
ACKNOWLEDGMENT
This paper was presented in 16th AUTEX, June 8–10,2016, Ljubljana, SLOVENIA
221industria textila 2019, vol. 70, nr. 3˘
Fig. 8. Bursting strength (kPa) values and 95% confi-dence intervals
Fig. 9. Air permeability (l/m2/s) values and 95% confi-dence intervals
Fig. 7. Weight loss (%) and change in thickness (%) after 15000 cycles abrasion test
222industria textila 2019, vol. 70, nr. 3˘
BIBLIOGRAPHY
[1] Wang Y. Recycling in textiles, Woodhead Publishing Limited, Washington, 2006, pp. 1–3.
[2] Shui S., Plastina A. World apparel fiber consumption survey, In: Food and Agriculture Organization of the UnitedNations and International Cotton Advisory Committee, Washington, 2013, pp. 3–4.
[3] Cotton Incorparated, Cotton Market Fundamentals & Price Outlook, http://www.cottoninc.com/corporate/Market-Data/MonthlyEconomicLetter/, 28.11.2016.
[4] Sule A.D., Bardhan M.K. Recycling of textile waste for environment protection – An overview of some practicalcases in the textile industry, In: Indian Journal of Fibre & Textile Research, 2001, vol. 26, pp. 223–232.
[5] Puma, Puma Recycled Cotton, http://about.puma.com/en/sustainability/products/recycled-cotton, 15.12.2016.
[6] Inditex, Raw Materials, https://www.inditex.com/sustainability/product/raw_material, 02.01.2016.
[7] TNS Political & Social, Attitudes of Europeans Towards Building the Single Market for Green Products,http://ec.europa.eu/public_opinion/flash/fl_367_sum_en.pdf, 22.01.2013.
[8] Hassani, H., Tabatabaei, S.A., Semnani, D. Determining the optimum spinning conditions to produce the rotor yarnsfrom cotton wastes, In: Industria Textila, 2010, vol. 58, pp. 259–264.
[9] Khan, K.R., Hossain, M.M., Chandra, S.R. Statistical analyses and predicting the properties of cotton/waste blendedopen-end rotor yarn using Taguchi OA design. In: International Journal of Textile Science, 2015, 4(2), pp. 22–35.
[10] Taher, H.M., Bechir, A., Mohammed, B.H., Sakli, F. Influence of spinning parameters and recovered fibers fromcotton waste on the uniformity and hairiness of rotor spun yarn. In: Journal of Engineered Fibers and Fabrics, 2009,4(3), pp. 36–45.
[11] Halimi, M.T., Hassen, M.B., Sakli, F. Cotton waste recycling: quantitative and qualitative assessment. In: Resources,Conversation & Recycling, 2008, vol. 52, pp. 785–791.
[12] Hasssani, H., Tabatabaei, S.A. Optimizing spinning variables to reduce the hairiness of rotor yarns produced fromwaste fibres collected from the ginning process. In: Fibres & Textiles in Eastern Europe, 2011, vol. 19, no. 3(86),pp. 21–25.
[13] Halimi, M.T., Hassen, M.B., Azzouz, B., Sakli, F. Effect of cotton waste and spinning parameters on rotor yarnquality. In: The Journal of Textile Institute, 2007, vol. 98, no. 5, pp. 437–442.
[14] Celep, G., Doğan, G., Yüksekkaya, M.E., Tercan, M. An investigation of thermal comfort properties of single jerseyfabrics including recycled fibers. In: Düzce University Journal of Science & Technology, 2015, vol. 4, pp. 104–112.
[15] Vadicherla, T., Saravanan, D. Thermal comfort properties of single jersey fabrics made from recycled polyester andcotton blended yarns, In: Indian Journal of Fibre and Textile Research, 2017, vol. 42, pp. 318–324.
Authors:
MUSA KILIC1
H. KÜBRA KAYNAK2
GONCA BALCI KILIC1
MURAT DEMIR1
EFLATUN TIRYAKI2
1Dokuz Eylül University, Department of Textile Engineering, İzmir, Turkey
2Gaziantep University, Department of Textile Engineering, Gaziantep, Turkey
Corresponding author:
MUSA KILIC
e-mail: [email protected]
INTRODUCTION
The environmental impact categories identified (car-cinogenic, inorganic compounds upon the breath, cli-mate change, radiation, ozone layer, eco-toxicity,land use, minerals, and fossil fuels) have beenobtained by using the method ECO indicator 99. Inorder to obtain the life-cycle assessment (LCA) [1], itis necessary to analyze the life-cycle inventory (LCI)for hydrophobic textiles obtained by standard tech-nology (foulard method) and by advanced technology
(RF plasma [2, 3]). Moreover, it is necessary to col-lect inputs and outputs for the duration of the lifecycle of the (figure 1), for both treatments carried outusing fluorine compounds such as NUVA TTC, sulfurhexafluoride, and Teflon. The inputs and outputsrequested for ICV and LCA are:1. Inputs:
• Raw materials;• Energy used;• The water used;
Aspects of the hydrophobic effect sustainability obtained in plasmafor cotton fabrics
DOI: 10.35530/IT.070.03.1475
RALUCA MARIA AILENI SILVIA ALBICILAURA CHIRIAC ADRIANA SUBTIRICA
LAURENTIU CRISTIAN DINCA
REZUMAT – ABSTRACT
Aspecte ale sustenabilității efectului hidrofob obținut în plasmă pentru țesăturile din bumbac
Această lucrare prezintă mai multe aspecte privind evaluarea ciclului de viață (LCA) pentru țesăturile de bumbac 100%tratate cu diferite tipuri de compuși ai fluorului utilizând tehnologia cu plasmă RF și tehnologia de fulardare, pentru a obțineefectul hidrofob. Pentru a evidenția efectele obținute prin tehnologia cu plasmă RF (radiofrecvența) s-a efectuat în paralelun studiu privind efectul hidrofob obținut utilizând o dispersie de compuși de fluor (NUVA TTC) pe fulard. Concluziilestudiului au fost că, dacă se utilizează tratamentul cu plasmă pentru efectul hidrofob, atunci acest lucru ar influența negativmediul prin încălzirea generată de gaze și consumul de energie, atunci când se utilizează metoda de fulardare șisubstanțele chimice deja stabilite, impactul ar consta în creșterea consumului de combustibili fosili, substanțe anorganicerespiratorii și schimbări climatice. A fost analizat inventarul ciclului de viață (LCI) și evaluarea ciclului de viață (LCA)folosind software-ul SimaPro și Eco-indicator 99. Pentru obținerea LCI, au fost utilizate datele tehnice de intrare și ieșiredin procesul de plasmă/fulard și software-ul SimaPro pentru a genera LCA pe baza acestor date. Datele de intrare despremateria primă, energie, substanțele chimice au fost colectate prin măsurători directe pe echipamente, manuale de utilizareale dispozitivelor și specificații ale echipamentelor (cărți tehnice) și procese. Datele de ieșire (energia reziduală șisubstanțele chimice) au fost obținute utilizând statistici, baze de date de pe internet și software-ul SimaPro. Obiectivulinițiativei noastre științifice a fost studierea sustenabilității tehnologiei cu plasmă RF utilizate pentru hidrofobizare și s-adovedit că tehnologia cu plasmă utilizată pentru efectul hidrofob este mai puțin ecologică decât tehnologia de fulardarepentru o unitate funcțională de 1 kg de material tratat.
Cuvinte-cheie: textil, plasma RF, hidrofobizare, LCA, LCI, mediu
Aspects of the hydrophobic effect sustainability obtained in plasma for cotton fabrics
This paper presents several aspects concerning the life cycle assessment (LCA) for 100% cotton fabric treated withdifferent types of Fluor compounds using RF plasma technology and foulard technology, in order to obtain the hydrophobiceffect. To highlight the effects obtained by RF (radio frequency) plasma technology was conducted in parallel a study abouthydrophobic effect obtained using a dispersion of fluorine compound (NUVA TTC) on foulard. The conclusions of the studywere that if we use the plasma treatment for hydrophobic effect then this would influence the environment negatively bywarming generated by gases and power consumption, when using the foulard method and chemical substances alreadyestablished, the impact would consist of increasing the consumption of fossil flues, respiratory inorganics, and climatechange. We analyzed the life-cycle inventory (LCI) and life-cycle assessment (LCA) using SimaPro software andEco-indicator 99. For obtaining the LCI, we used to input and output technical data, from the plasma / foulard process, andthe SimaPro software for generating the LCA based on these data. The input data about raw material, energy, chemicalsubstances, have been collected by direct measurements on machinery, device logs and specifications of the equipment(technical books) and processes. The output data (waste energy and chemicals) were obtained using statistics, internetdatabases, and SimaPro software. The objective of our scientific initiative has been to study the sustainability of theRF plasma technology used for hydrophobization, and we obtained that plasma technology used for hydrophobic effect isless eco-friendly than foulard technology for a functional unit of 1 kg treated material.
Keywords: textile, RF plasma, hydrophobization, LCA, LCI, environment
223industria textila 2019, vol. 70, nr. 3˘
• The main ratio between the hydrophobic productand co-products;
• The rate of production.2. Outputs:
• The waste discharged into the ambient environ-ment.
For evaluating life-cycle as compared, within theframework of this phase, data were collected fromboth technological processes of RF plasma andfoulard method, directly, indirectly by sources avail-able on the internet (specific databases) and litera-ture on the subject [4–7].ECO-Indicator Method 99 provides quantification ofthe impact for environmental processes by categoriesof impact: carcinogenic substances results, harmfulorganic and inorganic substance through breathing,climatic changes caused by the substances with the
greenhouse effect, radiation, changes that take placeat the level of the ozone layer, ecotoxicity, acidifica-tion/Eutrophication, land use, minerals and consumefossil fuels for power generation.For the assessment of environmental impact, bySimaPro7, have been used methods of normaliza-tion, weighting, single score and “damage assess-ment” (assessment of the extent of damage) [8, 9].• The normalization method shows the extent to
which a category of impact has a significant influ-ence on the environment.
• The weighting method has as its objective report-ing to the category of impact on the relative impor-tance of it.
• The single score method involves the specificationof the multiplication of substances, which con-tribute to the impact, with a factor of specificationexpressing the relative contribution of the sub-stance.
• The method of assessing the degree of damage“damage assessment” aims the combination ofsome categories of impact in order to obtain a cat-egory of damage, also called the protection zone.
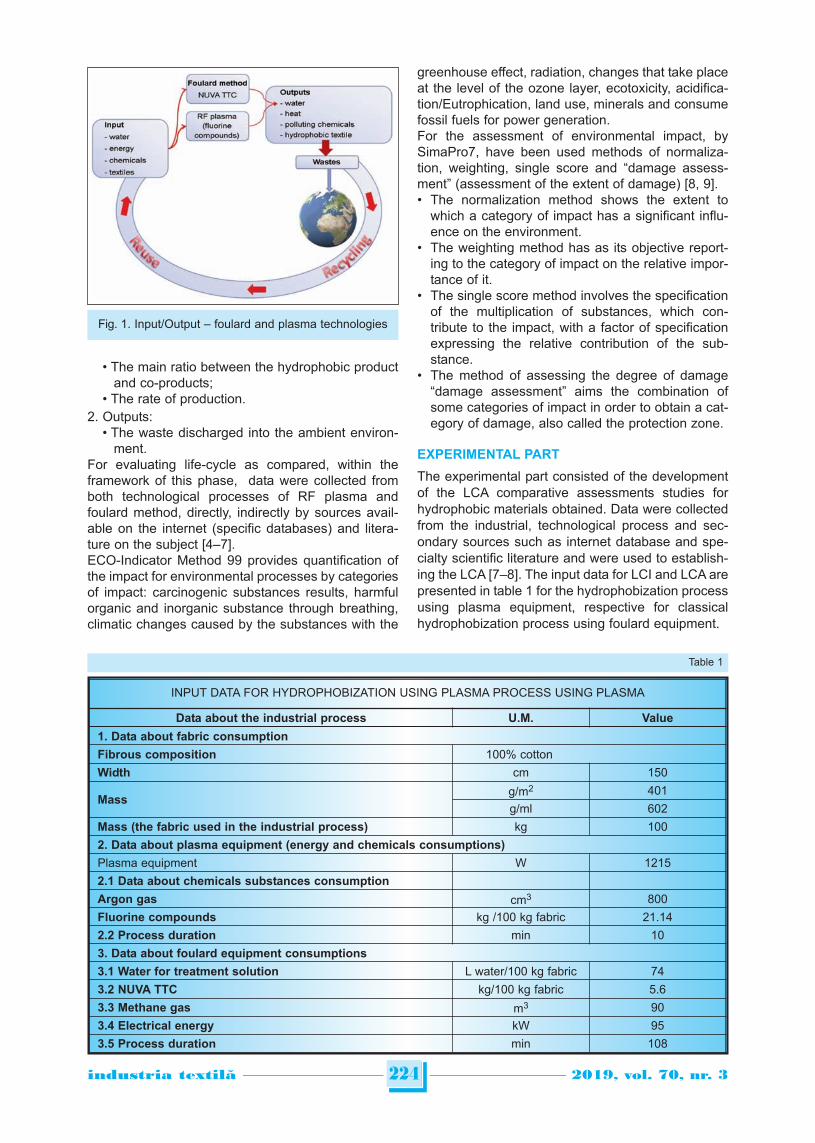
EXPERIMENTAL PART
The experimental part consisted of the developmentof the LCA comparative assessments studies forhydrophobic materials obtained. Data were collectedfrom the industrial, technological process and sec-ondary sources such as internet database and spe-cialty scientific literature and were used to establish-ing the LCA [7–8]. The input data for LCI and LCA arepresented in table 1 for the hydrophobization processusing plasma equipment, respective for classicalhydrophobization process using foulard equipment.
224industria textila 2019, vol. 70, nr. 3˘
Fig. 1. Input/Output – foulard and plasma technologies
INPUT DATA FOR HYDROPHOBIZATION USING PLASMA PROCESS USING PLASMA
Data about the industrial process U.M. Value
1. Data about fabric consumption
Fibrous composition 100% cotton
Width cm 150
Massg/m2 401
g/ml 602
Mass (the fabric used in the industrial process) kg 100
2. Data about plasma equipment (energy and chemicals consumptions)
Plasma equipment W 1215
2.1 Data about chemicals substances consumption
Argon gas cm3 800
Fluorine compounds kg /100 kg fabric 21.14
2.2 Process duration min 10
3. Data about foulard equipment consumptions
3.1 Water for treatment solution L water/100 kg fabric 74
3.2 NUVA TTC kg/100 kg fabric 5.6
3.3 Methane gas m3 90
3.4 Electrical energy kW 95
3.5 Process duration min 108
Table 1
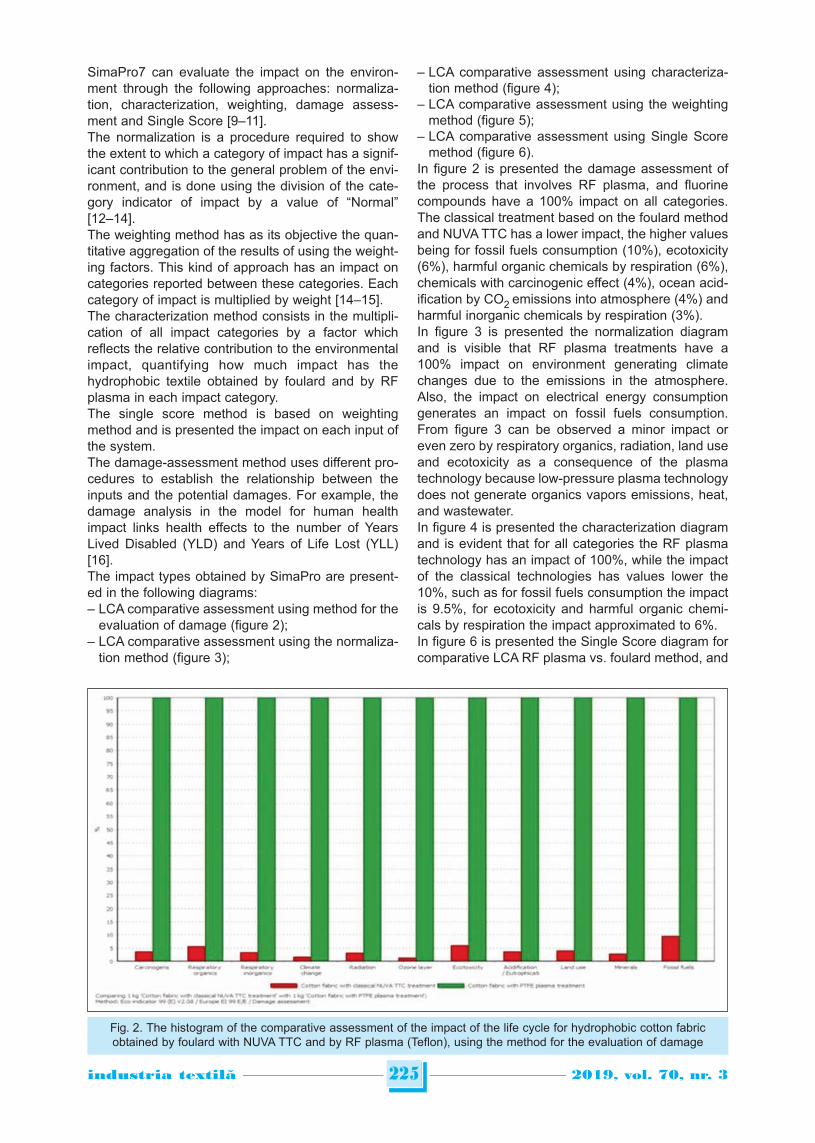
SimaPro7 can evaluate the impact on the environ-ment through the following approaches: normaliza-tion, characterization, weighting, damage assess-ment and Single Score [9–11].The normalization is a procedure required to showthe extent to which a category of impact has a signif-icant contribution to the general problem of the envi-ronment, and is done using the division of the cate-gory indicator of impact by a value of “Normal”[12–14].The weighting method has as its objective the quan-titative aggregation of the results of using the weight-ing factors. This kind of approach has an impact oncategories reported between these categories. Eachcategory of impact is multiplied by weight [14–15]. The characterization method consists in the multipli-cation of all impact categories by a factor whichreflects the relative contribution to the environmentalimpact, quantifying how much impact has thehydrophobic textile obtained by foulard and by RFplasma in each impact category.The single score method is based on weightingmethod and is presented the impact on each input ofthe system. The damage-assessment method uses different pro-cedures to establish the relationship between theinputs and the potential damages. For example, thedamage analysis in the model for human healthimpact links health effects to the number of YearsLived Disabled (YLD) and Years of Life Lost (YLL)[16].The impact types obtained by SimaPro are present-ed in the following diagrams:– LCA comparative assessment using method for the
evaluation of damage (figure 2);– LCA comparative assessment using the normaliza-
tion method (figure 3);
– LCA comparative assessment using characteriza-tion method (figure 4);
– LCA comparative assessment using the weightingmethod (figure 5);
– LCA comparative assessment using Single Scoremethod (figure 6).
In figure 2 is presented the damage assessment ofthe process that involves RF plasma, and fluorinecompounds have a 100% impact on all categories.The classical treatment based on the foulard methodand NUVA TTC has a lower impact, the higher valuesbeing for fossil fuels consumption (10%), ecotoxicity(6%), harmful organic chemicals by respiration (6%),chemicals with carcinogenic effect (4%), ocean acid-ification by CO2 emissions into atmosphere (4%) andharmful inorganic chemicals by respiration (3%).In figure 3 is presented the normalization diagramand is visible that RF plasma treatments have a100% impact on environment generating climatechanges due to the emissions in the atmosphere.Also, the impact on electrical energy consumptiongenerates an impact on fossil fuels consumption.From figure 3 can be observed a minor impact oreven zero by respiratory organics, radiation, land useand ecotoxicity as a consequence of the plasmatechnology because low-pressure plasma technologydoes not generate organics vapors emissions, heat,and wastewater.In figure 4 is presented the characterization diagramand is evident that for all categories the RF plasmatechnology has an impact of 100%, while the impactof the classical technologies has values lower the10%, such as for fossil fuels consumption the impactis 9.5%, for ecotoxicity and harmful organic chemi-cals by respiration the impact approximated to 6%.In figure 6 is presented the Single Score diagram forcomparative LCA RF plasma vs. foulard method, and
225industria textila 2019, vol. 70, nr. 3˘
Fig. 2. The histogram of the comparative assessment of the impact of the life cycle for hydrophobic cotton fabricobtained by foulard with NUVA TTC and by RF plasma (Teflon), using the method for the evaluation of damage
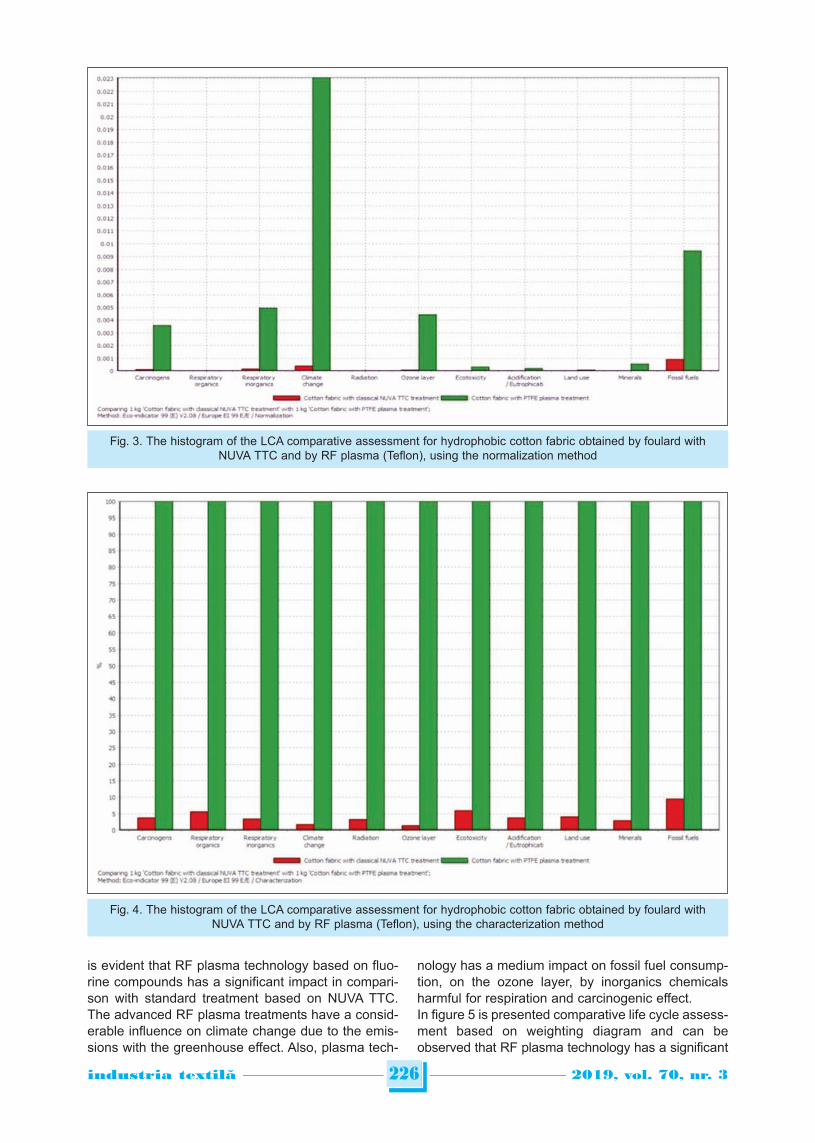
is evident that RF plasma technology based on fluo-rine compounds has a significant impact in compari-son with standard treatment based on NUVA TTC.The advanced RF plasma treatments have a consid-erable influence on climate change due to the emis-sions with the greenhouse effect. Also, plasma tech-
nology has a medium impact on fossil fuel consump-tion, on the ozone layer, by inorganics chemicalsharmful for respiration and carcinogenic effect.In figure 5 is presented comparative life cycle assess-ment based on weighting diagram and can beobserved that RF plasma technology has a significant
226industria textila 2019, vol. 70, nr. 3˘
Fig. 3. The histogram of the LCA comparative assessment for hydrophobic cotton fabric obtained by foulard withNUVA TTC and by RF plasma (Teflon), using the normalization method
Fig. 4. The histogram of the LCA comparative assessment for hydrophobic cotton fabric obtained by foulard withNUVA TTC and by RF plasma (Teflon), using the characterization method
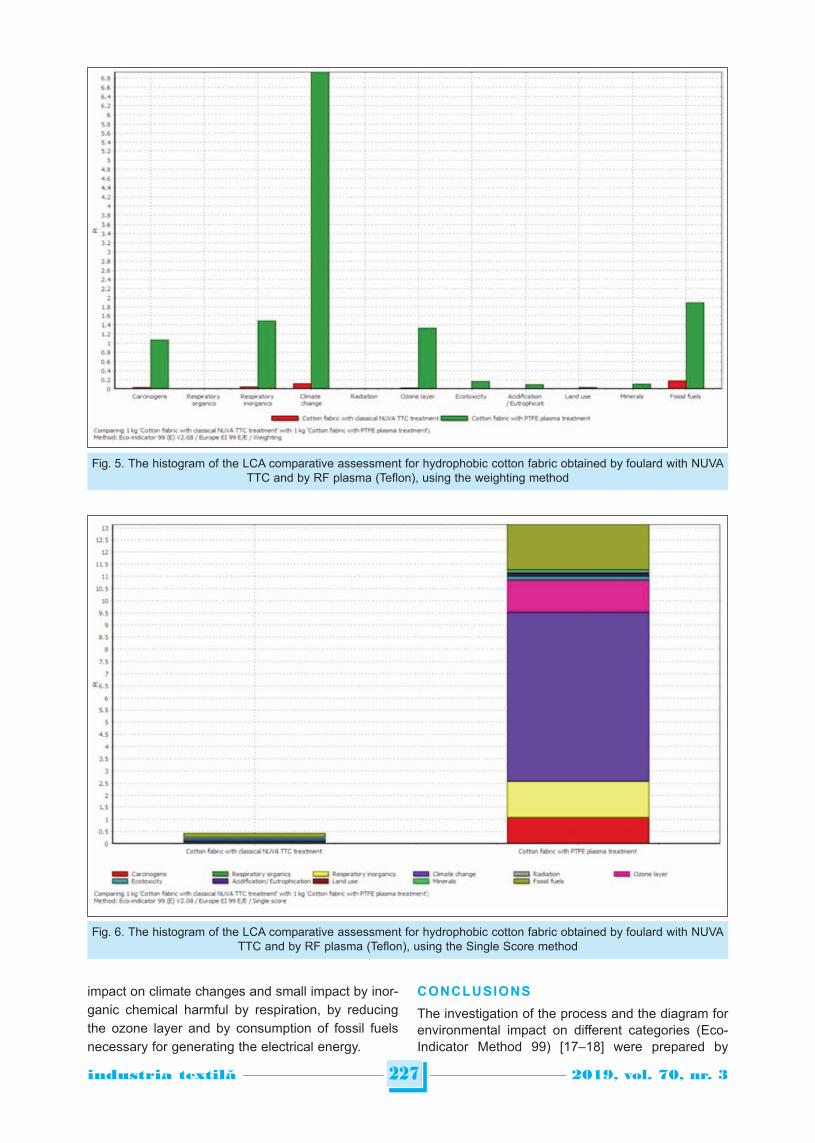
impact on climate changes and small impact by inor-ganic chemical harmful by respiration, by reducingthe ozone layer and by consumption of fossil fuelsnecessary for generating the electrical energy.
CONCLUSIONS
The investigation of the process and the diagram forenvironmental impact on different categories (Eco-Indicator Method 99) [17–18] were prepared by
227industria textila 2019, vol. 70, nr. 3˘
Fig. 5. The histogram of the LCA comparative assessment for hydrophobic cotton fabric obtained by foulard with NUVATTC and by RF plasma (Teflon), using the weighting method
Fig. 6. The histogram of the LCA comparative assessment for hydrophobic cotton fabric obtained by foulard with NUVATTC and by RF plasma (Teflon), using the Single Score method
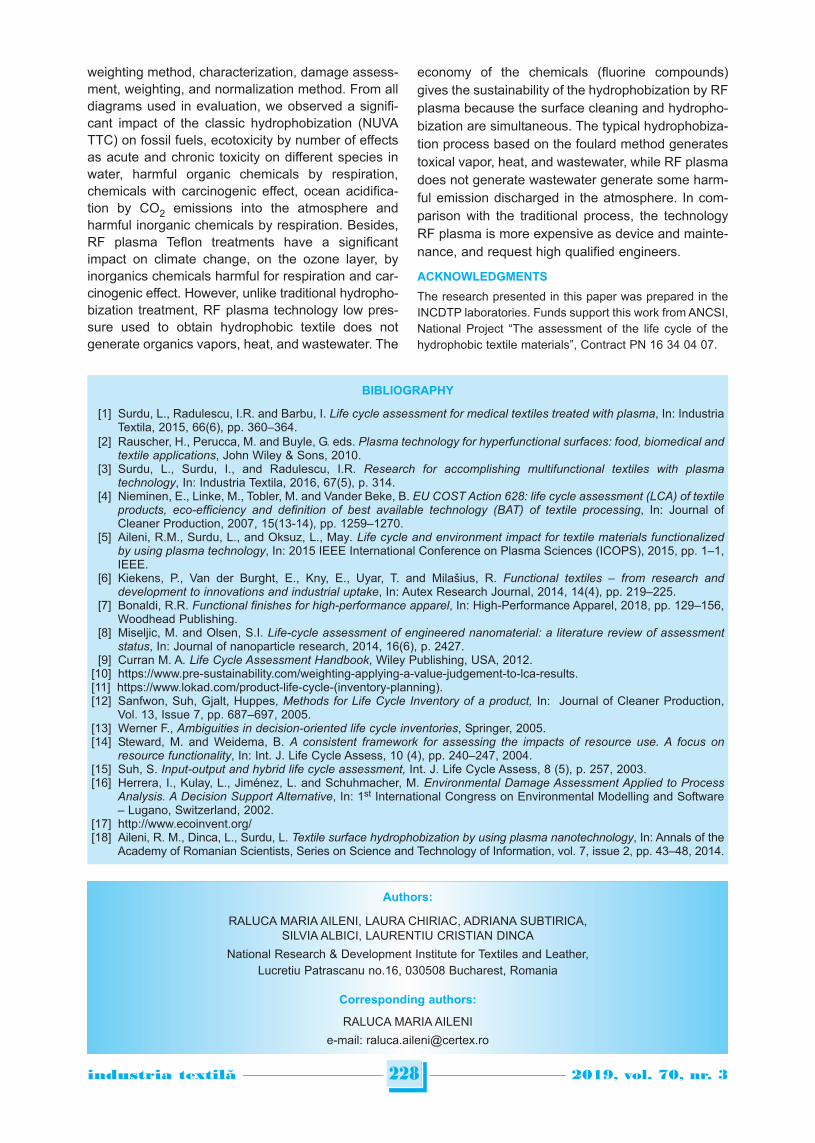
weighting method, characterization, damage assess-ment, weighting, and normalization method. From alldiagrams used in evaluation, we observed a signifi-cant impact of the classic hydrophobization (NUVATTC) on fossil fuels, ecotoxicity by number of effectsas acute and chronic toxicity on different species inwater, harmful organic chemicals by respiration,chemicals with carcinogenic effect, ocean acidifica-tion by CO2 emissions into the atmosphere andharmful inorganic chemicals by respiration. Besides,RF plasma Teflon treatments have a significantimpact on climate change, on the ozone layer, byinorganics chemicals harmful for respiration and car-cinogenic effect. However, unlike traditional hydropho-bization treatment, RF plasma technology low pres-sure used to obtain hydrophobic textile does notgenerate organics vapors, heat, and wastewater. The
economy of the chemicals (fluorine compounds)gives the sustainability of the hydrophobization by RFplasma because the surface cleaning and hydropho-bization are simultaneous. The typical hydrophobiza-tion process based on the foulard method generatestoxical vapor, heat, and wastewater, while RF plasmadoes not generate wastewater generate some harm-ful emission discharged in the atmosphere. In com-parison with the traditional process, the technologyRF plasma is more expensive as device and mainte-nance, and request high qualified engineers.
ACKNOWLEDGMENTS
The research presented in this paper was prepared in theINCDTP laboratories. Funds support this work from ANCSI,National Project “The assessment of the life cycle of thehydrophobic textile materials”, Contract PN 16 34 04 07.
228industria textila 2019, vol. 70, nr. 3˘
BIBLIOGRAPHY
[1] Surdu, L., Radulescu, I.R. and Barbu, I. Life cycle assessment for medical textiles treated with plasma, In: IndustriaTextila, 2015, 66(6), pp. 360–364.
[2] Rauscher, H., Perucca, M. and Buyle, G. eds. Plasma technology for hyperfunctional surfaces: food, biomedical andtextile applications, John Wiley & Sons, 2010.
[3] Surdu, L., Surdu, I., and Radulescu, I.R. Research for accomplishing multifunctional textiles with plasmatechnology, In: Industria Textila, 2016, 67(5), p. 314.
[4] Nieminen, E., Linke, M., Tobler, M. and Vander Beke, B. EU COST Action 628: life cycle assessment (LCA) of textileproducts, eco-efficiency and definition of best available technology (BAT) of textile processing, In: Journal ofCleaner Production, 2007, 15(13-14), pp. 1259–1270.
[5] Aileni, R.M., Surdu, L., and Oksuz, L., May. Life cycle and environment impact for textile materials functionalizedby using plasma technology, In: 2015 IEEE International Conference on Plasma Sciences (ICOPS), 2015, pp. 1–1,IEEE.
[6] Kiekens, P., Van der Burght, E., Kny, E., Uyar, T. and Milašius, R. Functional textiles – from research anddevelopment to innovations and industrial uptake, In: Autex Research Journal, 2014, 14(4), pp. 219–225.
[7] Bonaldi, R.R. Functional finishes for high-performance apparel, In: High-Performance Apparel, 2018, pp. 129–156,Woodhead Publishing.
[8] Miseljic, M. and Olsen, S.I. Life-cycle assessment of engineered nanomaterial: a literature review of assessmentstatus, In: Journal of nanoparticle research, 2014, 16(6), p. 2427.
[9] Curran M. A. Life Cycle Assessment Handbook, Wiley Publishing, USA, 2012.[10] https://www.pre-sustainability.com/weighting-applying-a-value-judgement-to-lca-results.[11] https://www.lokad.com/product-life-cycle-(inventory-planning).[12] Sanfwon, Suh, Gjalt, Huppes, Methods for Life Cycle Inventory of a product, In: Journal of Cleaner Production,
Vol. 13, Issue 7, pp. 687–697, 2005.[13] Werner F., Ambiguities in decision-oriented life cycle inventories, Springer, 2005.[14] Steward, M. and Weidema, B. A consistent framework for assessing the impacts of resource use. A focus on
resource functionality, In: Int. J. Life Cycle Assess, 10 (4), pp. 240–247, 2004.[15] Suh, S. Input-output and hybrid life cycle assessment, Int. J. Life Cycle Assess, 8 (5), p. 257, 2003.[16] Herrera, I., Kulay, L., Jiménez, L. and Schuhmacher, M. Environmental Damage Assessment Applied to Process
Analysis. A Decision Support Alternative, In: 1st International Congress on Environmental Modelling and Software– Lugano, Switzerland, 2002.
[17] http://www.ecoinvent.org/[18] Aileni, R. M., Dinca, L., Surdu, L. Textile surface hydrophobization by using plasma nanotechnology, In: Annals of the
Academy of Romanian Scientists, Series on Science and Technology of Information, vol. 7, issue 2, pp. 43–48, 2014.
Authors:
RALUCA MARIA AILENI, LAURA CHIRIAC, ADRIANA SUBTIRICA, SILVIA ALBICI, LAURENTIU CRISTIAN DINCA
National Research & Development Institute for Textiles and Leather,Lucretiu Patrascanu no.16, 030508 Bucharest, Romania
Corresponding authors:
RALUCA MARIA AILENI
e-mail: [email protected]
INTRODUCTION
Pelvic floor dysfunction (PFD) covers diseases ofpelvic organ prolapse and stress incontinence, withsymptoms like metroptosis, vaginal wall bulge, defe-cation disorder. With the aging trend of the populationin the world, senile diseases such as POP and SUIhave a much higher morbidity. More than 50%women over 50 years old are suffering from the dis-eases, with lifetime risk reaching to 30% to 50%. PFDhas a serious health risk to women, more than 11%of them even need to receive operation. Traditionalsurgery focused on repeatedly reinforced weak tis-sues, difficult to build a stable pelvic floor to resist thechange of pressure. However, implanting mesh inpelvic area no more than repairs, but also brings
weaken tissues to regeneration, reconstruct thewhole pelvic floor and recover its anatomical struc-ture.With more advanced materials’ wide clinical applica-tions, reconstruction and repair of pelvic floor wasimproved greatly in recent years. Among variousmedical meshes, polypropylene (PP) is the mostwidely used type for its nice mechanical property andbiocompatibility. PP material can be designed to sev-eral structures, leave a big part for product renewal.Also, it has good chemical stability which can livethrough the complex human internal environment.However, some defects of PP mesh such as hardhand-feeling and non-degradability, resulted in seri-ous foreign body sensation, tissue adhesion and
229industria textila 2019, vol. 70, nr. 3˘
Preparation of PDO mesh and research on its fabrication parameters
DOI: 10.35530/IT.070.03.1544
YAO LU BIN HU SI CHEN YOU-KAI CHENNAN-NAN LI SHUANG-LIN ZHOUCHAO GUO
REZUMAT – ABSTRACT
Prepararea plasei PDO și studio privind parametrii de fabricare
Folosirea protezelor pentru înlocuirea țesuturilor slăbite sau a fasciei pelvine este acceptată de mai mulți specialiști dindomeniul medicinii actuale. PDO este, de asemenea, considerat un material degradabil ideal, cum ar fi PP, care a fost celmai popular poplimer utilizat în domeniul medical. Studiul a pregătit o plasă PDO cu structură macroporoasă utilizând unmodel de placă armată cu structură poroasă de formă pătrată și materii prime din monofilamente PDO. Parametrii defabricare, inclusiv diametrul monofilamentului, dimensiunea porilor, forma porilor, au fost analizate pe baza proprietățilormecanice adecvate ale plaselor PDO. Procesele optime de fabricație au fost obținute ulterior. Rezultatele au arătat cămonofilamentele PDO cu diametrul de 0,23 mm ar putea face ca plasa să aibă propria greutate, grosime și rezistență latracțiune, precum și cea mai mare forța de scoatere a suturii. Forma pătrată a porilor a întărit forța de tracțiune a plasei,menținând o forță mai mare de scoatere a suturii, în special în comparație cu forma de romb a porilor. În ceea ce priveștedimensiunea porilor, plasa PDO cu pori de 5 mm a avut o rezistență mai mare, satisfăcând, de asemenea, necesitatea degreutate redusă a plasei. Degradarea in vitro a plasei PDO a fost măsurată folosind 3 mono filamente cu diametru diferit.Toate probele au fost degradate semnificativ numai după 10 săptămâni, rata de pierdere în greutate atingând aproximativ30% după 16 săptămâni. În final, plasa PDO a fost evaluată pentru a avea un avantaj clar al greutății reduse, dar un riscscăzut de rezistență în comparație cu diverse alte tipuri de plasă comercializate.
Cuvinte-cheie: plasă medicală, PDO, parametrii de fabricare, proprități mecanice
Preparation of PDO mesh and research on its fabrication parameters
Using prosthesis to replace weaken tissues or fascia in pelvic is accepted by more people in present medicine field. PDOis also considered to be an ideal degradable material such as PP, which was the most popular used type in medical area.The paper prepared macro-porous structure PDO meshes using an armor plate model of square-pore structure and rawmaterial of PDO monofilaments. Fabrication parameters including monofilament diameter, pore size, pore shape werediscussed based on a suitable mechanical properties of PDO meshes. The optimal fabrication processes were obtainedafter then. The results revealed that PDO monofilaments of 0.23 mm diameter could make mesh to own moderate weight,thickness and tensile strength, as well as the largest suture pulling out force. Square-pore shape strengthened meshtensile force, maintaining larger suture pulling out force especially compared to that of rhombus-pore shape. As for poresize, PDO mesh with 5 mm pores had larger strength, also satisfying requirement of mesh’s lightweight. In vitrodegradation of PDO mesh was measured using 3 different diameter monofilaments. All samples were significantlydegraded only after 10 weeks, with weight loss rate reaching to about 30% after 16 weeks. Finally, PDO mesh wasassessed to have an obvious lightweight advantage, but low strength risk by comparison to several commercial meshproducts.
Keywords: medical mesh, PDO, fabrication parameter, mechanical property
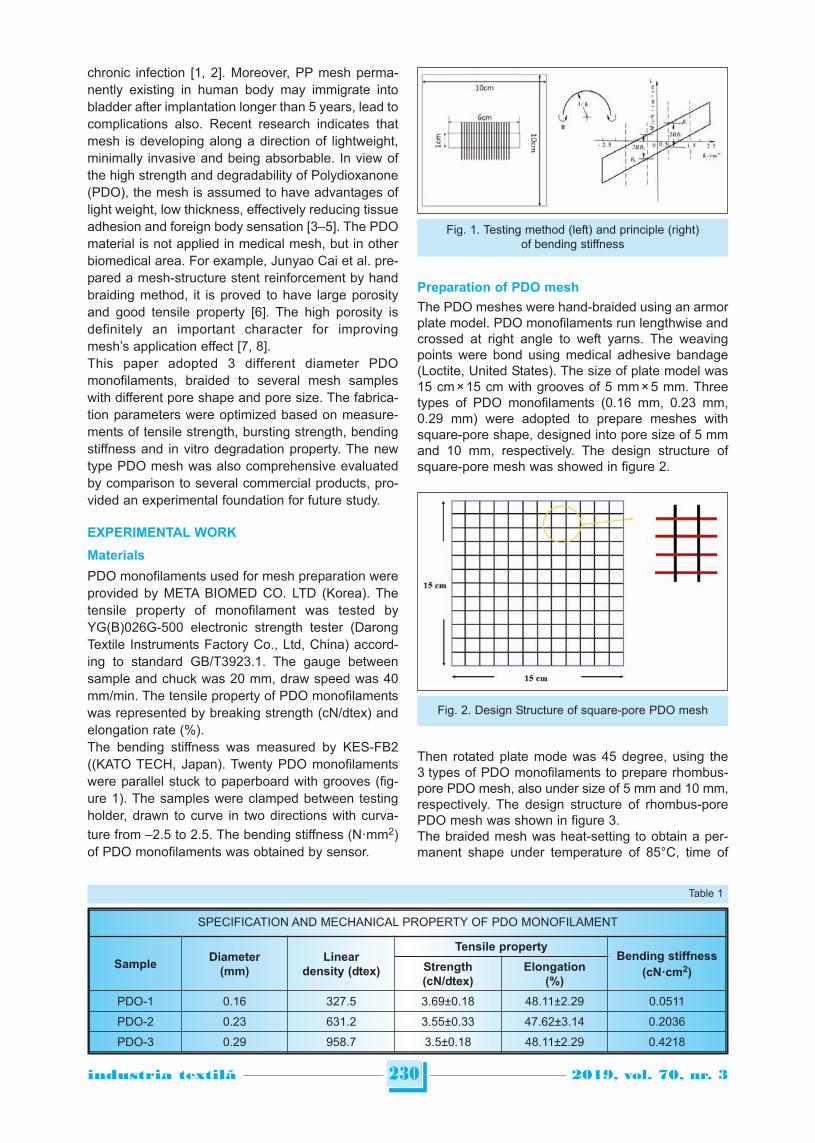
chronic infection [1, 2]. Moreover, PP mesh perma-nently existing in human body may immigrate intobladder after implantation longer than 5 years, lead tocomplications also. Recent research indicates thatmesh is developing along a direction of lightweight,minimally invasive and being absorbable. In view ofthe high strength and degradability of Polydioxanone(PDO), the mesh is assumed to have advantages oflight weight, low thickness, effectively reducing tissueadhesion and foreign body sensation [3–5]. The PDOmaterial is not applied in medical mesh, but in otherbiomedical area. For example, Junyao Cai et al. pre-pared a mesh-structure stent reinforcement by handbraiding method, it is proved to have large porosityand good tensile property [6]. The high porosity isdefinitely an important character for improvingmesh’s application effect [7, 8]. This paper adopted 3 different diameter PDOmonofilaments, braided to several mesh sampleswith different pore shape and pore size. The fabrica-tion parameters were optimized based on measure-ments of tensile strength, bursting strength, bendingstiffness and in vitro degradation property. The newtype PDO mesh was also comprehensive evaluatedby comparison to several commercial products, pro-vided an experimental foundation for future study.
EXPERIMENTAL WORK
Materials
PDO monofilaments used for mesh preparation wereprovided by META BIOMED CO. LTD (Korea). Thetensile property of monofilament was tested byYG(B)026G-500 electronic strength tester (DarongTextile Instruments Factory Co., Ltd, China) accord-ing to standard GB/T3923.1. The gauge betweensample and chuck was 20 mm, draw speed was 40mm/min. The tensile property of PDO monofilamentswas represented by breaking strength (cN/dtex) andelongation rate (%). The bending stiffness was measured by KES-FB2((KATO TECH, Japan). Twenty PDO monofilamentswere parallel stuck to paperboard with grooves (fig-ure 1). The samples were clamped between testingholder, drawn to curve in two directions with curva-
ture from –2.5 to 2.5. The bending stiffness (N·mm2)of PDO monofilaments was obtained by sensor.
Preparation of PDO mesh
The PDO meshes were hand-braided using an armorplate model. PDO monofilaments run lengthwise andcrossed at right angle to weft yarns. The weavingpoints were bond using medical adhesive bandage(Loctite, United States). The size of plate model was15 cm × 15 cm with grooves of 5 mm × 5 mm. Threetypes of PDO monofilaments (0.16 mm, 0.23 mm,0.29 mm) were adopted to prepare meshes withsquare-pore shape, designed into pore size of 5 mmand 10 mm, respectively. The design structure ofsquare-pore mesh was showed in figure 2.
Then rotated plate mode was 45 degree, using the3 types of PDO monofilaments to prepare rhombus-pore PDO mesh, also under size of 5 mm and 10 mm,respectively. The design structure of rhombus-porePDO mesh was shown in figure 3. The braided mesh was heat-setting to obtain a per-manent shape under temperature of 85°C, time of
230industria textila 2019, vol. 70, nr. 3˘
Fig. 1. Testing method (left) and principle (right)of bending stiffness
Fig. 2. Design Structure of square-pore PDO mesh
SPECIFICATION AND MECHANICAL PROPERTY OF PDO MONOFILAMENT
SampleDiameter
(mm)Linear
density (dtex)
Tensile propertyBending stiffness
(cN·cm2)Strength(cN/dtex)
Elongation(%)
PDO-1 0.16 327.5 3.69±0.18 48.11±2.29 0.0511
PDO-2 0.23 631.2 3.55±0.33 47.62±3.14 0.2036
PDO-3 0.29 958.7 3.5±0.18 48.11±2.29 0.4218
Table 1
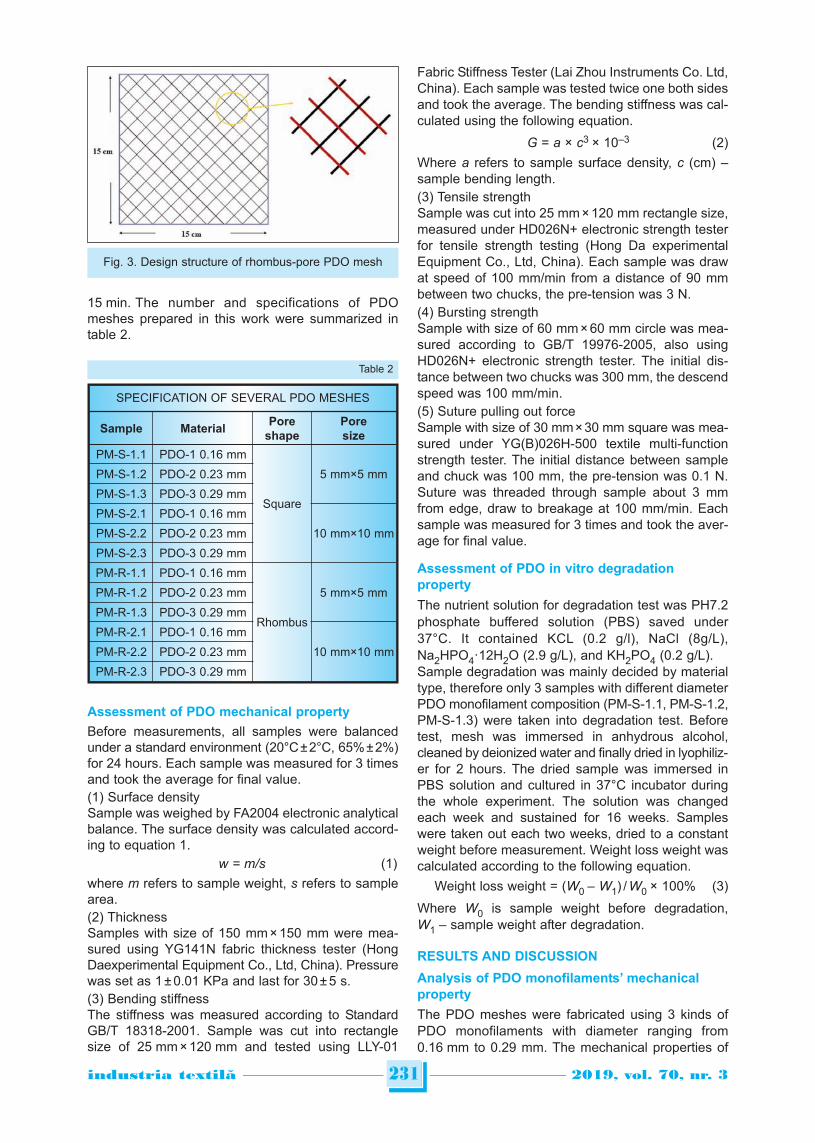
15 min. The number and specifications of PDOmeshes prepared in this work were summarized intable 2.
Assessment of PDO mechanical property
Before measurements, all samples were balancedunder a standard environment (20°C ± 2°C, 65% ± 2%)for 24 hours. Each sample was measured for 3 timesand took the average for final value.(1) Surface densitySample was weighed by FA2004 electronic analyticalbalance. The surface density was calculated accord-ing to equation 1.
w = m/s (1)
where m refers to sample weight, s refers to samplearea.(2) ThicknessSamples with size of 150 mm × 150 mm were mea-sured using YG141N fabric thickness tester (HongDaexperimental Equipment Co., Ltd, China). Pressurewas set as 1 ± 0.01 KPa and last for 30 ± 5 s.(3) Bending stiffnessThe stiffness was measured according to StandardGB/T 18318-2001. Sample was cut into rectanglesize of 25 mm × 120 mm and tested using LLY-01
Fabric Stiffness Tester (Lai Zhou Instruments Co. Ltd,China). Each sample was tested twice one both sidesand took the average. The bending stiffness was cal-culated using the following equation.
G = a × c3 × 10–3 (2)
Where a refers to sample surface density, c (cm) –sample bending length. (3) Tensile strengthSample was cut into 25 mm × 120 mm rectangle size,measured under HD026N+ electronic strength testerfor tensile strength testing (Hong Da experimentalEquipment Co., Ltd, China). Each sample was drawat speed of 100 mm/min from a distance of 90 mmbetween two chucks, the pre-tension was 3 N.(4) Bursting strengthSample with size of 60 mm × 60 mm circle was mea-sured according to GB/T 19976-2005, also usingHD026N+ electronic strength tester. The initial dis-tance between two chucks was 300 mm, the descendspeed was 100 mm/min.(5) Suture pulling out forceSample with size of 30 mm × 30 mm square was mea-sured under YG(B)026H-500 textile multi-functionstrength tester. The initial distance between sampleand chuck was 100 mm, the pre-tension was 0.1 N.Suture was threaded through sample about 3 mmfrom edge, draw to breakage at 100 mm/min. Eachsample was measured for 3 times and took the aver-age for final value.
Assessment of PDO in vitro degradationproperty
The nutrient solution for degradation test was PH7.2phosphate buffered solution (PBS) saved under37°C. It contained KCL (0.2 g/l), NaCl (8g/L),Na2HPO4·12H2O (2.9 g/L), and KH2PO4 (0.2 g/L). Sample degradation was mainly decided by materialtype, therefore only 3 samples with different diameterPDO monofilament composition (PM-S-1.1, PM-S-1.2,PM-S-1.3) were taken into degradation test. Beforetest, mesh was immersed in anhydrous alcohol,cleaned by deionized water and finally dried in lyophiliz-er for 2 hours. The dried sample was immersed inPBS solution and cultured in 37°C incubator duringthe whole experiment. The solution was changedeach week and sustained for 16 weeks. Sampleswere taken out each two weeks, dried to a constantweight before measurement. Weight loss weight wascalculated according to the following equation.
Weight loss weight = (W0 – W1) / W0 × 100% (3)
Where W0 is sample weight before degradation,W1 – sample weight after degradation.
RESULTS AND DISCUSSION
Analysis of PDO monofilaments’ mechanicalproperty
The PDO meshes were fabricated using 3 kinds ofPDO monofilaments with diameter ranging from0.16 mm to 0.29 mm. The mechanical properties of
231industria textila 2019, vol. 70, nr. 3˘
Fig. 3. Design structure of rhombus-pore PDO mesh
Table 2
SPECIFICATION OF SEVERAL PDO MESHES
Sample MaterialPore
shapePoresize
PM-S-1.1 PDO-1 0.16 mm
Square
5 mm×5 mmPM-S-1.2 PDO-2 0.23 mm
PM-S-1.3 PDO-3 0.29 mm
PM-S-2.1 PDO-1 0.16 mm
10 mm×10 mmPM-S-2.2 PDO-2 0.23 mm
PM-S-2.3 PDO-3 0.29 mm
PM-R-1.1 PDO-1 0.16 mm
Rhombus
5 mm×5 mmPM-R-1.2 PDO-2 0.23 mm
PM-R-1.3 PDO-3 0.29 mm
PM-R-2.1 PDO-1 0.16 mm
10 mm×10 mmPM-R-2.2 PDO-2 0.23 mm
PM-R-2.3 PDO-3 0.29 mm
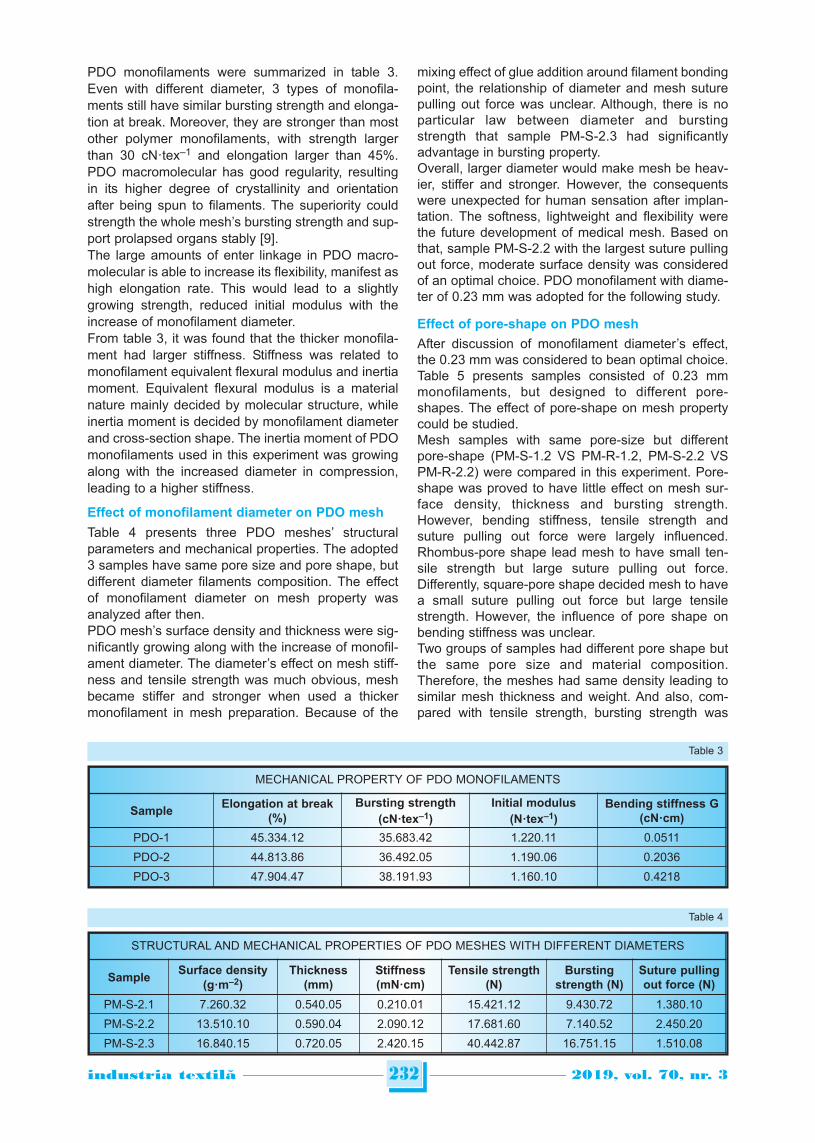
PDO monofilaments were summarized in table 3.Even with different diameter, 3 types of monofila-ments still have similar bursting strength and elonga-tion at break. Moreover, they are stronger than mostother polymer monofilaments, with strength largerthan 30 cN·tex–1 and elongation larger than 45%.PDO macromolecular has good regularity, resultingin its higher degree of crystallinity and orientationafter being spun to filaments. The superiority couldstrength the whole mesh’s bursting strength and sup-port prolapsed organs stably [9]. The large amounts of enter linkage in PDO macro-molecular is able to increase its flexibility, manifest ashigh elongation rate. This would lead to a slightlygrowing strength, reduced initial modulus with theincrease of monofilament diameter. From table 3, it was found that the thicker monofila-ment had larger stiffness. Stiffness was related tomonofilament equivalent flexural modulus and inertiamoment. Equivalent flexural modulus is a materialnature mainly decided by molecular structure, whileinertia moment is decided by monofilament diameterand cross-section shape. The inertia moment of PDOmonofilaments used in this experiment was growingalong with the increased diameter in compression,leading to a higher stiffness.
Effect of monofilament diameter on PDO mesh
Table 4 presents three PDO meshes’ structuralparameters and mechanical properties. The adopted3 samples have same pore size and pore shape, butdifferent diameter filaments composition. The effectof monofilament diameter on mesh property wasanalyzed after then. PDO mesh’s surface density and thickness were sig-nificantly growing along with the increase of monofil-ament diameter. The diameter’s effect on mesh stiff-ness and tensile strength was much obvious, meshbecame stiffer and stronger when used a thickermonofilament in mesh preparation. Because of the
mixing effect of glue addition around filament bondingpoint, the relationship of diameter and mesh suturepulling out force was unclear. Although, there is noparticular law between diameter and burstingstrength that sample PM-S-2.3 had significantlyadvantage in bursting property. Overall, larger diameter would make mesh be heav-ier, stiffer and stronger. However, the consequentswere unexpected for human sensation after implan-tation. The softness, lightweight and flexibility werethe future development of medical mesh. Based onthat, sample PM-S-2.2 with the largest suture pullingout force, moderate surface density was consideredof an optimal choice. PDO monofilament with diame-ter of 0.23 mm was adopted for the following study.
Effect of pore-shape on PDO mesh
After discussion of monofilament diameter’s effect,the 0.23 mm was considered to bean optimal choice.Table 5 presents samples consisted of 0.23 mmmonofilaments, but designed to different pore-shapes. The effect of pore-shape on mesh propertycould be studied.Mesh samples with same pore-size but differentpore-shape (PM-S-1.2 VS PM-R-1.2, PM-S-2.2 VSPM-R-2.2) were compared in this experiment. Pore-shape was proved to have little effect on mesh sur-face density, thickness and bursting strength.However, bending stiffness, tensile strength andsuture pulling out force were largely influenced.Rhombus-pore shape lead mesh to have small ten-sile strength but large suture pulling out force.Differently, square-pore shape decided mesh to havea small suture pulling out force but large tensilestrength. However, the influence of pore shape onbending stiffness was unclear. Two groups of samples had different pore shape butthe same pore size and material composition.Therefore, the meshes had same density leading tosimilar mesh thickness and weight. And also, com-pared with tensile strength, bursting strength was
232industria textila 2019, vol. 70, nr. 3˘
STRUCTURAL AND MECHANICAL PROPERTIES OF PDO MESHES WITH DIFFERENT DIAMETERS
SampleSurface density
(g·m–2)Thickness
(mm)Stiffness(mN·cm)
Tensile strength(N)
Burstingstrength (N)
Suture pullingout force (N)
PM-S-2.1 7.260.32 0.540.05 0.210.01 15.421.12 9.430.72 1.380.10
PM-S-2.2 13.510.10 0.590.04 2.090.12 17.681.60 7.140.52 2.450.20
PM-S-2.3 16.840.15 0.720.05 2.420.15 40.442.87 16.751.15 1.510.08
Table 4
MECHANICAL PROPERTY OF PDO MONOFILAMENTS
SampleElongation at break
(%)Bursting strength
(cN·tex–1)
Initial modulus
(N·tex–1)Bending stiffness G
(cN·cm)
PDO-1 45.334.12 35.683.42 1.220.11 0.0511
PDO-2 44.813.86 36.492.05 1.190.06 0.2036
PDO-3 47.904.47 38.191.93 1.160.10 0.4218
Table 3
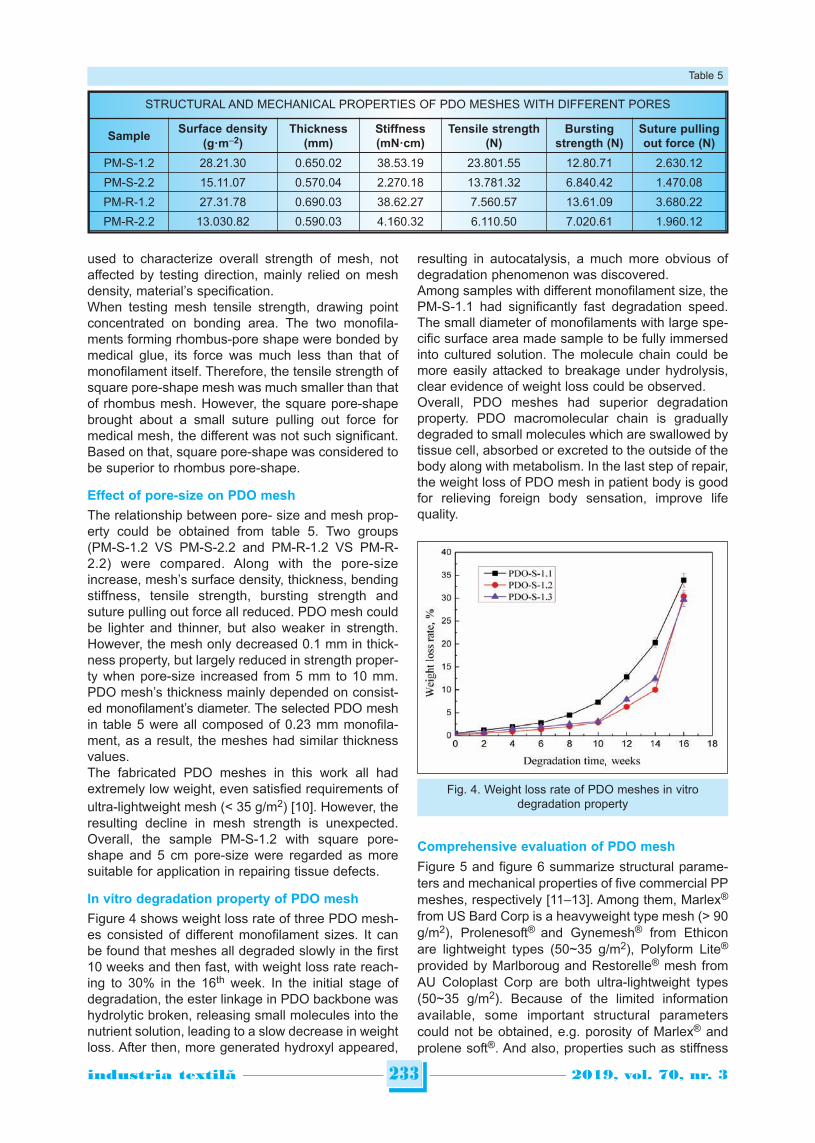
used to characterize overall strength of mesh, notaffected by testing direction, mainly relied on meshdensity, material’s specification. When testing mesh tensile strength, drawing pointconcentrated on bonding area. The two monofila-ments forming rhombus-pore shape were bonded bymedical glue, its force was much less than that ofmonofilament itself. Therefore, the tensile strength ofsquare pore-shape mesh was much smaller than thatof rhombus mesh. However, the square pore-shapebrought about a small suture pulling out force formedical mesh, the different was not such significant.Based on that, square pore-shape was considered tobe superior to rhombus pore-shape.
Effect of pore-size on PDO mesh
The relationship between pore- size and mesh prop-erty could be obtained from table 5. Two groups(PM-S-1.2 VS PM-S-2.2 and PM-R-1.2 VS PM-R-2.2) were compared. Along with the pore-sizeincrease, mesh’s surface density, thickness, bendingstiffness, tensile strength, bursting strength andsuture pulling out force all reduced. PDO mesh couldbe lighter and thinner, but also weaker in strength.However, the mesh only decreased 0.1 mm in thick-ness property, but largely reduced in strength proper-ty when pore-size increased from 5 mm to 10 mm.PDO mesh’s thickness mainly depended on consist-ed monofilament’s diameter. The selected PDO meshin table 5 were all composed of 0.23 mm monofila-ment, as a result, the meshes had similar thicknessvalues.The fabricated PDO meshes in this work all hadextremely low weight, even satisfied requirements ofultra-lightweight mesh (< 35 g/m2) [10]. However, theresulting decline in mesh strength is unexpected.Overall, the sample PM-S-1.2 with square pore-shape and 5 cm pore-size were regarded as moresuitable for application in repairing tissue defects.
In vitro degradation property of PDO mesh
Figure 4 shows weight loss rate of three PDO mesh-es consisted of different monofilament sizes. It canbe found that meshes all degraded slowly in the first10 weeks and then fast, with weight loss rate reach-ing to 30% in the 16th week. In the initial stage ofdegradation, the ester linkage in PDO backbone washydrolytic broken, releasing small molecules into thenutrient solution, leading to a slow decrease in weightloss. After then, more generated hydroxyl appeared,
resulting in autocatalysis, a much more obvious ofdegradation phenomenon was discovered.Among samples with different monofilament size, thePM-S-1.1 had significantly fast degradation speed.The small diameter of monofilaments with large spe-cific surface area made sample to be fully immersedinto cultured solution. The molecule chain could bemore easily attacked to breakage under hydrolysis,clear evidence of weight loss could be observed. Overall, PDO meshes had superior degradationproperty. PDO macromolecular chain is graduallydegraded to small molecules which are swallowed bytissue cell, absorbed or excreted to the outside of thebody along with metabolism. In the last step of repair,the weight loss of PDO mesh in patient body is goodfor relieving foreign body sensation, improve lifequality.
Comprehensive evaluation of PDO mesh
Figure 5 and figure 6 summarize structural parame-ters and mechanical properties of five commercial PPmeshes, respectively [11–13]. Among them, Marlex®
from US Bard Corp is a heavyweight type mesh (> 90g/m2), Prolenesoft® and Gynemesh® from Ethiconare lightweight types (50~35 g/m2), Polyform Lite®
provided by Marlboroug and Restorelle® mesh fromAU Coloplast Corp are both ultra-lightweight types(50~35 g/m2). Because of the limited informationavailable, some important structural parameterscould not be obtained, e.g. porosity of Marlex® andprolene soft®. And also, properties such as stiffness
233industria textila 2019, vol. 70, nr. 3˘
STRUCTURAL AND MECHANICAL PROPERTIES OF PDO MESHES WITH DIFFERENT PORES
SampleSurface density
(g·m–2)Thickness
(mm)Stiffness(mN·cm)
Tensile strength(N)
Burstingstrength (N)
Suture pullingout force (N)
PM-S-1.2 28.21.30 0.650.02 38.53.19 23.801.55 12.80.71 2.630.12
PM-S-2.2 15.11.07 0.570.04 2.270.18 13.781.32 6.840.42 1.470.08
PM-R-1.2 27.31.78 0.690.03 38.62.27 7.560.57 13.61.09 3.680.22
PM-R-2.2 13.030.82 0.590.03 4.160.32 6.110.50 7.020.61 1.960.12
Table 5
Fig. 4. Weight loss rate of PDO meshes in vitrodegradation property
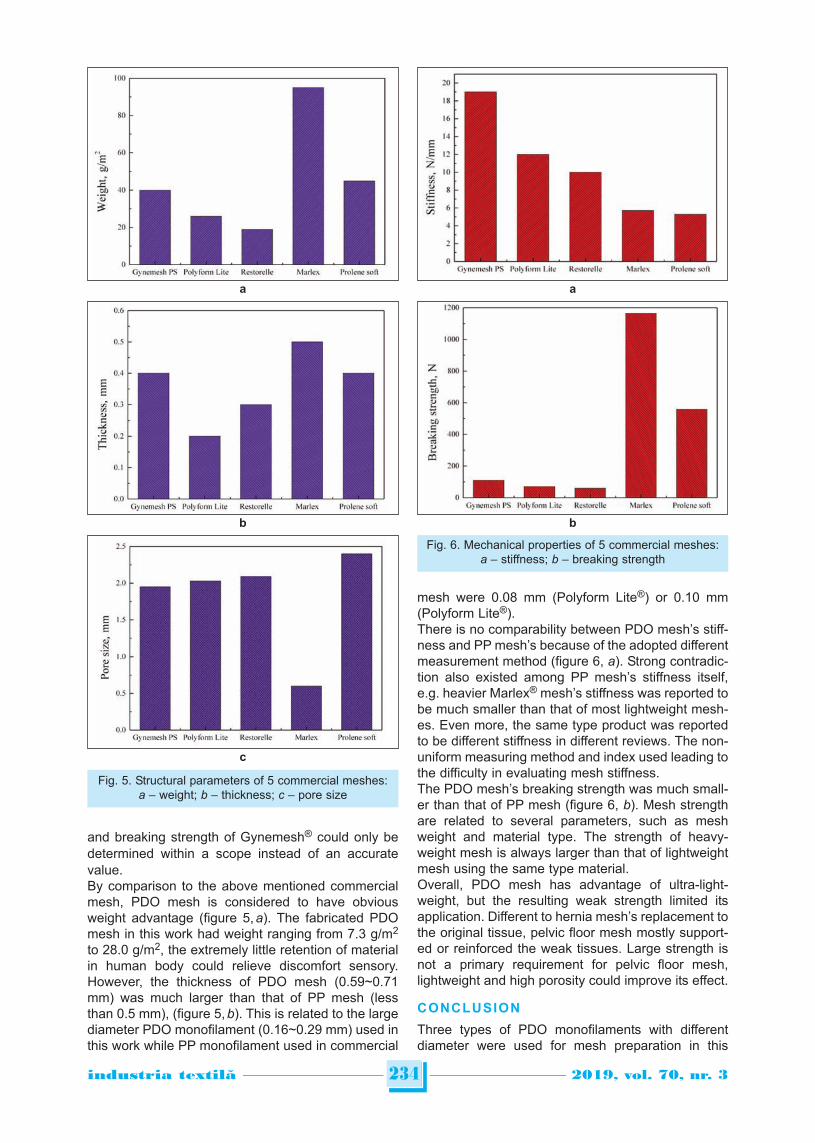
and breaking strength of Gynemesh® could only bedetermined within a scope instead of an accuratevalue. By comparison to the above mentioned commercialmesh, PDO mesh is considered to have obviousweight advantage (figure 5, a). The fabricated PDOmesh in this work had weight ranging from 7.3 g/m2
to 28.0 g/m2, the extremely little retention of materialin human body could relieve discomfort sensory.However, the thickness of PDO mesh (0.59~0.71mm) was much larger than that of PP mesh (lessthan 0.5 mm), (figure 5, b). This is related to the largediameter PDO monofilament (0.16~0.29 mm) used inthis work while PP monofilament used in commercial
mesh were 0.08 mm (Polyform Lite®) or 0.10 mm(Polyform Lite®). There is no comparability between PDO mesh’s stiff-ness and PP mesh’s because of the adopted differentmeasurement method (figure 6, a). Strong contradic-tion also existed among PP mesh’s stiffness itself,e.g. heavier Marlex® mesh’s stiffness was reported tobe much smaller than that of most lightweight mesh-es. Even more, the same type product was reportedto be different stiffness in different reviews. The non-uniform measuring method and index used leading tothe difficulty in evaluating mesh stiffness.The PDO mesh’s breaking strength was much small-er than that of PP mesh (figure 6, b). Mesh strengthare related to several parameters, such as meshweight and material type. The strength of heavy-weight mesh is always larger than that of lightweightmesh using the same type material.Overall, PDO mesh has advantage of ultra-light -weight, but the resulting weak strength limited itsapplication. Different to hernia mesh’s replacement tothe original tissue, pelvic floor mesh mostly support-ed or reinforced the weak tissues. Large strength isnot a primary requirement for pelvic floor mesh,lightweight and high porosity could improve its effect.
CONCLUSION
Three types of PDO monofilaments with differentdiameter were used for mesh preparation in this
234industria textila 2019, vol. 70, nr. 3˘
Fig. 5. Structural parameters of 5 commercial meshes: a – weight; b – thickness; c – pore size
b
c
a
Fig. 6. Mechanical properties of 5 commercial meshes:a – stiffness; b – breaking strength
b
a
work. The effect of monofilament property, meshpore-shape and pore-size were discussed for opti-mize PDO mesh fabrication process. Monofilamentdiameter of 0.23 mm was considered to be the mostsuitable choice based on the balance between weightand strength. Square-pore shape made PDO meshto have extremely larger tensile strength. Althoughpore-size of 10 mm lead mesh to be lighter, theresulted significantly reduced strength was unexpect-ed. By comparison to some widely-used commercial
meshes, PDO mesh was assessed to have ultra-lightweight advantage. However, its application inrepairing pelvic floor defects needs more clinicalstudy in future.
ACKNOWLEDGEMENTS
This study was funded by Ningbo Natural Science Fund(Grant No. 2018A610116), Zhejiang Provincial public wel-fare technology application & research plan (Grant No.LGG18E030006), and foundation of Inner MongoliaScientific Research of University (No. NJZY18095).
235industria textila 2019, vol. 70, nr. 3˘
BIBLIOGRAPHY
[1] Özdemır, Ö. Ç., Bakar, Y., Özengın, N., et al. The effect of parity on pelvic floor muscle strength and quality of lifein women with urinary incontinence: a cross sectional study, In: Journal of Physical Therapy Science, Jul 2015,vol. 27, no. 7, pp. 2133–2137.
[2] Novitsky, Y., Harrell, A. J., Paton, B., et al. Comparative evaluation of adhesion formation, strength of in growth, andtextile properties of prosthetic meshes after long-term intra-abdominal implantation in a rabbit. In: Journal ofSurgical Research, Jun 2007, vol .140, no. 1, pp. 6–11.
[3] Hilde, G., Stær-Jensen, J., Siafarikas, F., et al. Impact of childbirth and mode of delivery on vaginal resting pressureand on pelvic floor muscle strength and endurance, In: American Journal of Obstetrics and Gynecology, Oct 2013,vol. 208, no. 1, pp. 1–7.
[4] Costantini, E., Lazzeri, M., Bini, V., et al. Pelvic organ prolapse repair with and without prophylactic concomitantburchcolpo suspension in continent women: A randomized, controlled trial with 8-year follow up.In: Journal ofUrology. Jun 2011, vol.185, pp. 2236–2240.
[5] Brown, C. N., Finch, J. G. Which mesh for hernia repair?, In: Annals of the Royal College of Surgeons of England,May 2010, vol. 92, no. 4, pp. 272–278.
[6] Junyao, C., Tianhui, W., Deng, D., et al. The degradation property of a Netty Structure Scaffold Reinforcement forTendon Tissue Engineering, In: Journal of Donghua University (Natural Science), Oct 2010, vol. 36, no. 5,pp. 491–495.
[7] Gemma, P., Belén, H. G., Marta, R., et al. The long-term behavior of lightweight and heavyweight meshes used torepair abdominal wall defects is determined by the host tissue repair process provoked by the mesh, In: Surgery,May 2012, vol. 152, no. 5, pp. 886–895.
[8] Lu Y., Chen Y C., Zhang P. H., Effects of porosity on structure and performance of PP meshes for repairng pelvicfloor defects. In: Journal of DonghuaUniversity (English Edition), May 2014, vol. 31, no. 5, pp. 704–708.
[9] Liang, R., Abramowitch, S., Knight, K., et al. Vaginal degeneration following implantation of synthetic mesh withincreased stiffness, In: Bjog-Int J ObstetGy, Jan 2013, vol. 120, no. 2, pp. 233–43.
[10] Deeken, C. and Matthews, B. Comparison of contracture, adhesion, tissue in growth, and histologic responsecharacteristics of permanent and absorbable barrier meshes in a porcine model of laparoscopic ventral herniarepair, In: Jul Hernia, 2012, vol. 16, no. 1, pp. 69–76.
[11] Klosterhalfen, B., Junge, K., Klinge, U. The lightweight and large porous mesh concept for hernia repair, In: ExpertReview of Medical Devices, 2005, vol. 2, no. 1, pp. 103–17.
[12] Ulrich, D., Edwards, S. L., Alexander, D. L., et al. Changes in pelvic organ prolapse mesh mechanical propertiesfollowing implantation in rats, In: American Journal of Obstetrics & Gynecology, 2015, vol. 214, no. 2, pp.260.e1–260.e8.
[13] Pott, P. P., Schwarz, M. L. R., Ralf, G., et al. Mechanical properties of mesh materials used for hernia repair andsoft tissue augmentation, In: Plos One, 2012, vol. 7, no. 10, pp. 4821–4836.
Authors:
YAO LU1#, SI CHEN2#, NAN-NAN LI1, CHAO GUO1,BIN HU1, YOUKAI CHEN1, SHUANG-LIN ZHOU3
1Faculty of Healthcare Equipment, Zhejiang Pharmaceutical College, Ningbo, China2College of Light Industry and Textile, Inner Mongolia University of Technology, Hohhot, China
e-mail: [email protected] of Pharmaceutical Engineering, Zhejiang Pharmaceutical College, Ningbo, China
#These authors (YAO LU and SI CHEN) contributed equally to this work and should be considered co-first authors.
Corresponding author:
SHUANG-LIN ZHOU
e-mail: [email protected]
INTRODUCTION
Textile and leather material functionalization by usingnanocomposites is a top research priority for smartfinishing and multifunctional properties development[1–2]. Through synergic influence of polymers onnanomaterial composite, nanocomposites can addnew properties such as: antibacterial [3], UV shield-ing, electrostatic charge dissipation, antistatic or con-ductive properties, water, oil, soil repellence, moisturemanagement, flame retardancy, abrasion resistance,biocompatibility [4] etc. In the last years the use ofconducting polymers [5–6] for flexible electronic tex-tiles or leathers were studied and experimented using
poly(3,4-ethylenedioxythiophene) [7], poly(fluorene),polyphenylene, polypyrene, polyazulene, polynaph-thalene, poly(pyrrole) [8], polycarbazole, polyindole,polyazepine, polyaniline [9], poly(thiophene) [10–11],and poly(p-phenylene)sulphide in combination withmetals (iron, cobalt, nickel, copper, palladium, silver,platinum, gold) or carbon based materials (graphite,carbon nanotubes, and carbon black). Traditional tex-tiles, both natural and synthetic, and leather materi-als are almost always insulators. The interest in trans-forming them into conductors arises from the need toobtain antistatic or electromagnetic shielding gar-ments, or for the production of the flexible electronic
236industria textila 2019, vol. 70, nr. 3˘
Properties of textile and leather materials treated with new hybridSiO2/TiO2/poly(2,2’-bithiophene) nanocomposites
DOI: 10.35530/IT.070.03.1634
LAURA CHIRILA MARIA STANCACARMEN GAIDAU DENISA MARIA RĂDULESCUMALVINA STROE DIANA ELENA RĂDULESCUMIHAELA BAIBARAC COSMIN-ANDREI ALEXE
REZUMAT – ABSTRACT
Proprietățile materialelor textile și din piele tratate cu noi nanocompozite hibride pe bazăde SiO2/TiO2/poli(2,2’-bitiofen)
Scopul acestui studiu a fost de a investiga influența nanocompozitelor noi pe bază de SiO2/TiO2/poli(2,2’-bitiofen) cuconcentrații diferite de nanoparticule de TiO2 și SiO2 asupra proprietăților de suprafață a țesăturii din 50% bumbac/50%poliester și respectiv, pielii de ovină. Dispersiile realizate pe baza noilor nanocompozite au fost analizate în scopuldeterminării conductivității, dimensiunii particulelor, polidispersității și al potențialului Zeta. Materialele textile și din pielefinisate au fost caracterizate din punctul de vedere al peformanței tratamentelor de funcționalizare, prin: rezistivitatea desuprafață, comportarea la contactul cu apa, caracteristicile fizico-mecanice și proprietățile fotocatalitice. Microscopiaelectronică de baleiaj a fost utilizată pentru a investiga distribuția nanoparticulelor pe suprafața materialelor textile și dinpiele. Materialele textile tratate cu nanocompozitul hibrid pe bază de SiO2/poli(2,2’-bitiofen) cu concentrație de 98% SiO2și, respectiv, pielea tratată cu SiO2/poli(2,2’-bitiofen) cu concentrație de 95% nanoparticule de SiO2 au prezentat valori alerezistivității mai mici, confirmând astfel proprietățile conductive ale dioxidului de siliciu. Cea mai ridicată eficiențăfotocatalitică a materialelor funcționalizate a fost obținută în cazul materialului textil tratat cu TiO2/poli(2,2’-bitiofen) cuconcentratie de 95% nanoparticule deTiO2 și, respectiv, pentru pielea tratată cu TiO2/poli(2,2’-bitiofen) cu concentrație de98% nanoparticule deTiO2.
Cuvinte-cheie: nanocompozite hibride, nanocompozite pe bază de TiO2/SiO2/poli(2,2’-bitiofen), rezistivitate de suprafață,proprietăți fotocatalitice, țesătură din 50% bumbac/50% poliester, suprafață din piele
Properties of cotton and leather materials treated with new hybrid SiO2/TiO2/poly(2,2’-bithiophene)nanocomposites
The aim of this study was to investigate the influence of new hybrid composites of TiO2 or SiO2 nanoparticles with poly(2,2’-bithiophene) on 50% cotton/50% polyester fabric and sheep skin leather surface properties. The dispersion-based newlymade nanocomposites were analyzed to determine conductivity, particle size, polydispersity and Zeta potential. Thefinished textile and leather materials were characterized in terms of functionalization treatments performance by: surfaceresistivity, water contact behaviour, physical-mechanical characteristics and photocatalytic properties. SEM analysis wasused to investigate the distribution of nanoparticles on the textile and leather materials surface. Textile materials treatedwith SiO2/poly(2,2’-bithiophene) nanocomposite with concentration 98 wt% nanoparticles of SiO2 and leather treated withpoly SiO2/poly(2,2’-bithiophene) nanocomposite with concentration of 95 wt% nanoparticles of SiO2 showed lowerresistivity values, confirming the conductive properties of silica. The higher photodegradation efficiency of functionalizedmaterials has been obtained for textile material treated with poly TiO2/(2,2’-bithiophene)with concentration of 95 wt%nanoparticles of TiO2 and for leather material treated with TiO2/poly(2,2’-bithiophene) with concentration of 98 wt%nanoparticles of TiO2, respectively.
Keywords: hybrid nanocomposite,TiO2/SiO2/poly(2,2’-bithiophene) nanocomposites, surface resistivity, photocatalytic prop-erties, 50% cotton/50% polyester fabric, leather surface
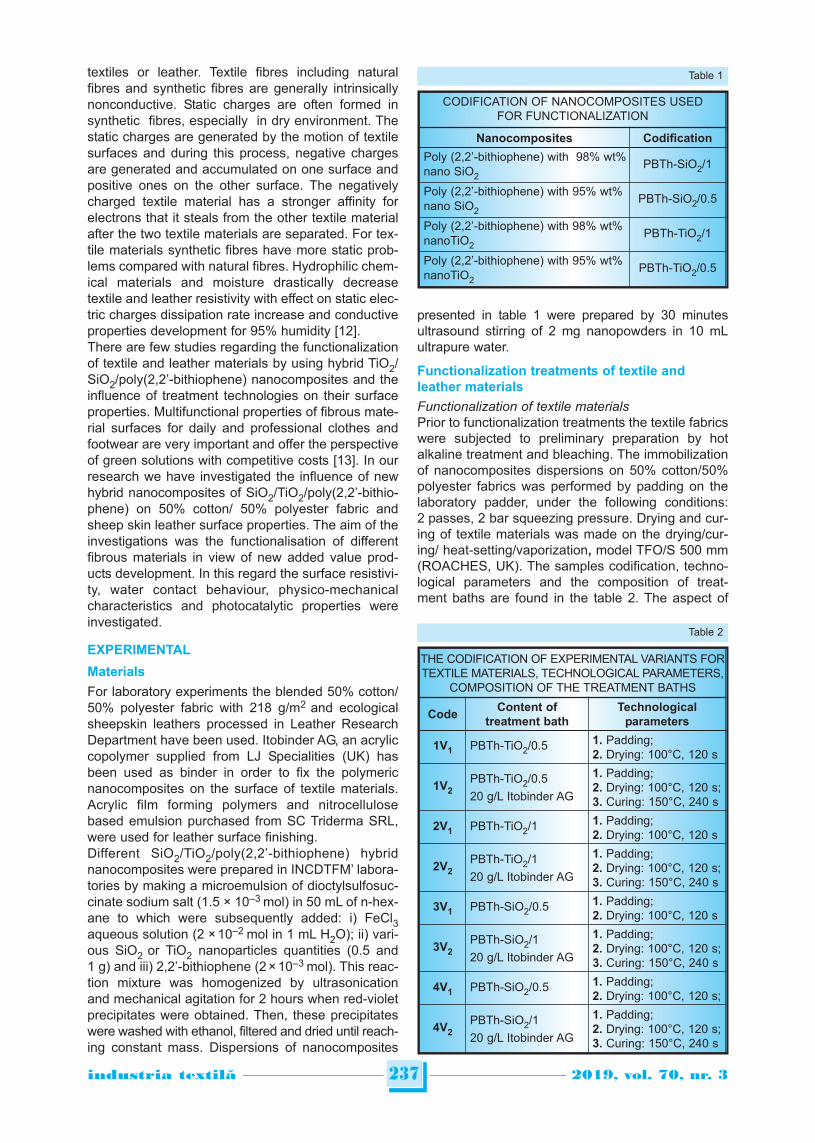
textiles or leather. Textile fibres including naturalfibres and synthetic fibres are generally intrinsicallynonconductive. Static charges are often formed insynthetic fibres, especially in dry environment. Thestatic charges are generated by the motion of textilesurfaces and during this process, negative chargesare generated and accumulated on one surface andpositive ones on the other surface. The negativelycharged textile material has a stronger affinity forelectrons that it steals from the other textile materialafter the two textile materials are separated. For tex-tile materials synthetic fibres have more static prob-lems compared with natural fibres. Hydrophilic chem-ical materials and moisture drastically decreasetextile and leather resistivity with effect on static elec-tric charges dissipation rate increase and conductiveproperties development for 95% humidity [12]. There are few studies regarding the functionalizationof textile and leather materials by using hybrid TiO2/SiO2/poly(2,2’-bithiophene) nanocomposites and theinfluence of treatment technologies on their surfaceproperties. Multifunctional properties of fibrous mate-rial surfaces for daily and professional clothes andfootwear are very important and offer the perspectiveof green solutions with competitive costs [13]. In ourresearch we have investigated the influence of newhybrid nanocomposites of SiO2/TiO2/poly(2,2’-bithio-phene) on 50% cotton/ 50% polyester fabric andsheep skin leather surface properties. The aim of theinvestigations was the functionalisation of differentfibrous materials in view of new added value prod-ucts development. In this regard the surface resistivi -ty, water contact behaviour, physico-mechanicalcharacteristics and photocatalytic properties wereinvestigated.
EXPERIMENTAL
Materials
For laboratory experiments the blended 50% cotton/50% polyester fabric with 218 g/m2 and ecologicalsheepskin leathers processed in Leather ResearchDepartment have been used. Itobinder AG, an acryliccopolymer supplied from LJ Specialities (UK) hasbeen used as binder in order to fix the polymericnanocomposites on the surface of textile materials.Acrylic film forming polymers and nitrocellulosebased emulsion purchased from SC Triderma SRL,were used for leather surface finishing.Different SiO2/TiO2/poly(2,2’-bithiophene) hybridnano composites were prepared in INCDTFM’ labora-tories by making a microemulsion of dioctylsulfosuc-cinate sodium salt (1.5 × 10⁻³ mol) in 50 mL of n-hex-ane to which were subsequently added: i) FeCl3aqueous solution (2 × 10⁻² mol in 1 mL H2O); ii) vari-ous SiO2 or TiO2 nanoparticles quantities (0.5 and1 g) and iii) 2,2’-bithiophene (2 × 10⁻³ mol). This reac-tion mixture was homogenized by ultrasonicationand mechanical agitation for 2 hours when red-violetprecipitates were obtained. Then, these precipitateswere washed with ethanol, filtered and dried until reach-ing constant mass. Dispersions of nanocomposites
presented in table 1 were prepared by 30 minutesultrasound stirring of 2 mg nanopowders in 10 mLultrapure water.
Functionalization treatments of textile andleather materials
Functionalization of textile materialsPrior to functionalization treatments the textile fabricswere subjected to preliminary preparation by hotalkaline treatment and bleaching. The immobilizationof nanocomposites dispersions on 50% cotton/50%polyester fabrics was performed by padding on thelaboratory padder, under the following conditions:2 passes, 2 bar squeezing pressure. Drying and cur-ing of textile materials was made on the drying/cur-ing/ heat-setting/vaporization, model TFO/S 500 mm(ROACHES, UK). The samples codification, techno-logical parameters and the composition of treat-ment baths are found in the table 2. The aspect of
237industria textila 2019, vol. 70, nr. 3˘
CODIFICATION OF NANOCOMPOSITES USEDFOR FUNCTIONALIZATION
Nanocomposites Codification
Poly (2,2’-bithiophene) with 98% wt%nano SiO2
PBTh-SiO2/1
Poly (2,2’-bithiophene) with 95% wt%nano SiO2
PBTh-SiO2/0.5
Poly (2,2’-bithiophene) with 98% wt%nanoTiO2
PBTh-TiO2/1
Poly (2,2’-bithiophene) with 95% wt%nanoTiO2
PBTh-TiO2/0.5
Table 1
Table 2
THE CODIFICATION OF EXPERIMENTAL VARIANTS FORTEXTILE MATERIALS, TECHNOLOGICAL PARAMETERS,
COMPOSITION OF THE TREATMENT BATHS
CodeContent of
treatment bathTechnological
parameters
1V1 PBTh-TiO2/0.5 1. Padding;2. Drying: 100°C, 120 s
1V2PBTh-TiO2/0.5
20 g/L Itobinder AG
1. Padding;2. Drying: 100°C, 120 s;3. Curing: 150°C, 240 s
2V1 PBTh-TiO2/1 1. Padding;2. Drying: 100°C, 120 s
2V2PBTh-TiO2/1
20 g/L Itobinder AG
1. Padding;2. Drying: 100°C, 120 s;3. Curing: 150°C, 240 s
3V1 PBTh-SiO2/0.5 1. Padding;2. Drying: 100°C, 120 s
3V2PBTh-SiO2/1
20 g/L Itobinder AG
1. Padding;2. Drying: 100°C, 120 s;3. Curing: 150°C, 240 s
4V1 PBTh-SiO2/0.5 1. Padding;2. Drying: 100°C, 120 s;
4V2PBTh-SiO2/1
20 g/L Itobinder AG
1. Padding;2. Drying: 100°C, 120 s;3. Curing: 150°C, 240 s
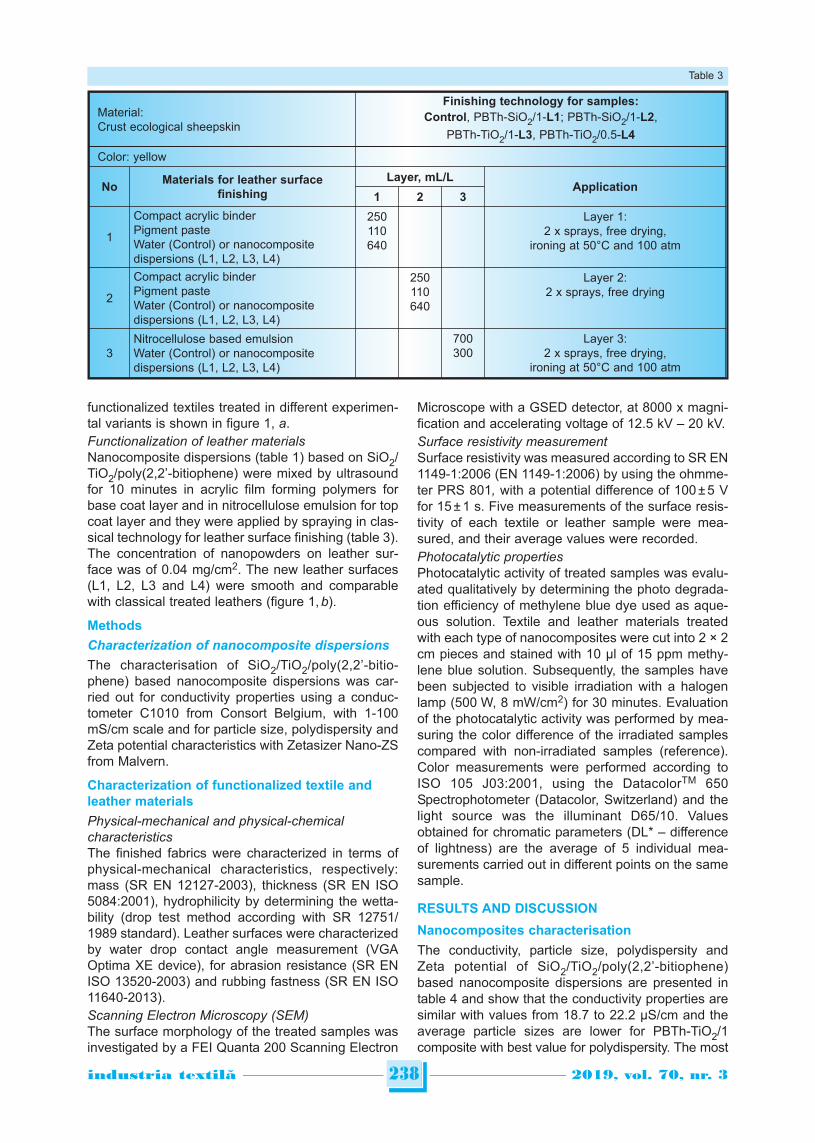
functionalized textiles treated in different experimen-tal variants is shown in figure 1, a.Functionalization of leather materialsNanocomposite dispersions (table 1) based on SiO2/TiO2/poly(2,2’-bitiophene) were mixed by ultrasoundfor 10 minutes in acrylic film forming polymers forbase coat layer and in nitrocellulose emulsion for topcoat layer and they were applied by spraying in clas-sical technology for leather surface finishing (table 3).The concentration of nanopowders on leather sur-face was of 0.04 mg/cm2. The new leather surfaces(L1, L2, L3 and L4) were smooth and comparablewith classical treated leathers (figure 1, b).
Methods
Characterization of nanocomposite dispersions
The characterisation of SiO2/TiO2/poly(2,2’-bitio-phene) based nanocomposite dispersions was car-ried out for conductivity properties using a conduc-tometer C1010 from Consort Belgium, with 1-100mS/cm scale and for particle size, polydispersity andZeta potential characteristics with Zetasizer Nano-ZSfrom Malvern.
Characterization of functionalized textile andleather materials
Physical-mechanical and physical-chemicalcharacteristicsThe finished fabrics were characterized in terms ofphysical-mechanical characteristics, respectively:mass (SR EN 12127-2003), thickness (SR EN ISO5084:2001), hydrophilicity by determining the wetta-bility (drop test method according with SR 12751/1989 standard). Leather surfaces were characterizedby water drop contact angle measurement (VGAOptima XE device), for abrasion resistance (SR ENISO 13520-2003) and rubbing fastness (SR EN ISO11640-2013).Scanning Electron Microscopy (SEM)The surface morphology of the treated samples wasinvestigated by a FEI Quanta 200 Scanning Electron
Microscope with a GSED detector, at 8000 x magni-fication and accelerating voltage of 12.5 kV – 20 kV.Surface resistivity measurementSurface resistivity was measured according to SR EN1149-1:2006 (EN 1149-1:2006) by using the ohmme-ter PRS 801, with a potential difference of 100 ± 5 Vfor 15 ± 1 s. Five measurements of the surface resis-tivity of each textile or leather sample were mea-sured, and their average values were recorded.Photocatalytic propertiesPhotocatalytic activity of treated samples was evalu-ated qualitatively by determining the photo degrada-tion efficiency of methylene blue dye used as aque-ous solution. Textile and leather materials treatedwith each type of nanocomposites were cut into 2 × 2cm pieces and stained with 10 µl of 15 ppm methy-lene blue solution. Subsequently, the samples havebeen subjected to visible irradiation with a halogenlamp (500 W, 8 mW/cm2) for 30 minutes. Evaluationof the photocatalytic activity was performed by mea-suring the color difference of the irradiated samplescompared with non-irradiated samples (reference).Color measurements were performed according toISO 105 J03:2001, using the DatacolorTM 650Spectrophotometer (Datacolor, Switzerland) and thelight source was the illuminant D65/10. Values obtained for chromatic parameters (DL* – differenceof lightness) are the average of 5 individual mea-surements carried out in different points on the samesample.
RESULTS AND DISCUSSION
Nanocomposites characterisation
The conductivity, particle size, polydispersity andZeta potential of SiO2/TiO2/poly(2,2’-bitiophene)based nanocomposite dispersions are presented intable 4 and show that the conductivity properties aresimilar with values from 18.7 to 22.2 µS/cm and theaverage particle sizes are lower for PBTh-TiO2/1composite with best value for polydispersity. The most
238industria textila 2019, vol. 70, nr. 3˘
Material:Crust ecological sheepskin
Finishing technology for samples:
Control, PBTh-SiO2/1-L1; PBTh-SiO2/1-L2,
PBTh-TiO2/1-L3, PBTh-TiO2/0.5-L4
Color: yellow
NoMaterials for leather surface
finishing
Layer, mL/LApplication
1 2 3
1
Compact acrylic binder Pigment paste Water (Control) or nanocompositedispersions (L1, L2, L3, L4)
250110640
Layer 1:2 x sprays, free drying,
ironing at 50°C and 100 atm
2
Compact acrylic binder Pigment paste Water (Control) or nanocompositedispersions (L1, L2, L3, L4)
250110640
Layer 2:2 x sprays, free drying
3Nitrocellulose based emulsion Water (Control) or nanocompositedispersions (L1, L2, L3, L4)
700300
Layer 3:2 x sprays, free drying,
ironing at 50°C and 100 atm
Table 3
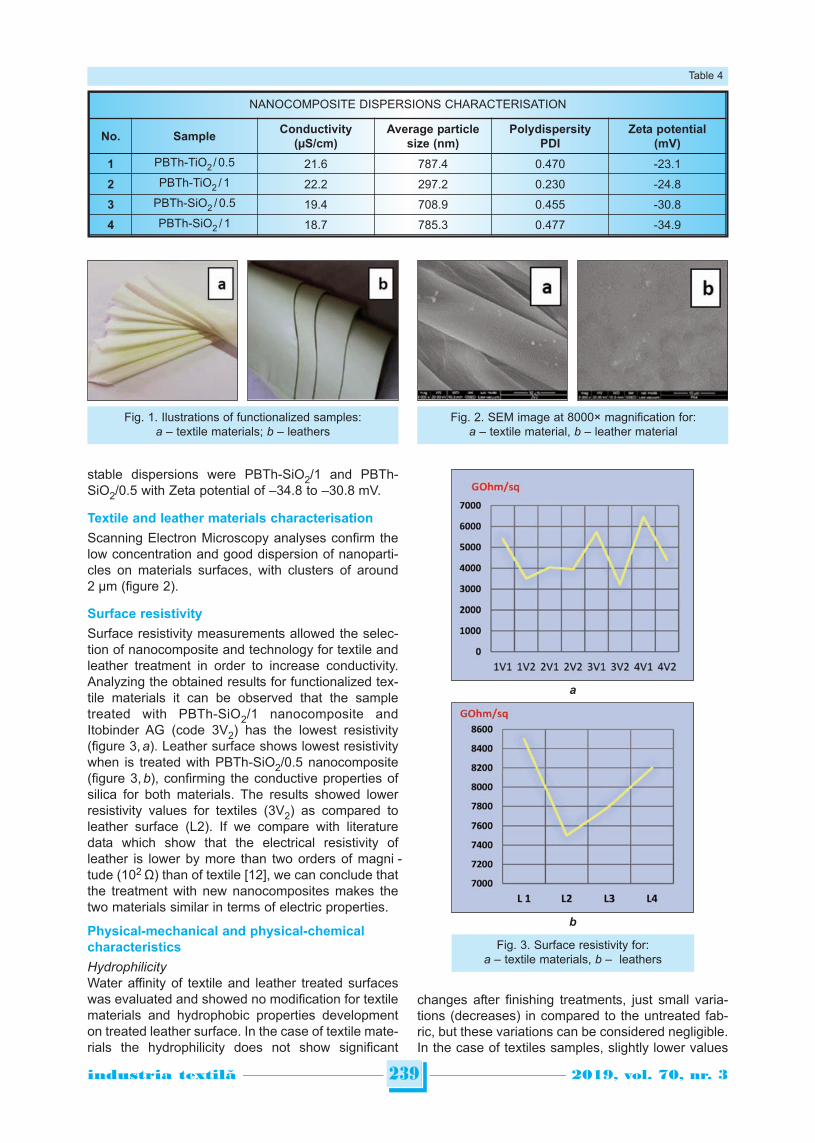
stable dispersions were PBTh-SiO2/1 and PBTh-SiO2/0.5 with Zeta potential of –34.8 to –30.8 mV.
Textile and leather materials characterisation
Scanning Electron Microscopy analyses confirm thelow concentration and good dispersion of nanoparti-cles on materials surfaces, with clusters of around2 µm (figure 2).
Surface resistivity
Surface resistivity measurements allowed the selec-tion of nanocomposite and technology for textile andleather treatment in order to increase conductivity.Analyzing the obtained results for functionalized tex-tile materials it can be observed that the sampletreated with PBTh-SiO2/1 nanocomposite andItobinder AG (code 3V2) has the lowest resistivity(figure 3, a). Leather surface shows lowest resistivitywhen is treated with PBTh-SiO2/0.5 nanocomposite(figure 3, b), confirming the conductive properties ofsilica for both materials. The results showed lowerresistivity values for textiles (3V2) as compared toleather surface (L2). If we compare with literaturedata which show that the electrical resistivity ofleather is lower by more than two orders of magni -tude (102 Ω) than of textile [12], we can conclude thatthe treatment with new nanocomposites makes thetwo materials similar in terms of electric properties.
Physical-mechanical and physical-chemicalcharacteristics
Hydrophilicity Water affinity of textile and leather treated surfaceswas evaluated and showed no modification for textilematerials and hydrophobic properties developmenton treated leather surface. In the case of textile mate-rials the hydrophilicity does not show significant
changes after finishing treatments, just small varia-tions (decreases) in compared to the untreated fab-ric, but these variations can be considered negligible.In the case of textiles samples, slightly lower values
239industria textila 2019, vol. 70, nr. 3˘
NANOCOMPOSITE DISPERSIONS CHARACTERISATION
No. SampleConductivity
(µS/cm)Average particle
size (nm)Polydispersity
PDIZeta potential
(mV)
1 PBTh-TiO2 / 0.5 21.6 787.4 0.470 -23.1
2 PBTh-TiO2 / 1 22.2 297.2 0.230 -24.8
3 PBTh-SiO2 / 0.5 19.4 708.9 0.455 -30.8
4 PBTh-SiO2 / 1 18.7 785.3 0.477 -34.9
Table 4
Fig. 2. SEM image at 8000× magnification for:a – textile material, b – leather material
Fig. 1. Ilustrations of functionalized samples: a – textile materials; b – leathers
Fig. 3. Surface resistivity for:a – textile materials, b – leathers
a
b
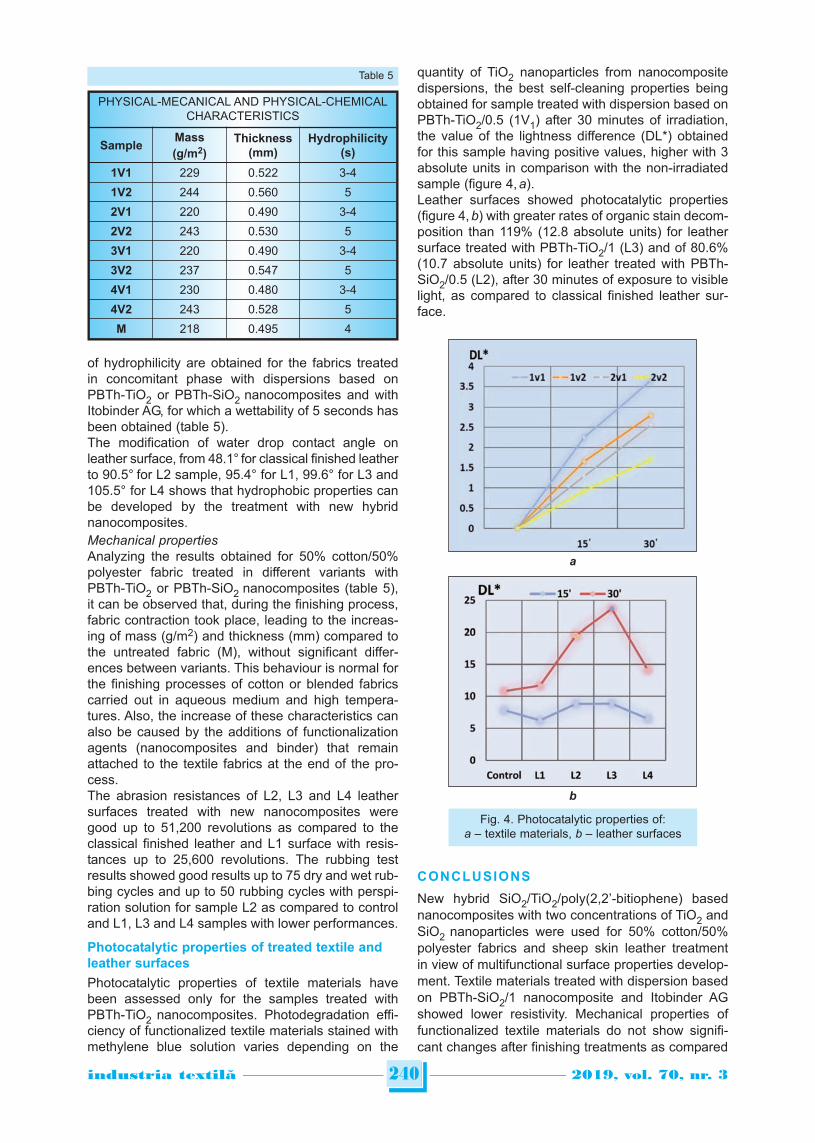
of hydrophilicity are obtained for the fabrics treatedin concomitant phase with dispersions based onPBTh-TiO2 or PBTh-SiO2 nanocomposites and withItobinder AG, for which a wettability of 5 seconds hasbeen obtained (table 5).The modification of water drop contact angle onleather surface, from 48.1° for classical finished leatherto 90.5° for L2 sample, 95.4° for L1, 99.6° for L3 and105.5° for L4 shows that hydrophobic properties canbe developed by the treatment with new hybridnanocomposites.Mechanical propertiesAnalyzing the results obtained for 50% cotton/50%polyester fabric treated in different variants withPBTh-TiO2 or PBTh-SiO2 nanocomposites (table 5),it can be observed that, during the finishing process,fabric contraction took place, leading to the increas-ing of mass (g/m2) and thickness (mm) compared tothe untreated fabric (M), without significant differ-ences between variants. This behaviour is normal forthe finishing processes of cotton or blended fabricscarried out in aqueous medium and high tempera-tures. Also, the increase of these characteristics canalso be caused by the additions of functionalizationagents (nanocomposites and binder) that remainattached to the textile fabrics at the end of the pro-cess. The abrasion resistances of L2, L3 and L4 leathersurfaces treated with new nanocomposites weregood up to 51,200 revolutions as compared to theclassical finished leather and L1 surface with resis-tances up to 25,600 revolutions. The rubbing testresults showed good results up to 75 dry and wet rub-bing cycles and up to 50 rubbing cycles with perspi-ration solution for sample L2 as compared to controland L1, L3 and L4 samples with lower performances.
Photocatalytic properties of treated textile andleather surfaces
Photocatalytic properties of textile materials havebeen assessed only for the samples treated withPBTh-TiO2 nanocomposites. Photodegradation effi-ciency of functionalized textile materials stained withmethylene blue solution varies depending on the
quantity of TiO2 nanoparticles from nanocompositedispersions, the best self-cleaning properties beingobtained for sample treated with dispersion based onPBTh-TiO2/0.5 (1V1) after 30 minutes of irradiation,the value of the lightness difference (DL*) obtainedfor this sample having positive values, higher with 3absolute units in comparison with the non-irradiatedsample (figure 4, a). Leather surfaces showed photocatalytic properties(figure 4, b) with greater rates of organic stain decom-position than 119% (12.8 absolute units) for leathersurface treated with PBTh-TiO2/1 (L3) and of 80.6%(10.7 absolute units) for leather treated with PBTh-SiO2/0.5 (L2), after 30 minutes of exposure to visiblelight, as compared to classical finished leather sur-face.
CONCLUSIONS
New hybrid SiO2/TiO2/poly(2,2’-bitiophene) basednanocomposites with two concentrations of TiO2 andSiO2 nanoparticles were used for 50% cotton/50%polyester fabrics and sheep skin leather treatmentin view of multifunctional surface properties develop-ment. Textile materials treated with dispersion basedon PBTh-SiO2/1 nanocomposite and Itobinder AGshowed lower resistivity. Mechanical properties offunctionalized textile materials do not show signifi-cant changes after finishing treatments as compared
240industria textila 2019, vol. 70, nr. 3˘
Fig. 4. Photocatalytic properties of:a – textile materials, b – leather surfaces
PHYSICAL-MECANICAL AND PHYSICAL-CHEMICALCHARACTERISTICS
SampleMass
(g/m2)Thickness
(mm)Hydrophilicity
(s)
1V1 229 0.522 3-4
1V2 244 0.560 5
2V1 220 0.490 3-4
2V2 243 0.530 5
3V1 220 0.490 3-4
3V2 237 0.547 5
4V1 230 0.480 3-4
4V2 243 0.528 5
M 218 0.495 4
Table 5
a
b
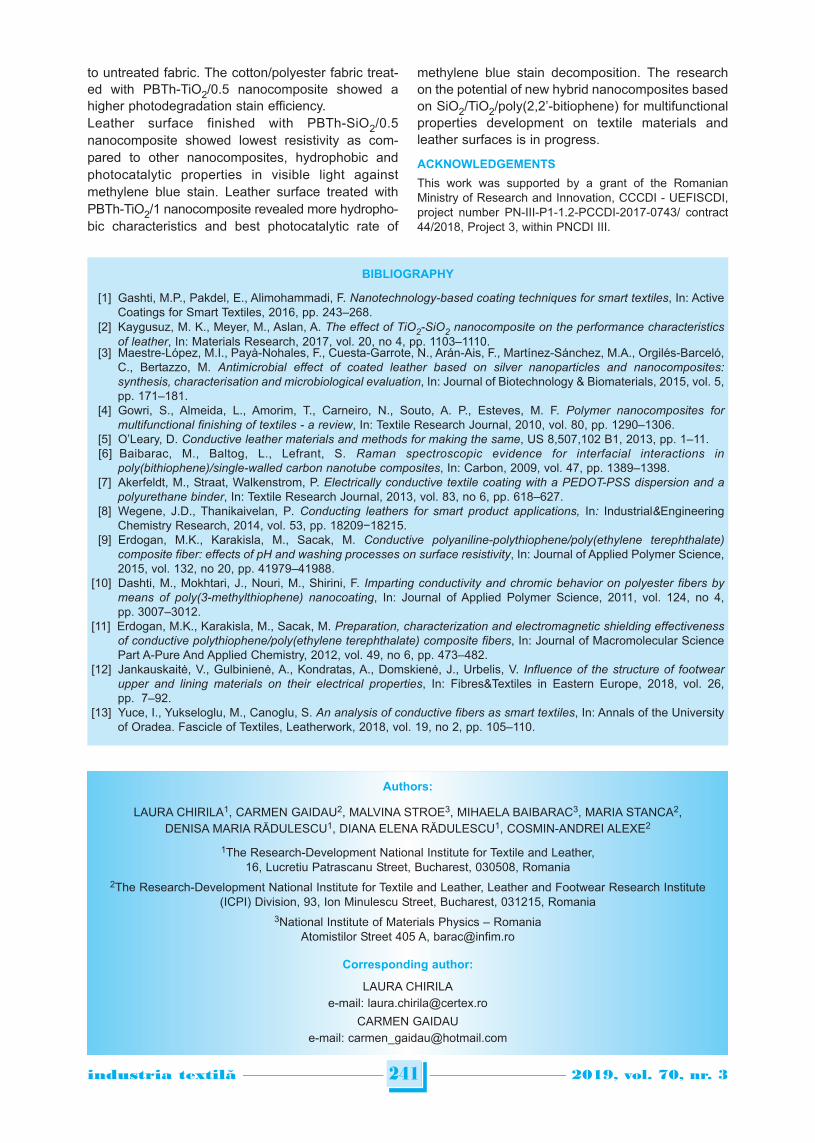
to untreated fabric. The cotton/polyester fabric treat-ed with PBTh-TiO2/0.5 nanocomposite showed ahigher photodegradation stain efficiency. Leather surface finished with PBTh-SiO2/0.5nanocomposite showed lowest resistivity as com-pared to other nanocomposites, hydrophobic andphotocatalytic properties in visible light againstmethylene blue stain. Leather surface treated withPBTh-TiO2/1 nanocomposite revealed more hydropho-bic characteristics and best photocatalytic rate of
methylene blue stain decomposition. The researchon the potential of new hybrid nanocomposites basedon SiO2/TiO2/poly(2,2’-bitiophene) for multifunctionalproperties development on textile materials andleather surfaces is in progress.
ACKNOWLEDGEMENTS
This work was supported by a grant of the RomanianMinistry of Research and Innovation, CCCDI - UEFISCDI,project number PN-III-P1-1.2-PCCDI-2017-0743/ contract44/2018, Project 3, within PNCDI III.
241industria textila 2019, vol. 70, nr. 3˘
BIBLIOGRAPHY
[1] Gashti, M.P., Pakdel, E., Alimohammadi, F. Nanotechnology-based coating techniques for smart textiles, In: ActiveCoatings for Smart Textiles, 2016, pp. 243–268.
[2] Kaygusuz, M. K., Meyer, M., Aslan, A. The effect of TiO2-SiO2 nanocomposite on the performance characteristicsof leather, In: Materials Research, 2017, vol. 20, no 4, pp. 1103–1110.
[3] Maestre-López, M.I., Payà-Nohales, F., Cuesta-Garrote, N., Arán-Ais, F., Martínez-Sánchez, M.A., Orgilés-Barceló,C., Bertazzo, M. Antimicrobial effect of coated leather based on silver nanoparticles and nanocomposites:synthesis, characterisation and microbiological evaluation, In: Journal of Biotechnology & Biomaterials, 2015, vol. 5,pp. 171–181.
[4] Gowri, S., Almeida, L., Amorim, T., Carneiro, N., Souto, A. P., Esteves, M. F. Polymer nanocomposites formultifunctional finishing of textiles - a review, In: Textile Research Journal, 2010, vol. 80, pp. 1290–1306.
[5] O’Leary, D. Conductive leather materials and methods for making the same, US 8,507,102 B1, 2013, pp. 1–11.[6] Baibarac, M., Baltog, L., Lefrant, S. Raman spectroscopic evidence for interfacial interactions in
poly(bithiophene)/single-walled carbon nanotube composites, In: Carbon, 2009, vol. 47, pp. 1389–1398.[7] Akerfeldt, M., Straat, Walkenstrom, P. Electrically conductive textile coating with a PEDOT-PSS dispersion and a
polyurethane binder, In: Textile Research Journal, 2013, vol. 83, no 6, pp. 618–627.[8] Wegene, J.D., Thanikaivelan, P. Conducting leathers for smart product applications, In: Industrial&Engineering
Chemistry Research, 2014, vol. 53, pp. 18209−18215.[9] Erdogan, M.K., Karakisla, M., Sacak, M. Conductive polyaniline-polythiophene/poly(ethylene terephthalate)
composite fiber: effects of pH and washing processes on surface resistivity, In: Journal of Applied Polymer Science,2015, vol. 132, no 20, pp. 41979–41988.
[10] Dashti, M., Mokhtari, J., Nouri, M., Shirini, F. Imparting conductivity and chromic behavior on polyester fibers bymeans of poly(3-methylthiophene) nanocoating, In: Journal of Applied Polymer Science, 2011, vol. 124, no 4,pp. 3007–3012.
[11] Erdogan, M.K., Karakisla, M., Sacak, M. Preparation, characterization and electromagnetic shielding effectivenessof conductive polythiophene/poly(ethylene terephthalate) composite fibers, In: Journal of Macromolecular SciencePart A-Pure And Applied Chemistry, 2012, vol. 49, no 6, pp. 473–482.
[12] Jankauskaitė, V., Gulbinienė, A., Kondratas, A., Domskienė, J., Urbelis, V. Influence of the structure of footwearupper and lining materials on their electrical properties, In: Fibres&Textiles in Eastern Europe, 2018, vol. 26,pp. 7–92.
[13] Yuce, I., Yukseloglu, M., Canoglu, S. An analysis of conductive fibers as smart textiles, In: Annals of the Universityof Oradea. Fascicle of Textiles, Leatherwork, 2018, vol. 19, no 2, pp. 105–110.
Authors:
LAURA CHIRILA1, CARMEN GAIDAU2, MALVINA STROE3, MIHAELA BAIBARAC3, MARIA STANCA2, DENISA MARIA RĂDULESCU1, DIANA ELENA RĂDULESCU1, COSMIN-ANDREI ALEXE2
1The Research-Development National Institute for Textile and Leather,16, Lucretiu Patrascanu Street, Bucharest, 030508, Romania
2The Research-Development National Institute for Textile and Leather, Leather and Footwear Research Institute(ICPI) Division, 93, Ion Minulescu Street, Bucharest, 031215, Romania
3National Institute of Materials Physics – RomaniaAtomistilor Street 405 A, [email protected]
Corresponding author:
LAURA CHIRILAe-mail: [email protected]
CARMEN GAIDAUe-mail: [email protected]
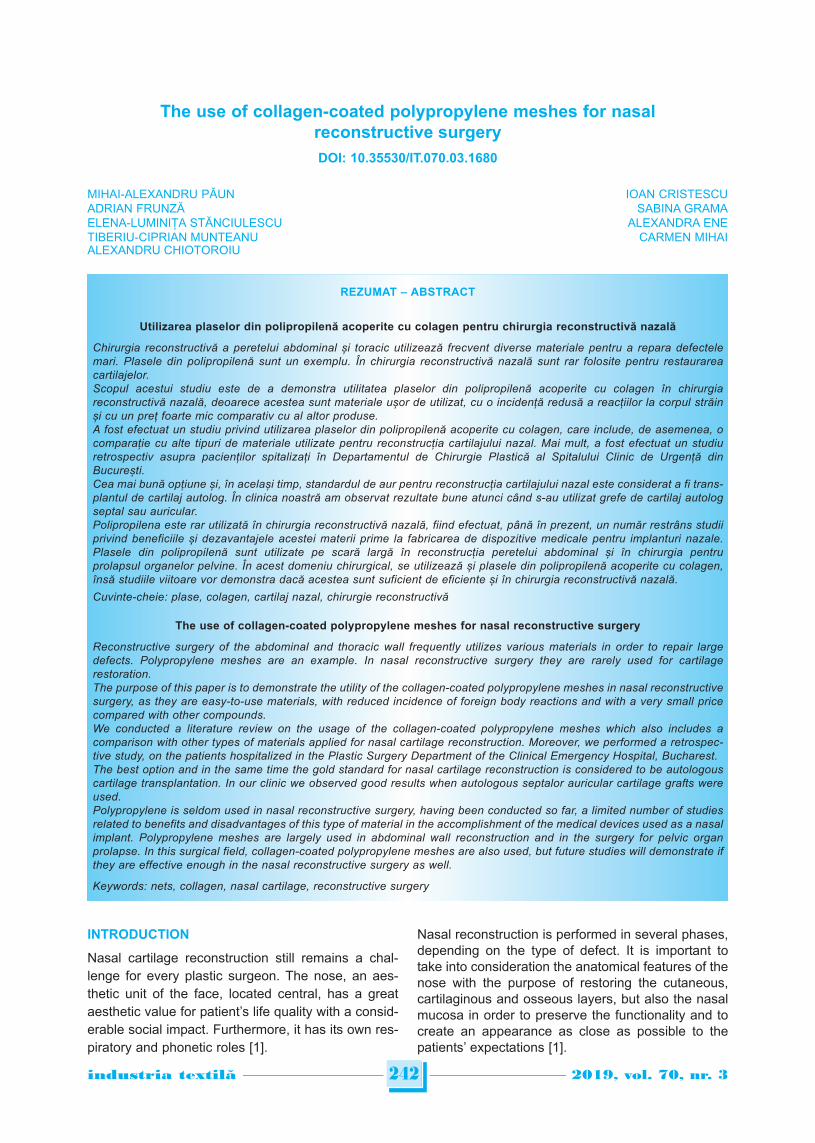
INTRODUCTION
Nasal cartilage reconstruction still remains a chal-lenge for every plastic surgeon. The nose, an aes-thetic unit of the face, located central, has a greataesthetic value for patient’s life quality with a consid-erable social impact. Furthermore, it has its own res-piratory and phonetic roles [1].
Nasal reconstruction is performed in several phases,depending on the type of defect. It is important totake into consideration the anatomical features of thenose with the purpose of restoring the cutaneous,cartilaginous and osseous layers, but also the nasalmucosa in order to preserve the functionality and tocreate an appearance as close as possible to thepatients’ expectations [1].
242industria textila 2019, vol. 70, nr. 3˘
The use of collagen-coated polypropylene meshes for nasalreconstructive surgery
DOI: 10.35530/IT.070.03.1680
IOAN CRISTESCUSABINA GRAMA
ALEXANDRA ENE
MIHAI-ALEXANDRU PĂUN ADRIAN FRUNZĂELENA-LUMINIȚA STĂNCIULESCU TIBERIU-CIPRIAN MUNTEANUALEXANDRU CHIOTOROIU
CARMEN MIHAI
REZUMAT – ABSTRACT
Utilizarea plaselor din polipropilenă acoperite cu colagen pentru chirurgia reconstructivă nazală
Chirurgia reconstructivă a peretelui abdominal și toracic utilizează frecvent diverse materiale pentru a repara defectelemari. Plasele din polipropilenă sunt un exemplu. În chirurgia reconstructivă nazală sunt rar folosite pentru restaurareacartilajelor.Scopul acestui studiu este de a demonstra utilitatea plaselor din polipropilenă acoperite cu colagen în chirurgiareconstructivă nazală, deoarece acestea sunt materiale ușor de utilizat, cu o incidență redusă a reacțiilor la corpul străinși cu un preț foarte mic comparativ cu al altor produse.A fost efectuat un studiu privind utilizarea plaselor din polipropilenă acoperite cu colagen, care include, de asemenea, ocomparație cu alte tipuri de materiale utilizate pentru reconstrucția cartilajului nazal. Mai mult, a fost efectuat un studiuretrospectiv asupra pacienților spitalizați în Departamentul de Chirurgie Plastică al Spitalului Clinic de Urgență dinBucurești.Cea mai bună opțiune și, în același timp, standardul de aur pentru reconstrucția cartilajului nazal este considerat a fi trans-plantul de cartilaj autolog. În clinica noastră am observat rezultate bune atunci când s-au utilizat grefe de cartilaj autologseptal sau auricular.Polipropilena este rar utilizată în chirurgia reconstructivă nazală, fiind efectuat, până în prezent, un număr restrâns studiiprivind beneficiile și dezavantajele acestei materii prime la fabricarea de dispozitive medicale pentru implanturi nazale.Plasele din polipropilenă sunt utilizate pe scară largă în reconstrucția peretelui abdominal și în chirurgia pentruprolapsul organelor pelvine. În acest domeniu chirurgical, se utilizează și plasele din polipropilenă acoperite cu colagen,însă studiile viitoare vor demonstra dacă acestea sunt suficient de eficiente și în chirurgia reconstructivă nazală.
Cuvinte-cheie: plase, colagen, cartilaj nazal, chirurgie reconstructivă
The use of collagen-coated polypropylene meshes for nasal reconstructive surgery
Reconstructive surgery of the abdominal and thoracic wall frequently utilizes various materials in order to repair largedefects. Polypropylene meshes are an example. In nasal reconstructive surgery they are rarely used for cartilagerestoration. The purpose of this paper is to demonstrate the utility of the collagen-coated polypropylene meshes in nasal reconstructivesurgery, as they are easy-to-use materials, with reduced incidence of foreign body reactions and with a very small pricecompared with other compounds.We conducted a literature review on the usage of the collagen-coated polypropylene meshes which also includes acomparison with other types of materials applied for nasal cartilage reconstruction. Moreover, we performed a retrospec -tive study, on the patients hospitalized in the Plastic Surgery Department of the Clinical Emergency Hospital, Bucharest. The best option and in the same time the gold standard for nasal cartilage reconstruction is considered to be autologouscartilage transplantation. In our clinic we observed good results when autologous septalor auricular cartilage grafts wereused.Polypropylene is seldom used in nasal reconstructive surgery, having been conducted so far, a limited number of studiesrelated to benefits and disadvantages of this type of material in the accomplishment of the medical devices used as a nasalimplant. Polypropylene meshes are largely used in abdominal wall reconstruction and in the surgery for pelvic organprolapse. In this surgical field, collagen-coated polypropylene meshes are also used, but future studies will demonstrate ifthey are effective enough in the nasal reconstructive surgery as well.
Keywords: nets, collagen, nasal cartilage, reconstructive surgery
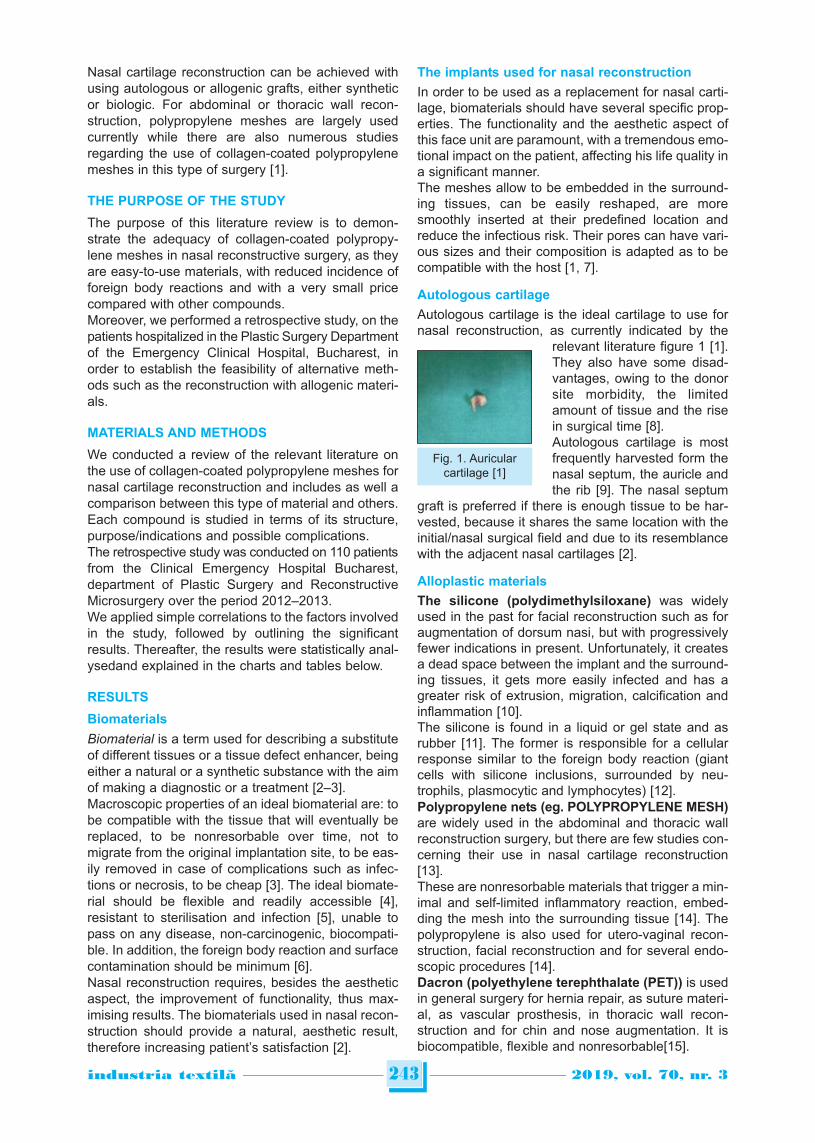
Nasal cartilage reconstruction can be achieved withusing autologous or allogenic grafts, either syntheticor biologic. For abdominal or thoracic wall recon-struction, polypropylene meshes are largely usedcurrently while there are also numerous studiesregarding the use of collagen-coated polypropylenemeshes in this type of surgery [1].
THE PURPOSE OF THE STUDY
The purpose of this literature review is to demon-strate the adequacy of collagen-coated polypropy-lene meshes in nasal reconstructive surgery, as theyare easy-to-use materials, with reduced incidence offoreign body reactions and with a very small pricecompared with other compounds.Moreover, we performed a retrospective study, on thepatients hospitalized in the Plastic Surgery Departmentof the Emergency Clinical Hospital, Bucharest, inorder to establish the feasibility of alternative meth-ods such as the reconstruction with allogenic materi-als.
MATERIALS AND METHODS
We conducted a review of the relevant literature onthe use of collagen-coated polypropylene meshes fornasal cartilage reconstruction and includes as well acomparison between this type of material and others.Each compound is studied in terms of its structure,purpose/indications and possible complications.The retrospective study was conducted on 110 patientsfrom the Clinical Emergency Hospital Bucharest,department of Plastic Surgery and ReconstructiveMicrosurgery over the period 2012–2013. We applied simple correlations to the factors involvedin the study, followed by outlining the significantresults. Thereafter, the results were statistically anal-ysedand explained in the charts and tables below.
RESULTS
Biomaterials
Biomaterial is a term used for describing a substituteof different tissues or a tissue defect enhancer, beingeither a natural or a synthetic substance with the aimof making a diagnostic or a treatment [2–3].Macroscopic properties of an ideal biomaterial are: tobe compatible with the tissue that will eventually bereplaced, to be nonresorbable over time, not tomigrate from the original implantation site, to be eas-ily removed in case of complications such as infec-tions or necrosis, to be cheap [3]. The ideal biomate-rial should be flexible and readily accessible [4],resistant to sterilisation and infection [5], unable topass on any disease, non-carcinogenic, biocompati-ble. In addition, the foreign body reaction and surfacecontamination should be minimum [6].Nasal reconstruction requires, besides the aestheticaspect, the improvement of functionality, thus max-imising results. The biomaterials used in nasal recon-struction should provide a natural, aesthetic result,therefore increasing patient’s satisfaction [2].
The implants used for nasal reconstruction
In order to be used as a replacement for nasal carti-lage, biomaterials should have several specific prop-erties. The functionality and the aesthetic aspect ofthis face unit are paramount, with a tremendous emo-tional impact on the patient, affecting his life quality ina significant manner.The meshes allow to be embedded in the surround-ing tissues, can be easily reshaped, are moresmoothly inserted at their predefined location andreduce the infectious risk. Their pores can have vari-ous sizes and their composition is adapted as to becompatible with the host [1, 7].
Autologous cartilage
Autologous cartilage is the ideal cartilage to use fornasal reconstruction, as currently indicated by the
relevant literature figure 1 [1].They also have some disad-vantages, owing to the donorsite morbidity, the limitedamount of tissue and the risein surgical time [8].Autologous cartilage is mostfrequently harvested form thenasal septum, the auricle andthe rib [9]. The nasal septum
graft is preferred if there is enough tissue to be har-vested, because it shares the same location with theinitial/nasal surgical field and due to its resemblancewith the adjacent nasal cartilages [2].
Alloplastic materials
The silicone (polydimethylsiloxane) was widelyused in the past for facial reconstruction such as foraugmentation of dorsum nasi, but with progressivelyfewer indications in present. Unfortunately, it createsa dead space between the implant and the surround-ing tissues, it gets more easily infected and has agreater risk of extrusion, migration, calcification andinflammation [10].The silicone is found in a liquid or gel state and asrubber [11]. The former is responsible for a cellularresponse similar to the foreign body reaction (giantcells with silicone inclusions, surrounded by neu-trophils, plasmocytic and lymphocytes) [12].Polypropylene nets (eg. POLYPROPYLENE MESH)are widely used in the abdominal and thoracic wallreconstruction surgery, but there are few studies con-cerning their use in nasal cartilage reconstruction[13].These are nonresorbable materials that trigger a min-imal and self-limited inflammatory reaction, embed-ding the mesh into the surrounding tissue [14]. Thepolypropylene is also used for utero-vaginal recon-struction, facial reconstruction and for several endo-scopic procedures [14].Dacron (polyethylene terephthalate (PET)) is usedin general surgery for hernia repair, as suture materi-al, as vascular prosthesis, in thoracic wall recon-struction and for chin and nose augmentation. It isbiocompatible, flexible and nonresorbable[15].
243industria textila 2019, vol. 70, nr. 3˘
Fig. 1. Auricularcartilage [1]
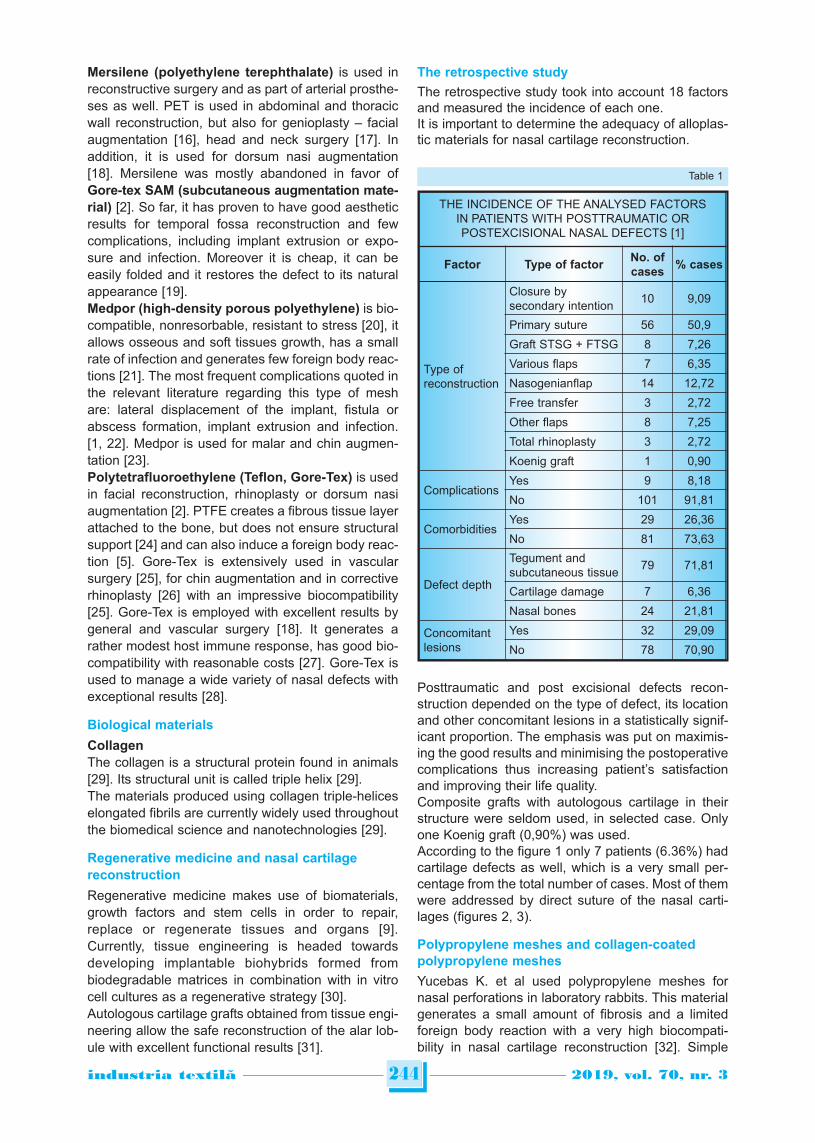
Mersilene (polyethylene terephthalate) is used inreconstructive surgery and as part of arterial prosthe-ses as well. PET is used in abdominal and thoracicwall reconstruction, but also for genioplasty – facialaugmentation [16], head and neck surgery [17]. Inaddition, it is used for dorsum nasi augmentation[18]. Mersilene was mostly abandoned in favor ofGore-tex SAM (subcutaneous augmentation mate-rial) [2]. So far, it has proven to have good aestheticresults for temporal fossa reconstruction and fewcomplications, including implant extrusion or expo-sure and infection. Moreover it is cheap, it can beeasily folded and it restores the defect to its naturalappearance [19].Medpor (high-density porous polyethylene) is bio-compatible, nonresorbable, resistant to stress [20], itallows osseous and soft tissues growth, has a smallrate of infection and generates few foreign body reac-tions [21]. The most frequent complications quoted inthe relevant literature regarding this type of meshare: lateral displacement of the implant, fistula orabscess formation, implant extrusion and infection.[1, 22]. Medpor is used for malar and chin augmen-tation [23].Polytetrafluoroethylene (Teflon, Gore-Tex) is usedin facial reconstruction, rhinoplasty or dorsum nasiaugmentation [2]. PTFE creates a fibrous tissue layerattached to the bone, but does not ensure structuralsupport [24] and can also induce a foreign body reac-tion [5]. Gore-Tex is extensively used in vascularsurgery [25], for chin augmentation and in correctiverhinoplasty [26] with an impressive biocompatibility[25]. Gore-Tex is employed with excellent results bygeneral and vascular surgery [18]. It generates arather modest host immune response, has good bio-compatibility with reasonable costs [27]. Gore-Tex isused to manage a wide variety of nasal defects withexceptional results [28].
Biological materials
CollagenThe collagen is a structural protein found in animals[29]. Its structural unit is called triple helix [29].The materials produced using collagen triple-heliceselongated fibrils are currently widely used throughoutthe biomedical science and nanotechnologies [29].
Regenerative medicine and nasal cartilagereconstruction
Regenerative medicine makes use of biomaterials,growth factors and stem cells in order to repair,replace or regenerate tissues and organs [9].Currently, tissue engineering is headed towardsdeveloping implantable biohybrids formed frombiodegradable matrices in combination with in vitrocell cultures as a regenerative strategy [30].Autologous cartilage grafts obtained from tissue engi-neering allow the safe reconstruction of the alar lob-ule with excellent functional results [31].
The retrospective study
The retrospective study took into account 18 factorsand measured the incidence of each one.It is important to determine the adequacy of alloplas-tic materials for nasal cartilage reconstruction.
Posttraumatic and post excisional defects recon-struction depended on the type of defect, its locationand other concomitant lesions in a statistically signif-icant proportion. The emphasis was put on maximis-ing the good results and minimising the postoperativecomplications thus increasing patient’s satisfactionand improving their life quality.Composite grafts with autologous cartilage in theirstructure were seldom used, in selected case. Onlyone Koenig graft (0,90%) was used. According to the figure 1 only 7 patients (6.36%) hadcartilage defects as well, which is a very small per-centage from the total number of cases. Most of themwere addressed by direct suture of the nasal carti-lages (figures 2, 3).
Polypropylene meshes and collagen-coatedpolypropylene meshes
Yucebas K. et al used polypropylene meshes fornasal perforations in laboratory rabbits. This materialgenerates a small amount of fibrosis and a limitedforeign body reaction with a very high biocompati-bility in nasal cartilage reconstruction [32]. Simple
244industria textila 2019, vol. 70, nr. 3˘
THE INCIDENCE OF THE ANALYSED FACTORSIN PATIENTS WITH POSTTRAUMATIC ORPOSTEXCISIONAL NASAL DEFECTS [1]
Factor Type of factorNo. ofcases
% cases
Type ofreconstruction
Closure by secondary intention
10 9,09
Primary suture 56 50,9
Graft STSG + FTSG 8 7,26
Various flaps 7 6,35
Nasogenianflap 14 12,72
Free transfer 3 2,72
Other flaps 8 7,25
Total rhinoplasty 3 2,72
Koenig graft 1 0,90
ComplicationsYes 9 8,18
No 101 91,81
ComorbiditiesYes 29 26,36
No 81 73,63
Defect depth
Tegument and subcutaneous tissue
79 71,81
Cartilage damage 7 6,36
Nasal bones 24 21,81
Concomitantlesions
Yes 32 29,09
No 78 70,90
Table 1
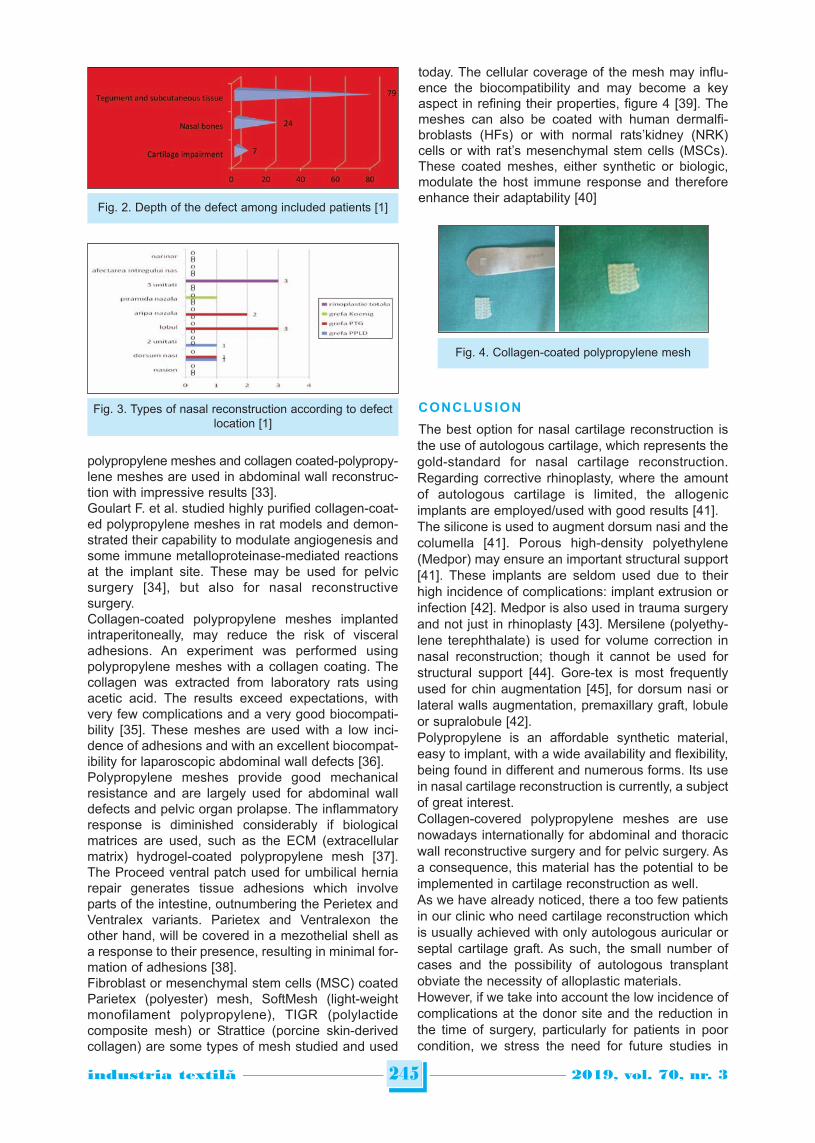
polypropylene meshes and collagen coated-polypropy-lene meshes are used in abdominal wall reconstruc-tion with impressive results [33].Goulart F. et al. studied highly purified collagen-coat-ed polypropylene meshes in rat models and demon-strated their capability to modulate angiogenesis andsome immune metalloproteinase-mediated reactionsat the implant site. These may be used for pelvicsurgery [34], but also for nasal reconstructivesurgery.Collagen-coated polypropylene meshes implantedintraperitoneally, may reduce the risk of visceraladhesions. An experiment was performed usingpolypropylene meshes with a collagen coating. Thecollagen was extracted from laboratory rats usingacetic acid. The results exceed expectations, withvery few complications and a very good biocompati-bility [35]. These meshes are used with a low inci-dence of adhesions and with an excellent biocompat-ibility for laparoscopic abdominal wall defects [36].Polypropylene meshes provide good mechanicalresistance and are largely used for abdominal walldefects and pelvic organ prolapse. The inflammatoryresponse is diminished considerably if biologicalmatrices are used, such as the ECM (extracellularmatrix) hydrogel-coated polypropylene mesh [37].The Proceed ventral patch used for umbilical herniarepair generates tissue adhesions which involveparts of the intestine, outnumbering the Perietex andVentralex variants. Parietex and Ventralexon theother hand, will be covered in a mezothelial shell asa response to their presence, resulting in minimal for-mation of adhesions [38].Fibroblast or mesenchymal stem cells (MSC) coatedParietex (polyester) mesh, SoftMesh (light-weightmonofilament polypropylene), TIGR (polylactidecomposite mesh) or Strattice (porcine skin-derivedcollagen) are some types of mesh studied and used
today. The cellular coverage of the mesh may influ-ence the biocompatibility and may become a keyaspect in refining their properties, figure 4 [39]. Themeshes can also be coated with human dermalfi-broblasts (HFs) or with normal rats’kidney (NRK)cells or with rat’s mesenchymal stem cells (MSCs).These coated meshes, either synthetic or biologic,modulate the host immune response and thereforeenhance their adaptability [40]
CONCLUSION
The best option for nasal cartilage reconstruction isthe use of autologous cartilage, which represents thegold-standard for nasal cartilage reconstruction.Regarding corrective rhinoplasty, where the amountof autologous cartilage is limited, the allogenicimplants are employed/used with good results [41].The silicone is used to augment dorsum nasi and thecolumella [41]. Porous high-density polyethylene(Medpor) may ensure an important structural support[41]. These implants are seldom used due to theirhigh incidence of complications: implant extrusion orinfection [42]. Medpor is also used in trauma surgeryand not just in rhinoplasty [43]. Mersilene (polyethy-lene terephthalate) is used for volume correction innasal reconstruction; though it cannot be used forstructural support [44]. Gore-tex is most frequentlyused for chin augmentation [45], for dorsum nasi orlateral walls augmentation, premaxillary graft, lobuleor supralobule [42].Polypropylene is an affordable synthetic material,easy to implant, with a wide availability and flexibility,being found in different and numerous forms. Its usein nasal cartilage reconstruction is currently, a subjectof great interest.Collagen-covered polypropylene meshes are usenowadays internationally for abdominal and thoracicwall reconstructive surgery and for pelvic surgery. Asa consequence, this material has the potential to beimplemented in cartilage reconstruction as well.As we have already noticed, there a too few patientsin our clinic who need cartilage reconstruction whichis usually achieved with only autologous auricular orseptal cartilage graft. As such, the small number ofcases and the possibility of autologous transplantobviate the necessity of alloplastic materials.However, if we take into account the low incidence ofcomplications at the donor site and the reduction inthe time of surgery, particularly for patients in poorcondition, we stress the need for future studies in
245industria textila 2019, vol. 70, nr. 3˘
Fig. 4. Collagen-coated polypropylene mesh
Fig. 2. Depth of the defect among included patients [1]
Fig. 3. Types of nasal reconstruction according to defectlocation [1]
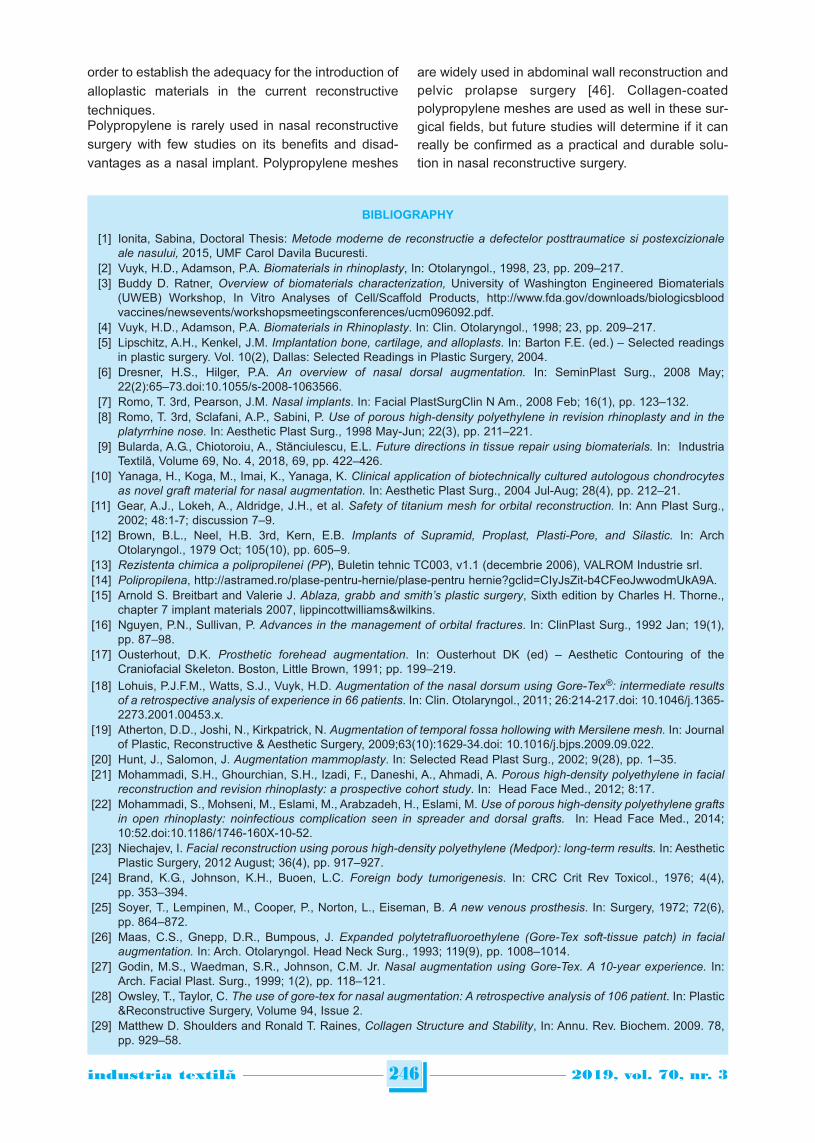
order to establish the adequacy for the introduction of
alloplastic materials in the current reconstructive
techniques.Polypropylene is rarely used in nasal reconstructivesurgery with few studies on its benefits and disad-vantages as a nasal implant. Polypropylene meshes
are widely used in abdominal wall reconstruction andpelvic prolapse surgery [46]. Collagen-coatedpolypropylene meshes are used as well in these sur-gical fields, but future studies will determine if it canreally be confirmed as a practical and durable solu-tion in nasal reconstructive surgery.
246industria textila 2019, vol. 70, nr. 3˘
BIBLIOGRAPHY
[1] Ionita, Sabina, Doctoral Thesis: Metode moderne de reconstructie a defectelor posttraumatice si postexcizionaleale nasului, 2015, UMF Carol Davila Bucuresti.
[2] Vuyk, H.D., Adamson, P.A. Biomaterials in rhinoplasty, In: Otolaryngol., 1998, 23, pp. 209–217.[3] Buddy D. Ratner, Overview of biomaterials characterization, University of Washington Engineered Biomaterials
(UWEB) Workshop, In Vitro Analyses of Cell/Scaffold Products, http://www.fda.gov/downloads/biologicsbloodvaccines/newsevents/workshopsmeetingsconferences/ucm096092.pdf.
[4] Vuyk, H.D., Adamson, P.A. Biomaterials in Rhinoplasty. In: Clin. Otolaryngol., 1998; 23, pp. 209–217.[5] Lipschitz, A.H., Kenkel, J.M. Implantation bone, cartilage, and alloplasts. In: Barton F.E. (ed.) – Selected readings
in plastic surgery. Vol. 10(2), Dallas: Selected Readings in Plastic Surgery, 2004.[6] Dresner, H.S., Hilger, P.A. An overview of nasal dorsal augmentation. In: SeminPlast Surg., 2008 May;
22(2):65–73.doi:10.1055/s-2008-1063566.[7] Romo, T. 3rd, Pearson, J.M. Nasal implants. In: Facial PlastSurgClin N Am., 2008 Feb; 16(1), pp. 123–132.[8] Romo, T. 3rd, Sclafani, A.P., Sabini, P. Use of porous high-density polyethylene in revision rhinoplasty and in the
platyrrhine nose. In: Aesthetic Plast Surg., 1998 May-Jun; 22(3), pp. 211–221.[9] Bularda, A.G., Chiotoroiu, A., Stănciulescu, E.L. Future directions in tissue repair using biomaterials. In: Industria
Textilă, Volume 69, No. 4, 2018, 69, pp. 422–426.[10] Yanaga, H., Koga, M., Imai, K., Yanaga, K. Clinical application of biotechnically cultured autologous chondrocytes
as novel graft material for nasal augmentation. In: Aesthetic Plast Surg., 2004 Jul-Aug; 28(4), pp. 212–21.[11] Gear, A.J., Lokeh, A., Aldridge, J.H., et al. Safety of titanium mesh for orbital reconstruction. In: Ann Plast Surg.,
2002; 48:1-7; discussion 7–9.[12] Brown, B.L., Neel, H.B. 3rd, Kern, E.B. Implants of Supramid, Proplast, Plasti-Pore, and Silastic. In: Arch
Otolaryngol., 1979 Oct; 105(10), pp. 605–9.[13] Rezistenta chimica a polipropilenei (PP), Buletin tehnic TC003, v1.1 (decembrie 2006), VALROM Industrie srl.[14] Polipropilena, http://astramed.ro/plase-pentru-hernie/plase-pentru hernie?gclid=CIyJsZit-b4CFeoJwwodmUkA9A.[15] Arnold S. Breitbart and Valerie J. Ablaza, grabb and smith’s plastic surgery, Sixth edition by Charles H. Thorne.,
chapter 7 implant materials 2007, lippincottwilliams&wilkins.[16] Nguyen, P.N., Sullivan, P. Advances in the management of orbital fractures. In: ClinPlast Surg., 1992 Jan; 19(1),
pp. 87–98.[17] Ousterhout, D.K. Prosthetic forehead augmentation. In: Ousterhout DK (ed) – Aesthetic Contouring of the
Craniofacial Skeleton. Boston, Little Brown, 1991; pp. 199–219.[18] Lohuis, P.J.F.M., Watts, S.J., Vuyk, H.D. Augmentation of the nasal dorsum using Gore-Tex®: intermediate results
of a retrospective analysis of experience in 66 patients. In: Clin. Otolaryngol., 2011; 26:214-217.doi: 10.1046/j.1365-2273.2001.00453.x.
[19] Atherton, D.D., Joshi, N., Kirkpatrick, N. Augmentation of temporal fossa hollowing with Mersilene mesh. In: Journalof Plastic, Reconstructive & Aesthetic Surgery, 2009;63(10):1629-34.doi: 10.1016/j.bjps.2009.09.022.
[20] Hunt, J., Salomon, J. Augmentation mammoplasty. In: Selected Read Plast Surg., 2002; 9(28), pp. 1–35.[21] Mohammadi, S.H., Ghourchian, S.H., Izadi, F., Daneshi, A., Ahmadi, A. Porous high-density polyethylene in facial
reconstruction and revision rhinoplasty: a prospective cohort study. In: Head Face Med., 2012; 8:17.[22] Mohammadi, S., Mohseni, M., Eslami, M., Arabzadeh, H., Eslami, M. Use of porous high-density polyethylene grafts
in open rhinoplasty: noinfectious complication seen in spreader and dorsal grafts. In: Head Face Med., 2014;10:52.doi:10.1186/1746-160X-10-52.
[23] Niechajev, I. Facial reconstruction using porous high-density polyethylene (Medpor): long-term results. In: AestheticPlastic Surgery, 2012 August; 36(4), pp. 917–927.
[24] Brand, K.G., Johnson, K.H., Buoen, L.C. Foreign body tumorigenesis. In: CRC Crit Rev Toxicol., 1976; 4(4),pp. 353–394.
[25] Soyer, T., Lempinen, M., Cooper, P., Norton, L., Eiseman, B. A new venous prosthesis. In: Surgery, 1972; 72(6),pp. 864–872.
[26] Maas, C.S., Gnepp, D.R., Bumpous, J. Expanded polytetrafluoroethylene (Gore-Tex soft-tissue patch) in facialaugmentation. In: Arch. Otolaryngol. Head Neck Surg., 1993; 119(9), pp. 1008–1014.
[27] Godin, M.S., Waedman, S.R., Johnson, C.M. Jr. Nasal augmentation using Gore-Tex. A 10-year experience. In:Arch. Facial Plast. Surg., 1999; 1(2), pp. 118–121.
[28] Owsley, T., Taylor, C. The use of gore-tex for nasal augmentation: A retrospective analysis of 106 patient. In: Plastic&Reconstructive Surgery, Volume 94, Issue 2.
[29] Matthew D. Shoulders and Ronald T. Raines, Collagen Structure and Stability, In: Annu. Rev. Biochem. 2009. 78,pp. 929–58.
247industria textila 2019, vol. 70, nr. 3˘
Authors:
MIHAI-ALEXANDRU PĂUN1, ADRIAN FRUNZĂ2, ELENA-LUMINIȚA STĂNCIULESCU2, TIBERIU-CIPRIAN MUNTEANU2, IOAN CRISTESCU2, SABINA GRAMA2,
ALEXANDRU CHIOTOROIU2, ALEXANDRA ENE3, CARMEN MIHAI3
1Clinical Emergency Hospital “Agrippa Ionescu”2Clinical Emergency Hospital Bucharest
3The Research and Development Institute for Textile and Leather
*All the authors equally contributed to this work
Corresponding author:
ADRIAN FRUNZĂ
e-mail: [email protected]
[30] Dinescu, S., Galateanu, B., Albu, M., Lungu, A., Radu, E., Hermenean, A. and Costache, M. Biocompatibilityassessment of novel collagen-sericin scaffolds improved with hyaluronic acid and chondroitin sulfate for cartilageregeneration, Hindawi Publishing Corporation. In: BioMed Research International, Volume 2013, Article ID 598056,11 pages.
[31] Fulco, I., Miot, S., Haug, M.D. The Lancet Engineered autologous cartilage tissue for nasal reconstruction aftertumour resection: an observational first-in-human trial. In: Early Online Publication, 11 April 2014, Elsevier Ltd.
[32] Yücebaş, K., Taskin, U., Oktay, M.F., at al. The results of polypropylene mesh usage for nasal septal perforationrepair: An experimental study. Available at: http://www.researchposters.com/Posters/AAOHNSF/AAO2014/SP493.pdf.
[33] Pierce, L.M., Asarias, J.R., Nguyen, P.T., Mings, J.R., Gehrich, A.P. Inflammatory cytokine and matrixmetalloproteinase expression induced by collagen-coated and uncoated polypropylene meshes in a rat model. In:Am J Obstet Gynecol., 2011; 205(1):82.e1-9. doi: 10.1016/j.ajog.2011.02.045. Epub 2011 Feb 23.
[34] Dias, F.G.F., Prudente, A., Siniscalchi, R.T., Campos de Vidal, B., Zanettini Riccetto, C.L. Can highly purifiedcollagen coating modulate polypropylene mesh immune-inflammatory and fibroblastic reactions?Immunohistochemical analysis in a rat model. In: IntUrogynecol J., October 2014.doi:10.1007/s00192-014-2529-0.
[35] Lukasiewicz, A., Skopinska-Wisniewska, J., Marszalek, A., Molski, S., Drewa, T. Collagen/Polypropylene compositemesh biocompatibility in abdominal wall reconstruction. In: PlastReconstr Surg., 2013 May;131(5):731e-40e.doi:10.1097/PRS.0b013e3182865d2c.
[36] van’t Riet, M., Burger, J.W., Bonthuis, F., Jeekel, J., Bonjer, H.J. Prevention of adhesion formation to polypropylenemesh by collagen coating: a randomized controlled study in a rat model of ventral hernia repair. In: SurgEndosc.,2004; 18(4):681-685. Epub 2004 Mar 19.
[37] Faulk, D.M., Londono, R., Wolf, M.T., Ranallo, C.A., Carruthers, C.A., Wilemann, J.D., Dearth, C.L., Badylak, S.F.ECM hydrogel coating mitigates the chronic inflammatory response to polypropylene mesh. In: Biomaterials,2014;35(30):8585-8595.doi:10.1016/j.biomaterials.2014.06.057. Epub 2014 Jul 16.
[38] Dias, F., Dos Santos, A. MP4-16 Can highly purified collagen coating modulate polypropylene mesh immune-inflammatory and fibroblastic reactions? Immunohistochemical analysis in rat model. In: The Journal of Urology,2014; 191(4) Suppl:e49.doi:10.1016/j.juro.2014.02.216.
[39] Gao, Y., Krpata, D.M., Criss, C.N., Liu, L., Posielski, N., Rosen, M.J., Novitsky, Y.W. Effects of mesenchymal stemcell and fibroblast coating on immunogenic potential of prosthetic meshes in vitro. In: Surgical Endoscopy, 2014;28(8), pp. 2357–2367.
[40] Gao, Y., Liu, L., Blatnik, J.A., Krpata, D.M., Anderson, J.M., Criss, C.N., Posielski, N., Novitsky, Y.W. Methodologyof fibroblast and mesenchymal stem cell coating of surgical meshes: A pilot analysis. In: J Biomed Mater Res PartB, 2014; 102B:797-805.
[41] Rodriguez, S. Alloplastic materials and homografts in nasal reconstruction. April 2005. Available at:http://www.utmb.edu/otoref/grnds/Nasal-Recon-050420/Nasal-Recon-050420.pdf.
[42] Winkler, A.A., Soler, Z.M., Leong, P.L., Murphy, A., Wang, T.D., Cook, T.A. Complications associated with alloplasticimplants in rhinoplasty. In: Arch Facial Plast Surg., 2012;14(6):437-441.doi:10.1001/archfacial.2012.583.
[43] Berghaus, A. Implants for reconstructive surgery of the nose and ears. In: GMS Curr Top Otorhinolaryngol HeadNeck Surg., 2007; 6:Doc06.
[44] Rai, A., Datarkar, A., Arora, A., Adwani, D.G. Utility of high density porous polyethylene implants in maxillofacialsurgery. In: Journal of Maxillofacial and Oral Surgery, 2014; 13(1), pp. 42–46.
[45] Kim, B.J., Lim, J.W., Park, J.H., Lee, Y.H. Dual plane augmentation geniopasty using Gore-Tex chin implants. In:Arch Craniofac Surg., 2014 Aug; 15(2), pp. 82–88.
[46] GiarenisI., Robinson D. Prevention and management of pelvic organ prolapse. In: F1000 Prime Rep., 2014; 6, p. 77.
INTRODUCTION
CIE, International Commission on Illumination,defined the CIELAB colour space in 1976 which wasindented to be a visually uniform one. The space wascharacterized by three axes that represented thethree colour coordinates which were lightness (L*),red-green (a*) and yellow-blue (b*) together with twosupplementary colour related terms of chroma (C*)and hue angle (h°). After the calculation of the threetristimulus values (X, Y, and Z) under specified illumi-nation and viewing conditions, they are used as thecomputing components in the calculation of colourcoordinates to designate the place of the colour inCIELAB colour space. Together with the definition ofCIELAB colour space, CIELAB (1976) colour differ-ence formula was developed to calculate the colourdifference between two colours in the space.
However, CIELAB colour space is not truly visuallyuniform which means that equal colour differencemagnitude appear of different visual magnitudes indifferent regions of the colour space.When the difference between two colours are calcu-lated by CIELAB colour difference formula, the for-mula calculates the linear (Euclidean) distancebetween the two points in the CIELAB colour spaceby using the three colour coordinates of L*, a* and b*.Because of the non-uniformity of the CIELAB colourspace and the setup of CIELAB (1976) formula, thecolour difference obtained is free from human eyesensitivity. Human eye is sensitive to different kindsof changes in the shade(s) under observation.Human visual system perceives the differences in dif-ferent magnitudes even though they may have thesame colour difference calculated by CIELAB (1976)
Dependence of colour difference formulae on regular changes of colourcoordinates in CIELAB colour space
DOI: 10.35530/IT.070.03.1525
ONUR UGUR CINKO BEHCET BECERIR
REZUMAT – ABSTRACT
Dependența formulelor de diferență a culorii asupra modificărilor coordonatelor de culoare în spațiul de culoareCIELAB
În spațiul de culoare CIELAB au fost evaluate patru formule de diferențe de culoare [CIELAB (1976), CMC (2: 1), CIE94(2: 1: 1) și CIEDE2000 (2: 1: 1)] pentru modificările coordonatelor de culoare. Coordonatele L*, a* și b* au fost modificateatât ca etape de creștere, cât și de descreștere în diferite regiuni de luminozitate și nuanță ale spațiului de culoare.Dependența și consistența celor patru formule au fost cercetate în funcție de modificări și constante ale coordonatelor deculoare. Scopul studiului empiric a fost de a determina dacă ar putea exista o posibilitate de a utiliza diferite formule dediferențe de culoare în diferite zone de nuanță ale spațiului de culoare CIELAB; în regiunea în vrac, fiecare formulă ar dacele mai bune rezultate și cele mai fiabile rezultate. Studiul empiric a fost realizat folosind un software special care a fostpregătit pentru acest scop. Rezultatele au arătat că CIELAB și CIE94 au dat rezultate corespunzătoare între ele înintervalele de calcul. Toate formulele au prezentat diferite caracteristici de calcul în intervalele de calcul. Formula CMC adat cele mai mari diferențe de culoare atunci când a fost calculată lângă punctul gri. S-a concluzionat că formulaCIEDE2000 se potrivește cel mai bine cu modificările din etapele de calcul. Un software mai complex ar fi necesar pentrua determina sensibilitatea formulelor prin care se poate efectua calculul prin modificarea tuturor coordonatelor (L*, a* șib*) în același timp.
Cuvinte-cheie: CIE, formula de diferență de culoare; CIELAB; CMC; CIEDE2000; CIE94
Dependence of colour difference formulae on regular changes of colour coordinates in CIELAB colour space
Four colour difference formulae [CIELAB (1976), CMC (2:1), CIE94 (2:1:1) and CIEDE2000 (2:1:1)] were assessed inCIELAB colour space for regular changes in colour coordinates. L*, a* and b* coordinates were changed regularly both asincreasing and decreasing steps in different lightness and hue regions of the colour space. The dependence andconsistency of the four formulae were researched depending on regular and constant colour coordinate changes. The aimof the empirical study was to determine if there could be a possibility of using different colour difference formulae indifferent hue regions of CIELAB colour space; in the region of bulk that each formula would give the best fitting and themost reliable results. The empirical study was carried out by using a special software which was prepared for the purpose.The results showed that CIELAB and CIE94 gave corresponding results with each other in the computing ranges. All theformulae showed different computing characteristics in the computation ranges. CMC formula gave the highest colourdifferences when computing near the grey point. It was concluded that CIEDE2000 formula suited itself the best accordingto the changes in computing steps. A more complicated software would be necessary to determine the sensitivity of theformulae by which the computing would be performed by changing all the coordinates (L*, a* and b*) at the same time.
Keywords: CIE, colour difference formula; CIELAB; CMC; CIEDE2000; CIE94
248industria textila 2019, vol. 70, nr. 3˘
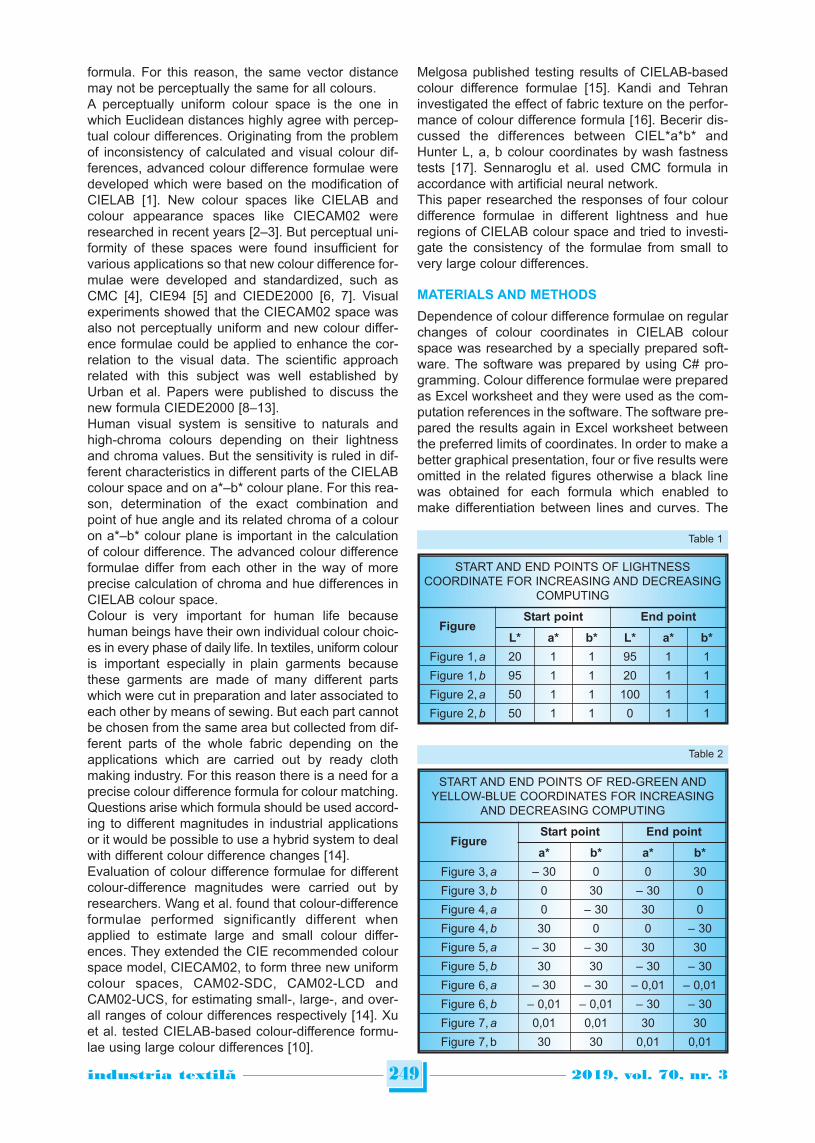
formula. For this reason, the same vector distancemay not be perceptually the same for all colours.A perceptually uniform colour space is the one inwhich Euclidean distances highly agree with percep-tual colour differences. Originating from the problemof inconsistency of calculated and visual colour dif-ferences, advanced colour difference formulae weredeveloped which were based on the modification ofCIELAB [1]. New colour spaces like CIELAB andcolour appearance spaces like CIECAM02 wereresearched in recent years [2–3]. But perceptual uni-formity of these spaces were found insufficient forvarious applications so that new colour difference for-mulae were developed and standardized, such asCMC [4], CIE94 [5] and CIEDE2000 [6, 7]. Visualexperiments showed that the CIECAM02 space wasalso not perceptually uniform and new colour differ-ence formulae could be applied to enhance the cor-relation to the visual data. The scientific approachrelated with this subject was well established byUrban et al. Papers were published to discuss thenew formula CIEDE2000 [8–13].Human visual system is sensitive to naturals andhigh-chroma colours depending on their lightnessand chroma values. But the sensitivity is ruled in dif-ferent characteristics in different parts of the CIELABcolour space and on a*–b* colour plane. For this rea-son, determination of the exact combination andpoint of hue angle and its related chroma of a colouron a*–b* colour plane is important in the calculationof colour difference. The advanced colour differenceformulae differ from each other in the way of moreprecise calculation of chroma and hue differences inCIELAB colour space.Colour is very important for human life becausehuman beings have their own individual colour choic-es in every phase of daily life. In textiles, uniform colouris important especially in plain garments becausethese garments are made of many different partswhich were cut in preparation and later associated toeach other by means of sewing. But each part cannotbe chosen from the same area but collected from dif-ferent parts of the whole fabric depending on theapplications which are carried out by ready clothmaking industry. For this reason there is a need for aprecise colour difference formula for colour matching.Questions arise which formula should be used accord-ing to different magnitudes in industrial applicationsor it would be possible to use a hybrid system to dealwith different colour difference changes [14].Evaluation of colour difference formulae for differentcolour-difference magnitudes were carried out byresearchers. Wang et al. found that colour-differenceformulae performed significantly different whenapplied to estimate large and small colour differ-ences. They extended the CIE recommended colourspace model, CIECAM02, to form three new uniformcolour spaces, CAM02-SDC, CAM02-LCD andCAM02-UCS, for estimating small-, large-, and over-all ranges of colour differences respectively [14]. Xuet al. tested CIELAB-based colour-difference formu-lae using large colour differences [10].
Melgosa published testing results of CIELAB-basedcolour difference formulae [15]. Kandi and Tehraninvestigated the effect of fabric texture on the perfor-mance of colour difference formula [16]. Becerir dis-cussed the differences between CIEL*a*b* andHunter L, a, b colour coordinates by wash fastnesstests [17]. Sennaroglu et al. used CMC formula inaccordance with artificial neural network.This paper researched the responses of four colourdifference formulae in different lightness and hueregions of CIELAB colour space and tried to investi-gate the consistency of the formulae from small tovery large colour differences.
MATERIALS AND METHODS
Dependence of colour difference formulae on regularchanges of colour coordinates in CIELAB colourspace was researched by a specially prepared soft-ware. The software was prepared by using C# pro-gramming. Colour difference formulae were preparedas Excel worksheet and they were used as the com-putation references in the software. The software pre-pared the results again in Excel worksheet betweenthe preferred limits of coordinates. In order to make abetter graphical presentation, four or five results wereomitted in the related figures otherwise a black linewas obtained for each formula which enabled tomake differentiation between lines and curves. The
249industria textila 2019, vol. 70, nr. 3˘
START AND END POINTS OF RED-GREEN ANDYELLOW-BLUE COORDINATES FOR INCREASING
AND DECREASING COMPUTING
FigureStart point End point
a* b* a* b*
Figure 3, a – 30 0 0 30
Figure 3, b 0 30 – 30 0
Figure 4, a 0 – 30 30 0
Figure 4, b 30 0 0 – 30
Figure 5, a – 30 – 30 30 30
Figure 5, b 30 30 – 30 – 30
Figure 6, a – 30 – 30 – 0,01 – 0,01
Figure 6, b – 0,01 – 0,01 – 30 – 30
Figure 7, a 0,01 0,01 30 30
Figure 7, b 30 30 0,01 0,01
Table 2
START AND END POINTS OF LIGHTNESSCOORDINATE FOR INCREASING AND DECREASING
COMPUTING
FigureStart point End point
L* a* b* L* a* b*
Figure 1, a 20 1 1 95 1 1
Figure 1, b 95 1 1 20 1 1
Figure 2, a 50 1 1 100 1 1
Figure 2, b 50 1 1 0 1 1
Table 1
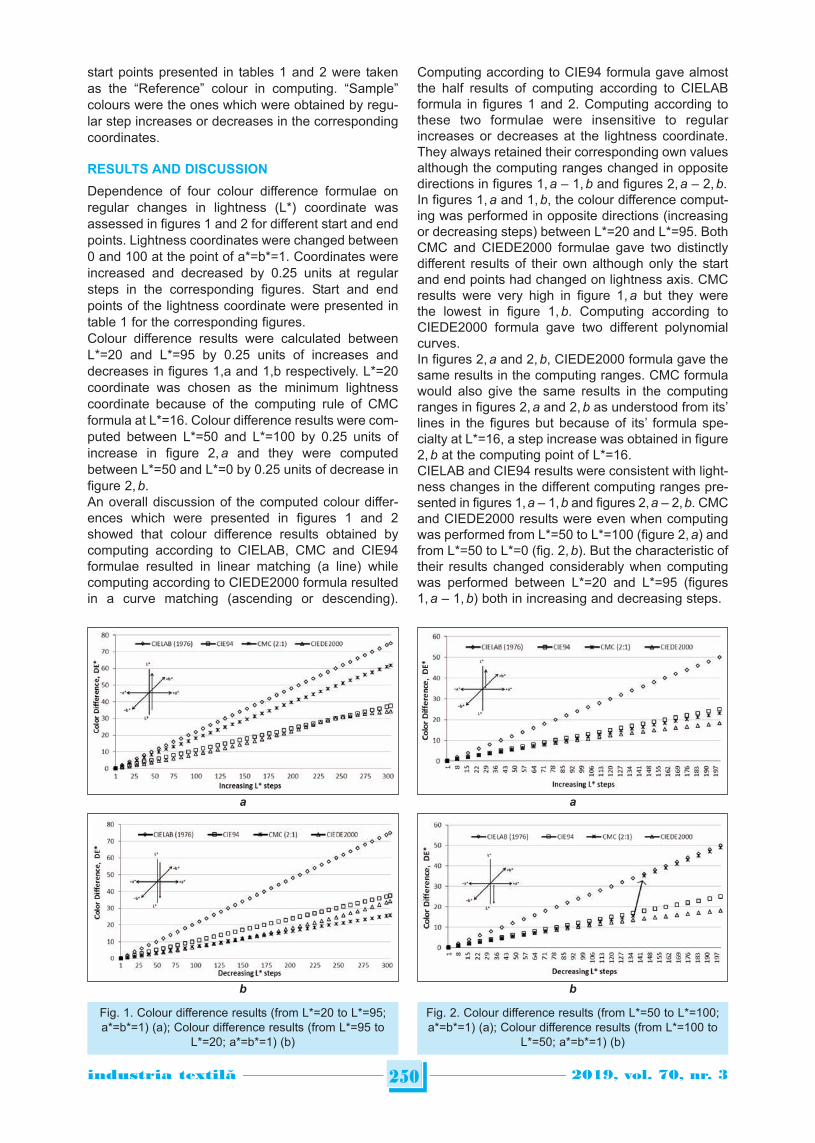
start points presented in tables 1 and 2 were takenas the “Reference” colour in computing. “Sample”colours were the ones which were obtained by regu-lar step increases or decreases in the correspondingcoordinates.
RESULTS AND DISCUSSION
Dependence of four colour difference formulae onregular changes in lightness (L*) coordinate wasassessed in figures 1 and 2 for different start and endpoints. Lightness coordinates were changed between0 and 100 at the point of a*=b*=1. Coordinates wereincreased and decreased by 0.25 units at regularsteps in the corresponding figures. Start and endpoints of the lightness coordinate were presented intable 1 for the corresponding figures.Colour difference results were calculated betweenL*=20 and L*=95 by 0.25 units of increases anddecreases in figures 1,a and 1,b respectively. L*=20coordinate was chosen as the minimum lightnesscoordinate because of the computing rule of CMCformula at L*=16. Colour difference results were com-puted between L*=50 and L*=100 by 0.25 units ofincrease in figure 2, a and they were computedbetween L*=50 and L*=0 by 0.25 units of decrease infigure 2, b.An overall discussion of the computed colour differ-ences which were presented in figures 1 and 2showed that colour difference results obtained bycomputing according to CIELAB, CMC and CIE94formulae resulted in linear matching (a line) whilecomputing according to CIEDE2000 formula resultedin a curve matching (ascending or descending).
Computing according to CIE94 formula gave almostthe half results of computing according to CIELABformula in figures 1 and 2. Computing according tothese two formulae were insensitive to regularincreases or decreases at the lightness coordinate.They always retained their corresponding own valuesalthough the computing ranges changed in oppositedirections in figures 1, a – 1, b and figures 2, a – 2, b.In figures 1, a and 1, b, the colour difference comput-ing was performed in opposite directions (increasingor decreasing steps) between L*=20 and L*=95. BothCMC and CIEDE2000 formulae gave two distinctlydifferent results of their own although only the startand end points had changed on lightness axis. CMCresults were very high in figure 1, a but they werethe lowest in figure 1, b. Computing according toCIEDE2000 formula gave two different polynomialcurves.In figures 2, a and 2, b, CIEDE2000 formula gave thesame results in the computing ranges. CMC formulawould also give the same results in the computingranges in figures 2, a and 2, b as understood from its’lines in the figures but because of its’ formula spe-cialty at L*=16, a step increase was obtained in figure2, b at the computing point of L*=16.CIELAB and CIE94 results were consistent with light-ness changes in the different computing ranges pre-sented in figures 1, a – 1, b and figures 2, a – 2, b. CMCand CIEDE2000 results were even when computingwas performed from L*=50 to L*=100 (figure 2, a) andfrom L*=50 to L*=0 (fig. 2, b). But the characteristic oftheir results changed considerably when computingwas performed between L*=20 and L*=95 (figures1, a – 1, b) both in increasing and decreasing steps.
250industria textila 2019, vol. 70, nr. 3˘
a
b
Fig. 1. Colour difference results (from L*=20 to L*=95;a*=b*=1) (a); Colour difference results (from L*=95 to
L*=20; a*=b*=1) (b)
a
b
Fig. 2. Colour difference results (from L*=50 to L*=100;a*=b*=1) (a); Colour difference results (from L*=100 to
L*=50; a*=b*=1) (b)
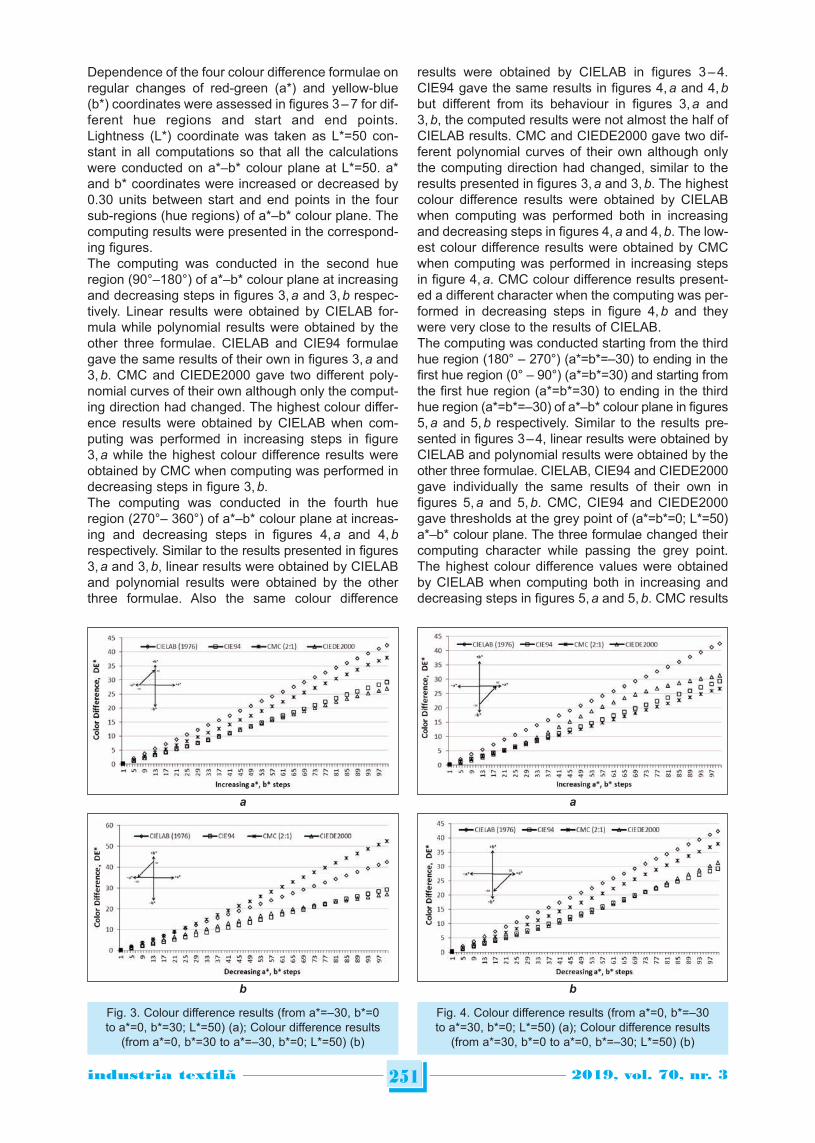
Dependence of the four colour difference formulae onregular changes of red-green (a*) and yellow-blue(b*) coordinates were assessed in figures 3 – 7 for dif-ferent hue regions and start and end points.Lightness (L*) coordinate was taken as L*=50 con-stant in all computations so that all the calculationswere conducted on a*–b* colour plane at L*=50. a*and b* coordinates were increased or decreased by0.30 units between start and end points in the foursub-regions (hue regions) of a*–b* colour plane. Thecomputing results were presented in the correspond-ing figures.The computing was conducted in the second hueregion (90°–180°) of a*–b* colour plane at increasingand decreasing steps in figures 3, a and 3, b respec-tively. Linear results were obtained by CIELAB for-mula while polynomial results were obtained by theother three formulae. CIELAB and CIE94 formulaegave the same results of their own in figures 3, a and3, b. CMC and CIEDE2000 gave two different poly-nomial curves of their own although only the comput-ing direction had changed. The highest colour differ-ence results were obtained by CIELAB when com-puting was performed in increasing steps in figure3, a while the highest colour difference results wereobtained by CMC when computing was performed indecreasing steps in figure 3, b.The computing was conducted in the fourth hueregion (270°– 360°) of a*–b* colour plane at increas-ing and decreasing steps in figures 4, a and 4, brespectively. Similar to the results presented in figures3, a and 3, b, linear results were obtained by CIELABand polynomial results were obtained by the otherthree formulae. Also the same colour difference
results were obtained by CIELAB in figures 3 – 4.CIE94 gave the same results in figures 4, a and 4, bbut different from its behaviour in figures 3, a and3, b, the computed results were not almost the half ofCIELAB results. CMC and CIEDE2000 gave two dif-ferent polynomial curves of their own although onlythe computing direction had changed, similar to theresults presented in figures 3, a and 3, b. The highestcolour difference results were obtained by CIELABwhen computing was performed both in increasingand decreasing steps in figures 4, a and 4, b. The low-est colour difference results were obtained by CMCwhen computing was performed in increasing stepsin figure 4, a. CMC colour difference results present-ed a different character when the computing was per-formed in decreasing steps in figure 4, b and theywere very close to the results of CIELAB.The computing was conducted starting from the thirdhue region (180° – 270°) (a*=b*=–30) to ending in thefirst hue region (0° – 90°) (a*=b*=30) and starting fromthe first hue region (a*=b*=30) to ending in the thirdhue region (a*=b*=–30) of a*–b* colour plane in figures5, a and 5, b respectively. Similar to the results pre-sented in figures 3 – 4, linear results were obtained byCIELAB and polynomial results were obtained by theother three formulae. CIELAB, CIE94 and CIEDE2000gave individually the same results of their own infigures 5, a and 5, b. CMC, CIE94 and CIEDE2000gave thresholds at the grey point of (a*=b*=0; L*=50)a*–b* colour plane. The three formulae changed theircomputing character while passing the grey point.The highest colour difference values were obtainedby CIELAB when computing both in increasing anddecreasing steps in figures 5, a and 5, b. CMC results
251industria textila 2019, vol. 70, nr. 3˘
a
b
Fig. 3. Colour difference results (from a*=–30, b*=0to a*=0, b*=30; L*=50) (a); Colour difference results
(from a*=0, b*=30 to a*=–30, b*=0; L*=50) (b)
a
b
Fig. 4. Colour difference results (from a*=0, b*=–30to a*=30, b*=0; L*=50) (a); Colour difference results
(from a*=30, b*=0 to a*=0, b*=–30; L*=50) (b)
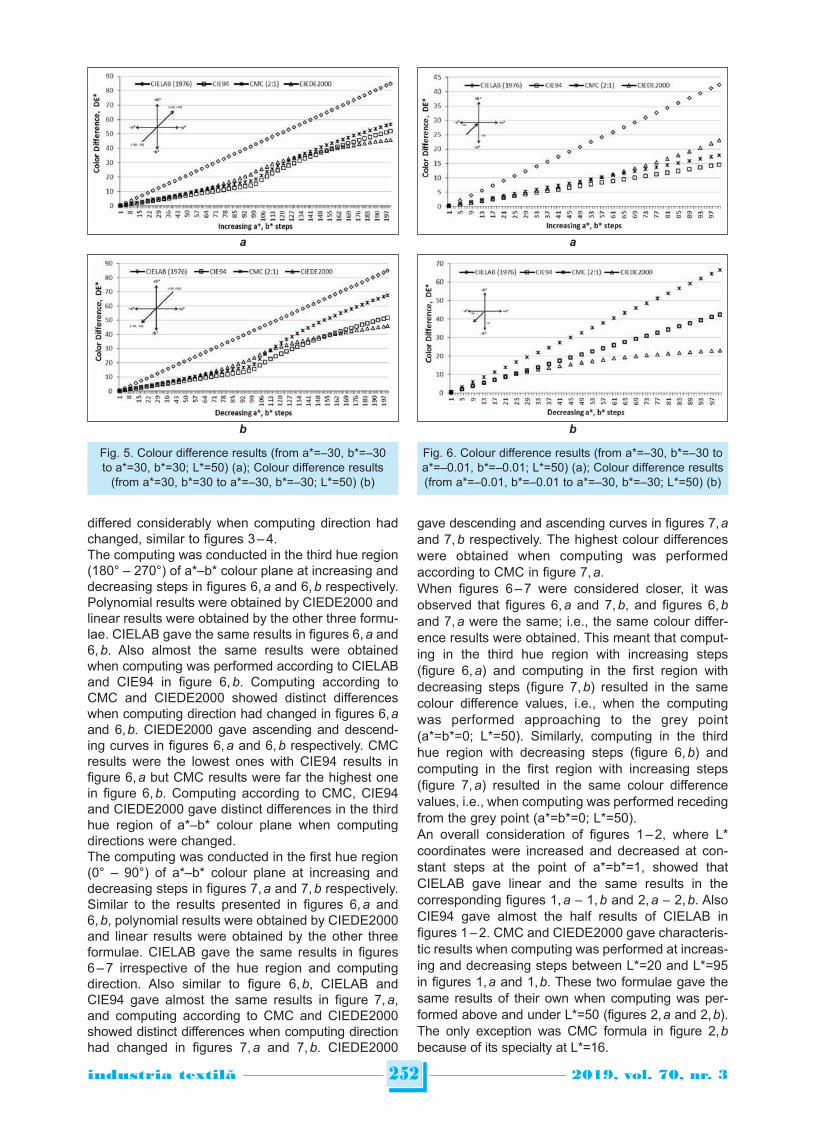
differed considerably when computing direction hadchanged, similar to figures 3 – 4.The computing was conducted in the third hue region(180° – 270°) of a*–b* colour plane at increasing anddecreasing steps in figures 6, a and 6, b respectively.Polynomial results were obtained by CIEDE2000 andlinear results were obtained by the other three formu-lae. CIELAB gave the same results in figures 6, a and6, b. Also almost the same results were obtainedwhen computing was performed according to CIELABand CIE94 in figure 6, b. Computing according toCMC and CIEDE2000 showed distinct differenceswhen computing direction had changed in figures 6, aand 6, b. CIEDE2000 gave ascending and descend-ing curves in figures 6, a and 6, b respectively. CMCresults were the lowest ones with CIE94 results infigure 6, a but CMC results were far the highest onein figure 6, b. Computing according to CMC, CIE94and CIEDE2000 gave distinct differences in the thirdhue region of a*–b* colour plane when computingdirections were changed.The computing was conducted in the first hue region(0° – 90°) of a*–b* colour plane at increasing anddecreasing steps in figures 7, a and 7, b respectively.Similar to the results presented in figures 6, a and6, b, polynomial results were obtained by CIEDE2000and linear results were obtained by the other threeformulae. CIELAB gave the same results in figures6 – 7 irrespective of the hue region and computingdirection. Also similar to figure 6, b, CIELAB andCIE94 gave almost the same results in figure 7, a,and computing according to CMC and CIEDE2000showed distinct differences when computing directionhad changed in figures 7, a and 7, b. CIEDE2000
gave descending and ascending curves in figures 7, aand 7, b respectively. The highest colour differenceswere obtained when computing was performedaccording to CMC in figure 7, a.When figures 6 – 7 were considered closer, it wasobserved that figures 6, a and 7, b, and figures 6, band 7, a were the same; i.e., the same colour differ-ence results were obtained. This meant that comput-ing in the third hue region with increasing steps(figure 6, a) and computing in the first region withdecreasing steps (figure 7, b) resulted in the samecolour difference values, i.e., when the computingwas performed approaching to the grey point(a*=b*=0; L*=50). Similarly, computing in the thirdhue region with decreasing steps (figure 6, b) andcomputing in the first region with increasing steps(figure 7, a) resulted in the same colour differencevalues, i.e., when computing was performed recedingfrom the grey point (a*=b*=0; L*=50).An overall consideration of figures 1 – 2, where L*coordinates were increased and decreased at con-stant steps at the point of a*=b*=1, showed thatCIELAB gave linear and the same results in thecorresponding figures 1, a – 1, b and 2, a – 2, b. AlsoCIE94 gave almost the half results of CIELAB infigures 1 – 2. CMC and CIEDE2000 gave characteris-tic results when computing was performed at increas-ing and decreasing steps between L*=20 and L*=95in figures 1, a and 1, b. These two formulae gave thesame results of their own when computing was per-formed above and under L*=50 (figures 2, a and 2, b).The only exception was CMC formula in figure 2, bbecause of its specialty at L*=16.
252industria textila 2019, vol. 70, nr. 3˘
a
b
Fig. 5. Colour difference results (from a*=–30, b*=–30to a*=30, b*=30; L*=50) (a); Colour difference results
(from a*=30, b*=30 to a*=–30, b*=–30; L*=50) (b)
a
b
Fig. 6. Colour difference results (from a*=–30, b*=–30 toa*=–0.01, b*=–0.01; L*=50) (a); Colour difference results(from a*=–0.01, b*=–0.01 to a*=–30, b*=–30; L*=50) (b)
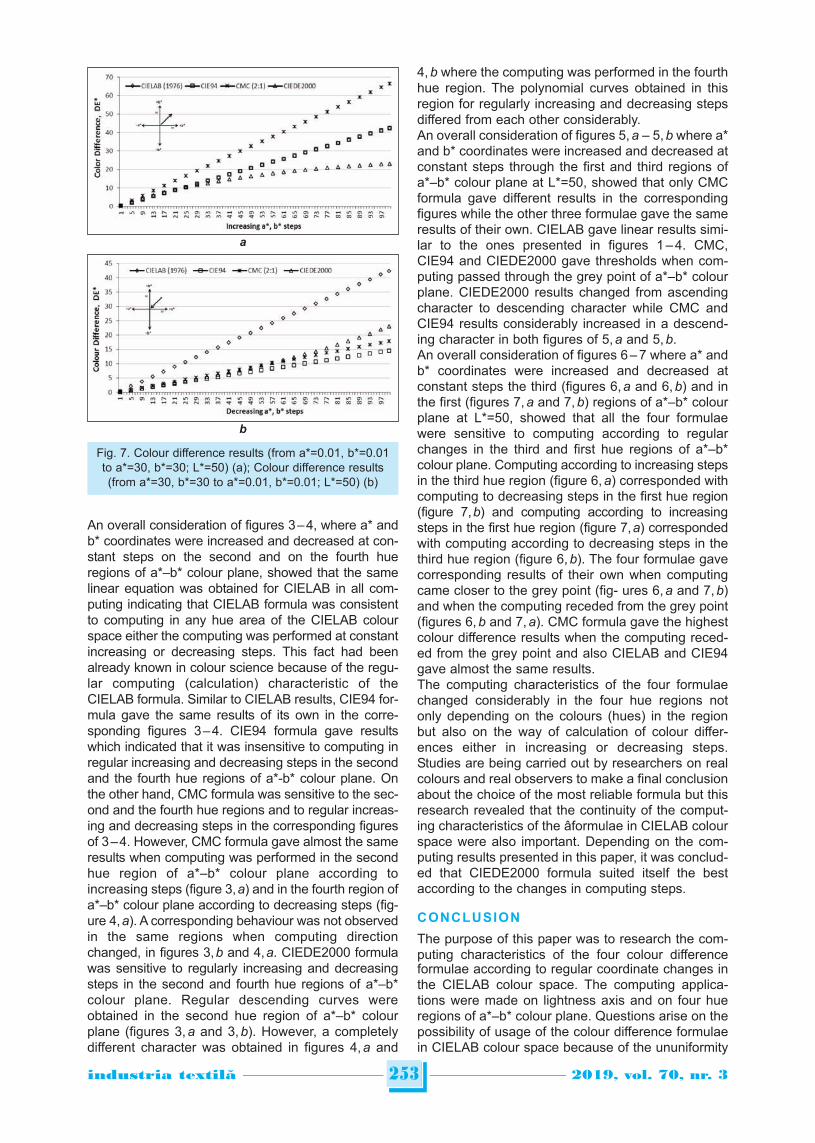
An overall consideration of figures 3 – 4, where a* andb* coordinates were increased and decreased at con-stant steps on the second and on the fourth hueregions of a*–b* colour plane, showed that the samelinear equation was obtained for CIELAB in all com-puting indicating that CIELAB formula was consistentto computing in any hue area of the CIELAB colourspace either the computing was performed at constantincreasing or decreasing steps. This fact had beenalready known in colour science because of the regu-lar computing (calculation) characteristic of theCIELAB formula. Similar to CIELAB results, CIE94 for-mula gave the same results of its own in the corre-sponding figures 3 – 4. CIE94 formula gave resultswhich indicated that it was insensitive to computing inregular increasing and decreasing steps in the secondand the fourth hue regions of a*-b* colour plane. Onthe other hand, CMC formula was sensitive to the sec-ond and the fourth hue regions and to regular increas-ing and decreasing steps in the corresponding figuresof 3 – 4. However, CMC formula gave almost the sameresults when computing was performed in the secondhue region of a*–b* colour plane according toincreasing steps (figure 3, a) and in the fourth region ofa*–b* colour plane according to decreasing steps (fig-ure 4, a). A corresponding behaviour was not observedin the same regions when computing directionchanged, in figures 3, b and 4, a. CIEDE2000 formulawas sensitive to regularly increasing and decreasingsteps in the second and fourth hue regions of a*–b*colour plane. Regular descending curves wereobtained in the second hue region of a*–b* colourplane (figures 3, a and 3, b). However, a completelydifferent character was obtained in figures 4, a and
4, b where the computing was performed in the fourthhue region. The polynomial curves obtained in thisregion for regularly increasing and decreasing stepsdiffered from each other considerably.An overall consideration of figures 5, a – 5, b where a*and b* coordinates were increased and decreased atconstant steps through the first and third regions ofa*–b* colour plane at L*=50, showed that only CMCformula gave different results in the correspondingfigures while the other three formulae gave the sameresults of their own. CIELAB gave linear results simi-lar to the ones presented in figures 1 – 4. CMC,CIE94 and CIEDE2000 gave thresholds when com-puting passed through the grey point of a*–b* colourplane. CIEDE2000 results changed from ascendingcharacter to descending character while CMC andCIE94 results considerably increased in a descend-ing character in both figures of 5, a and 5, b.An overall consideration of figures 6 – 7 where a* andb* coordinates were increased and decreased atconstant steps the third (figures 6, a and 6, b) and inthe first (figures 7, a and 7, b) regions of a*–b* colourplane at L*=50, showed that all the four formulaewere sensitive to computing according to regularchanges in the third and first hue regions of a*–b*colour plane. Computing according to increasing stepsin the third hue region (figure 6, a) corresponded withcomputing to decreasing steps in the first hue region(figure 7, b) and computing according to increasingsteps in the first hue region (figure 7, a) correspondedwith computing according to decreasing steps in thethird hue region (figure 6, b). The four formulae gavecorresponding results of their own when computingcame closer to the grey point (fig- ures 6, a and 7, b)and when the computing receded from the grey point(figures 6, b and 7, a). CMC formula gave the highestcolour difference results when the computing reced-ed from the grey point and also CIELAB and CIE94gave almost the same results.The computing characteristics of the four formulaechanged considerably in the four hue regions notonly depending on the colours (hues) in the regionbut also on the way of calculation of colour differ-ences either in increasing or decreasing steps.Studies are being carried out by researchers on realcolours and real observers to make a final conclusionabout the choice of the most reliable formula but thisresearch revealed that the continuity of the comput-ing characteristics of the âformulae in CIELAB colourspace were also important. Depending on the com-puting results presented in this paper, it was conclud-ed that CIEDE2000 formula suited itself the bestaccording to the changes in computing steps.
CONCLUSION
The purpose of this paper was to research the com-puting characteristics of the four colour differenceformulae according to regular coordinate changes inthe CIELAB colour space. The computing applica-tions were made on lightness axis and on four hueregions of a*–b* colour plane. Questions arise on thepossibility of usage of the colour difference formulaein CIELAB colour space because of the ununiformity
253industria textila 2019, vol. 70, nr. 3˘
a
b
Fig. 7. Colour difference results (from a*=0.01, b*=0.01to a*=30, b*=30; L*=50) (a); Colour difference results(from a*=30, b*=30 to a*=0.01, b*=0.01; L*=50) (b)
of the space. This research tried to find a possibleanswer if it would be suitable or convenient to usedifferent colour difference formulae in different hueregions of CIELAB colour space. The computingrevealed that CIELAB formula was insensitive to reg-ular lightness and hue changes in the colour spaceand always linear character of colour difference wasobtained. CIEDE2000 always gave polynomial resultswherever the computing was carried out. The mostdiffering colour difference results were obtained byCMC and CIELAB2000. Especially CMC formulashowed distinct differences when computing changedfrom regular increases to regular decreases or viceversa in different hue regions. It could be stated thatthe more the results of a colour difference formula dif-
fer according to computing regions of a*–b* colourplane the more sensitive the formula to the changesin hue differences. If this statement could be consid-ered as true, then CMC and CIEDE2000 formulaewould be judged as the most sensitive colour differ-ence formulae to regular changes in hue. However,CMC gave very distinct values especially when thecomputing directions changed. CIEDE2000 formularesulted in more even results than the others andimplied that it could suit itself to the computing areasand directions better than the others.
ACKNOWLEDGEMENT
The authors thank M. Medeni Baykal for his kind support inthe preparation of the computing software.
254industria textila 2019, vol. 70, nr. 3˘
Authors:
UGUR ONUR CINKO1
BEHCET BECERIR2
1Uludag University, Institute of Natural Sciences, Gorukle, 16059 Bursa, Turkey2Uludag University, Faculty of Engineering, Textile Engineering Department, Gorukle, 16059 Bursa, Turkey
e-mail: [email protected]; [email protected]
Corresponding author:
BEHCET BECERIRe-mail: [email protected]
BIBLIOGRAPHY
[1] Urban, P., Berns, S.R., Rosen, M.R. Constructing Euclidean color spaces on color difference formulas, In: 15th ColorImaging Conference Final Program and Proceedings, Society for Imaging Science and Technology, 2007, pp. 77–82.
[2] CIE, A colour appearance model for colour management systems: CIECAM02, CIE Publication No. 159-2004.CIECentral Bureau, Vienna, Austria, 2004.
[3] Luo M.R., Cui G., Li C. Uniform colour spaces based on CIECAM02 colour appearance model, In: Color Researchand Application, 2006, vol. 31, no. 4, pp. 320–330.
[4] BS 6923, Method for calculation of small color differences. Committee of the Society of Dyers and ColoristsandBritish Standard Institution, London, UK, 1988.
[5] CIE, Industrial colour-difference evaluation, CIE Publication No. 116-1995, CIE Central Bureau, Vienna, Austria,1995.
[6] CIE, Improvement to industrial colour-difference evaluation. CIE Publication No. 142-2001, CIE Central Bureau,Vienna, Austria, 2001.
[7] Luo, M.R., Cui, G., Rigg B. The development of the CIE 2000 colour-difference formula: CIEDE2000, In: ColorResearch and Application, 2001, vol. 26, no. 5, pp. 340–350.
[8] Luo, M.R., Cui, G., Rigg, B. Further comments on CIEDE2000, In: Color Research and Application, 2002, vol. 27,no. 2, pp. 127–128.
[9] Kuehni, R.G., CIEDE2000: milestone of final answer?, In: Color Research and Application, 2002, vol. 27, no. 2,pp. 126–127.
[10] Xu, H., Yaguchi, H., Shiori, S. Testing CIELAB-based color-difference formulae using large color differences, In:Optical Review, 2001, vol. 8, no. 6, pp. 487–494.
[11] Sharma, G., Wu, W., Dalal, E.N. The CIEDE2000 color-difference formula: Implementation notes, Supplementarytest data, and mathematical observations, In: Color Research and Application, 2005, vol. 30, no. 1, pp. 21-30.
[12] Yang, Y., Ming, J., Yu, N. Color image quality assessment based on CIEDE2000, In: Advances in Multimedia; 2012,Article ID 273723, 6 pages, doi:10.1155/2012/273723.
[13] Luo, M.R., Rigg, B. Chromaticity-discrimination ellipses for surface colours, In: Color Research andApplication,1986, vol. 11, no. 1, pp. 25–42.
[14] Wang, H., Cui, G., Luo, R., Xu, H. Evaluation of colour-difference formulae for different colour-differencemagnitudes, In: Color Research and Application, 2012, vol. 37, no. 5, pp. 316–325.
[15] Melgosa, M. Testing CIELAB-based color difference formulas, In: Color Research and Application, 2000, vol. 25,no. 1, pp. 49–55.
[16] Kandi, S.G., Tehran, M.A. Investigating the effect of texture on the performance of color difference formulae, In:Color Research and Application, 2010, vol. 35, no. 2, pp. 94–100.
[17] Becerir, B. Assessment of colour properties of reactive dyed cotton fabrics under different illuminants by usingCIELAB and hunter systems, In: Tekstilve Konfeksiyon, 2010, vol. 20, no. 2, pp. 145–154.
[18] Sennaroglu, B., Oner, E., Senvar, O. Colour recipe prediction in dyeing acrylic fabrics with fluorescent dyes usingartificial neural network, In: Indutria Textila, 2014, vol. 65, no. 1, pp. 22–28.
INTRODUCTION
Cyclodextrins (CDs) obtained as a result of enzy -matic degradation of starch are a member of cyclicoligosaccharides. They have a number of hydroxylgroups [1]. Details on the position of hydroxyl groupsand the cavities can be found elsewhere [2–3]. Thereare a significant number of CDs however the mostcommon ones are α-, β-, and γ- CDs. Greek lettersα-, β-, and γ- designate the number of glucopyranoseunits in their structure [4–7]. Due to their cone-shapedhydrophobic cavity, CDs are good candidates to beused as a host for molecule encapsulations to forminclusion complexes (ICs) [8–9]. Abdel-Halim et al.used β-CD as a host and loaded with octenidinedihy-drochloride to form an IC which was then incorporat-ed with a cotton fabric [10]. They investigated theantimicrobial property of IC-containing cotton fabricbefore and after each washes up to 20-wash.Inclusion complexes of CDs with different guestmaterials have been studied for a number of differentapplications [8, 11–13]. Silver and silver containing materials are widely stud-iedfor their antibacterial properties. Silver cyclohex-ane monocarboxylate (silver naphthenate), a product
of naphthenic acid and silver salt reaction, was syn-thesized and its use as an antibacterial agent in tex-tiles was investigated by Yildiz et al. [14]. A similarstudy was carried out on the synthesis of silver abi-etate to be used for antibacterial applications in tex-tiles [15]. Silver and silver containing materials arealso being used as the guest materials to form ICswith β-CD. Chen et al. used functionalized silvernanoparticles with β-CD to make possible to detectaromatic isomers by naked eye [16]. Antibacterialactivity of silver nanoparticles hosted by β-CD wasinvestigated by Andrade et al. together with structuraland morphological characteristics of the inclusioncomplex [17].Due to their electrical, magnetic and optical proper-ties, magnetic nanomaterials have attracted theattention of researchers in recent years. These mate-rials are good candidates for a number of applica-tions. Role of Fe3O4 nanoparticles in biomedicalapplications was studied by Ghazanfari et al. [18]while magnetic nanocomposites consisting of Fe3O4,humic acid (HA) and silver (Ag) was synthezied byAmir et al. [19] for the purpose of azo dye removalfrom waste water of textile industry. In this study,
255industria textila 2019, vol. 70, nr. 3˘
Inclusion complexes of β-cyclodextrine with Fe3O4@HA@Ag
Part I: Preparation and characterization
DOI: 10.35530/IT.070.03.1548
RIZA ATAV DERMAN VATANSEVER BAYRAMOLA. ÖZGÜR AĞIRGAN AYLIN YILDIZ
REZUMAT – ABSTRACT
Complecși de incluziune ai β-ciclodextrinei cu Fe3O4@HA@Ag
Partea I: Preparare și caracterizare
În acest studiu, a fost abordată prepararea complecșilor de incluziune în conformitate cu tehnicile de malaxare șiamestecare fizică la 1:1 și 1:2 (oaspete:gazdă), raportul de masă al Fe3O4@HA@Ag și β-ciclodextrinei. S-au efectuat:spectroscopia în infraroșu cu transformata Fourier, analizele termogravimetrice și analizele de microscopie electronică cuscanare ale complecșilor preparați. Conform rezultatelor obținute, s-a observat că Fe3O4@HA@Ag formează în modspecial complexul de incluziune cu β-ciclodextrina la un raport de masă de 1:2. În cea de-a doua parte a acestui studiu,sunt expuse rezultatele legate de utilizarea acestor complecși de incluziune în timpul procesului de electrofilare pentru aobține nanovăluri de fibre antibacteriene, care ar putea fi utilizate în cazul rănilor.
Cuvinte-cheie: β-ciclodextrină, complex de incluziune, Fe3O4@HA@Ag, microscop electronic cu scanare
Inclusion complexes of β-cyclodextrine with Fe3O4@HA@Ag
Part I: Preparation and characterization
In this study, the preparation of inclusion complexes according to kneading and physical mixing techniques at 1:1 and 1:2(guest:host) mass ratios of Fe3O4@HA@Ag and β-cyclodextrin were studied. Fourier transformed infraredspectroscopy, thermogravimetric analyses and scanning electron microscope analysesof the prepared complexes werecarried out. According to the results obtained, it was observed Fe3O4@HA@Ag especially forms inclusion complex withβ-cyclodextrin at a mass ratio of 1:2. In the second part of this study, results related to the use of these inclusioncomplexes during electrospinning process in order to obtain antibacterial nanowebs, which could potentially be used inmedical wounds, will be given.
Keywords: β-cyclodextrin, inclusion complex, Fe3O4@HA@Ag, scanning electron microscope
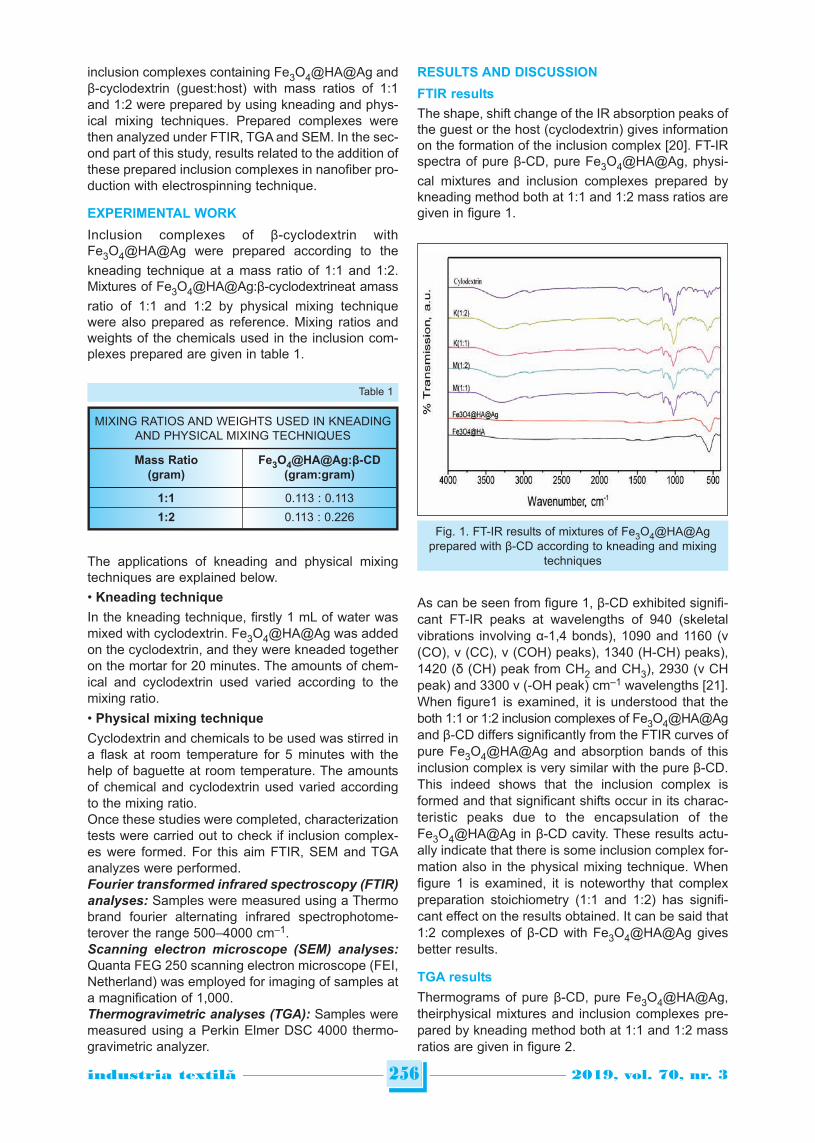
256industria textila 2019, vol. 70, nr. 3˘
inclusion complexes containing Fe3O4@HA@Ag andβ-cyclodextrin (guest:host) with mass ratios of 1:1and 1:2 were prepared by using kneading and phys-ical mixing techniques. Prepared complexes werethen analyzed under FTIR, TGA and SEM. In the sec-ond part of this study, results related to the addition ofthese prepared inclusion complexes in nanofiber pro-duction with electrospinning technique.
EXPERIMENTAL WORK
Inclusion complexes of β-cyclodextrin withFe3O4@HA@Ag were prepared according to thekneading technique at a mass ratio of 1:1 and 1:2.Mixtures of Fe3O4@HA@Ag:β-cyclodextrineat amassratio of 1:1 and 1:2 by physical mixing techniquewere also prepared as reference. Mixing ratios andweights of the chemicals used in the inclusion com-plexes prepared are given in table 1.
The applications of kneading and physical mixingtechniques are explained below.• Kneading technique
In the kneading technique, firstly 1 mL of water wasmixed with cyclodextrin. Fe3O4@HA@Ag was addedon the cyclodextrin, and they were kneaded togetheron the mortar for 20 minutes. The amounts of chem-ical and cyclodextrin used varied according to themixing ratio.• Physical mixing technique
Cyclodextrin and chemicals to be used was stirred ina flask at room temperature for 5 minutes with thehelp of baguette at room temperature. The amountsof chemical and cyclodextrin used varied accordingto the mixing ratio.Once these studies were completed, characterizationtests were carried out to check if inclusion complex-es were formed. For this aim FTIR, SEM and TGAanalyzes were performed.Fourier transformed infrared spectroscopy (FTIR)
analyses: Samples were measured using a Thermobrand fourier alternating infrared spectrophotome-terover the range 500–4000 cm–1.Scanning electron microscope (SEM) analyses:
Quanta FEG 250 scanning electron microscope (FEI,Netherland) was employed for imaging of samples ata magnification of 1,000. Thermogravimetric analyses (TGA): Samples weremeasured using a Perkin Elmer DSC 4000 thermo-gravimetric analyzer.
RESULTS AND DISCUSSION
FTIR results
The shape, shift change of the IR absorption peaks ofthe guest or the host (cyclodextrin) gives informationon the formation of the inclusion complex [20]. FT-IRspectra of pure β-CD, pure Fe3O4@HA@Ag, physi-cal mixtures and inclusion complexes prepared bykneading method both at 1:1 and 1:2 mass ratios aregiven in figure 1.
As can be seen from figure 1, β-CD exhibited signifi-cant FT-IR peaks at wavelengths of 940 (skeletalvibrations involving α-1,4 bonds), 1090 and 1160 (ν(CO), ν (CC), ν (COH) peaks), 1340 (H-CH) peaks),1420 (δ (CH) peak from CH2 and CH3), 2930 (ν CHpeak) and 3300 ν (-OH peak) cm–1 wavelengths [21].When figure1 is examined, it is understood that theboth 1:1 or 1:2 inclusion complexes of Fe3O4@HA@Agand β-CD differs significantly from the FTIR curves ofpure Fe3O4@HA@Ag and absorption bands of thisinclusion complex is very similar with the pure β-CD.This indeed shows that the inclusion complex isformed and that significant shifts occur in its charac-teristic peaks due to the encapsulation of theFe3O4@HA@Ag in β-CD cavity. These results actu-ally indicate that there is some inclusion complex for-mation also in the physical mixing technique. Whenfigure 1 is examined, it is noteworthy that complexpreparation stoichiometry (1:1 and 1:2) has signifi-cant effect on the results obtained. It can be said that1:2 complexes of β-CD with Fe3O4@HA@Ag givesbetter results.
TGA results
Thermograms of pure β-CD, pure Fe3O4@HA@Ag,theirphysical mixtures and inclusion complexes pre-pared by kneading method both at 1:1 and 1:2 massratios are given in figure 2.
MIXING RATIOS AND WEIGHTS USED IN KNEADINGAND PHYSICAL MIXING TECHNIQUES
Mass Ratio(gram)
Fe3O4@HA@Ag:β-CD(gram:gram)
1:1 0.113 : 0.113
1:2 0.113 : 0.226
Table 1
Fig. 1. FT-IR results of mixtures of Fe3O4@HA@Agprepared with β-CD according to kneading and mixing
techniques
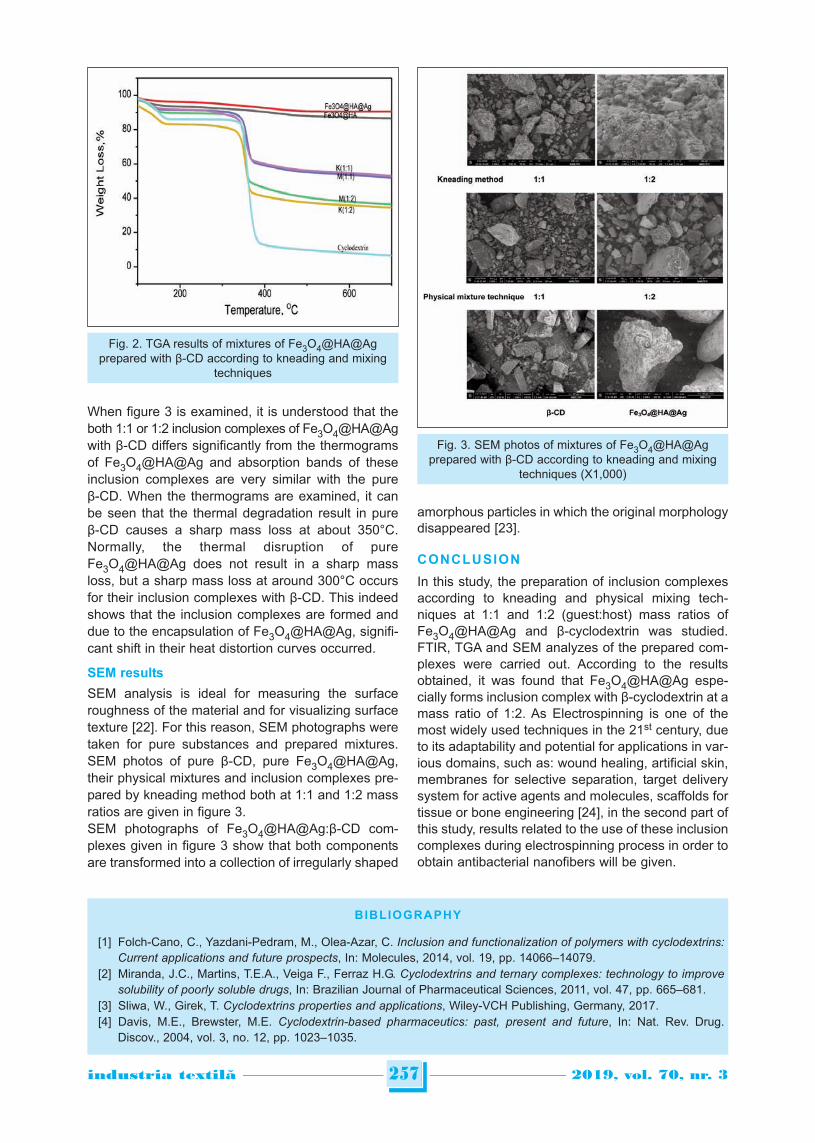
257industria textila 2019, vol. 70, nr. 3˘
When figure 3 is examined, it is understood that theboth 1:1 or 1:2 inclusion complexes of Fe3O4@HA@Agwith β-CD differs significantly from the thermogramsof Fe3O4@HA@Ag and absorption bands of theseinclusion complexes are very similar with the pureβ-CD. When the thermograms are examined, it canbe seen that the thermal degradation result in pureβ-CD causes a sharp mass loss at about 350°C.Normally, the thermal disruption of pureFe3O4@HA@Ag does not result in a sharp massloss, but a sharp mass loss at around 300°C occursfor their inclusion complexes with β-CD. This indeedshows that the inclusion complexes are formed anddue to the encapsulation of Fe3O4@HA@Ag, signifi-cant shift in their heat distortion curves occurred.
SEM results
SEM analysis is ideal for measuring the surfaceroughness of the material and for visualizing surfacetexture [22]. For this reason, SEM photographs weretaken for pure substances and prepared mixtures.SEM photos of pure β-CD, pure Fe3O4@HA@Ag,their physical mixtures and inclusion complexes pre-pared by kneading method both at 1:1 and 1:2 massratios are given in figure 3.SEM photographs of Fe3O4@HA@Ag:β-CD com-plexes given in figure 3 show that both componentsare transformed into a collection of irregularly shaped
amorphous particles in which the original morphologydisappeared [23].
CONCLUSION
In this study, the preparation of inclusion complexesaccording to kneading and physical mixing tech-niques at 1:1 and 1:2 (guest:host) mass ratios ofFe3O4@HA@Ag and β-cyclodextrin was studied.FTIR, TGA and SEM analyzes of the prepared com-plexes were carried out. According to the resultsobtained, it was found that Fe3O4@HA@Ag espe-cially forms inclusion complex with β-cyclodextrin at amass ratio of 1:2. As Electrospinning is one of themost widely used techniques in the 21st century, dueto its adaptability and potential for applications in var-ious domains, such as: wound healing, artificial skin,membranes for selective separation, target deliverysystem for active agents and molecules, scaffolds fortissue or bone engineering [24], in the second part ofthis study, results related to the use of these inclusioncomplexes during electrospinning process in order toobtain antibacterial nanofibers will be given.
Fig. 2. TGA results of mixtures of Fe3O4@HA@Agprepared with β-CD according to kneading and mixing
techniques
Fig. 3. SEM photos of mixtures of Fe3O4@HA@Agprepared with β-CD according to kneading and mixing
techniques (X1,000)
BIBLIOGRAPHY
[1] Folch-Cano, C., Yazdani-Pedram, M., Olea-Azar, C. Inclusion and functionalization of polymers with cyclodextrins:Current applications and future prospects, In: Molecules, 2014, vol. 19, pp. 14066–14079.
[2] Miranda, J.C., Martins, T.E.A., Veiga F., Ferraz H.G. Cyclodextrins and ternary complexes: technology to improvesolubility of poorly soluble drugs, In: Brazilian Journal of Pharmaceutical Sciences, 2011, vol. 47, pp. 665–681.
[3] Sliwa, W., Girek, T. Cyclodextrins properties and applications, Wiley-VCH Publishing, Germany, 2017.[4] Davis, M.E., Brewster, M.E. Cyclodextrin-based pharmaceutics: past, present and future, In: Nat. Rev. Drug.
Discov., 2004, vol. 3, no. 12, pp. 1023–1035.
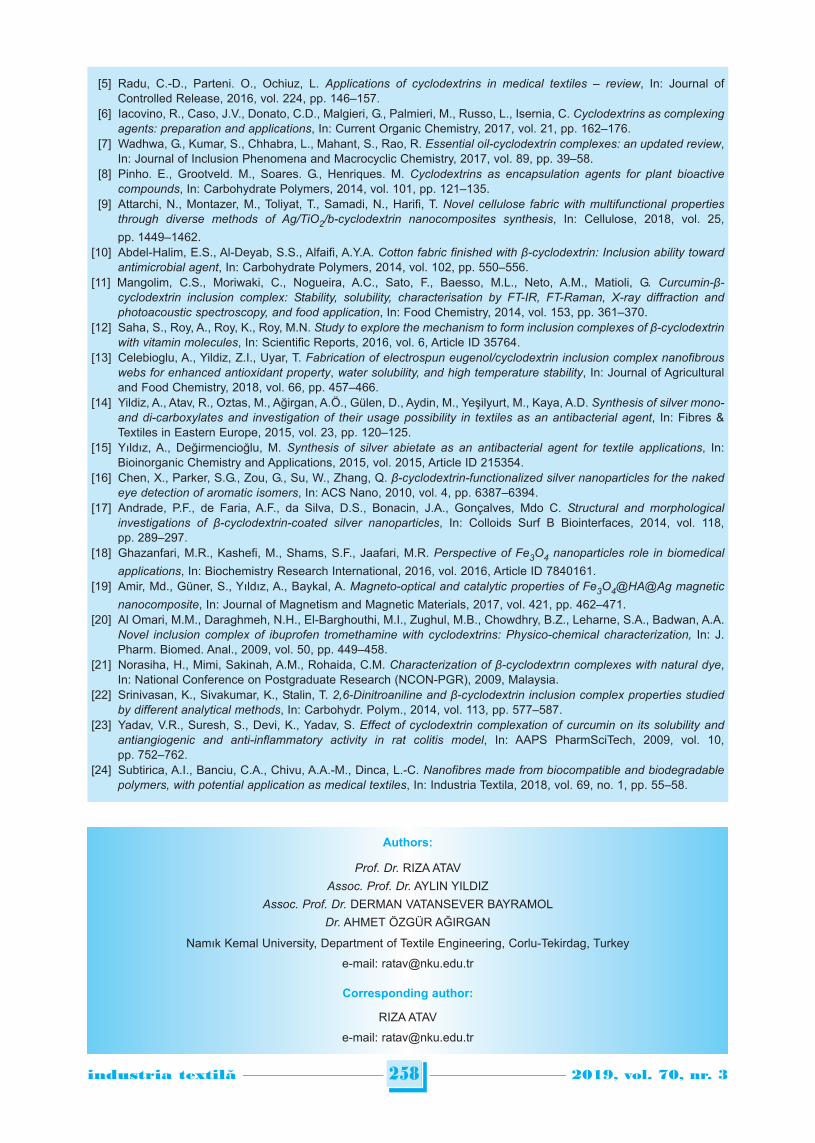
258industria textila 2019, vol. 70, nr. 3˘
Authors:
Prof. Dr. RIZA ATAVAssoc. Prof. Dr. AYLIN YILDIZ
Assoc. Prof. Dr. DERMAN VATANSEVER BAYRAMOLDr. AHMET ÖZGÜR AĞIRGAN
Namık Kemal University, Department of Textile Engineering, Corlu-Tekirdag, Turkey
e-mail: [email protected]
Corresponding author:
RIZA ATAV
e-mail: [email protected]
[5] Radu, C.-D., Parteni. O., Ochiuz, L. Applications of cyclodextrins in medical textiles – review, In: Journal ofControlled Release, 2016, vol. 224, pp. 146–157.
[6] Iacovino, R., Caso, J.V., Donato, C.D., Malgieri, G., Palmieri, M., Russo, L., Isernia, C. Cyclodextrins as complexingagents: preparation and applications, In: Current Organic Chemistry, 2017, vol. 21, pp. 162–176.
[7] Wadhwa, G., Kumar, S., Chhabra, L., Mahant, S., Rao, R. Essential oil-cyclodextrin complexes: an updated review,In: Journal of Inclusion Phenomena and Macrocyclic Chemistry, 2017, vol. 89, pp. 39–58.
[8] Pinho. E., Grootveld. M., Soares. G., Henriques. M. Cyclodextrins as encapsulation agents for plant bioactivecompounds, In: Carbohydrate Polymers, 2014, vol. 101, pp. 121–135.
[9] Attarchi, N., Montazer, M., Toliyat, T., Samadi, N., Harifi, T. Novel cellulose fabric with multifunctional propertiesthrough diverse methods of Ag/TiO2/b-cyclodextrin nanocomposites synthesis, In: Cellulose, 2018, vol. 25,pp. 1449–1462.
[10] Abdel-Halim, E.S., Al-Deyab, S.S., Alfaifi, A.Y.A. Cotton fabric finished with β-cyclodextrin: Inclusion ability towardantimicrobial agent, In: Carbohydrate Polymers, 2014, vol. 102, pp. 550–556.
[11] Mangolim, C.S., Moriwaki, C., Nogueira, A.C., Sato, F., Baesso, M.L., Neto, A.M., Matioli, G. Curcumin-β-cyclodextrin inclusion complex: Stability, solubility, characterisation by FT-IR, FT-Raman, X-ray diffraction andphotoacoustic spectroscopy, and food application, In: Food Chemistry, 2014, vol. 153, pp. 361–370.
[12] Saha, S., Roy, A., Roy, K., Roy, M.N. Study to explore the mechanism to form inclusion complexes of β-cyclodextrinwith vitamin molecules, In: Scientific Reports, 2016, vol. 6, Article ID 35764.
[13] Celebioglu, A., Yildiz, Z.I., Uyar, T. Fabrication of electrospun eugenol/cyclodextrin inclusion complex nanofibrouswebs for enhanced antioxidant property, water solubility, and high temperature stability, In: Journal of Agriculturaland Food Chemistry, 2018, vol. 66, pp. 457–466.
[14] Yildiz, A., Atav, R., Oztas, M., Ağirgan, A.Ö., Gülen, D., Aydin, M., Yeşilyurt, M., Kaya, A.D. Synthesis of silver mono-and di-carboxylates and investigation of their usage possibility in textiles as an antibacterial agent, In: Fibres &Textiles in Eastern Europe, 2015, vol. 23, pp. 120–125.
[15] Yıldız, A., Değirmencioğlu, M. Synthesis of silver abietate as an antibacterial agent for textile applications, In:Bioinorganic Chemistry and Applications, 2015, vol. 2015, Article ID 215354.
[16] Chen, X., Parker, S.G., Zou, G., Su, W., Zhang, Q. β-cyclodextrin-functionalized silver nanoparticles for the nakedeye detection of aromatic isomers, In: ACS Nano, 2010, vol. 4, pp. 6387–6394.
[17] Andrade, P.F., de Faria, A.F., da Silva, D.S., Bonacin, J.A., Gonçalves, Mdo C. Structural and morphologicalinvestigations of β-cyclodextrin-coated silver nanoparticles, In: Colloids Surf B Biointerfaces, 2014, vol. 118,pp. 289–297.
[18] Ghazanfari, M.R., Kashefi, M., Shams, S.F., Jaafari, M.R. Perspective of Fe3O4 nanoparticles role in biomedical
applications, In: Biochemistry Research International, 2016, vol. 2016, Article ID 7840161.[19] Amir, Md., Güner, S., Yıldız, A., Baykal, A. Magneto-optical and catalytic properties of Fe3O4@HA@Ag magnetic
nanocomposite, In: Journal of Magnetism and Magnetic Materials, 2017, vol. 421, pp. 462–471.[20] Al Omari, M.M., Daraghmeh, N.H., El-Barghouthi, M.I., Zughul, M.B., Chowdhry, B.Z., Leharne, S.A., Badwan, A.A.
Novel inclusion complex of ibuprofen tromethamine with cyclodextrins: Physico-chemical characterization, In: J.Pharm. Biomed. Anal., 2009, vol. 50, pp. 449–458.
[21] Norasiha, H., Mimi, Sakinah, A.M., Rohaida, C.M. Characterization of β-cyclodextrın complexes with natural dye,In: National Conference on Postgraduate Research (NCON-PGR), 2009, Malaysia.
[22] Srinivasan, K., Sivakumar, K., Stalin, T. 2,6-Dinitroaniline and β-cyclodextrin inclusion complex properties studiedby different analytical methods, In: Carbohydr. Polym., 2014, vol. 113, pp. 577–587.
[23] Yadav, V.R., Suresh, S., Devi, K., Yadav, S. Effect of cyclodextrin complexation of curcumin on its solubility andantiangiogenic and anti-inflammatory activity in rat colitis model, In: AAPS PharmSciTech, 2009, vol. 10,pp. 752–762.
[24] Subtirica, A.I., Banciu, C.A., Chivu, A.A.-M., Dinca, L.-C. Nanofibres made from biocompatible and biodegradablepolymers, with potential application as medical textiles, In: Industria Textila, 2018, vol. 69, no. 1, pp. 55–58.
INTRODUCTION
Denim has been widely acknowledged by all the agegroup throughout the world for many years. Highdurability, longer washing cycle and its ability to adaptto changing fashion trends and demands have madeit most popular garment in the international market.Depending on growth and change in demand fordenim products, denim fabric manufacturers con-stantly try to develop novel varieties of denim fabricsby various methods to meet consumer demands. Fabric finishing is the last stage in the production ofdenim and it is where the final touch is added, and itcan make a big difference in how the fabric looks,feels and wears. There are countless dry and wet fin-ishing processes in denim garment processing likewashing, bleaching, printing, coating etc. Coating isan important process for covering the surface ofdenim fabric with chemicals or dyestuffs in order toimprove various surface properties such as waxy,oily, glossy, paper, leather, silicone, etc. Coating mate -rials can be waxes, rubbers, latex, plastic films,resins, polyurethanes, binders or metal powders.Today several coating layers can be applied to denimfabrics to obtain different visual effects after washing
treatment. In general, knife, foam and rotary screencoating methods are used to coat denim fabrics [1–4].When considering the coating of fabrics like denim,breathability of the fabric is essential along with per-formance and aesthetic properties. Therefore, airpermeability is an important factor in determining thecomfort level of a coated fabric as it plays a signifi-cant role in transporting moisture vapors from theskin to the outside atmosphere [5]. It is thought thatmany parameters of coating process may affect theair permeability of the coated fabrics. Without a sci-entific approach, it is very difficult to assess theseparameters in mill conditions. At the same time, it isquite exhaustive to determine the effects of all pro-cess parameters affecting air permeability of coatedfabrics with full factorial design, because it requires awide range of experiments, which extremely increasethe experimental period and cost [6].The present study is focused on optimizing the vari-ous coating process parameters for the air perme-ability properties of denim fabrics by using Taguchi’sexperimental design technique, a leading optimiza-tion technique reducing the experimental period andcost. Taguchi method provides the means to minimize
Optimization of coating parameters for air permeability of denim fabricsthrough Taguchi method
DOI: 10.35530/IT.070.03.1564
SÜMEYYE ÜSTÜNTAĞ HÜSEYIN GAZI TÜRKSOY
REZUMAT – ABSTRACT
Optimizarea parametrilor de acoperire pentru permeabilitatea la aer a țesăturilor denim prin metoda Taguchi
Tehnologia de acoperire este o metodă din ce în ce mai populară pentru crearea unor modele speciale și obținerea unuiaspect diferit al țesăturilor denim. În funcție de proprietățile așteptate din partea țesăturilor denim, parametrii de proces aiacoperirii pot fi modificați. Este important modul în care parametrii procesului afectează caracteristicile de confort alețesăturilor denim. Prezentul studiu are ca scop optimizarea diferiților parametri ai procesului de acoperire pentruproprietățile de permeabilitate la aer ale țesăturilor denim, folosind metoda Taguchi. Parametrii selectați pentru optimizaresunt presiunea de stoarcere, viscozitatea fluidului de acoperire, viteza de trecere a țesăturii, temperatura de uscare șidesimea firelor de bătătură ale țesăturilor. Un model ortogonal L27 (35) a fost ales ca plan experimental. În evaluările cumetoda Taguchi au fost utilizate analize ale raportului semnal-zgomot (S/N) și varianță (ANOVA). Rezultatele arată cădesimea firelor de bătătură și viscozitatea au o influență semnificativă asupra proprietăților de permeabilitate la aer ațesăturilor denim acoperite.
Cuvinte-cheie: țesătură denim, acoperire, permeabilitate la aer, metoda Taguchi, raport S/N
Optimization of coating parameters for air permeability of denim fabrics through Taguchi method
Coating technology is an increasingly popular method for creating special designs and getting different appearance todenim fabrics. Depending on the expected properties from denim fabrics, the process parameters of coating can bechanged. It is important issue how process parameters affect the comfort characteristics of denim fabrics. The presentstudy is aimed at optimizing the various coating process parameters for the air permeability properties of denim fabrics byusing Taguchi method. The parameters selected for optimization are squeeze pressure, viscosity of coating fluid, fabricpassing speed, drying temperature and weft density of fabrics. An L27 (35) orthogonal design was chosen as experimentalplan. In the evaluations with Taguchi Method, analyses of the signal to noise ratio (S/N) and variance (ANOVA) were used.The results show that weft density and viscosity have significant influence on the air permeability properties of coateddenim fabrics.
Keywords: denim fabric, coating, air permeability, Taguchi method, S/N ratio
259industria textila 2019, vol. 70, nr. 3˘
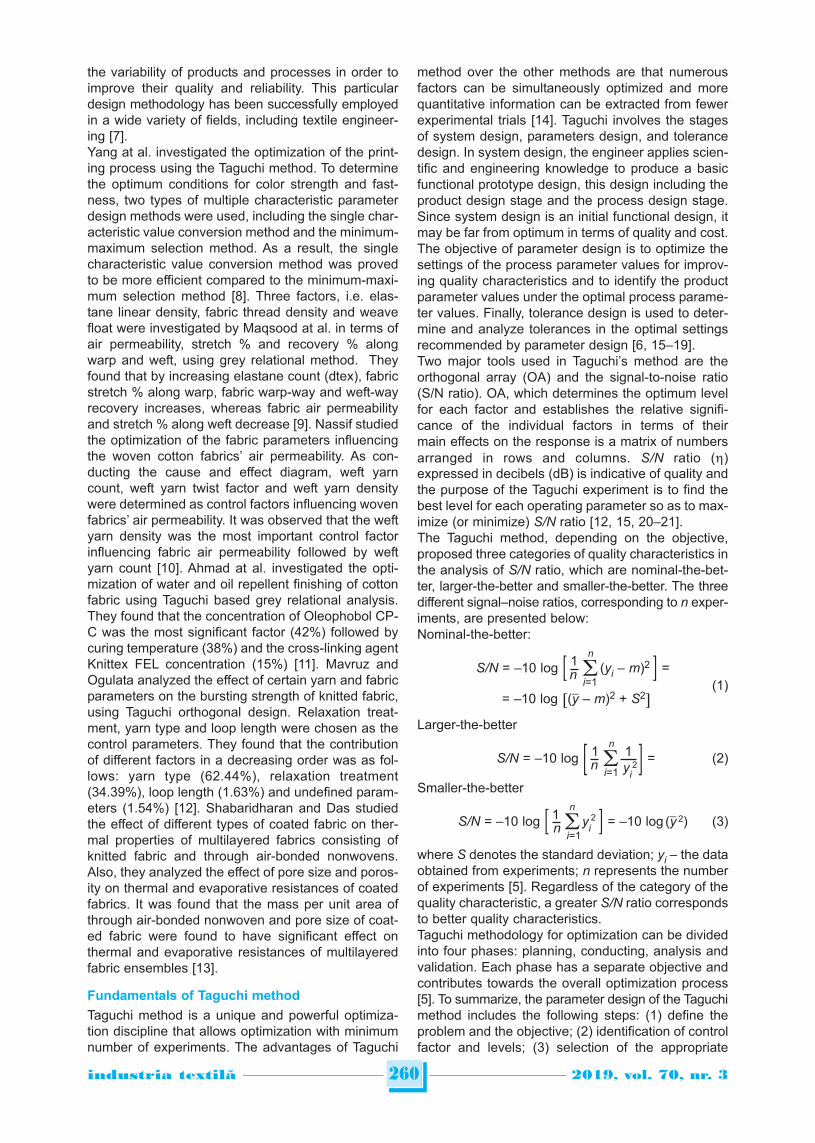
the variability of products and processes in order toimprove their quality and reliability. This particulardesign methodology has been successfully employedin a wide variety of fields, including textile engineer-ing [7].Yang at al. investigated the optimization of the print-ing process using the Taguchi method. To determinethe optimum conditions for color strength and fast-ness, two types of multiple characteristic parameterdesign methods were used, including the single char-acteristic value conversion method and the minimum-maximum selection method. As a result, the singlecharacteristic value conversion method was provedto be more efficient compared to the minimum-maxi-mum selection method [8]. Three factors, i.e. elas-tane linear density, fabric thread density and weavefloat were investigated by Maqsood at al. in terms ofair permeability, stretch % and recovery % alongwarp and weft, using grey relational method. Theyfound that by increasing elastane count (dtex), fabricstretch % along warp, fabric warp-way and weft-wayrecovery increases, whereas fabric air permeabilityand stretch % along weft decrease [9]. Nassif studiedthe optimization of the fabric parameters influencingthe woven cotton fabrics’ air permeability. As con-ducting the cause and effect diagram, weft yarncount, weft yarn twist factor and weft yarn densitywere determined as control factors influencing wovenfabrics’ air permeability. It was observed that the weftyarn density was the most important control factorinfluencing fabric air permeability followed by weftyarn count [10]. Ahmad at al. investigated the opti-mization of water and oil repellent finishing of cottonfabric using Taguchi based grey relational analysis.They found that the concentration of Oleophobol CP-C was the most significant factor (42%) followed bycuring temperature (38%) and the cross-linking agentKnittex FEL concentration (15%) [11]. Mavruz andOgulata analyzed the effect of certain yarn and fabricparameters on the bursting strength of knitted fabric,using Taguchi orthogonal design. Relaxation treat-ment, yarn type and loop length were chosen as thecontrol parameters. They found that the contributionof different factors in a decreasing order was as fol-lows: yarn type (62.44%), relaxation treatment(34.39%), loop length (1.63%) and undefined param-eters (1.54%) [12]. Shabaridharan and Das studiedthe effect of different types of coated fabric on ther-mal properties of multilayered fabrics consisting ofknitted fabric and through air-bonded nonwovens.Also, they analyzed the effect of pore size and poros-ity on thermal and evaporative resistances of coatedfabrics. It was found that the mass per unit area ofthrough air-bonded nonwoven and pore size of coat-ed fabric were found to have significant effect onthermal and evaporative resistances of multilayeredfabric ensembles [13].
Fundamentals of Taguchi method
Taguchi method is a unique and powerful optimiza-tion discipline that allows optimization with minimumnumber of experiments. The advantages of Taguchi
method over the other methods are that numerousfactors can be simultaneously optimized and morequantitative information can be extracted from fewerexperimental trials [14]. Taguchi involves the stagesof system design, parameters design, and tolerancedesign. In system design, the engineer applies scien-tific and engineering knowledge to produce a basicfunctional prototype design, this design including theproduct design stage and the process design stage.Since system design is an initial functional design, itmay be far from optimum in terms of quality and cost.The objective of parameter design is to optimize thesettings of the process parameter values for improv-ing quality characteristics and to identify the productparameter values under the optimal process parame-ter values. Finally, tolerance design is used to deter-mine and analyze tolerances in the optimal settingsrecommended by parameter design [6, 15–19]. Two major tools used in Taguchi’s method are theorthogonal array (OA) and the signal-to-noise ratio(S/N ratio). OA, which determines the optimum levelfor each factor and establishes the relative signifi-cance of the individual factors in terms of theirmain effects on the response is a matrix of numbersarranged in rows and columns. S/N ratio (h)expressed in decibels (dB) is indicative of quality andthe purpose of the Taguchi experiment is to find thebest level for each operating parameter so as to max-imize (or minimize) S/N ratio [12, 15, 20–21].The Taguchi method, depending on the objective,proposed three categories of quality characteristics inthe analysis of S/N ratio, which are nominal-the-bet-ter, larger-the-better and smaller-the-better. The threedifferent signal–noise ratios, corresponding to n exper-iments, are presented below:Nominal-the-better:
1n
S/N = –10 log [ (yi – m)2 ] =ni=1
= –10 log [(y – m)2 + S2](1)
Larger-the-better
1n
12S/N = –10 log [ ] = (2)n
i=1 yiSmaller-the-better
1n
S/N = –10 log [ yi2 ] = –10 log (y 2) (3)n
i=1
where S denotes the standard deviation; yi – the dataobtained from experiments; n represents the numberof experiments [5]. Regardless of the category of thequality characteristic, a greater S/N ratio correspondsto better quality characteristics.Taguchi methodology for optimization can be dividedinto four phases: planning, conducting, analysis andvalidation. Each phase has a separate objective andcontributes towards the overall optimization process[5]. To summarize, the parameter design of the Taguchimethod includes the following steps: (1) define theproblem and the objective; (2) identification of controlfactor and levels; (3) selection of the appropriate
260industria textila 2019, vol. 70, nr. 3˘
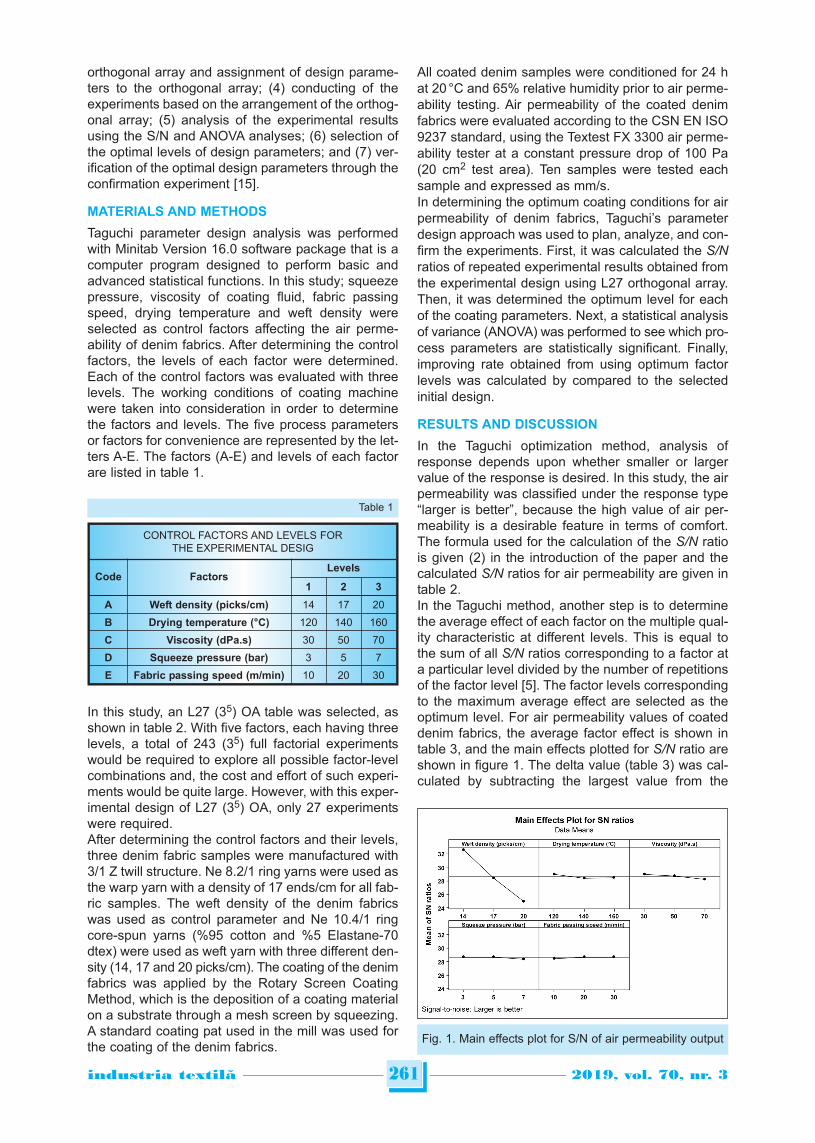
orthogonal array and assignment of design parame-ters to the orthogonal array; (4) conducting of theexperiments based on the arrangement of the orthog-onal array; (5) analysis of the experimental resultsusing the S/N and ANOVA analyses; (6) selection ofthe optimal levels of design parameters; and (7) ver-ification of the optimal design parameters through theconfirmation experiment [15].
MATERIALS AND METHODS
Taguchi parameter design analysis was performedwith Minitab Version 16.0 software package that is acomputer program designed to perform basic andadvanced statistical functions. In this study; squeezepressure, viscosity of coating fluid, fabric passingspeed, drying temperature and weft density wereselected as control factors affecting the air perme-ability of denim fabrics. After determining the controlfactors, the levels of each factor were determined.Each of the control factors was evaluated with threelevels. The working conditions of coating machinewere taken into consideration in order to determinethe factors and levels. The five process parametersor factors for convenience are represented by the let-ters A-E. The factors (A-E) and levels of each factorare listed in table 1.
In this study, an L27 (35) OA table was selected, asshown in table 2. With five factors, each having threelevels, a total of 243 (35) full factorial experimentswould be required to explore all possible factor-levelcombinations and, the cost and effort of such experi-ments would be quite large. However, with this exper-imental design of L27 (35) OA, only 27 experimentswere required. After determining the control factors and their levels,three denim fabric samples were manufactured with3/1 Z twill structure. Ne 8.2/1 ring yarns were used asthe warp yarn with a density of 17 ends/cm for all fab-ric samples. The weft density of the denim fabricswas used as control parameter and Ne 10.4/1 ringcore-spun yarns (%95 cotton and %5 Elastane-70dtex) were used as weft yarn with three different den-sity (14, 17 and 20 picks/cm). The coating of the denimfabrics was applied by the Rotary Screen CoatingMethod, which is the deposition of a coating materialon a substrate through a mesh screen by squeezing.A standard coating pat used in the mill was used forthe coating of the denim fabrics.
All coated denim samples were conditioned for 24 hat 20 °C and 65% relative humidity prior to air perme-ability testing. Air permeability of the coated denimfabrics were evaluated according to the CSN EN ISO9237 standard, using the Textest FX 3300 air perme-ability tester at a constant pressure drop of 100 Pa(20 cm2 test area). Ten samples were tested eachsample and expressed as mm/s. In determining the optimum coating conditions for airpermeability of denim fabrics, Taguchi’s parameterdesign approach was used to plan, analyze, and con-firm the experiments. First, it was calculated the S/Nratios of repeated experimental results obtained fromthe experimental design using L27 orthogonal array.Then, it was determined the optimum level for eachof the coating parameters. Next, a statistical analysisof variance (ANOVA) was performed to see which pro-cess parameters are statistically significant. Finally,improving rate obtained from using optimum factorlevels was calculated by compared to the selectedinitial design.
RESULTS AND DISCUSSION
In the Taguchi optimization method, analysis ofresponse depends upon whether smaller or largervalue of the response is desired. In this study, the airpermeability was classified under the response type“larger is better”, because the high value of air per-meability is a desirable feature in terms of comfort.The formula used for the calculation of the S/N ratiois given (2) in the introduction of the paper and thecalculated S/N ratios for air permeability are given intable 2. In the Taguchi method, another step is to determinethe average effect of each factor on the multiple qual-ity characteristic at different levels. This is equal tothe sum of all S/N ratios corresponding to a factor ata particular level divided by the number of repetitionsof the factor level [5]. The factor levels correspondingto the maximum average effect are selected as theoptimum level. For air permeability values of coateddenim fabrics, the average factor effect is shown intable 3, and the main effects plotted for S/N ratio areshown in figure 1. The delta value (table 3) was cal-culated by subtracting the largest value from the
261industria textila 2019, vol. 70, nr. 3˘
CONTROL FACTORS AND LEVELS FORTHE EXPERIMENTAL DESIG
Code FactorsLevels
1 2 3
A Weft density (picks/cm) 14 17 20
B Drying temperature (°C) 120 140 160
C Viscosity (dPa.s) 30 50 70
D Squeeze pressure (bar) 3 5 7
E Fabric passing speed (m/min) 10 20 30
Table 1
Fig. 1. Main effects plot for S/N of air permeability output
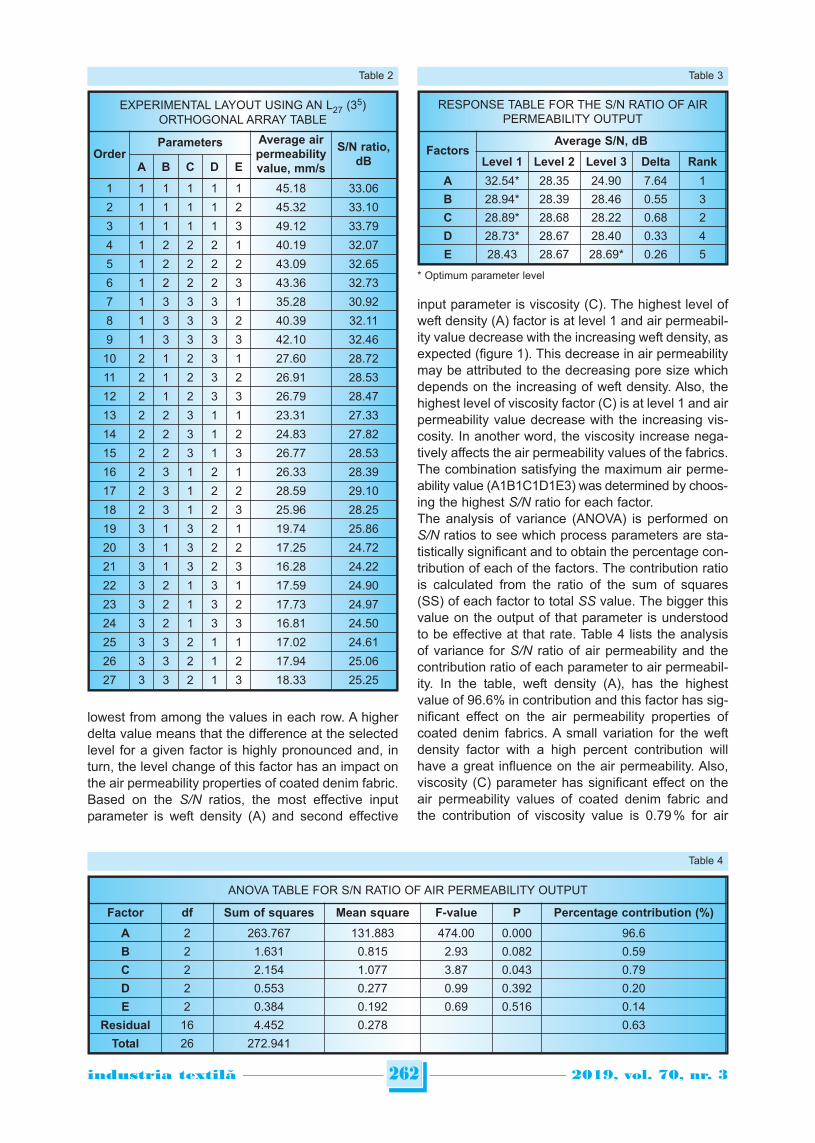
lowest from among the values in each row. A higherdelta value means that the difference at the selectedlevel for a given factor is highly pronounced and, inturn, the level change of this factor has an impact onthe air permeability properties of coated denim fabric.Based on the S/N ratios, the most effective inputparameter is weft density (A) and second effective
input parameter is viscosity (C). The highest level ofweft density (A) factor is at level 1 and air permeabil-ity value decrease with the increasing weft density, asexpected (figure 1). This decrease in air permeabilitymay be attributed to the decreasing pore size whichdepends on the increasing of weft density. Also, thehighest level of viscosity factor (C) is at level 1 and airpermeability value decrease with the increasing vis-cosity. In another word, the viscosity increase nega-tively affects the air permeability values of the fabrics.The combination satisfying the maximum air perme-ability value (A1B1C1D1E3) was determined by choos -ing the highest S/N ratio for each factor.The analysis of variance (ANOVA) is performed onS/N ratios to see which process parameters are sta-tistically significant and to obtain the percentage con-tribution of each of the factors. The contribution ratiois calculated from the ratio of the sum of squares(SS) of each factor to total SS value. The bigger thisvalue on the output of that parameter is understoodto be effective at that rate. Table 4 lists the analysisof variance for S/N ratio of air permeability and thecontribution ratio of each parameter to air permeabil-ity. In the table, weft density (A), has the highestvalue of 96.6% in contribution and this factor has sig-nificant effect on the air permeability properties ofcoated denim fabrics. A small variation for the weftdensity factor with a high percent contribution willhave a great influence on the air permeability. Also,viscosity (C) parameter has significant effect on theair permeability values of coated denim fabric andthe contribution of viscosity value is 0.79 % for air
262industria textila 2019, vol. 70, nr. 3˘
ANOVA TABLE FOR S/N RATIO OF AIR PERMEABILITY OUTPUT
Factor df Sum of squares Mean square F-value P Percentage contribution (%)
A 2 263.767 131.883 474.00 0.000 96.6B 2 1.631 0.815 2.93 0.082 0.59C 2 2.154 1.077 3.87 0.043 0.79D 2 0.553 0.277 0.99 0.392 0.20E 2 0.384 0.192 0.69 0.516 0.14
Residual 16 4.452 0.278 0.63Total 26 272.941
Table 4
EXPERIMENTAL LAYOUT USING AN L27 (35)ORTHOGONAL ARRAY TABLE
OrderParameters Average air
permeabilityvalue, mm/s
S/N ratio,dBA B C D E
1 1 1 1 1 1 45.18 33.06
2 1 1 1 1 2 45.32 33.10
3 1 1 1 1 3 49.12 33.79
4 1 2 2 2 1 40.19 32.07
5 1 2 2 2 2 43.09 32.65
6 1 2 2 2 3 43.36 32.73
7 1 3 3 3 1 35.28 30.92
8 1 3 3 3 2 40.39 32.11
9 1 3 3 3 3 42.10 32.46
10 2 1 2 3 1 27.60 28.72
11 2 1 2 3 2 26.91 28.53
12 2 1 2 3 3 26.79 28.47
13 2 2 3 1 1 23.31 27.33
14 2 2 3 1 2 24.83 27.82
15 2 2 3 1 3 26.77 28.53
16 2 3 1 2 1 26.33 28.39
17 2 3 1 2 2 28.59 29.10
18 2 3 1 2 3 25.96 28.25
19 3 1 3 2 1 19.74 25.86
20 3 1 3 2 2 17.25 24.72
21 3 1 3 2 3 16.28 24.22
22 3 2 1 3 1 17.59 24.90
23 3 2 1 3 2 17.73 24.97
24 3 2 1 3 3 16.81 24.50
25 3 3 2 1 1 17.02 24.61
26 3 3 2 1 2 17.94 25.06
27 3 3 2 1 3 18.33 25.25
Table 2
RESPONSE TABLE FOR THE S/N RATIO OF AIRPERMEABILITY OUTPUT
FactorsAverage S/N, dB
Level 1 Level 2 Level 3 Delta Rank
A 32.54* 28.35 24.90 7.64 1B 28.94* 28.39 28.46 0.55 3C 28.89* 28.68 28.22 0.68 2D 28.73* 28.67 28.40 0.33 4E 28.43 28.67 28.69* 0.26 5
Table 3
* Optimum parameter level
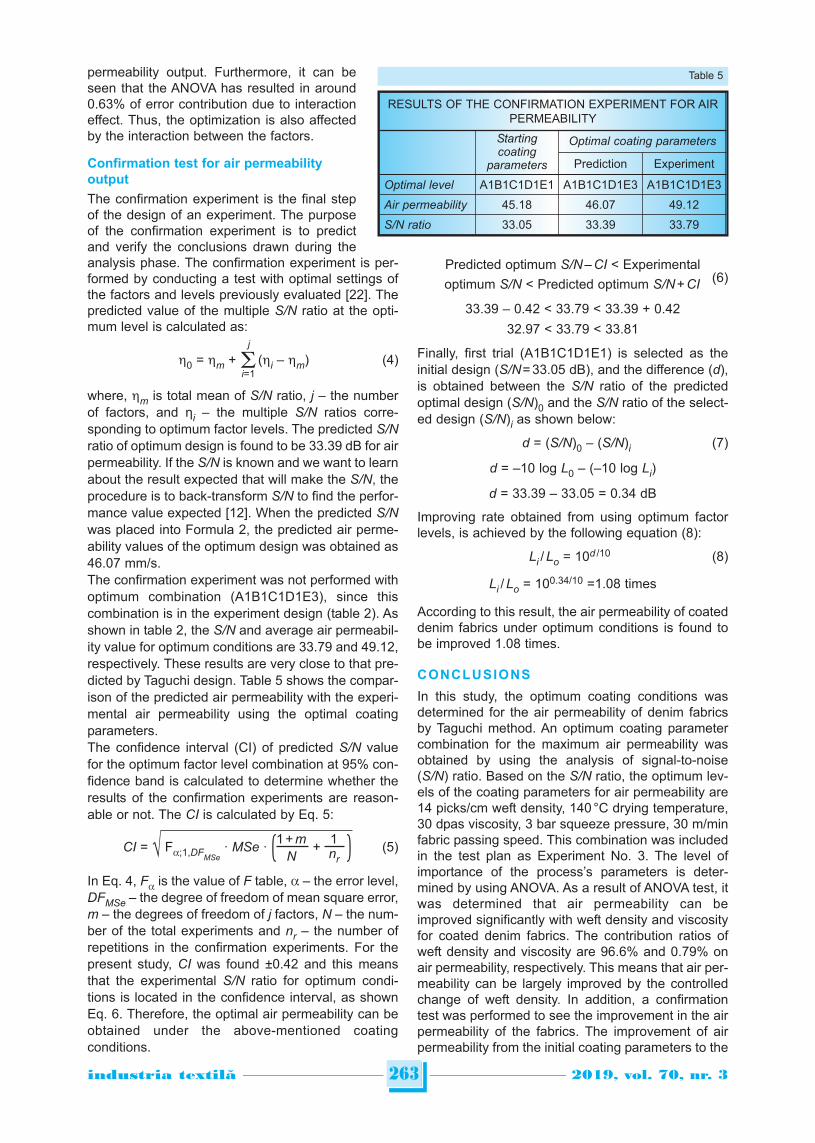
permeability output. Furthermore, it can beseen that the ANOVA has resulted in around0.63% of error contribution due to interactioneffect. Thus, the optimization is also affectedby the interaction between the factors.
Confirmation test for air permeabilityoutput
The confirmation experiment is the final stepof the design of an experiment. The purposeof the confirmation experiment is to predictand verify the conclusions drawn during theanalysis phase. The confirmation experiment is per-formed by conducting a test with optimal settings ofthe factors and levels previously evaluated [22]. Thepredicted value of the multiple S/N ratio at the opti-mum level is calculated as:
j
h0 = hm + (hi – hm) (4)i=1
where, hm is total mean of S/N ratio, j – the numberof factors, and ηi – the multiple S/N ratios corre-sponding to optimum factor levels. The predicted S/Nratio of optimum design is found to be 33.39 dB for airpermeability. If the S/N is known and we want to learnabout the result expected that will make the S/N, theprocedure is to back-transform S/N to find the perfor-mance value expected [12]. When the predicted S/Nwas placed into Formula 2, the predicted air perme-ability values of the optimum design was obtained as46.07 mm/s.The confirmation experiment was not performed withoptimum combination (A1B1C1D1E3), since thiscombination is in the experiment design (table 2). Asshown in table 2, the S/N and average air permeabil-ity value for optimum conditions are 33.79 and 49.12,respectively. These results are very close to that pre-dicted by Taguchi design. Table 5 shows the compar-ison of the predicted air permeability with the experi-mental air permeability using the optimal coatingparameters. The confidence interval (CI) of predicted S/N valuefor the optimum factor level combination at 95% con-fidence band is calculated to determine whether theresults of the confirmation experiments are reason-able or not. The CI is calculated by Eq. 5:
1 + m 1CI = √ Fa;1,DFMSe
∙ MSe ∙ ( + ) (5)N nr
In Eq. 4, Fa is the value of F table, a – the error level,DFMSe – the degree of freedom of mean square error,m – the degrees of freedom of j factors, N – the num-ber of the total experiments and nr – the number ofrepetitions in the confirmation experiments. For thepresent study, CI was found ±0.42 and this meansthat the experimental S/N ratio for optimum condi-tions is located in the confidence interval, as shownEq. 6. Therefore, the optimal air permeability can beobtained under the above-mentioned coatingconditions.
Predicted optimum S/N– CI < Experimentaloptimum S/N < Predicted optimum S/N+ CI (6)
33.39 – 0.42 < 33.79 < 33.39 + 0.4232.97 < 33.79 < 33.81
Finally, first trial (A1B1C1D1E1) is selected as theinitial design (S/N= 33.05 dB), and the difference (d),is obtained between the S/N ratio of the predictedoptimal design (S/N)0 and the S/N ratio of the select-ed design (S/N)i as shown below:
d = (S/N)0 – (S/N)i (7)
d = –10 log L0 – (–10 log Li)
d = 33.39 – 33.05 = 0.34 dB
Improving rate obtained from using optimum factorlevels, is achieved by the following equation (8):
Li /Lo = 10d /10 (8)
Li /Lo = 100.34/10 =1.08 times
According to this result, the air permeability of coateddenim fabrics under optimum conditions is found tobe improved 1.08 times.
CONCLUSIONS
In this study, the optimum coating conditions wasdetermined for the air permeability of denim fabricsby Taguchi method. An optimum coating parametercombination for the maximum air permeability wasobtained by using the analysis of signal-to-noise(S/N) ratio. Based on the S/N ratio, the optimum lev-els of the coating parameters for air permeability are14 picks/cm weft density, 140 °C drying temperature,30 dpas viscosity, 3 bar squeeze pressure, 30 m/minfabric passing speed. This combination was includedin the test plan as Experiment No. 3. The level ofimportance of the process’s parameters is deter-mined by using ANOVA. As a result of ANOVA test, itwas determined that air permeability can beimproved significantly with weft density and viscosityfor coated denim fabrics. The contribution ratios ofweft density and viscosity are 96.6% and 0.79% onair permeability, respectively. This means that air per-meability can be largely improved by the controlledchange of weft density. In addition, a confirmationtest was performed to see the improvement in the airpermeability of the fabrics. The improvement of airpermeability from the initial coating parameters to the
263industria textila 2019, vol. 70, nr. 3˘
RESULTS OF THE CONFIRMATION EXPERIMENT FOR AIRPERMEABILITY
Startingcoating
parameters
Optimal coating parameters
Prediction Experiment
Optimal level A1B1C1D1E1 A1B1C1D1E3 A1B1C1D1E3
Air permeability 45.18 46.07 49.12
S/N ratio 33.05 33.39 33.79
Table 5
predicted optimal coating parameters was foundabout 1.08 times. Moreover, it is seen that Taguchimethod is a promising approach for optimizing coat-
ing process parameters of denim fabrics to meetmaximum air permeability, with a very limited numberof experiments and short time.
264industria textila 2019, vol. 70, nr. 3˘
BIBLIOGRAPHY
[1] Paul, R. Denim manufacture, finishing and applications, In: Woodhead Publishing Series in Textiles, Number 164,Elsevier, 2015, pp. 1–599.
[2] Sen, A. K. Coated textiles principles and applications, In: Copyright 2008 by Taylor and Francis Group, LLC,International Standard Book Number-13: 978-1-4200-5345-6, 2008, pp. 1–230.
[3] Smith, W. C. Smart textile coatings and laminates, In: Woodhead Publishing Series in Textiles: Number 90, TheTextile Institute and Woodhead Publishing Limited, CRC Press LLC, 2010, pp. 1–304.
[4] Giessmann, A. Coating substrates and textiles, In: A Practical Guide to Coating and Laminating Technologies,Coatema Coating Machinery GmbH, Dormagen, Germany, 2012, pp. 1–243.
[5] Ogulata, R. T., Mezarcioz, S. M. Optimization of air permeability of knitted fabrics with the Taguchi approach, In:The Journal of The Textile Institute, 2011, Vol. 102, No. 5, pp. 395–404.
[6] Gunes, S., Manay, E., Senyigit, E. and Ozceyhan, V. A Taguchi approach for optimization of design parameters ina tube with coiled wire inserts, In: Applied Thermal Engineering, 2011, 31, pp. 2568–2577.
[7] Lai, H., Chang, Y. and Chang H., A robust design approach for enhancing the feeling quality of a product: a carprofile case study, In: International Journal of Industrial Ergonomics, 2004, Volume 35, Issue 5, pp. 445–460.
[8] Jung, J. J., Kim, S., Park, C. K. Optimization of digital textile printing process using Taguchi method, In: Journal ofEngineered Fibers and Fabrics, 2016, Volume 11, Issue 2, pp. 51–59.
[9] Maqsood, M., Hussain, T., Ahmad, N., and Hawab Y. Multi-response optimization of mechanical and comfortproperties of bi-stretch woven fabrics using grey relational analysis in Taguchi method, In: The Journal of The TextileInstitute, 2017, 108:5, pp. 794–802.
[10] Nassif, G.A. Using Taguchi methodology to optimize woven fabrics air permeability, In: Journal of Textile Science &Engineering, 2017, Volume 7, Issue 6, pp. 2–4.
[11] Ahmad, N., Kamal, S., Raza, Z. A., Hussain, T., Anwar, F. Multi-response optimization in the development of oleo-hydrophobic cotton fabric using Taguchi based grey relational analysis, In: Applied Surface Science, 2016, 367,pp. 370–381.
[12] Mavruz, S., Ogulata, R.T. Taguchi approach for the optimisation of the bursting strength of knitted fabrics, In: Fibres& Textiles in Eastern Europe 2010, Vol. 18, No. 2 (79) pp. 78–83.
[13] Shabaridharan K., Das, A. Analysis of thermal properties of multilayered fabrics by full factorial and Taguchi method,In: The Journal of The Textile Institute, 2014, Vol. 105, No. 1, pp. 29–41.
[14] Pundir, R., Chary, G.H.V.C., Dastidar, M.G. Application of Taguchi method for optimizing the process parameters forthere moval of copper and nickel by growing Aspergillus sp., In: Water Resources and Industry, 2016,http://dx.doi.org/10.1016/j.wri.2016.05.001.
[15] Yang, W. H., Tarng, Y. S. Design optimization of cutting parameters for turning operations based on the Taguchimethod, In: Journal of Materials Processing Technology, 1998, 84, pp. 122–129.
[16] Babayiğit, B., Şenyiğit, E. Design optimization of circular antenna arrays using Taguchi method, In: NeuralComputing & Applications, 2017, vol. 28, pp.1443–1452.
[17] Babayiğit, B., Şenyiğit, E., Mumcu, G. Optimum broadband E-patch antenna design with Taguchi method, In:Journal of Electromagnetıc Waves And Applications, 2016, vol. 30, pp. 915–927.
[18] Şenyiğit, E., Aydın, M.E., Düğenci, M., Zeydan, M. Heuristic-based neural networks for stochastic dynamic lot sizingproblem, In: Applied Soft Computing, 2013, vol. 13, no. 3, pp. 1332–1339.
[19] Yildiz, Y.Ş., Şenyiğit, E., İrdemez, Ş. Optimization of specific energy consumption for Bomaplex Red Cr-L dyeremoval from aqueous solution by electrocoagulation using Taguchi-neural method, In: Neural Computing &Applıcations, 2013, vol. 23, no. 3-4, pp. 1061–1069.
[20] Khosla, A., Kumar, S., Aggarwalk, K. K. Identification of strategy parameters for particle swarm optimizer throughTaguchi method, In: J Zhejiang Univ SCIENCE A, 2006, 7(12):1989–1994.
[21] Ionesi, S. D., Dumitraş, C., Fangueıro, R., Ursache, M., Cıobanu, L., Dulgherıu, I. Evaluation of impact behaviourof composite materials using Taguchi method, In: Industria Textila, 2014, vol. 65, nr. 3, pp. 153–157.
[22] Tosun, N., Cogun, C. and Tosun, G. A study on kerf and material removal rate in wire electrical discharge machiningbased on Taguchi method, In: Journal of Materials Processing Technology, 2015, 152, pp. 316–322.
Authors:
SÜMEYYE ÜSTÜNTAĞHÜSEYİN GAZİ TÜRKSOY
Department of Textile Engineering, Erciyes University, 38039, Kayseri, Turkey
e-mail: [email protected]; [email protected]
Corresponding author:
SÜMEYYE ÜSTÜNTAĞ
INTRODUCTION
Over the last decades, the textile industry has devel-oped a broad process of globalization that has led itsfirms to develop a robust network of internationalrelations and extend their processes around theworld [1]. Despite this scenario, the importance oflocal relations in localised textile clusters has not lostvalue, allowing their companies to improve theirknowledge bases and innovation capabilities [2]. Theeffective management of this knowledge intensive“global context” [3] can help textile firms to improvetheir competitiveness and adapt to future challenges.The importance of collaborative knowledge networksin regional clusters has been highlighted by numer-ous research contributions [4–5]. These studies empha-sized the importance of the territory, which through itscollaborative and localized networks, influencedfirms’ innovative behaviour and performance. Forexample, Signorini [6] in the Italian textile industrialclusters of Prato and Biella revealed the existence of
productivity and profit differentials in favour of firmsbelonging to these clusters compared to non-clusterfirms. However, in recent years, literature has ques-tioned this view, carrying out a “relational turn” [7] andfocusing more on established linkages and networksthan on geography per se [8]. This change implies afocus on the firm itself and its set of relationshipsrather than on the territory, highlighting that it is theseactors and elements that make it possible to gener-ate their regional environments [9].This relational turn has generated an importantdebate in economic geography, helping to overcomethe limitations of previous research work. Among themost relevant questions addressed and still beingunravelled, we may find those related to the way inwhich the nature of networks impacts on the eco-nomic development of regional clusters [8]. In gener-al, scholars have supported the idea that interorgani-zational networks are a key factor for firms’ innova- tion in clusters [10–12]. However, existing empirical
Unravelling the effects of interorganizational networkson innovation in the textile industry. The case of the Valencian
cluster in Spain
DOI: 10.35530/IT.070.03.1575
JOSÉ-VICENTE TOMÁS-MIQUEL GABRIEL BRĂTUCUMANUEL EXPÓSITO-LANGA OANA BĂRBULESCU
REZUMAT – ABSTRACT
Studiu privind efectele rețelelor interorganizaționale asupra inovării din industria textilă.Cazul unui cluster din Valencia, Spania
Cercetătorii au susținut ideea că rețelele interorganizaționale prin care se transmit fluxurile de cunoștințe în cadrul unuicluster reprezintă un factor-cheie al inovării pentru firmele din cluster. Cu toate acestea, dovezile empirice existentesugerează că, în timp ce aceste rețele pot spori performanța inovatoare a firmelor, nu toate legăturile create în cadrulrețelei influențează în aceeași măsură. Plecând de la acestă premisă, lucrarea urmărește să exploreze modul în careimplicarea firmelor în rețelele de afaceri și în cele de cunoștințe tehnice influențează inovarea în cadrul unui cluster textilspaniol. Rezultatele relevă o influență pozitivă asupra rezultatelor inovative exercitate doar de legăturile create întrefirmele care fac shimburi de cunoștințe tehnice în cadrul clusterului. Aceste constatări oferă informații relevante în scopulrealizării unui management eficient al rețelelor teritoriale la nivelul firmelor și pentru o mai bună definire a politicilorindustriale adoptate în cadrul clusterelor textile.
Cuvinte-cheie: rețea de cunoștințe în afaceri, clustere, inovare, relații interorganizaționale, rețea de cunoștințe tehnice,industria textilă
Unravelling the effects of interorganizational networks on innovation in the textile industry.The case of the Valencian cluster in Spain
Scholars have supported the idea that interorganizational knowledge networks are a key factor for firms’ innovation inclusters. Yet, existing empirical evidence suggests that, while networks can enhance firms’ innovative performance, not allnetwork linkages influence to the same extent. On this basis, this paper aims to explore in a Spanish textile cluster howthe involvement in business and technical knowledge networks influences textile firms’ innovation. The results reveal theinfluence of the firms’ connectedness to the cluster knowledge network on their innovative results, although only in thecase of the technical knowledge network. These findings provide relevant insights for an efficient management of territorialnetworks at the firm level and for a better definition of textile clusters’ industrial policies.
Keywords: business knowledge network, clusters, innovation, interorganizational relationships, technical knowledgenetwork, textile industry
265industria textila 2019, vol. 70, nr. 3˘
evidence suggests that although networks canenhance innovation processes, not all network ties orstructures do so equally [13–14]. In this sense, theinvolvement of firms in the cluster business and tech-nical knowledge networks may have a different influ-ence on their performance. In addition, the specificcharacteristics of certain industrial sectors may deter-mine the presence of such networks and their influ-ence on the firms’ innovation performance. The textile industry has undergone a remarkable pro-cess of modernization in recent years through theacquisition of new knowledge to face the new chal-lenges of the global competitive scenario. Thus, tex-tile firms, especially those in the more advancedeconomies, have increased the development of inno-vative products in new market niches thanks in partto the development of an appropriate portfolio ofknowledge relationships.Challenged by the above theoretical premises andthe absence in the literature of unambiguous evi-dence on the impact of networks on innovation, thispaper aims to explore in textile industrial clusters howthe involvement in business and technical knowledgenetworks influences the innovation performance oftextile firms. To address this research question, theempirical study draws on a sample of 92 firmsbelonging to the textile industrial cluster of Valencia,located in one of the most important industrial areasin the eastern Spain.This paper is structured as follows: first, theoreticalfoundations upon which the research is based arediscussed. Research hypotheses are defined withinthis section. Next, the research design and theresults of the empirical study are described. Lastly,main conclusions are presented along with the limita-tions of the work.
THEORETHICAL FRAMEWORK AND RESEARCHHYPOTHESES
In the new globalised environment, textile companiesare under enormous pressure from the competitivecontext and fashion retailers and distributors, ques-tioning their capacity to survive and carry out theiractivities efficiently [15]. While some textile compa-nies in cluster have relied on strategies focusing onrelocating activities to low-cost countries and reduc-ing prices, more resilient companies have promotedfunctional and inter-sectoral improvement strategies[16]. In this sense, these textile companies havetaken on new, higher value-added functions in theiractivities, such as R&D, design or marketing. In addi-tion, they have also sought synergies with other sec-tors by expanding their product range, for examplethrough the development of new technical textilesfor the car, construction or health industries, amongothers.Textile firms’ worldwide competitiveness increasinglytends to be grounded on a unique collection of assetsand capabilities developed by each company overtime through internal resources and also externalsources, especially those closely related to the cluster.
Thus, thanks to their frequent grouping in clusters,textile firms can access new external sources ofknowledge and upgrade their knowledge base andcompetitive advantage through multiple collaborativenetworks [17]. Numerous contributions have pointed out the pres-ence in clusters of a multiple set of overlapping net-works [8, 18]. In particular, the literature emphasizesthe existence mainly of a business knowledge net-work (BKN) and a technical knowledge network(TKN).According to Giuliani, the BKN can be defined as theset of relationships established by cluster firms whenthey interact on issues related to their business [8].Business knowledge networks appear in cluster con-texts thanks to the frequent occurrence of market,social and institutional relationships [11]. The trade inraw or semi-processed materials, membership of thesame local associations or the attendance at socialevents in the local context are examples of thesetypes of relationships.On the other hand, the TKN deals more with techni-cal knowledge as well as the resolution of problemswithin the firm. More concretely, the TKN is definedas the informal and unplanned network that linksfirms through the knowledge transfer, aimed at thesolution of complex technical problems promoted bythe local community of technicians and entrepreneurs[8].The BKN structurally differs from the TKN [11]. Whilethe BKN is extensive, allowing a large number ofcluster firms to be linked together, the TKN is selec-tive because it sties are unevenly distributed [8].Therefore, the BKN is expected to be denser thanTKN.The literature agrees with the positive influence ofcluster networks on innovation [19–20]. Yet, as sug-gested by different authors, not all network linkageshave the same influence [13–14]. The type of net-work determines the kind of knowledge acquired.Thus, the knowledge acquired in the BKN differs fromthat obtained in the TKN.On the other hand, knowledge of the cluster is notobtained in a homogeneous way among its compa-nies, thus contributing to the divergent innovativeresults of cluster firms. Among the main characteris-tics of cluster networks and firms that determine theircapability to innovate is the level of network connect-edness. This is defined as the number of ties that acompany maintains in the cluster, allowing it to repre-sent the opportunities it has to obtain new knowl-edge. The literature shows a positive effect of clusternetwork connectedness on firm innovation [21].Therefore, from a multi-network approach in clusters,we expect that the connectedness of cluster firms toboth their BKN and TKN will provide their companieswith new knowledge and skills in different areas thatwill lead them to improve their innovative perfor-mance. In this way, a high level of connectedness tothe BKN is expected to provide firms with new gen-eral information on the business or industry, better
266industria textila 2019, vol. 70, nr. 3˘
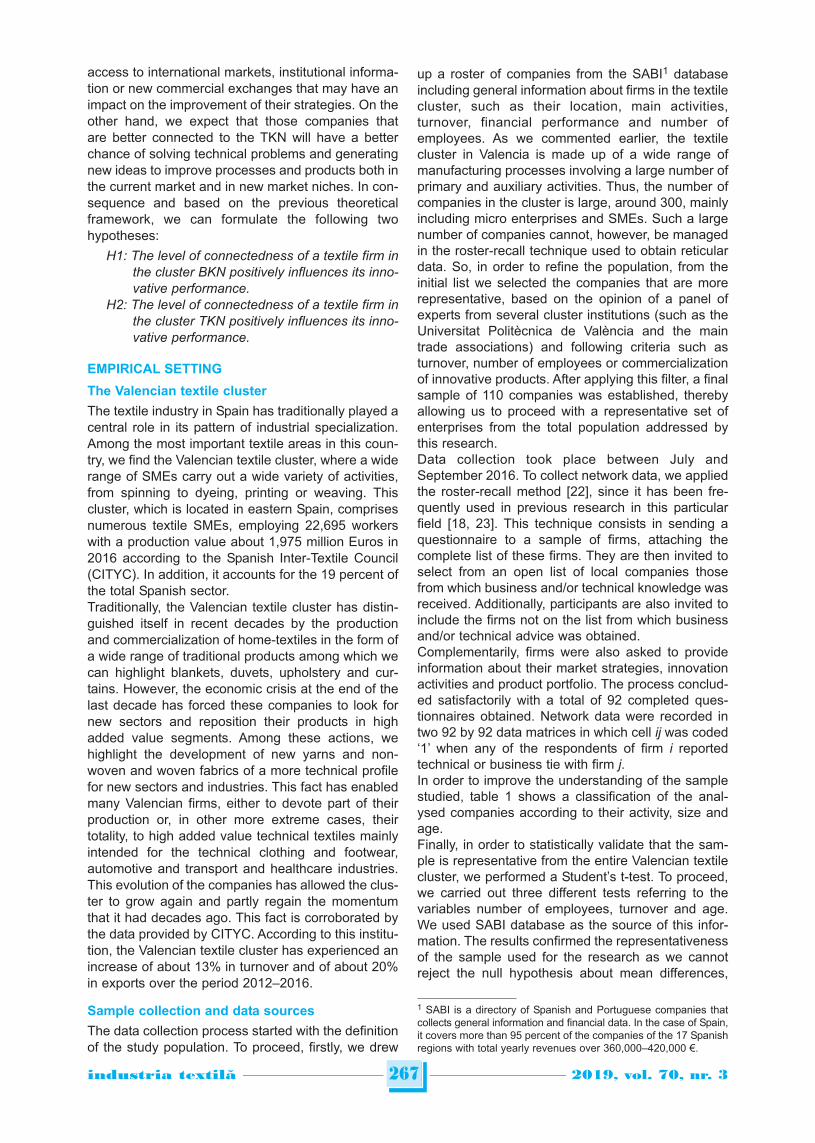
access to international markets, institutional informa-tion or new commercial exchanges that may have animpact on the improvement of their strategies. On theother hand, we expect that those companies thatare better connected to the TKN will have a betterchance of solving technical problems and generatingnew ideas to improve processes and products both inthe current market and in new market niches. In con-sequence and based on the previous theoreticalframework, we can formulate the following twohypotheses:
H1: The level of connectedness of a textile firm inthe cluster BKN positively influences its inno-vative performance.
H2: The level of connectedness of a textile firm inthe cluster TKN positively influences its inno-vative performance.
EMPIRICAL SETTING
The Valencian textile cluster
The textile industry in Spain has traditionally played acentral role in its pattern of industrial specialization.Among the most important textile areas in this coun-try, we find the Valencian textile cluster, where a widerange of SMEs carry out a wide variety of activities,from spinning to dyeing, printing or weaving. Thiscluster, which is located in eastern Spain, comprisesnumerous textile SMEs, employing 22,695 workerswith a production value about 1,975 million Euros in2016 according to the Spanish Inter-Textile Council(CITYC). In addition, it accounts for the 19 percent ofthe total Spanish sector.Traditionally, the Valencian textile cluster has distin-guished itself in recent decades by the productionand commercialization of home-textiles in the form ofa wide range of traditional products among which wecan highlight blankets, duvets, upholstery and cur-tains. However, the economic crisis at the end of thelast decade has forced these companies to look fornew sectors and reposition their products in highadded value segments. Among these actions, wehighlight the development of new yarns and non-woven and woven fabrics of a more technical profilefor new sectors and industries. This fact has enabledmany Valencian firms, either to devote part of theirproduction or, in other more extreme cases, theirtotality, to high added value technical textiles mainlyintended for the technical clothing and footwear,automotive and transport and healthcare industries.This evolution of the companies has allowed the clus-ter to grow again and partly regain the momentumthat it had decades ago. This fact is corroborated bythe data provided by CITYC. According to this institu-tion, the Valencian textile cluster has experienced anincrease of about 13% in turnover and of about 20%in exports over the period 2012–2016.
Sample collection and data sources
The data collection process started with the definitionof the study population. To proceed, firstly, we drew
up a roster of companies from the SABI1 databaseincluding general information about firms in the textilecluster, such as their location, main activities,turnover, financial performance and number ofemployees. As we commented earlier, the textilecluster in Valencia is made up of a wide range ofmanufacturing processes involving a large number ofprimary and auxiliary activities. Thus, the number ofcompanies in the cluster is large, around 300, mainlyincluding micro enterprises and SMEs. Such a largenumber of companies cannot, however, be managedin the roster-recall technique used to obtain reticulardata. So, in order to refine the population, from theinitial list we selected the companies that are morerepresentative, based on the opinion of a panel ofexperts from several cluster institutions (such as theUniversitat Politècnica de València and the maintrade associations) and following criteria such asturnover, number of employees or commercializationof innovative products. After applying this filter, a finalsample of 110 companies was established, therebyallowing us to proceed with a representative set ofenterprises from the total population addressed bythis research.Data collection took place between July andSeptember 2016. To collect network data, we appliedthe roster-recall method [22], since it has been fre-quently used in previous research in this particularfield [18, 23]. This technique consists in sending aquestionnaire to a sample of firms, attaching thecomplete list of these firms. They are then invited toselect from an open list of local companies thosefrom which business and/or technical knowledge wasreceived. Additionally, participants are also invited toinclude the firms not on the list from which businessand/or technical advice was obtained.Complementarily, firms were also asked to provideinformation about their market strategies, innovationactivities and product portfolio. The process conclud-ed satisfactorily with a total of 92 completed ques-tionnaires obtained. Network data were recorded intwo 92 by 92 data matrices in which cell ij was coded‘1’ when any of the respondents of firm i reportedtechnical or business tie with firm j.In order to improve the understanding of the samplestudied, table 1 shows a classification of the anal-ysed companies according to their activity, size andage.Finally, in order to statistically validate that the sam-ple is representative from the entire Valencian textilecluster, we performed a Student’s t-test. To proceed,we carried out three different tests referring to thevariables number of employees, turnover and age.We used SABI database as the source of this infor-mation. The results confirmed the representativenessof the sample used for the research as we cannotreject the null hypothesis about mean differences,
267industria textila 2019, vol. 70, nr. 3˘
1 SABI is a directory of Spanish and Portuguese companies thatcollects general information and financial data. In the case of Spain,it covers more than 95 percent of the companies of the 17 Spanishregions with total yearly revenues over 360,000–420,000 €.
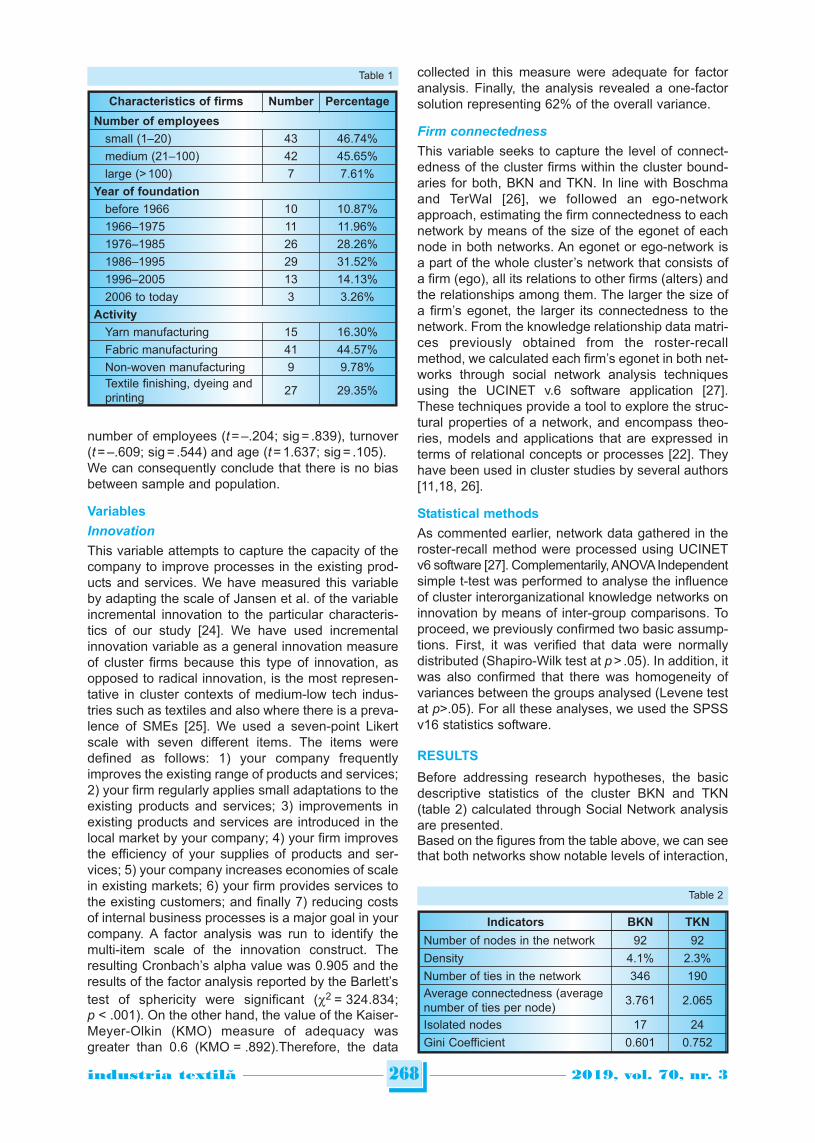
number of employees (t = –.204; sig = .839), turnover(t = –.609; sig = .544) and age (t = 1.637; sig = .105).We can consequently conclude that there is no biasbetween sample and population.
Variables
Innovation
This variable attempts to capture the capacity of thecompany to improve processes in the existing prod-ucts and services. We have measured this variableby adapting the scale of Jansen et al. of the variableincremental innovation to the particular characteris-tics of our study [24]. We have used incrementalinnovation variable as a general innovation measureof cluster firms because this type of innovation, asopposed to radical innovation, is the most represen-tative in cluster contexts of medium-low tech indus-tries such as textiles and also where there is a preva-lence of SMEs [25]. We used a seven-point Likertscale with seven different items. The items weredefined as follows: 1) your company frequentlyimproves the existing range of products and services;2) your firm regularly applies small adaptations to theexisting products and services; 3) improvements inexisting products and services are introduced in thelocal market by your company; 4) your firm improvesthe efficiency of your supplies of products and ser-vices; 5) your company increases economies of scalein existing markets; 6) your firm provides services tothe existing customers; and finally 7) reducing costsof internal business processes is a major goal in yourcompany. A factor analysis was run to identify themulti-item scale of the innovation construct. Theresulting Cronbach’s alpha value was 0.905 and theresults of the factor analysis reported by the Barlett’stest of sphericity were significant (2 = 324.834;p < .001). On the other hand, the value of the Kaiser-Meyer-Olkin (KMO) measure of adequacy wasgreater than 0.6 (KMO = .892).Therefore, the data
collected in this measure were adequate for factoranalysis. Finally, the analysis revealed a one-factorsolution representing 62% of the overall variance.
Firm connectedness
This variable seeks to capture the level of connect-edness of the cluster firms within the cluster bound-aries for both, BKN and TKN. In line with Boschmaand TerWal [26], we followed an ego-networkapproach, estimating the firm connectedness to eachnetwork by means of the size of the egonet of eachnode in both networks. An egonet or ego-network isa part of the whole cluster’s network that consists ofa firm (ego), all its relations to other firms (alters) andthe relationships among them. The larger the size ofa firm’s egonet, the larger its connectedness to thenetwork. From the knowledge relationship data matri-ces previously obtained from the roster-recallmethod, we calculated each firm’s egonet in both net-works through social network analysis techniquesusing the UCINET v.6 software application [27].These techniques provide a tool to explore the struc-tural properties of a network, and encompass theo-ries, models and applications that are expressed interms of relational concepts or processes [22]. Theyhave been used in cluster studies by several authors[11,18, 26].
Statistical methods
As commented earlier, network data gathered in theroster-recall method were processed using UCINETv6 software [27]. Complementarily, ANOVA Independentsimple t-test was performed to analyse the influenceof cluster interorganizational knowledge networks oninnovation by means of inter-group comparisons. Toproceed, we previously confirmed two basic assump-tions. First, it was verified that data were normallydistributed (Shapiro-Wilk test at p > .05). In addition, itwas also confirmed that there was homogeneity ofvariances between the groups analysed (Levene testat p>.05). For all these analyses, we used the SPSSv16 statistics software.
RESULTS
Before addressing research hypotheses, the basicdescriptive statistics of the cluster BKN and TKN(table 2) calculated through Social Network analysisare presented.Based on the figures from the table above, we can seethat both networks show notable levels of interaction,
268industria textila 2019, vol. 70, nr. 3˘
Indicators BKN TKN
Number of nodes in the network 92 92Density 4.1% 2.3%Number of ties in the network 346 190Average connectedness (averagenumber of ties per node) 3.761 2.065
Isolated nodes 17 24Gini Coefficient 0.601 0.752
Table 2
Characteristics of firms Number Percentage
Number of employees
small (1–20) 43 46.74%medium (21–100) 42 45.65%large (> 100) 7 7.61%
Year of foundation
before 1966 10 10.87%1966–1975 11 11.96%1976–1985 26 28.26%1986–1995 29 31.52%1996–2005 13 14.13%2006 to today 3 3.26%
Activity
Yarn manufacturing 15 16.30%Fabric manufacturing 41 44.57%Non-woven manufacturing 9 9.78%Textile finishing, dyeing andprinting 27 29.35%
Table 1
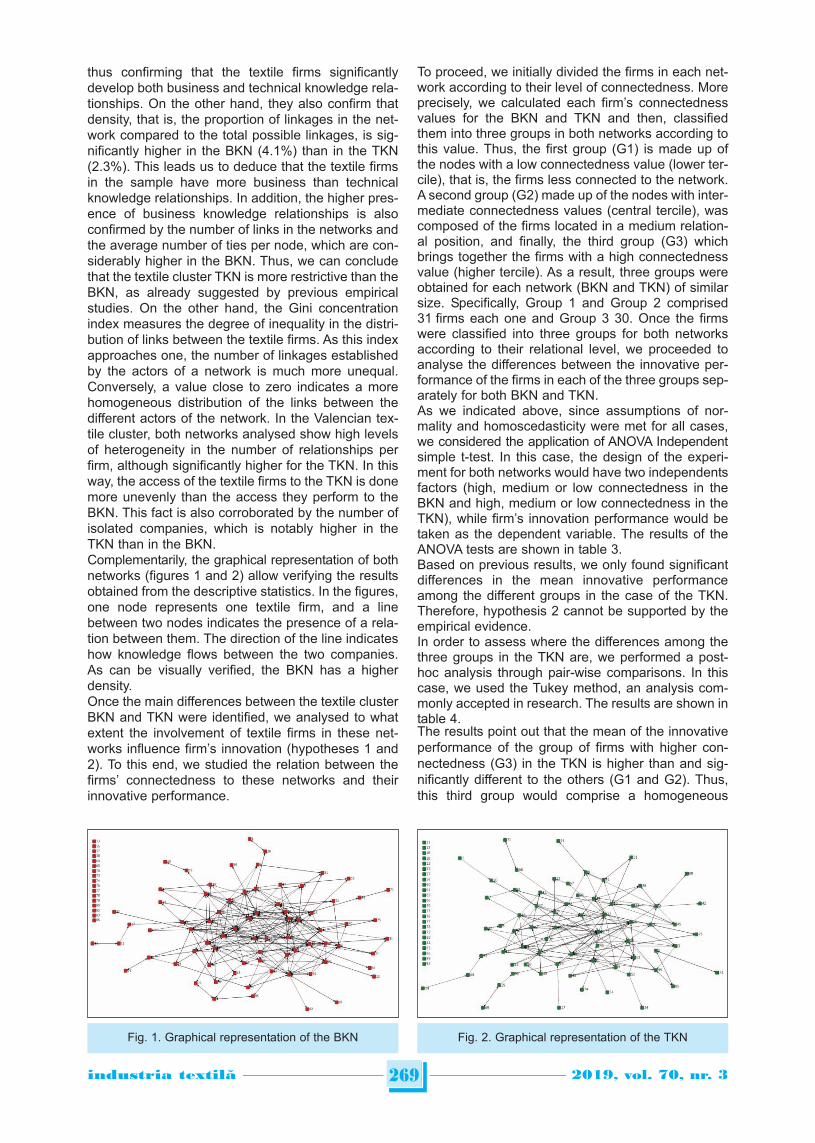
thus confirming that the textile firms significantlydevelop both business and technical knowledge rela-tionships. On the other hand, they also confirm thatdensity, that is, the proportion of linkages in the net-work compared to the total possible linkages, is sig-nificantly higher in the BKN (4.1%) than in the TKN(2.3%). This leads us to deduce that the textile firmsin the sample have more business than technicalknowledge relationships. In addition, the higher pres-ence of business knowledge relationships is alsoconfirmed by the number of links in the networks andthe average number of ties per node, which are con-siderably higher in the BKN. Thus, we can concludethat the textile cluster TKN is more restrictive than theBKN, as already suggested by previous empiricalstudies. On the other hand, the Gini concentrationindex measures the degree of inequality in the distri-bution of links between the textile firms. As this indexapproaches one, the number of linkages establishedby the actors of a network is much more unequal.Conversely, a value close to zero indicates a morehomogeneous distribution of the links between thedifferent actors of the network. In the Valencian tex-tile cluster, both networks analysed show high levelsof heterogeneity in the number of relationships perfirm, although significantly higher for the TKN. In thisway, the access of the textile firms to the TKN is donemore unevenly than the access they perform to theBKN. This fact is also corroborated by the number ofisolated companies, which is notably higher in theTKN than in the BKN.Complementarily, the graphical representation of bothnetworks (figures 1 and 2) allow verifying the resultsobtained from the descriptive statistics. In the figures,one node represents one textile firm, and a linebetween two nodes indicates the presence of a rela-tion between them. The direction of the line indicateshow knowledge flows between the two companies.As can be visually verified, the BKN has a higherdensity. Once the main differences between the textile clusterBKN and TKN were identified, we analysed to whatextent the involvement of textile firms in these net-works influence firm’s innovation (hypotheses 1 and2). To this end, we studied the relation between thefirms’ connectedness to these networks and theirinnovative performance.
To proceed, we initially divided the firms in each net-work according to their level of connectedness. Moreprecisely, we calculated each firm’s connectednessvalues for the BKN and TKN and then, classifiedthem into three groups in both networks according tothis value. Thus, the first group (G1) is made up ofthe nodes with a low connectedness value (lower ter-cile), that is, the firms less connected to the network.A second group (G2) made up of the nodes with inter-mediate connectedness values (central tercile), wascomposed of the firms located in a medium relation-al position, and finally, the third group (G3) whichbrings together the firms with a high connectednessvalue (higher tercile). As a result, three groups wereobtained for each network (BKN and TKN) of similarsize. Specifically, Group 1 and Group 2 comprised31 firms each one and Group 3 30. Once the firmswere classified into three groups for both networksaccording to their relational level, we proceeded toanalyse the differences between the innovative per-formance of the firms in each of the three groups sep-arately for both BKN and TKN. As we indicated above, since assumptions of nor-mality and homoscedasticity were met for all cases,we considered the application of ANOVA Independentsimple t-test. In this case, the design of the experi-ment for both networks would have two independentsfactors (high, medium or low connectedness in theBKN and high, medium or low connectedness in theTKN), while firm’s innovation performance would betaken as the dependent variable. The results of theANOVA tests are shown in table 3.Based on previous results, we only found significantdifferences in the mean innovative performanceamong the different groups in the case of the TKN.Therefore, hypothesis 2 cannot be supported by theempirical evidence.In order to assess where the differences among thethree groups in the TKN are, we performed a post-hoc analysis through pair-wise comparisons. In thiscase, we used the Tukey method, an analysis com-monly accepted in research. The results are shown intable 4.The results point out that the mean of the innovativeperformance of the group of firms with higher con-nectedness (G3) in the TKN is higher than and sig-nificantly different to the others (G1 and G2). Thus,this third group would comprise a homogeneous
269industria textila 2019, vol. 70, nr. 3˘
Fig. 1. Graphical representation of the BKN Fig. 2. Graphical representation of the TKN
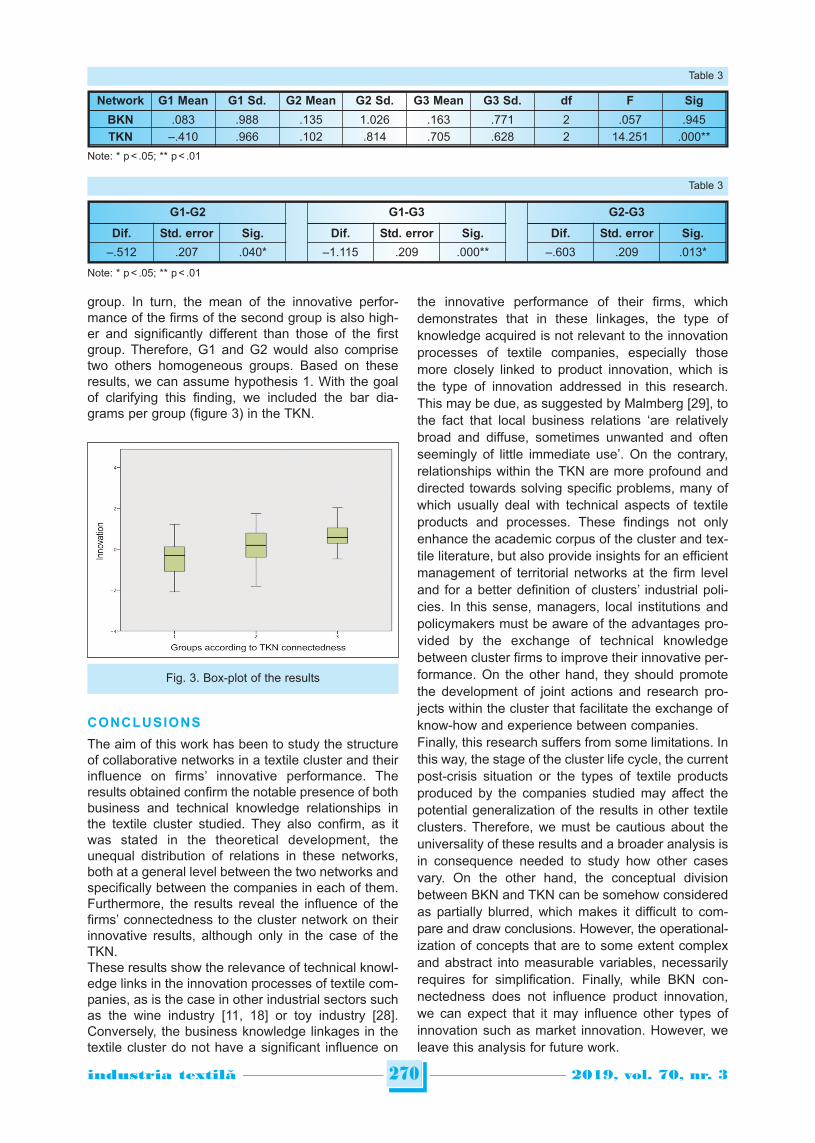
group. In turn, the mean of the innovative perfor-mance of the firms of the second group is also high-er and significantly different than those of the firstgroup. Therefore, G1 and G2 would also comprisetwo others homogeneous groups. Based on theseresults, we can assume hypothesis 1. With the goalof clarifying this finding, we included the bar dia-grams per group (figure 3) in the TKN.
CONCLUSIONS
The aim of this work has been to study the structureof collaborative networks in a textile cluster and theirinfluence on firms’ innovative performance. Theresults obtained confirm the notable presence of bothbusiness and technical knowledge relationships inthe textile cluster studied. They also confirm, as itwas stated in the theoretical development, theunequal distribution of relations in these networks,both at a general level between the two networks andspecifically between the companies in each of them.Furthermore, the results reveal the influence of thefirms’ connectedness to the cluster network on theirinnovative results, although only in the case of theTKN. These results show the relevance of technical knowl-edge links in the innovation processes of textile com-panies, as is the case in other industrial sectors suchas the wine industry [11, 18] or toy industry [28].Conversely, the business knowledge linkages in thetextile cluster do not have a significant influence on
the innovative performance of their firms, whichdemonstrates that in these linkages, the type ofknowledge acquired is not relevant to the innovationprocesses of textile companies, especially thosemore closely linked to product innovation, which isthe type of innovation addressed in this research.This may be due, as suggested by Malmberg [29], tothe fact that local business relations ‘are relativelybroad and diffuse, sometimes unwanted and oftenseemingly of little immediate use’. On the contrary,relationships within the TKN are more profound anddirected towards solving specific problems, many ofwhich usually deal with technical aspects of textileproducts and processes. These findings not onlyenhance the academic corpus of the cluster and tex-tile literature, but also provide insights for an efficientmanagement of territorial networks at the firm leveland for a better definition of clusters’ industrial poli-cies. In this sense, managers, local institutions andpolicymakers must be aware of the advantages pro-vided by the exchange of technical knowledgebetween cluster firms to improve their innovative per-formance. On the other hand, they should promotethe development of joint actions and research pro-jects within the cluster that facilitate the exchange ofknow-how and experience between companies.Finally, this research suffers from some limitations. Inthis way, the stage of the cluster life cycle, the currentpost-crisis situation or the types of textile productsproduced by the companies studied may affect thepotential generalization of the results in other textileclusters. Therefore, we must be cautious about theuniversality of these results and a broader analysis isin consequence needed to study how other casesvary. On the other hand, the conceptual divisionbetween BKN and TKN can be somehow consideredas partially blurred, which makes it difficult to com-pare and draw conclusions. However, the operational-ization of concepts that are to some extent complexand abstract into measurable variables, necessarilyrequires for simplification. Finally, while BKN con-nectedness does not influence product innovation,we can expect that it may influence other types ofinnovation such as market innovation. However, weleave this analysis for future work.
270industria textila 2019, vol. 70, nr. 3˘
G1-G2 G1-G3 G2-G3
Dif. Std. error Sig. Dif. Std. error Sig. Dif. Std. error Sig.
–.512 .207 .040* –1.115 .209 .000** –.603 .209 .013*
Table 3
Note: * p < .05; ** p < .01
Fig. 3. Box-plot of the results
Network G1 Mean G1 Sd. G2 Mean G2 Sd. G3 Mean G3 Sd. df F Sig
BKN .083 .988 .135 1.026 .163 .771 2 .057 .945TKN –.410 .966 .102 .814 .705 .628 2 14.251 .000**
Table 3
Note: * p < .05; ** p < .01
271industria textila 2019, vol. 70, nr. 3˘
BIBLIOGRAPHY
[1] Guerrieri, P., Pietrobelli, C. Industrial districts’ evolution and technological regimes: Italy and Taiwan. In: Technovation,2004, vol. 24, no. 11, pp. 899–914.
[2] Expósito-Langa, M., Molina-Morales, F.X., Tomás-Miquel, J.V. How shared vision moderates the effects of absorptivecapacity and networking on clustered firms’ innovation. In: Scandinavian Journal of Management, 2015, vol. 31, no. 3,pp. 293–302.
[3] Onsager, K., Isaksen, A., Fraas, M., Johnstad, T. Technology cities in Norway: Innovating in glocal networks. In: EuropeanPlanning Studies, 2007, vol. 15, no. 4, pp. 549–566.
[4] Piore, M.J., Sabel, C.F. The second industrial divide: possibility for prosperity, New York, Basic Books, 1984.[5] Camagni, R. Innovation networks: spatial perspectives, London, New York, Belhaven Press, 1991.[6] Signorini, L.F. The price of Prato, or measuring the industrial district effect. In: Papers in Regional Science, 1994, vol. 73,
no. 4, pp. 369–392.[7] Boggs, J.S., Rantisi, N.M. The ‘relational turn’ in economic geography. In: Journal of economic geography, 2003, vol. 3,
no. 2, pp. 109–116.[8] Giuliani, E. Clusters, networks and economic development: an evolutionary economics perspective. The Handbook of
Evolutionary Economic Geography, 2010, pp. 261–279.[9] Bathelt, H., Glückler, J. Toward a relational economic geography. In: Journal of economic geography, 2003, vol. 3, no. 2,
pp. 117–144.[10] Bathelt, H., Malmberg, A., Maskell, P. Clusters and knowledge: local buzz, global pipelines and the process of knowledge
creation. In: Progress in Human Geography, 2004, vol. 28, no. 1, pp. 31–56.[11] Giuliani, E. The selective nature of knowledge networks in clusters: Evidence from the Wine Industry, In: Journal of
Economic Geography, 2007, vol. 7, pp. 139–68.[12] Expósito-Langa, M., Tomás-Miquel, J.V., Molina-Morales, F.X. Innovation in clusters: exploration capacity, network ing
intensity and external resources. In: Journal of Org. Change Management, 2015, vol. 28, no. 1, pp. 26–42.[13] Peng, M. W., Luo., Y. Managerial ties and firm performance in a transition economy: The nature of a micro-macro link. In:
Academy of Management Journal, 2000, vol. 43, no. 3, pp. 486–501.[14] Stam, W., Elfring. T. Entrepreneurial orientation and new venture performance: The Moderating role of intra- and extra-
industry social capital, In: Academy of Management Journal, 2008, vol. 51, no. 1, pp. 97–111.[15] Abernathy, F.H., Volpe, A., Weil, D. The future of the apparel and textile industries: prospects and choices for public and
private actors. In: Environment & Planning A, 2006, vol. 38, no. 12, pp. 2207–32.[16] Humphrey, J., Schmitz, H. How does insertion in global value chains affect upgrading in industrial clusters?. In: Regional
studies, 2002, vol. 36, no. 9, pp. 1017–1027.[17] Dahl, M.S., Pedersen, C.Ø.R. Knowledge flows through informal contacts in industrial clusters: myth or reality?. In:
Research Policy, 2004, vol. 33, pp. 1673–1686.[18] Morrison, A., Rabellotti, R. Knowledge and information networks in an Italian wine cluster, In: European Planning Studies,
2009, vol. 17, pp. 983–1006.[19] Coombs, J., Deeds, D., Ireland., R. Placing the choice between exploration and exploitation in context: A study of
geography and new product development. In: Strategic Entrepreneurship Journal, 2009, vol. 3, no. 3, pp. 261–279.[20] Schilling, M.A., Phelps, C.C. Interfirm collaboration networks: The impact of large-scale network structure on firm
innovation. In: Management Science, 2007, vol. 53, no. 7, pp. 1113–1126.[21] Bell, G.G. Clusters, networks, and firm innovativeness. In: Strategic Management Journal, 2005, vol. 26, no. 3, pp. 287–95.[22] Wasserman, S., Faust, K. Social network analysis. Methods and applications, Cambridge, Cambridge University Press,
1994.[23] Giuliani, E., Bell, M. The Micro-determinants of meso-level learning and innovation: Evidence from a Chilean wine cluster,
In: Research Policy, 2005, vol. 34, no. 1, pp. 47–68.[24] Jansen, J.J., Van Den Bosch, F.A., Volberda, H.W. Exploratory innovation, exploitative innovation, and performance:
Effects of organizational antecedents and environmental moderators, In: Management Science, 2006, vol. 52, no. 11,pp. 1661–1674.
[25] Forsman, H., Annala, U. Small enterprises as innovators: Shift from a low performer to a high performer, In: InternationalJournal of Technology Management, 2011, vol. 56, no. 2/3/4, pp. 154–171.
[26] Boschma, R.A., TerWal, A.L.J. Knowledge networks and innovative performance in an industrial district: the case of afootwear district in the South of Italy, In: Industry & Innovation, 2007, vol. 14, no. 2, pp. 77–199.
[27] Borgatti, S.P., Everett, M.G., Freeman, L.C. Ucinet for Windows: Software for Social Network Analysis, AnalyticTechnologies, Natick, MA, 2002.
[28] Morrison, A. The Dynamics of Technical and Business Networks in Industrial Clusters: Embeddedness, status or proximity?35th DRUID Conference, 2013, Barcelona, Spain, June 17–19.
[29] Malmberg, A. Beyond the cluster – local milieus and global economic connections. In: Remaking the Global Economy,2003, pp. 145–59.
Authors:
JOSÉ-VICENTE TOMÁS-MIQUEL1, MANUEL EXPÓSITO-LANGA1, GABRIEL BRĂTUCU2, OANA BĂRBULESCU2
1Universitat Politècnica de València, Business Administration Department, 03801, Alcoy, Spain2Transilvania University of Brașov, Faculty of Economic Sciences and Business Administration,
500036, Brașov, Romaniae-mail: [email protected], [email protected], [email protected], [email protected]
Corresponding author:
OANA BĂRBULESCU e-mail: [email protected]
INTRODUCTION
Financial performance assessment is currently animportant topic among managers, shareholders,investors, creditors, financial analysts and alsoresearchers. Numerous theoretical and practical arti-cles present different ways to measure the financialperformance, for many and diverse sectors, for exam-ple: iron and steel industry [1], manufacturing [2],agriculture [3], retail [4], hotels industry [5], trans-portation [3, 6], financial investments, banks [7–8],insurance companies [9].The necessity for man-agers, investors, business partners and financialanalysts is that these methods must be more effi-ciently, easy to apply, and show the real financial per-formance in order to make decisions for increase theperformance, develop activity or avoid bankruptcy, tomake good and profitable investments, to choose sol-vent business partners and realize a hierarchy andcomparative analysis of the firms acting in a sector,
and/or a certain period. The evaluation of financialperformance depends on the accuracy of accountinginformation.The quality of accounting information can reduce afirm’s exposure to systematic liquidity risk and canaffect firm valuation and cost-of-capital through theirimpact on different aspects of liquidity, especiallywhen some events (e.g. financial crisis) may arise.Thus is confirmed the important role of accountinginformation during liquidity events [10]. The use ofproper accounting information and analytic tech-niques can help a tolerated union of necessitybetween revenue management programs and firmstrategy [11] that can increase financial performanceof firms. After analysing various studies performed bytheorists in the field [12–13] we concluded that theaccounting information in an enterprise foresees thecritical decisions that influence the decision to facili-tate information for management control as well. We
272industria textila 2019, vol. 70, nr. 3˘
Evaluating firms’ financial performance in textile industry of Romania
DOI: 10.35530/IT.070.03.1398
TEODOR HADA NICOLETA BĂRBUŢĂ-MIŞU TEODORA MARIA AVRAM
REZUMAT – ABSTRACT
Evaluarea performanței financiare a firmelor din industria textilă din România
Evaluarea performanței financiare a unei firme sau a unui sector este o problemă importantă pentru managerii, investitoriiși partenerii de afaceri. Informațiile de bază utilizate pentru evaluarea performanței financiare se găsesc în situațiilefinanciare. Precizia metodei utilizate pentru această evaluare depinde de exactitatea situațiilor financiare furnizate de firmecare reflectă activitatea desfășurată. În această lucrare propunem un indice agregat pentru evaluarea performanțeifinanciare, pe baza a 11 rate financiare selectate. Metoda a fost aplicată pe un eșantion de 82 de întreprinderi mijlocii careactivează în sectorul textil din România. Industria textilă este o industrie cu tradiție și un sector important al economieiromânești, atât în ceea ce privește contribuția la produsul intern brut, cât și creșterea exporturilor; a suferit în ultimii 20 deani o perioadă dificilă de transformare și adaptare la o piață în schimbare, dar are un avantaj competitiv raportat la celeuropean, în principal datorită forței de muncă cu costuri reduse. Rezultatele cercetării arată ierarhia firmelor din sectorultextil în funcție de scorul performanței financiare, 42,68% dintre firme având un scor mai mare decât media sectorului.Rezultatele sunt utile, în special pentru manageri, prin îmbunătățirea procesului de luare a deciziilor privind finanțarea șidezvoltarea afacerilor, prognozarea viitoarei performanțe financiare, selectarea parte nerilor de afaceri, realizarea deinvestiții profitabile, dar și pentru analiștii financiari în îndeplinirea obiectivelor de afaceri.
Cuvinte-cheie: informații contabile, luarea deciziilor; indice agregat, scorul ferm, întreprinderi mijlocii
Evaluating firms’ financial performance in textile industry of Romania
Assessing the financial performance of a firm or sector is an important issue for managers, investors and businesspartners. The basic information used for financial performance assessment is found in financial statements. The accuracyof the method used for this evaluation depends on the accuracy of financial statements provided by firms that reflect theactivity developed. In this paper we propose an aggregated index for evaluation the financial performance, based on11 selected financial rates. The method was applied on a sample of 82 medium-sized companies acting in the Romaniantextile sector. Textile industry is an industry with tradition and an important sector of Romanian economy, both in terms ofthe contribution to gross domestic product and export growth; it has undergone in the last 20 years a difficult period oftransformation and adaptation to a changing market, but has a competitive advantage reported to the European one,mainly due to low-cost labour force. The research results show the hierarchy of the textile firms after financial performancescore, 42.68% of firms having a score above sector average. The results are useful, especially to managers, by improvingdecision making of business funding and development, forecasting the future financial performance, selecting businesspartners, making profitable investments, and to financial analysts in fulfilment of business objectives.
Keywords: accounting information, decision making, aggregated index, firm score, medium-sized firms
note that the accounting information has, as a start-ing point, two different and uneven sources in termsof quality, that information coming as a result of trans-actions carried out on various markets being seenduring the financial year, having a rigorous andobjective character, and that information known atthe end of the year that is largely the result of esti-mates and reflects the accounting policies of theenterprise management. The usefulness of accounting information increases ifit is comparable, verifiable, readily available andunderstandable. Relevance and faithful representa-tion of the accounting information are considered fun-damental qualitative characteristics because it isused for calculation of a wide range of indicators infinancial analysis and diagnosis. The main users ofaccounting information issued in a firm are: currentand potential investors, the firm management,employees, financial and trade creditors, customers,financial analysts, the government and its institutions,and the general public, each of them having specificinterests.Hall considers that managers primarily use account-ing information to develop knowledge of their workenvironment rather than as an input into specificdecision-making scenarios [14]. In this role, account-ing information can help managers to develop knowl-edge to prepare for unknown future decisions andactivities. We know that accounting information is justone part of the wider information set that managersusing to decision making and the quality of decisionsdepend on other sources of information at a manag-er’s disposal. Also, managers interact with informa-tion and other managers utilising and verbal forms ofcommunication that is not based on written reports.For investors, accounting information has a valuationrole, providing investors with information for makinginformed investment decisions, especially in capitalallocation. Private-equity firms require accountinginformation to control the conflicts of interest bothwithin the private-equity firm (between the generaland limited partners) and within their investors.Controlling these conflicts shifts the role of account-ing back toward its original stewardship roots [15].The role of accounting information’s can be viewed inshaping user perceptions by providing new evidencethat the descriptive valence of accounting constructscan impact consumer purchase decisions [16].The aim of this paper is to propose an aggregatedindex for evaluation the financial performance, basedon 11 selected financial rates. The paper also high-lights the role that accounting information holds in afirm in financial decisions making of investors andmanagers, aimed at strengthening of the financialperformance and value of firm. The aggregated indexproposed for evaluation financial performance pro-vides relevant information for stakeholders, investors,business partners, banks or other financial institu-tions, financial analysts, as well for researches thatcan use these indicators in financial analysis,research studies and forecasting activities. Also thisaggregated index can establish a hierarchy of the
companies acting in a certain sector. In this paper, forexperimental part we have chosen the textile industryfrom Romania, which is not discussed in extensivestudies in economics, thus making important contri-butions to the studied field.
METHODOLOGY
In order to make strategic decisions in firms, Mereuţă[17] proposed the CEMATT method that is a multi-cri-teria diagnostic tool for the condition of a firm, basedon 6 components: financial, marketing, technology,quality, general management and human resources[18]. We consider that most of the strategic decisionsin firms are based on accounting information thatunderlies the calculation of financial indicators usedfor assessing the financial performance of firms; thisis key information for managers, investors and credi-tors. We know that financial position of a firm is high-lighted by the relationship between assets, liabilitiesand equity that show a certain level of financial per-formance. Information about all these financial struc-tures is provided by the Balance sheet and Profit andLoss account of firms. Thus, for our aggregated indexwe selected a number of 11 indicators, described intable 1.These 11 indicators selected are usually used infinancial diagnosis that is a tool oriented towardsusers aiming at measuring the return on capital andrisk, the assessment of the conditions for achievingfinancial balance and the degree of autonomy, thatare important in decision making in firms related tosuspending activities, redefining the strategy or poli-cy on long-term or short-term. The majority of theindicators included in the aggregated index are inter-nationally recognized and used individually in finan-cial performance analysis: profitability as return onassets and return on equity, financial autonomy [19],liquidity [19–20], ownership structure [21–22], capitalstructure and risk management [21]; debt [22], size[23], sales [24] etc.The evaluation mechanism of the aggregated indexgoes on the principle that each criterion i in theaggregated index sets a number of points (score) Si,where i = 1 ÷ 11 with the characteristic that Si, belongsto the set Si,= {20, 40, 60, 80, 100} specific for eachcriterion. The minimum element of the set, namely20, is the score given to a criterion which is a state-ment of total or nearly-total maladjustment to therequirements of a market economy; the maximumscore Si, set is 100 and represents a case of satisfy-ing a requirement at high-international level. In orderto grant these scores Si,, for each criterion i wereestablished intervals of performance (table 2), accord-ing to the limits and favourable values of each indi-cators known from the financial literature.After awarding scores, it can be achieved the classi-fication of companies after financial performance bydetermining the aggregate index for each firm. Theaggregate index of each firm is a weighted averageof the scores Si granted to each criterion i of theaggregated index, having as weighting coefficients
273industria textila 2019, vol. 70, nr. 3˘
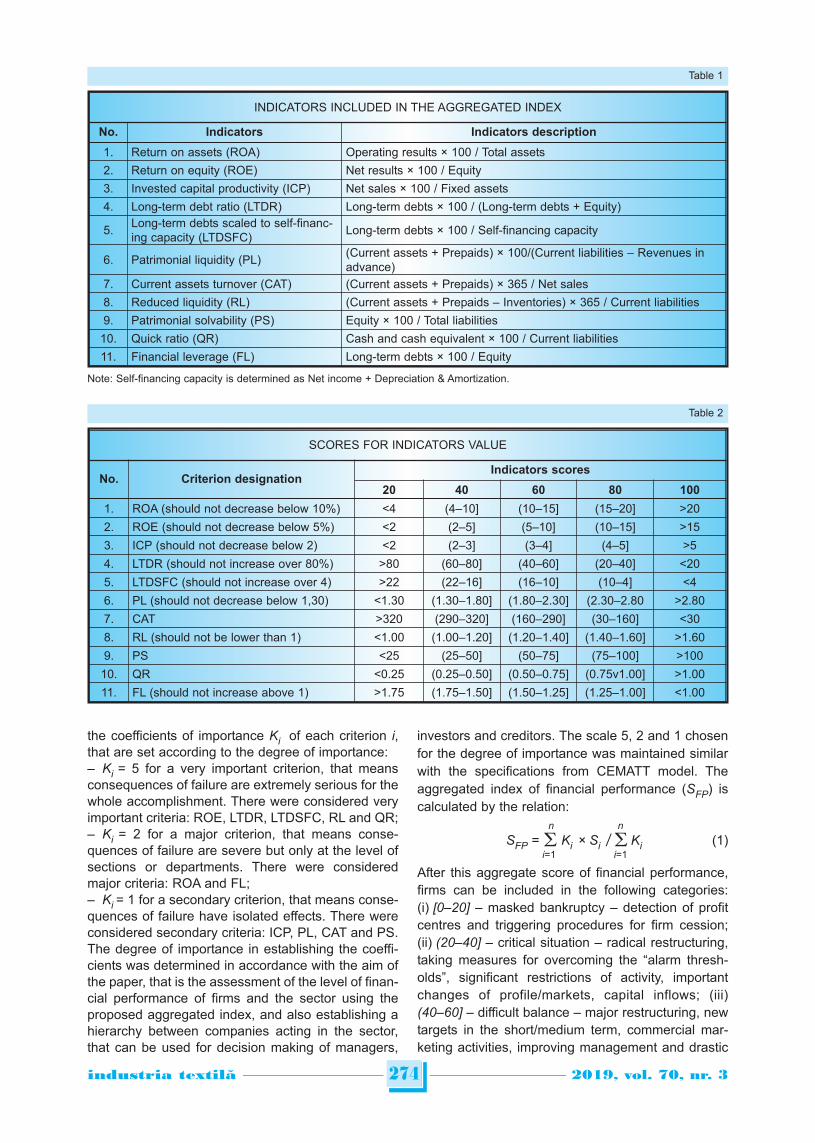
the coefficients of importance Ki of each criterion i,that are set according to the degree of importance:– Ki = 5 for a very important criterion, that meansconsequences of failure are extremely serious for thewhole accomplishment. There were considered veryimportant criteria: ROE, LTDR, LTDSFC, RL and QR;– Ki = 2 for a major criterion, that means conse-quences of failure are severe but only at the level ofsections or departments. There were consideredmajor criteria: ROA and FL;– Ki = 1 for a secondary criterion, that means conse-quences of failure have isolated effects. There wereconsidered secondary criteria: ICP, PL, CAT and PS.The degree of importance in establishing the coeffi-cients was determined in accordance with the aim ofthe paper, that is the assessment of the level of finan-cial performance of firms and the sector using theproposed aggregated index, and also establishing ahierarchy between companies acting in the sector,that can be used for decision making of managers,
investors and creditors. The scale 5, 2 and 1 chosenfor the degree of importance was maintained similarwith the specifications from CEMATT model. Theaggregated index of financial performance (SFP) iscalculated by the relation:
n n
SFP = Ki × Si / Ki (1)i=1 i=1
After this aggregate score of financial performance,firms can be included in the following categories:(i) [0–20] – masked bankruptcy – detection of profitcentres and triggering procedures for firm cession;(ii) (20–40] – critical situation – radical restructuring,taking measures for overcoming the “alarm thresh-olds”, significant restrictions of activity, importantchanges of profile/markets, capital inflows; (iii)(40–60] – difficult balance – major restructuring, newtargets in the short/medium term, commercial mar-keting activities, improving management and drastic
274industria textila 2019, vol. 70, nr. 3˘
SCORES FOR INDICATORS VALUE
No. Criterion designationIndicators scores
20 40 60 80 100
1. ROA (should not decrease below 10%) <4 (4–10] (10–15] (15–20] >202. ROE (should not decrease below 5%) <2 (2–5] (5–10] (10–15] >153. ICP (should not decrease below 2) <2 (2–3] (3–4] (4–5] >54. LTDR (should not increase over 80%) >80 (60–80] (40–60] (20–40] <205. LTDSFC (should not increase over 4) ˃22 (22–16] (16–10] (10–4] ˂46. PL (should not decrease below 1,30) <1.30 (1.30–1.80] (1.80–2.30] (2.30–2.80 >2.807. CAT >320 (290–320] (160–290] (30–160] <308. RL (should not be lower than 1) <1.00 (1.00–1.20] (1.20–1.40] (1.40–1.60] >1.609. PS <25 (25–50] (50–75] (75–100] >10010. QR <0.25 (0.25–0.50] (0.50–0.75] (0.75v1.00] >1.0011. FL (should not increase above 1) ˃1.75 (1.75–1.50] (1.50–1.25] (1.25–1.00] ˂1.00
Table 2
INDICATORS INCLUDED IN THE AGGREGATED INDEX
No. Indicators Indicators description
1. Return on assets (ROA) Operating results × 100 / Total assets2. Return on equity (ROE) Net results × 100 / Equity3. Invested capital productivity (ICP) Net sales × 100 / Fixed assets4. Long-term debt ratio (LTDR) Long-term debts × 100 / (Long-term debts + Equity)
5. Long-term debts scaled to self-financ-ing capacity (LTDSFC) Long-term debts × 100 / Self-financing capacity
6. Patrimonial liquidity (PL) (Current assets + Prepaids) × 100/(Current liabilities – Revenues inadvance)
7. Current assets turnover (CAT) (Current assets + Prepaids) × 365 / Net sales8. Reduced liquidity (RL) (Current assets + Prepaids – Inventories) × 365 / Current liabilities9. Patrimonial solvability (PS) Equity × 100 / Total liabilities10. Quick ratio (QR) Cash and cash equivalent × 100 / Current liabilities11. Financial leverage (FL) Long-term debts × 100 / Equity
Table 1
Note: Self-financing capacity is determined as Net income + Depreciation & Amortization.
savings regime, capital inflows; (iv) (60–80] – satis-factory adaptation – selection of strategic objectives,“freezing” unprofitable businesses, capital inflows;(v) (80–100] – validity in competitive environments –adopting a firm offensive strategy in this case majorrestructuring is not necessary.
EXPERIMENTAL WORK
The methodology presented for evaluation financialperformance is applied on firms acting in textileindustry. The apparel and textile industry is one of thelongest and most complicated industrial chains inmanufacturing industry. It is fragmented and domi-nated by SME’s, with a demand driven mainly bythree end-uses: clothing, home and technical textiles.This industry is composed of a wide number of sub-sectors, covering the entire production cycle from theproduction of raw material to semi processed andfinal products [25].Textile industry an important sector of national econ-omy, both in terms of the contribution to grossdomestic product and export growth, and in Romaniahas undergone in the last 20 years a difficult periodof transformation and adaptation to a changing mar-ket. Romania is endowed with the necessary resourcesfor the production of fibers and fiber silk and wool,flax and hemp bastfibers, but it still needs hugeinvestments. Therefore, the industry is dependent onimports of raw materials [26].We have chosen for case study the textile and cloth-ing industry because, in Romania, is an industry withtradition and companies operating for over 100 years.Romania’s competitive advantage in textile industryreported to the European one, is mainly due to low-cost labor force [26], creation of a great number ofjobs, especially female, contribution to social stabilitybeing represented in all counties, skilled and experi-enced staff, proximity to Western countries, no taxesin EU membership and compliance with EU stan-dards and regulations [27]. It is a sector that usesintensive labour force and has a significant share inthe export economy and contributes with profit to theforeign trade balance of the country. According to theclassification of value added per employee, Romaniaoccupies the last place ahead of Bulgaria and thevalue added to total labor costs in industry exceedsthe EU average for textile and clothing [28]. The pro-duction of textile clothing in Romania has recordedapproximately 2.5 billion EUR in 2013, up by almost4% compared to 2012. Although during the first 8months of 2014, the turnover value index in textilemanufacturing sector has increases by 16.4% com-pared to the same period of 2013 [27]. Romania hasa very small share in the turnover of the EU, com-pared to the large number of employees in this indus-try. Romania has the largest undeveloped exportpotential in the textile industry of the EU countries,about 15% of the entire EU unexploited potential [28].Study data were selected from Amadeus database,provided by Bureau van Dijk Electronics, from amongmedium-sized enterprises, active in 2014 in the cloth-ing industry in Romania (with a number of employees
between 50 and 249), with activity conducted withinthe NACE code 14 – Manufacture of wearing appar-el (14.13). Thus, 366 active companies were identi-fied in the database, 20 of which have been removed,for which the database does not provide comprehen-sive data. Of the 346 valid businesses, further on inthe study, we will focus only on the first 82 medium-sized companies with total assets greater than 1 mil-lion Euro, that represents 23.70% of the active medi-um-sized firms in textile industry in Romania. For thesample of 82 companies were calculated indicatorsdefined in table 1 using data from the database builtfor this study. The results are presented in Appendix(table 4). It was found that, in most cases, the anal-ysed indicators are not within the normal rangesfound in industry. For example, in the case of manyfirms, we have indicators greater than 5%, whenreturn on equity was determined, or greater than themaximum allowed recorded by the leverage ratio,which is 80%. The examples that do not fit may con-tinue in the case of patrimonial liquidity as well,where a normal value should not fall below 1.30.Misfit occurs in the case of patrimonial liquidity,where a normal value should be between 1.5 and 2,and in the case of solvency values, greater valuesthan 1 must exist. But nevertheless, there are only4 companies from 82 that fall within the normal rangeto all criteria.In relation to the analysed companies, the scoresawarded can be viewed in the Appendix (table 5) forthe sector and for each firm. For the sector, basicindicators were determined adding the value regis-tered by all firms included in the sample, the averagescore of the sector being 73.33. Please note that therange of variation was determined by the authors toframe the companies within the analysed indicatorsand equally depending on the specific of textileindustry. Thus, for each firm, the scores for each indi-cator were granted, depending on the scale describedon methodology. In Appendix (table 5), companieswere ranked by the aggregate score obtained, indescending order, for a better observation of theposition each firm. We found that the companies’ sit-uation is a good one seen in terms of the aggregatescores, although many of the 11 financial indicatorsfell outside the normal values in the industry.
RESULTS AND DISCUSSION
In table 3, we show the framing of companies afterthe level financial performance in a category of per-formance. Although the sector score determined aswe presented above is framed on the interval (70–80]where we find the most companies; statistically, theaverage score of performance is 66.32 and standarddeviation is 19.284. We can conclude that mostmedium-sized companies in the textile industry inRomania fall into the category 60–80, which meansthat companies operate under optimal conditions,and that could give them a very good rating. Alsonote that in the analysis there have not been regis-tered companies classified in the lowest category,
275industria textila 2019, vol. 70, nr. 3˘
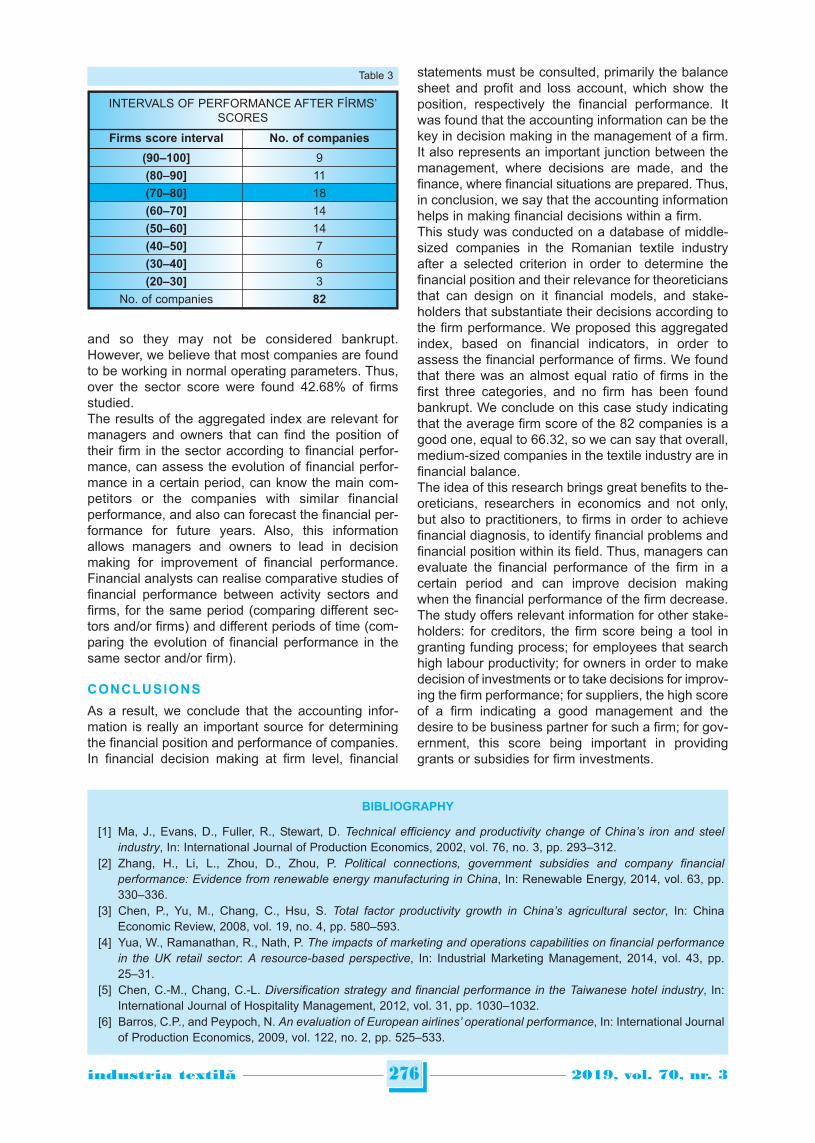
and so they may not be considered bankrupt.However, we believe that most companies are foundto be working in normal operating parameters. Thus,over the sector score were found 42.68% of firmsstudied.The results of the aggregated index are relevant formanagers and owners that can find the position oftheir firm in the sector according to financial perfor-mance, can assess the evolution of financial perfor-mance in a certain period, can know the main com-petitors or the companies with similar financialperformance, and also can forecast the financial per-formance for future years. Also, this informationallows managers and owners to lead in decisionmaking for improvement of financial performance.Financial analysts can realise comparative studies offinancial performance between activity sectors andfirms, for the same period (comparing different sec-tors and/or firms) and different periods of time (com-paring the evolution of financial performance in thesame sector and/or firm).
CONCLUSIONS
As a result, we conclude that the accounting infor-mation is really an important source for determiningthe financial position and performance of companies.In financial decision making at firm level, financial
statements must be consulted, primarily the balancesheet and profit and loss account, which show theposition, respectively the financial performance. Itwas found that the accounting information can be thekey in decision making in the management of a firm.It also represents an important junction between themanagement, where decisions are made, and thefinance, where financial situations are prepared. Thus,in conclusion, we say that the accounting informationhelps in making financial decisions within a firm.This study was conducted on a database of middle-sized companies in the Romanian textile industryafter a selected criterion in order to determine thefinancial position and their relevance for theoreticiansthat can design on it financial models, and stake-holders that substantiate their decisions according tothe firm performance. We proposed this aggregatedindex, based on financial indicators, in order toassess the financial performance of firms. We foundthat there was an almost equal ratio of firms in thefirst three categories, and no firm has been foundbankrupt. We conclude on this case study indicatingthat the average firm score of the 82 companies is agood one, equal to 66.32, so we can say that overall,medium-sized companies in the textile industry are infinancial balance. The idea of this research brings great benefits to the-oreticians, researchers in economics and not only,but also to practitioners, to firms in order to achievefinancial diagnosis, to identify financial problems andfinancial position within its field. Thus, managers canevaluate the financial performance of the firm in acertain period and can improve decision makingwhen the financial performance of the firm decrease. The study offers relevant information for other stake-holders: for creditors, the firm score being a tool ingranting funding process; for employees that searchhigh labour productivity; for owners in order to makedecision of investments or to take decisions for improv-ing the firm performance; for suppliers, the high scoreof a firm indicating a good management and thedesire to be business partner for such a firm; for gov-ernment, this score being important in providinggrants or subsidies for firm investments.
276industria textila 2019, vol. 70, nr. 3˘
INTERVALS OF PERFORMANCE AFTER FİRMS’SCORES
Firms score interval No. of companies
(90–100] 9(80–90] 11(70–80] 18(60–70] 14(50–60] 14(40–50] 7(30–40] 6(20–30] 3
No. of companies 82
Table 3
BIBLIOGRAPHY
[1] Ma, J., Evans, D., Fuller, R., Stewart, D. Technical efficiency and productivity change of China’s iron and steelindustry, In: International Journal of Production Economics, 2002, vol. 76, no. 3, pp. 293–312.
[2] Zhang, H., Li, L., Zhou, D., Zhou, P. Political connections, government subsidies and company financialperformance: Evidence from renewable energy manufacturing in China, In: Renewable Energy, 2014, vol. 63, pp.330–336.
[3] Chen, P., Yu, M., Chang, C., Hsu, S. Total factor productivity growth in China’s agricultural sector, In: ChinaEconomic Review, 2008, vol. 19, no. 4, pp. 580–593.
[4] Yua, W., Ramanathan, R., Nath, P. The impacts of marketing and operations capabilities on financial performancein the UK retail sector: A resource-based perspective, In: Industrial Marketing Management, 2014, vol. 43, pp.25–31.
[5] Chen, C.-M., Chang, C.-L. Diversification strategy and financial performance in the Taiwanese hotel industry, In:International Journal of Hospitality Management, 2012, vol. 31, pp. 1030–1032.
[6] Barros, C.P., and Peypoch, N. An evaluation of European airlines’ operational performance, In: International Journalof Production Economics, 2009, vol. 122, no. 2, pp. 525–533.
277industria textila 2019, vol. 70, nr. 3˘
[7] Ongore, V.O., Kusa, G.B. Determinants of financial performance of commercial banks in Kenya, In: InternationalJournal of Economics and Financial Issues, 2013, vol. 3, no. 1, pp. 237–252.
[8] Mukherjee, K., Ray, S., Miller, S. Productivity growth in large US commercial banks: the initial post-deregulationexperience, Journal of Banking and Finance, 2001, vol. 25, pp. 913–939.
[9] Adams, M., Buckle, M. The determinants of corporate financial performance in the Bermuda insurance market, In:Applied Financial Economics, 2003, vol. 13, pp. 133–143.
[10] Sadka, R. Liquidity risk and accounting information, In: Journal of Accounting and Economics, 2011, vol. 52,no. 2–3, pp. 144–152.
[11] Huefner, R.J., Largay, J.A. The role of accounting information in revenue management, In: Business Horizons,2008, vol. 51, no. 3, pp. 245–255.
[12] Bushman, R., Chen, Q., Engel, E., Smith, A. Financial accounting information, organizational complexity andcorporate governance systems, In: Journal of Accounting and Economics, 2004, vol. 37, pp. 167–201.
[13] Danos, P., Holt, D.L., Imhoff, E. Jr. The use of accounting information in bank lending decisions, In: AccountingOrganizations and Society, 1989, vol. 14, no. 3, pp. 235–246.
[14] Hall, M. Accounting information and managerial work, In: Accounting, Organizations and Society, 2010, vol. 35,no. 3, pp. 301–315.
[15] Zimmerman, J.L. The role of accounting in the twenty-first century firm, In: Accounting and Business Research,2015, vol. 45, no. 4, pp. 485–509.
[16] Tian, Y., Zhou, H. From bottom line to consumers’ mind: The framing effects of accounting information, In:Accounting, Organizations and Society, 2015, vol. 43, pp. 56–66.
[17] Mereuţă, C. Analiza diagnostic a societăţilor comerciale în tranziţie: Metoda CEMATT, 1994, Bucharest: Tehnica.[18] Alexa, V., Kiss, I., Ratiu, S. Diagnostic analysis – tool in research and innovation, In: Annals of Faculty Engineering
Hunedoara, 2013, vol. 11, pp. 321–324.[19] Horta, I.M., Camanho, A.S., Moreira da Costa, J. Performance assessment of construction companies: A study of
factors promoting financial soundness and innovation in the industry, In: International Journal of ProductionEconomics, 2012, vol. 137, no. 1, pp. 84–93.
[20] Gurbuz, A.O., Aybars, A., Kutlu, O. Corporate governance and financial performance with a perspective oninstitutional ownership: empirical evidence from Turkey, In: Journal of Applied Management Accounting Research,2010, vol. 8, pp. 21–38.
[21] Mirza, S.A., Javed, A. Determinants of financial performance of a company: Case of Pakistani stock market, In:Journal of Economics and International Finance, 2013, vol. 5, no. 2, pp. 43–52.
[22] Saliha, T., Abdessatar, A. The determinants of financial performance: an empirical test using the simultaneousequations method, In: Economics and Finance Review, 2011, vol. 1, no. 10, pp. 01–19.
[23] Love, I., Rachinsky, A. Corporate governance, ownership and bank performance in emerging markets: evidencefrom Russia and Ukraine, Siteresources-worldbank. 2007, Working Paper.
[24] Forbes, K.J. How do large depreciations affect company performance?, In: IMF Staff papers, Palgrave Macmillan,2002, vol. 49, no. 1, pp. 214–238.
[25] Adinolfi, R., Andersen, T. In-depth assessment of the situation of the T&C sector in the EU and prospects, In: FinalReport ENTR/2010/16 Prepared for European Commission Enterprise and Industry DG, October 2011.
[26] Şerbănel, C.I. Romanian textile industry and its competitive advantage, In: SEA – Practical Application of Science,2014, vol. 2, no. 2 (4), pp. 395–404.
[27] FRD Centre Market Entry Services, Garments Market in Romania, 2015, available at http://www.frdcenter.ro/assets/Garments-Market-Romania-2015-DEMO-Sector-Brief.pdf
[28] Gîrneaţă, A. Increasing managerial capability in Romanian textile companies, In: Proceedings of the 7th
International Management Conference “New Management for the New Economy”, November 7th-8th, 2013,Bucharest, Romania.
Authors:
TEODOR HADA1, NICOLETA BĂRBUŢĂ-MIŞU2, TEODORA MARIA AVRAM3
1“Bogdan Vodă” University, Faculty of Economic Sciences, Department of Management-Finance-Accounting,26A Grigore Alexandrescu, 400560, Cluj-Napoca, Romania
2“Dunarea de Jos” University of Galati, Faculty of Economics and Business Administration, Department ofBusiness Administration, 800008, Galati, Romania
3“1 Decembrie 1918” University, Faculty of Economic Sciences, PhD Student, 5 Gabriel Bethlen, 510009, Alba Iulia, Romania
e-mail: [email protected]; [email protected]; [email protected]
Corresponding author:
NICOLETA BĂRBUŢĂ-MIŞUe-mail: [email protected]
INTRODUCTION
Cotton is one of the most commonly used textilefibers in the world. It is comfortable and has soft han-dle, good color and printing properties. It is predictedthat cotton’s consumption will be approximately30 million tons by 2020 [1–6]. A regenerated cellulosic fiber bamboo has recentlybeen of great interest due to its several advantages.Bamboo fibers have good characteristics such asmoisture vapor transmission, good dyeability, softhand, high moisture absorption capacity and pleas-ant luster. Bamboo fiber is consisted of cellulose(57–63 %) with a a-cellulose content of 36–41 %,lignins (22–26 %) and penthosans (16–21 %) [7–10].Softeners can provide textiles an agreeable soft hand,some smoothness, more flexibility, better drape andpliability. Softeners are classified according to theirionic character as cationic, anionic, non-ionic, ampho-teric, and silicone [11–13]. The hydrophilic parts ofthe cationic softener contain quaternary ammoni-um, which adsorb negatively charged fiber surfaces.The long aliphatic chains are then oriented towardsoutside of the fiber and act as an excellent boundarylubricant between yarns and fibers [14]. Anionic softeners have nowadays only a very limit-ed use in textile processing, due to their low sub-stantivity and minor softness. Some examples of theiruses include raising and sanforising processes,
which result in improved smoothness/antistatic andrewetting properties, respectively.Non-ionic softeners theoretically have no electriccharge and for that reason show no significant sub-stantivity. They can be easily combined with otheractive agents or products, are stable against hightemperatures and are non-yellowing. For that reason,this product group is ideal for the finish of optically-brightened white textiles [15].Silicones became popular in the textile industry inthe early 1960s. The first products were mainly poly-dimethylsiloxanes without modification. A break-through came in the 1970s with the development ofaminofunctional polydimethylsiloxanes, which are themost advanced silicone softeners [16]. Silicones arepolymers with backbones that consist of alternatingoxygen and silicon atoms. The silicon-oxygen bondsare strong and very flexible compared to the carbon-carbon bonds found in the backbones of other poly-mers. The general structure of the silicone softenercan be seen in figure 1.The flexibility of the siloxane backbone means that atan interface the methyl groups can always be pre-sented to the outside world, creating a very low sur-face energy material. The silicone softeners are clas-sified as polydimethylsiloxanes, amido, amino func-tional silicones, methyl hydrogen silicones, epoxyfunctional silicones, hydroxyl functional silicones, sil-icone polyethers, epoxy polyether silicones [17–19].
278industria textila 2019, vol. 70, nr. 3˘
A comparative study on handle properties of bamboo and cotton fabrics
DOI: 10.35530/IT.070.03.1538
GAMZE SÜPÜREN MENGÜÇ ARIF TANER ÖZGÜNEYEYLEN SEMA DALBAŞI NILGÜN ÖZDİL
REZUMAT – ABSTRACT
Studiu comparativ al tușeului țesăturilor din bambus și bumbac
Emolienții sunt de mare importanță în prelucrarea textilelor. Scopul acestui tratament este de a obține un tușeu moalepentru a facilita capacitatea de prelucrare și a îmbunătăți gradul de uzură. În acest studiu, s-a urmărit investigarea efectuluiși durabilității spălării diferiților emolienți asupra proprietăților tușeului țesăturilor tricotate din bumbac și bambus. Au fostaplicate șase tipuri de emolienți pe țesături. Mai mult, a fost testată durabilitatea tratării cu emolienți după 5, 10 și 20 cicluride spălare. Au fost măsurate caracteristicile tușeului, cum ar fi: drapajul, coeficientul de frecare cinetică și rigiditatea laîndoire circulară. Rezultatele au fost evaluate statistic. S-a constatat că tratamentul de emoliere nu are o performanță desucces pentru țesăturile de bambus, așa cum se întâmplă în cazul țesăturilor de bumbac.
Cuvinte-cheie: bumbac, bambus, emolient, drapaj, frecarea suprafeței, spălare
A comparative study on handle properties of bamboo and cotton fabrics
Softeners are of great importance in textile processing. The aim of this treatment is to achieve a soft handle to facilitatethe processability and improve wettability. In this study, it was aimed to investigate the effect and washing durability ofvarious softeners on handle properties of cotton and bamboo knitted fabrics. Six types of softeners were applied to thefabrics. Moreover, the washing durability of the softeners after 5, 10 and 20 washing cycles were tested. Handlecharacteristics such as drapeability, kinetic friction coefficient and circular bending rigidity were measured. The resultswere statistically evaluated. It was determined that softening treatment does not have a successful performance in bamboofabrics as it has in cotton fabrics.
Keywords: cotton, bamboo, softener, drapeability, surface friction, washing
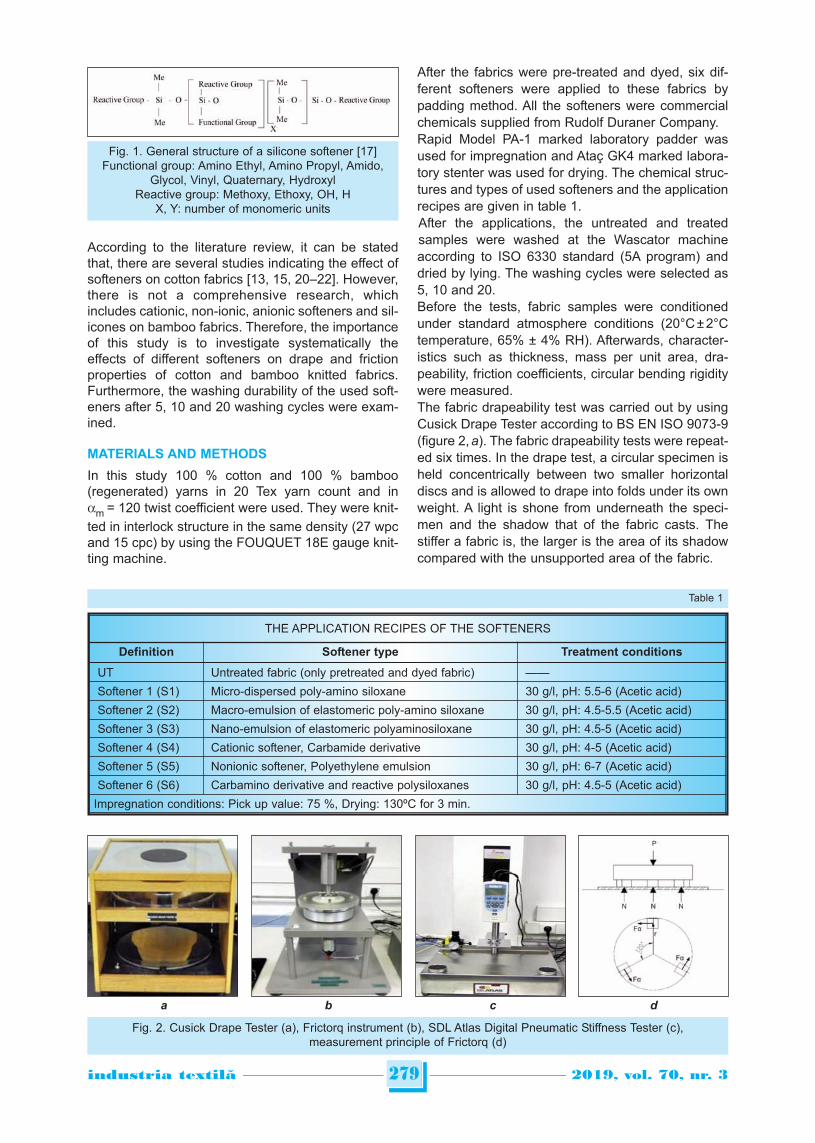
According to the literature review, it can be statedthat, there are several studies indicating the effect ofsofteners on cotton fabrics [13, 15, 20–22]. However,there is not a comprehensive research, whichincludes cationic, non-ionic, anionic softeners and sil-icones on bamboo fabrics. Therefore, the importanceof this study is to investigate systematically theeffects of different softeners on drape and frictionproperties of cotton and bamboo knitted fabrics.Furthermore, the washing durability of the used soft-eners after 5, 10 and 20 washing cycles were exam-ined.
MATERIALS AND METHODS
In this study 100 % cotton and 100 % bamboo(regenerated) yarns in 20 Tex yarn count and inam = 120 twist coefficient were used. They were knit-ted in interlock structure in the same density (27 wpcand 15 cpc) by using the FOUQUET 18E gauge knit-ting machine.
After the fabrics were pre-treated and dyed, six dif-ferent softeners were applied to these fabrics bypadding method. All the softeners were commercialchemicals supplied from Rudolf Duraner Company. Rapid Model PA-1 marked laboratory padder wasused for impregnation and Ataç GK4 marked labora-tory stenter was used for drying. The chemical struc-tures and types of used softeners and the applicationrecipes are given in table 1.After the applications, the untreated and treatedsamples were washed at the Wascator machineaccording to ISO 6330 standard (5A program) anddried by lying. The washing cycles were selected as5, 10 and 20. Before the tests, fabric samples were conditionedunder standard atmosphere conditions (20°C ± 2°Ctemperature, 65% ± 4% RH). Afterwards, character-istics such as thickness, mass per unit area, dra-peability, friction coefficients, circular bending rigiditywere measured.The fabric drapeability test was carried out by usingCusick Drape Tester according to BS EN ISO 9073-9(figure 2, a). The fabric drapeability tests were repeat-ed six times. In the drape test, a circular specimen isheld concentrically between two smaller horizontaldiscs and is allowed to drape into folds under its ownweight. A light is shone from underneath the speci-men and the shadow that of the fabric casts. Thestiffer a fabric is, the larger is the area of its shadowcompared with the unsupported area of the fabric.
279industria textila 2019, vol. 70, nr. 3˘
THE APPLICATION RECIPES OF THE SOFTENERS
Definition Softener type Treatment conditions
UT Untreated fabric (only pretreated and dyed fabric) ——
Softener 1 (S1) Micro-dispersed poly-amino siloxane 30 g/l, pH: 5.5-6 (Acetic acid)
Softener 2 (S2) Macro-emulsion of elastomeric poly-amino siloxane 30 g/l, pH: 4.5-5.5 (Acetic acid)
Softener 3 (S3) Nano-emulsion of elastomeric polyaminosiloxane 30 g/l, pH: 4.5-5 (Acetic acid)
Softener 4 (S4) Cationic softener, Carbamide derivative 30 g/l, pH: 4-5 (Acetic acid)
Softener 5 (S5) Nonionic softener, Polyethylene emulsion 30 g/l, pH: 6-7 (Acetic acid)
Softener 6 (S6) Carbamino derivative and reactive polysiloxanes 30 g/l, pH: 4.5-5 (Acetic acid)
Impregnation conditions: Pick up value: 75 %, Drying: 130ºC for 3 min.
Table 1
Fig. 1. General structure of a silicone softener [17]Functional group: Amino Ethyl, Amino Propyl, Amido,
Glycol, Vinyl, Quaternary, HydroxylReactive group: Methoxy, Ethoxy, OH, H
X, Y: number of monomeric units
Fig. 2. Cusick Drape Tester (a), Frictorq instrument (b), SDL Atlas Digital Pneumatic Stiffness Tester (c),measurement principle of Frictorq (d)
a b c d
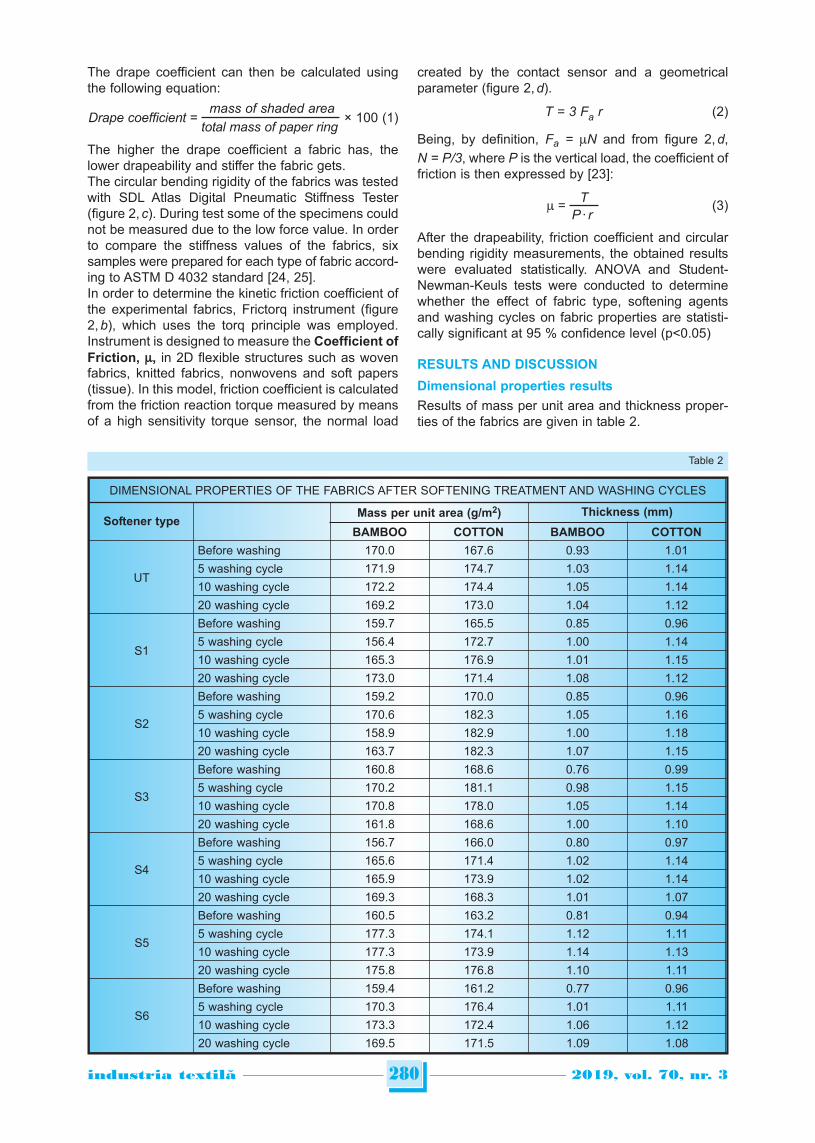
The drape coefficient can then be calculated usingthe following equation:
mass of shaded areaDrape coefficient = × 100 (1)
total mass of paper ring
The higher the drape coefficient a fabric has, thelower drapeability and stiffer the fabric gets. The circular bending rigidity of the fabrics was testedwith SDL Atlas Digital Pneumatic Stiffness Tester(figure 2, c). During test some of the specimens couldnot be measured due to the low force value. In orderto compare the stiffness values of the fabrics, sixsamples were prepared for each type of fabric accord-ing to ASTM D 4032 standard [24, 25]. In order to determine the kinetic friction coefficient ofthe experimental fabrics, Frictorq instrument (figure2, b), which uses the torq principle was employed.Instrument is designed to measure the Coefficient ofFriction, m, in 2D flexible structures such as wovenfabrics, knitted fabrics, nonwovens and soft papers(tissue). In this model, friction coefficient is calculatedfrom the friction reaction torque measured by meansof a high sensitivity torque sensor, the normal load
created by the contact sensor and a geometricalparameter (figure 2, d).
T = 3 Fa r (2)
Being, by definition, Fa = mN and from figure 2, d,N = P/3, where P is the vertical load, the coefficient offriction is then expressed by [23]:
Tm = (3)
P ∙ r
After the drapeability, friction coefficient and circularbending rigidity measurements, the obtained resultswere evaluated statistically. ANOVA and Student-Newman-Keuls tests were conducted to determinewhether the effect of fabric type, softening agentsand washing cycles on fabric properties are statisti-cally significant at 95 % confidence level (p<0.05)
RESULTS AND DISCUSSION
Dimensional properties results
Results of mass per unit area and thickness proper-ties of the fabrics are given in table 2.
280industria textila 2019, vol. 70, nr. 3˘
DIMENSIONAL PROPERTIES OF THE FABRICS AFTER SOFTENING TREATMENT AND WASHING CYCLES
Softener typeMass per unit area (g/m2) Thickness (mm)
BAMBOO COTTON BAMBOO COTTON
UT
Before washing 170.0 167.6 0.93 1.015 washing cycle 171.9 174.7 1.03 1.1410 washing cycle 172.2 174.4 1.05 1.1420 washing cycle 169.2 173.0 1.04 1.12
S1
Before washing 159.7 165.5 0.85 0.965 washing cycle 156.4 172.7 1.00 1.1410 washing cycle 165.3 176.9 1.01 1.1520 washing cycle 173.0 171.4 1.08 1.12
S2
Before washing 159.2 170.0 0.85 0.965 washing cycle 170.6 182.3 1.05 1.1610 washing cycle 158.9 182.9 1.00 1.1820 washing cycle 163.7 182.3 1.07 1.15
S3
Before washing 160.8 168.6 0.76 0.995 washing cycle 170.2 181.1 0.98 1.1510 washing cycle 170.8 178.0 1.05 1.1420 washing cycle 161.8 168.6 1.00 1.10
S4
Before washing 156.7 166.0 0.80 0.975 washing cycle 165.6 171.4 1.02 1.1410 washing cycle 165.9 173.9 1.02 1.1420 washing cycle 169.3 168.3 1.01 1.07
S5
Before washing 160.5 163.2 0.81 0.945 washing cycle 177.3 174.1 1.12 1.1110 washing cycle 177.3 173.9 1.14 1.1320 washing cycle 175.8 176.8 1.10 1.11
S6
Before washing 159.4 161.2 0.77 0.965 washing cycle 170.3 176.4 1.01 1.1110 washing cycle 173.3 172.4 1.06 1.1220 washing cycle 169.5 171.5 1.09 1.08
Table 2
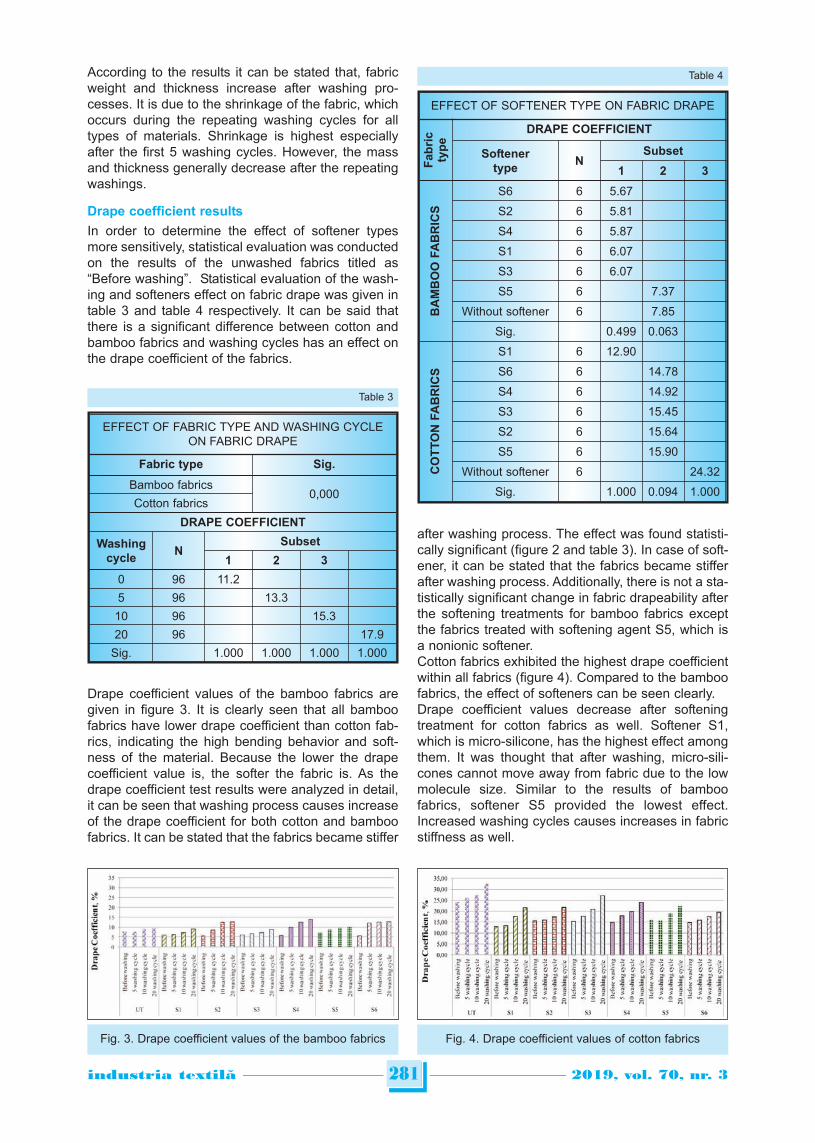
According to the results it can be stated that, fabricweight and thickness increase after washing pro-cesses. It is due to the shrinkage of the fabric, whichoccurs during the repeating washing cycles for alltypes of materials. Shrinkage is highest especiallyafter the first 5 washing cycles. However, the massand thickness generally decrease after the repeatingwashings.
Drape coefficient results
In order to determine the effect of softener typesmore sensitively, statistical evaluation was conductedon the results of the unwashed fabrics titled as“Before washing”. Statistical evaluation of the wash-ing and softeners effect on fabric drape was given intable 3 and table 4 respectively. It can be said thatthere is a significant difference between cotton andbamboo fabrics and washing cycles has an effect onthe drape coefficient of the fabrics.
Drape coefficient values of the bamboo fabrics aregiven in figure 3. It is clearly seen that all bamboofabrics have lower drape coefficient than cotton fab-rics, indicating the high bending behavior and soft-ness of the material. Because the lower the drapecoefficient value is, the softer the fabric is. As thedrape coefficient test results were analyzed in detail,it can be seen that washing process causes increaseof the drape coefficient for both cotton and bamboofabrics. It can be stated that the fabrics became stiffer
after washing process. The effect was found statisti-cally significant (figure 2 and table 3). In case of soft-ener, it can be stated that the fabrics became stifferafter washing process. Additionally, there is not a sta-tistically significant change in fabric drapeability afterthe softening treatments for bamboo fabrics exceptthe fabrics treated with softening agent S5, which isa nonionic softener. Cotton fabrics exhibited the highest drape coefficientwithin all fabrics (figure 4). Compared to the bamboofabrics, the effect of softeners can be seen clearly.Drape coefficient values decrease after softeningtreatment for cotton fabrics as well. Softener S1,which is micro-silicone, has the highest effect amongthem. It was thought that after washing, micro-sili-cones cannot move away from fabric due to the lowmolecule size. Similar to the results of bamboofabrics, softener S5 provided the lowest effect.Increased washing cycles causes increases in fabricstiffness as well.
281industria textila 2019, vol. 70, nr. 3˘
EFFECT OF FABRIC TYPE AND WASHING CYCLEON FABRIC DRAPE
Fabric type Sig.
Bamboo fabrics0,000
Cotton fabrics
DRAPE COEFFICIENT
Washingcycle
NSubset
1 2 3
0 96 11.25 96 13.310 96 15.320 96 17.9
Sig. 1.000 1.000 1.000 1.000
Table 3
Table 4
Fig. 3. Drape coefficient values of the bamboo fabrics Fig. 4. Drape coefficient values of cotton fabrics
EFFECT OF SOFTENER TYPE ON FABRIC DRAPE
Fa
bri
cty
pe
DRAPE COEFFICIENT
Softenertype
NSubset
1 2 3
BA
MB
OO
FA
BR
ICS
S6 6 5.67
S2 6 5.81
S4 6 5.87
S1 6 6.07
S3 6 6.07
S5 6 7.37
Without softener 6 7.85
Sig. 0.499 0.063
CO
TT
ON
FA
BR
ICS
S1 6 12.90
S6 6 14.78
S4 6 14.92
S3 6 15.45
S2 6 15.64
S5 6 15.90
Without softener 6 24.32
Sig. 1.000 0.094 1.000
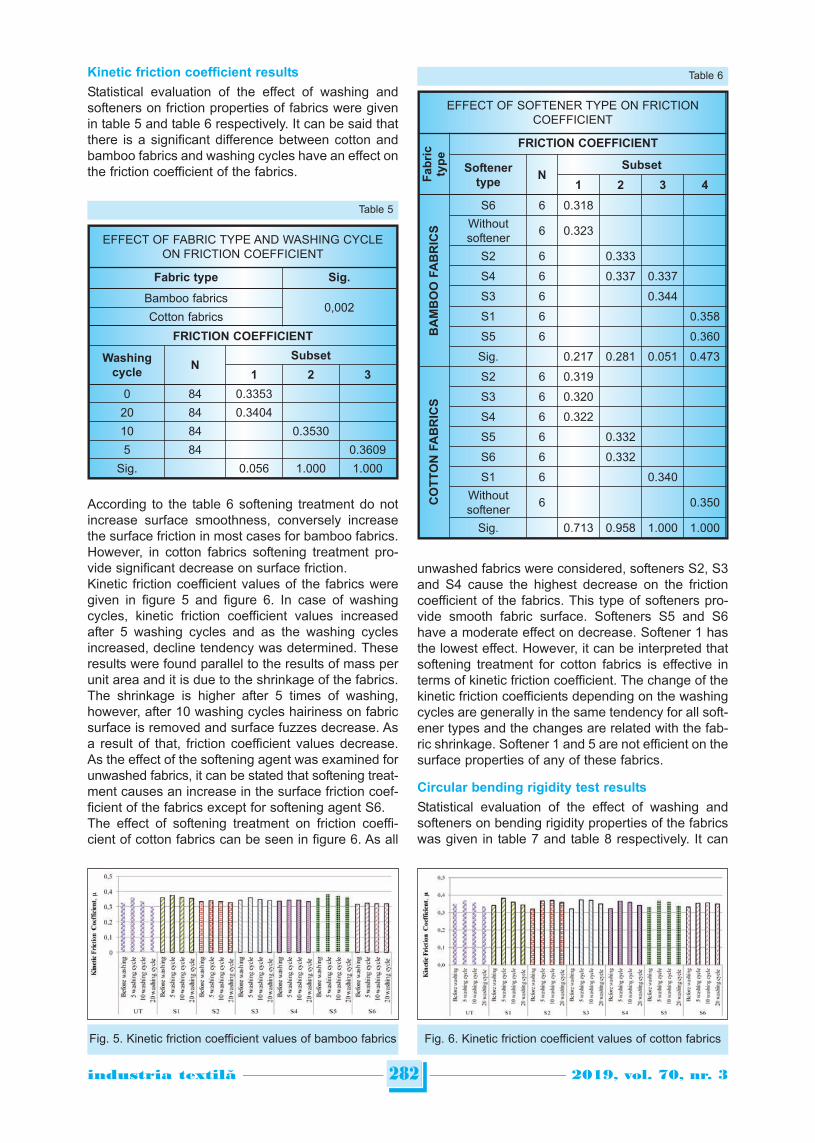
Kinetic friction coefficient results
Statistical evaluation of the effect of washing andsofteners on friction properties of fabrics were givenin table 5 and table 6 respectively. It can be said thatthere is a significant difference between cotton andbamboo fabrics and washing cycles have an effect onthe friction coefficient of the fabrics.
According to the table 6 softening treatment do notincrease surface smoothness, conversely increasethe surface friction in most cases for bamboo fabrics.However, in cotton fabrics softening treatment pro-vide significant decrease on surface friction. Kinetic friction coefficient values of the fabrics weregiven in figure 5 and figure 6. In case of washingcycles, kinetic friction coefficient values increasedafter 5 washing cycles and as the washing cyclesincreased, decline tendency was determined. Theseresults were found parallel to the results of mass perunit area and it is due to the shrinkage of the fabrics.The shrinkage is higher after 5 times of washing,however, after 10 washing cycles hairiness on fabricsurface is removed and surface fuzzes decrease. Asa result of that, friction coefficient values decrease.As the effect of the softening agent was examined forunwashed fabrics, it can be stated that softening treat-ment causes an increase in the surface friction coef-ficient of the fabrics except for softening agent S6. The effect of softening treatment on friction coeffi-cient of cotton fabrics can be seen in figure 6. As all
unwashed fabrics were considered, softeners S2, S3and S4 cause the highest decrease on the frictioncoefficient of the fabrics. This type of softeners pro-vide smooth fabric surface. Softeners S5 and S6have a moderate effect on decrease. Softener 1 hasthe lowest effect. However, it can be interpreted thatsoftening treatment for cotton fabrics is effective interms of kinetic friction coefficient. The change of thekinetic friction coefficients depending on the washingcycles are generally in the same tendency for all soft-ener types and the changes are related with the fab-ric shrinkage. Softener 1 and 5 are not efficient on thesurface properties of any of these fabrics.
Circular bending rigidity test results
Statistical evaluation of the effect of washing andsofteners on bending rigidity properties of the fabricswas given in table 7 and table 8 respectively. It can
282industria textila 2019, vol. 70, nr. 3˘
EFFECT OF FABRIC TYPE AND WASHING CYCLEON FRICTION COEFFICIENT
Fabric type Sig.
Bamboo fabrics0,002
Cotton fabrics
FRICTION COEFFICIENT
Washingcycle
NSubset
1 2 3
0 84 0.3353
20 84 0.3404
10 84 0.3530
5 84 0.3609
Sig. 0.056 1.000 1.000
Table 5
Table 6
EFFECT OF SOFTENER TYPE ON FRICTIONCOEFFICIENT
Fa
bri
cty
pe
FRICTION COEFFICIENT
Softenertype
NSubset
1 2 3 4
BA
MB
OO
FA
BR
ICS
S6 6 0.318Withoutsoftener 6 0.323
S2 6 0.333
S4 6 0.337 0.337
S3 6 0.344
S1 6 0.358
S5 6 0.360
Sig. 0.217 0.281 0.051 0.473
CO
TT
ON
FA
BR
ICS
S2 6 0.319
S3 6 0.320
S4 6 0.322
S5 6 0.332
S6 6 0.332
S1 6 0.340Withoutsoftener 6 0.350
Sig. 0.713 0.958 1.000 1.000
Fig. 5. Kinetic friction coefficient values of bamboo fabrics Fig. 6. Kinetic friction coefficient values of cotton fabrics
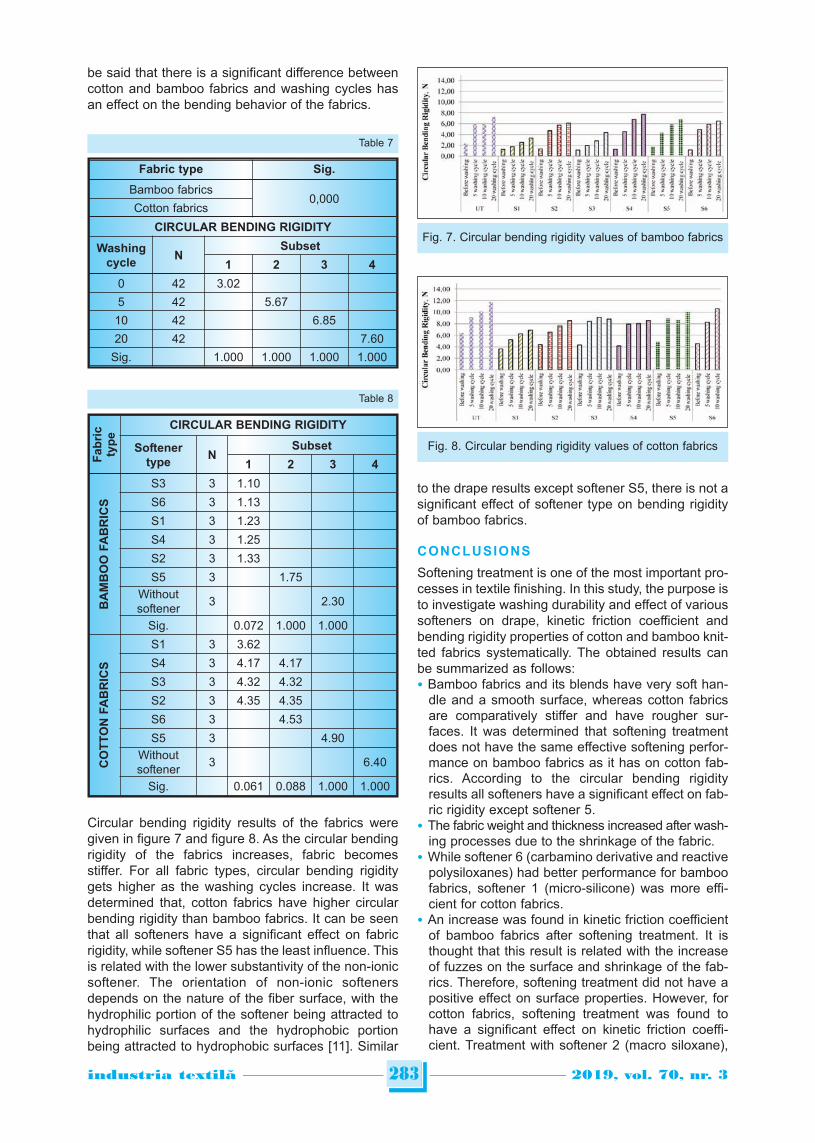
be said that there is a significant difference betweencotton and bamboo fabrics and washing cycles hasan effect on the bending behavior of the fabrics.
Circular bending rigidity results of the fabrics weregiven in figure 7 and figure 8. As the circular bendingrigidity of the fabrics increases, fabric becomesstiffer. For all fabric types, circular bending rigiditygets higher as the washing cycles increase. It wasdetermined that, cotton fabrics have higher circularbending rigidity than bamboo fabrics. It can be seenthat all softeners have a significant effect on fabricrigidity, while softener S5 has the least influence. Thisis related with the lower substantivity of the non-ionicsoftener. The orientation of non-ionic softenersdepends on the nature of the fiber surface, with thehydrophilic portion of the softener being attracted tohydrophilic surfaces and the hydrophobic portionbeing attracted to hydrophobic surfaces [11]. Similar
to the drape results except softener S5, there is not asignificant effect of softener type on bending rigidityof bamboo fabrics.
CONCLUSIONS
Softening treatment is one of the most important pro-cesses in textile finishing. In this study, the purpose isto investigate washing durability and effect of varioussofteners on drape, kinetic friction coefficient andbending rigidity properties of cotton and bamboo knit-ted fabrics systematically. The obtained results canbe summarized as follows:• Bamboo fabrics and its blends have very soft han-
dle and a smooth surface, whereas cotton fabricsare comparatively stiffer and have rougher sur-faces. It was determined that softening treatmentdoes not have the same effective softening perfor-mance on bamboo fabrics as it has on cotton fab-rics. According to the circular bending rigidityresults all softeners have a significant effect on fab-ric rigidity except softener 5.
• The fabric weight and thickness increased after wash-ing processes due to the shrinkage of the fabric.
• While softener 6 (carbamino derivative and reactivepolysiloxanes) had better performance for bamboofabrics, softener 1 (micro-silicone) was more effi-cient for cotton fabrics.
• An increase was found in kinetic friction coefficientof bamboo fabrics after softening treatment. It isthought that this result is related with the increaseof fuzzes on the surface and shrinkage of the fab-rics. Therefore, softening treatment did not have apositive effect on surface properties. However, forcotton fabrics, softening treatment was found tohave a significant effect on kinetic friction coeffi-cient. Treatment with softener 2 (macro siloxane),
283industria textila 2019, vol. 70, nr. 3˘
Table 8
Fa
bri
cty
pe
CIRCULAR BENDING RIGIDITY
Softenertype
NSubset
1 2 3 4
BA
MB
OO
FA
BR
ICS
S3 3 1.10
S6 3 1.13
S1 3 1.23
S4 3 1.25
S2 3 1.33
S5 3 1.75Withoutsoftener 3 2.30
Sig. 0.072 1.000 1.000
CO
TT
ON
FA
BR
ICS
S1 3 3.62
S4 3 4.17 4.17
S3 3 4.32 4.32
S2 3 4.35 4.35
S6 3 4.53
S5 3 4.90Withoutsoftener 3 6.40
Sig. 0.061 0.088 1.000 1.000
Fabric type Sig.
Bamboo fabrics0,000
Cotton fabrics
CIRCULAR BENDING RIGIDITY
Washingcycle
NSubset
1 2 3 4
0 42 3.025 42 5.6710 42 6.8520 42 7.60
Sig. 1.000 1.000 1.000 1.000
Table 7
Fig. 7. Circular bending rigidity values of bamboo fabrics
Fig. 8. Circular bending rigidity values of cotton fabrics
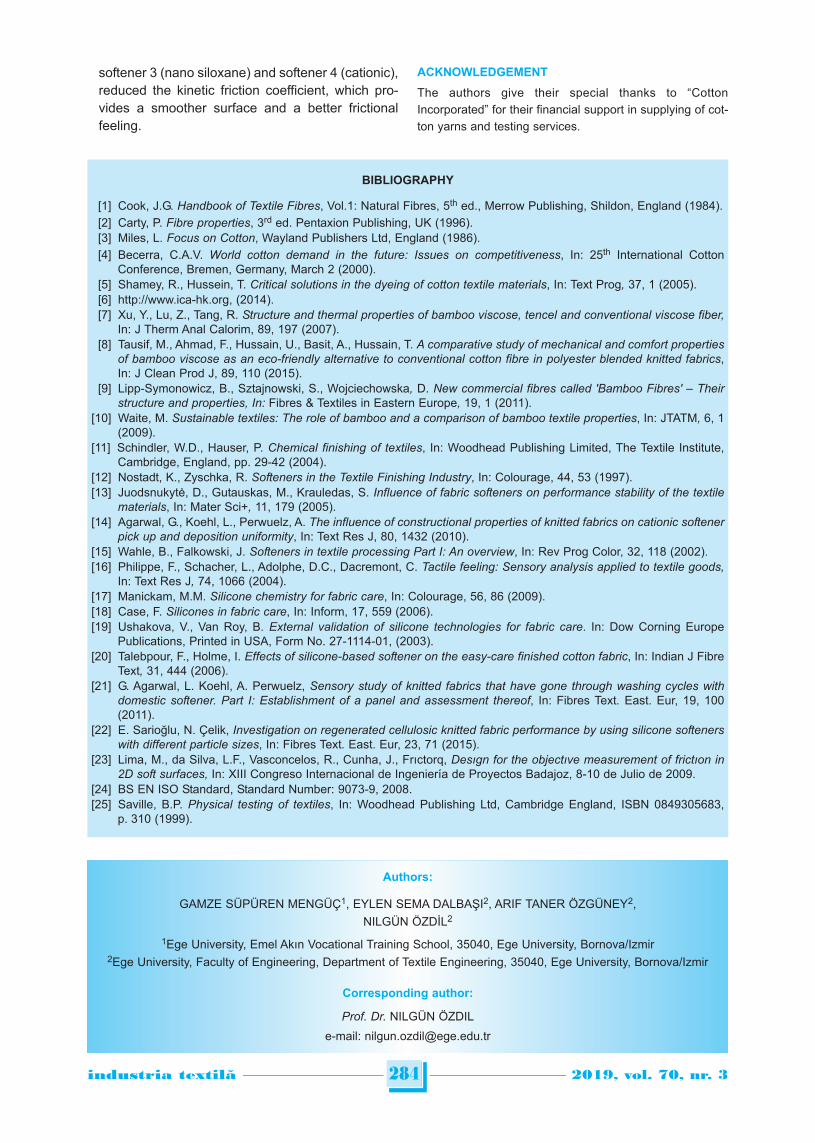
softener 3 (nano siloxane) and softener 4 (cationic),reduced the kinetic friction coefficient, which pro-vides a smoother surface and a better frictionalfeeling.
ACKNOWLEDGEMENT
The authors give their special thanks to “CottonIncorporated” for their financial support in supplying of cot-ton yarns and testing services.
284industria textila 2019, vol. 70, nr. 3˘
BIBLIOGRAPHY
[1] Cook, J.G. Handbook of Textile Fibres, Vol.1: Natural Fibres, 5th ed., Merrow Publishing, Shildon, England (1984).[2] Carty, P. Fibre properties, 3rd ed. Pentaxion Publishing, UK (1996). [3] Miles, L. Focus on Cotton, Wayland Publishers Ltd, England (1986). [4] Becerra, C.A.V. World cotton demand in the future: Issues on competitiveness, In: 25th International Cotton
Conference, Bremen, Germany, March 2 (2000).[5] Shamey, R., Hussein, T. Critical solutions in the dyeing of cotton textile materials, In: Text Prog, 37, 1 (2005).[6] http://www.ica-hk.org, (2014).[7] Xu, Y., Lu, Z., Tang, R. Structure and thermal properties of bamboo viscose, tencel and conventional viscose fiber,
In: J Therm Anal Calorim, 89, 197 (2007).[8] Tausif, M., Ahmad, F., Hussain, U., Basit, A., Hussain, T. A comparative study of mechanical and comfort properties
of bamboo viscose as an eco-friendly alternative to conventional cotton fibre in polyester blended knitted fabrics,In: J Clean Prod J, 89, 110 (2015).
[9] Lipp-Symonowicz, B., Sztajnowski, S., Wojciechowska, D. New commercial fibres called 'Bamboo Fibres' – Theirstructure and properties, In: Fibres & Textiles in Eastern Europe, 19, 1 (2011).
[10] Waite, M. Sustainable textiles: The role of bamboo and a comparison of bamboo textile properties, In: JTATM, 6, 1(2009).
[11] Schindler, W.D., Hauser, P. Chemical finishing of textiles, In: Woodhead Publishing Limited, The Textile Institute,Cambridge, England, pp. 29-42 (2004).
[12] Nostadt, K., Zyschka, R. Softeners in the Textile Finishing Industry, In: Colourage, 44, 53 (1997).[13] Juodsnukytė, D., Gutauskas, M., Krauledas, S. Influence of fabric softeners on performance stability of the textile
materials, In: Mater Sci+, 11, 179 (2005).[14] Agarwal, G., Koehl, L., Perwuelz, A. The influence of constructional properties of knitted fabrics on cationic softener
pick up and deposition uniformity, In: Text Res J, 80, 1432 (2010).[15] Wahle, B., Falkowski, J. Softeners in textile processing Part I: An overview, In: Rev Prog Color, 32, 118 (2002).[16] Philippe, F., Schacher, L., Adolphe, D.C., Dacremont, C. Tactile feeling: Sensory analysis applied to textile goods,
In: Text Res J, 74, 1066 (2004).[17] Manickam, M.M. Silicone chemistry for fabric care, In: Colourage, 56, 86 (2009). [18] Case, F. Silicones in fabric care, In: Inform, 17, 559 (2006).[19] Ushakova, V., Van Roy, B. External validation of silicone technologies for fabric care. In: Dow Corning Europe
Publications, Printed in USA, Form No. 27-1114-01, (2003).[20] Talebpour, F., Holme, I. Effects of silicone-based softener on the easy-care finished cotton fabric, In: Indian J Fibre
Text, 31, 444 (2006).[21] G. Agarwal, L. Koehl, A. Perwuelz, Sensory study of knitted fabrics that have gone through washing cycles with
domestic softener. Part I: Establishment of a panel and assessment thereof, In: Fibres Text. East. Eur, 19, 100(2011).
[22] E. Sarioğlu, N. Çelik, Investigation on regenerated cellulosic knitted fabric performance by using silicone softenerswith different particle sizes, In: Fibres Text. East. Eur, 23, 71 (2015).
[23] Lima, M., da Silva, L.F., Vasconcelos, R., Cunha, J., Frıctorq, Desıgn for the objectıve measurement of frictıon in2D soft surfaces, In: XIII Congreso Internacional de Ingeniería de Proyectos Badajoz, 8-10 de Julio de 2009.
[24] BS EN ISO Standard, Standard Number: 9073-9, 2008.[25] Saville, B.P. Physical testing of textiles, In: Woodhead Publishing Ltd, Cambridge England, ISBN 0849305683,
p. 310 (1999).
Authors:
GAMZE SÜPÜREN MENGÜÇ1, EYLEN SEMA DALBAŞI2, ARIF TANER ÖZGÜNEY2,NILGÜN ÖZDİL2
1Ege University, Emel Akın Vocational Training School, 35040, Ege University, Bornova/Izmir 2Ege University, Faculty of Engineering, Department of Textile Engineering, 35040, Ege University, Bornova/Izmir
Corresponding author:
Prof. Dr. NILGÜN ÖZDIL
e-mail: [email protected]
INTRODUCTION
“Upcycling” is an improved and viable way to reuse,in which a product can be used after significant mod-ification [1]. In the present situation, used clothes arereused only for their basic functions as well as forseveral inferior purposes. In case of inferior usage,the products are not used to its full capacity.Therefore up-cycling can be considered as of thebest alternatives over direct reuse and recycling. Thisis mainly because products are used for theimproved purpose, hence higher values can bederived from the existing resources [1]. One suc-cessful attempt has been done to maximize the useof resources by firm ‘aWEARness’. The company hasdeveloped polymer fibres which are long-lasting.Accessibility Based Business Model is developed forthe sale of the products. In this business model, thecustomers do not own the product and ownership lieswith the company. The user avails service of theproduct and then returns back to the company. The
company redesign/up-cycle or recycles the productaccording to the condition [2]. Recycle may be con-sidered as the most conventional process to closethe loop. In this process, the raw material is recov-ered after processing for its properties or characteris-tics. For example, fire retardant non-woven materialrecovered can be used in a mattress spring cover [3].Recycling process can be divided into up-cycling anddown-cycling. In up-cycling, value/quality of the prod-uct is improved by making a superior product. Indown-cycling, an inferior product is made out of rawmaterial. Beside this, reuse of clothes may signifi-cantly contribute in reducing the environmental haz-ard due to the restricted entry of new clothes in thevalue chain [4–5]. Reverse logistics of clothes forreuse purpose can save energy by 97–98% in com-parison to manufacture same clothes from fibers [6].The figures illustrate that asup-cycling is better thandown-cycling.
A Romanian case study of clothes and accessories upcycling
DOI: 10.35530/IT.070.03.1544
MANOJ KUMAR PARAS LICHUAN WANGANTONELA CURTEZA YAN CHENRUDRAJEET PAL
REZUMAT – ABSTRACT
Un studiu de caz din România privind valorificarea îmbrăcămintei și a accesoriilor
Lucrarea de față urmărește să investigheze practica valorificării și reproiectării. Studiul se bazează pe multiplele organizațiiimplicate în activitățile de reproiectare. Organizațiile selectate pentru studiu sunt situate în partea de nord a României.Interviurile semi-structurate, împreună cu observațiile directe, au fost folosite pentru a colecta informații. Lucrarea oferăinformații practice privind procesul de valorificare. Diferite tipuri de produse reproiectate sunt realizate din deșeuriindustriale și de consum, cum ar fi îmbrăcămintea reproiectată, accesoriile pentru femei, gențile, poșetele pentru femei șiarticolele de papetărie de birou. Valorificarea este considerată, în general, nefezabilă din punct de vedere economic. Cutoate acestea, acest studiu a găsit rezultate contradictorii. Activitățile de reproiectare bazate pe cerere pot ajuta oorganizație să obțină profit. Două dintre cele trei organizații selectate sunt capabile să se autosusțină. Una dintreorganizații este recent intrată pe piețele românești de îmbrăcăminte și este capabilă să concureze cu jucătorii existenți.Acest studiu ar putea fi văzut ca una dintre primele încercări de a explora empiric practica valorificării textilelor și aaccesoriilor în Europa de Est. Constatările din studiul de caz actual pot oferi mai multe informații utile pentru alte companiisimilare pentru a face activitățile de reproiectare profitabile.
Cuvinte-cheie: valorificare, reproiectare, îmbrăcăminte, piele, accesorii
A Romanian case study of clothes and accessories upcycling
The present paper aims to investigate the practice of upcycling and redesign. The study draws on the multipleorganizations involved in the redesigning activities. The organizations selected for the study are located in the northernpart of Romania. Semi-structured interviews along with direct observations were used to collect information. The paperprovides practical insights to upcycling process.Various kinds of redesigned products are made out of consumer andindustrial wastes such as redesigned clothes, accessories for ladies, handbags, ladies purses and office stationery.Upcycling is generally considered as economically non-feasible. However, this study has found contradictory results. Thedemand-based redesign activities can help an organization to earn a profit. Two out of three selected organizations areable to self-sustain. One of the organizations is newly entered into the Romanian used clothing markets and ables tocompete with existing players. This study could be seen as one of the early attempts to empirically explore the practice oftextile and accessories upcycling practice in Eastern Europe. The findings from the current case study can provide severaluseful insights for other similar companies to make redesign activities profitable.
Keywords: upcycling, redesign, clothes, leather, accessories
285industria textila 2019, vol. 70, nr. 3˘
Redesign or upcycling is a way to improve thechance of reuse. Reuse plays a pivotal role to controlthe environmental degradation by saving naturalresources for the future use and reducing pollution.The process of redesigning mainly consists of threesteps i.e. ideation, reconstruction and fitting [7].There are several factors such as material durability,deconstruction efforts and price of redesigned prod-ucts that can influence the process of redesign.Durable clothing products such as denim jeans aremost preferred items for redesign [8]. Paras, Ekwallhave found that in the absence of redesign mecha-nism, even good condition products are incinerated.Incineration and upcycling are two different cornersfor a product in the term of its use [9]. The upcyclingprocess is economically less feasible due to highlabour cost in Western Europe. The current casestudy can be considered as an instrument to under-stand how to make redesign process profitable. In thenext sections, the methodology will be presented fol-lowed by discussion and conclusion.
METHODOLOGY
An explorative study was conducted to identify theexisting practices of up-cycling. Multiple sites werestudied which enhanced the robustness of the study[10]. We have chosen the organizations located inIasi, Romania. The data was collected with the helpof semi-structured interviews with the founder andsenior manager of the organization. The collecteddata were analysed using a thematic approach. Forthe present study, three organizations were selected.These are referred as A, B, and C to maintain secre-cy. A and C are independent social organizationswhile B is associated to an international charity orga-nization. Table 1 summarises the details of the method-ology adopted:In total, seven interviews were taken at interviewee’soffice location. The interviews were kept short whichlasts for about an hour. These were conducted withina span of one year and six month period i.e., fromApril 2016 to September 2017. The interviews wereconducted with open-ended questions; therefore aprotocol has been set to increase the reliability of theinformation. Different documents along with directobservation technique also helped to get useful infor-
mation. NVivo 10 was used to analyse the interviewsand other collected information. Interviews tran-scripts were systematically analysed to find outthemes, ideas, patterns, concepts to test deductiveframework. Information pertaining to each of thecompanies was first analyzed individually. Based onthe responses, the questionnaires were redefinedbefore moving to the field. During analysis, each ofthe interviews was compared to previous one to findnew formation [11]. Hence, there was a constantbackward and forward movement to find new empiri-cal patterns from the case study. On the basis ofcross-case analysis, the theoretical saturation wasachieved and a model for redesign or upcycling prac-tice is proposed based on the insights [12].
FINDINGS
This section will provide a practical instance to up-cycling practice. Qualitative insights were gained byunderstanding and analysing the status quo of up-cycling practice at three organizations. The organiza-tions chosen for the current case study are spe-cialised in different kind of products, for example,Case A (clothes and accessories), Case B (clothesand leather accessories) and Case C (accessoriesand stationeries).
Case A: a case of clothes and accessoriesup-cycling
Organization A is a Romanian based redesign orga-nization located in the northern part of the country.The organization A is under the umbrella of a 7-year-old social organization that aims to protect the envi-ronment. The organization vision is to promote circu-lar economy by minimisation of waste throughcollection and conversion of discarded textiles to ausable product. The positive impact on the environ-ment is created by redefining clothes, extending thelifespan of textile and creation of new products. Thecustomised products are created by using textilescollected from local people in the bins, along withworkshop and factory leftovers. The figure 1 depictsa few illustrations of redesigned clothes and acces-sories at organization A.The organization A is found to be one of most thesuccessful and economically sustainable organization.
286industria textila 2019, vol. 70, nr. 3˘
METHODOLOGY USED FOR THE CASE STUDY
CaseNumber of visits
(Direct observation)Interviews
(Individual face to face)Documents
A 06
Founder
Patterns, work plan, products design etc.Manager
Designer
B02 (1 visit to the factory at
Ploesti and 1 visit toredesign workshop at Iasi)
Country managerInventory records, production planning charts, products design etc.
Factory manager
Redesign manager
C 01 Founder Stationary and accessories pattern, product design etc.
Table 1
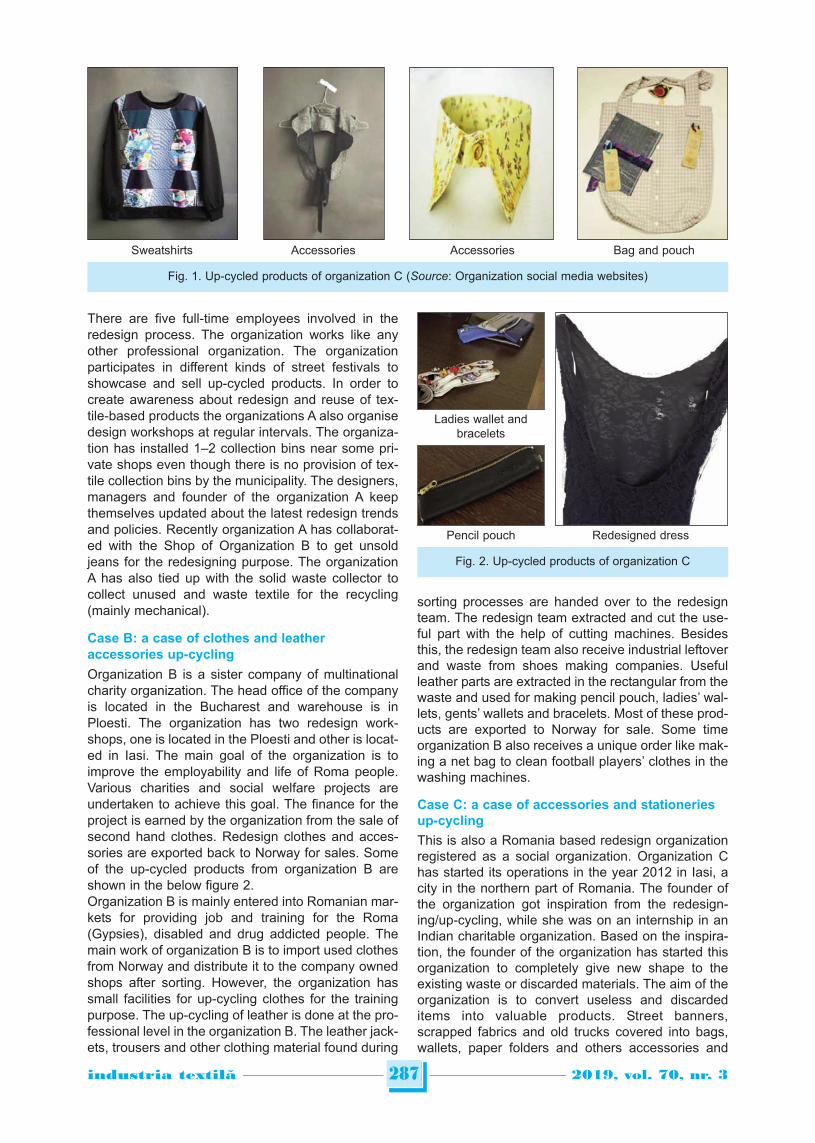
There are five full-time employees involved in theredesign process. The organization works like anyother professional organization. The organizationparticipates in different kinds of street festivals toshowcase and sell up-cycled products. In order tocreate awareness about redesign and reuse of tex-tile-based products the organizations A also organisedesign workshops at regular intervals. The organiza-tion has installed 1–2 collection bins near some pri-vate shops even though there is no provision of tex-tile collection bins by the municipality. The designers,managers and founder of the organization A keepthemselves updated about the latest redesign trendsand policies. Recently organization A has collaborat-ed with the Shop of Organization B to get unsoldjeans for the redesigning purpose. The organizationA has also tied up with the solid waste collector tocollect unused and waste textile for the recycling(mainly mechanical).
Case B: a case of clothes and leatheraccessories up-cycling
Organization B is a sister company of multinationalcharity organization. The head office of the companyis located in the Bucharest and warehouse is inPloesti. The organization has two redesign work-shops, one is located in the Ploesti and other is locat-ed in Iasi. The main goal of the organization is toimprove the employability and life of Roma people.Various charities and social welfare projects areundertaken to achieve this goal. The finance for theproject is earned by the organization from the sale ofsecond hand clothes. Redesign clothes and acces-sories are exported back to Norway for sales. Someof the up-cycled products from organization B areshown in the below figure 2.Organization B is mainly entered into Romanian mar-kets for providing job and training for the Roma(Gypsies), disabled and drug addicted people. Themain work of organization B is to import used clothesfrom Norway and distribute it to the company ownedshops after sorting. However, the organization hassmall facilities for up-cycling clothes for the trainingpurpose. The up-cycling of leather is done at the pro-fessional level in the organization B. The leather jack-ets, trousers and other clothing material found during
sorting processes are handed over to the redesignteam. The redesign team extracted and cut the use-ful part with the help of cutting machines. Besidesthis, the redesign team also receive industrial leftoverand waste from shoes making companies. Usefulleather parts are extracted in the rectangular from thewaste and used for making pencil pouch, ladies’ wal-lets, gents’ wallets and bracelets. Most of these prod-ucts are exported to Norway for sale. Some timeorganization B also receives a unique order like mak-ing a net bag to clean football players’ clothes in thewashing machines.
Case C: a case of accessories and stationeriesup-cycling
This is also a Romania based redesign organizationregistered as a social organization. Organization Chas started its operations in the year 2012 in Iasi, acity in the northern part of Romania. The founder ofthe organization got inspiration from the redesign-ing/up-cycling, while she was on an internship in anIndian charitable organization. Based on the inspira-tion, the founder of the organization has started thisorganization to completely give new shape to theexisting waste or discarded materials. The aim of theorganization is to convert useless and discardeditems into valuable products. Street banners,scrapped fabrics and old trucks covered into bags,wallets, paper folders and others accessories and
287industria textila 2019, vol. 70, nr. 3˘
Sweatshirts Accessories Accessories Bag and pouch
Fig. 1. Up-cycled products of organization C (Source: Organization social media websites)
Pencil pouch Redesigned dress
Ladies wallet andbracelets
Fig. 2. Up-cycled products of organization C
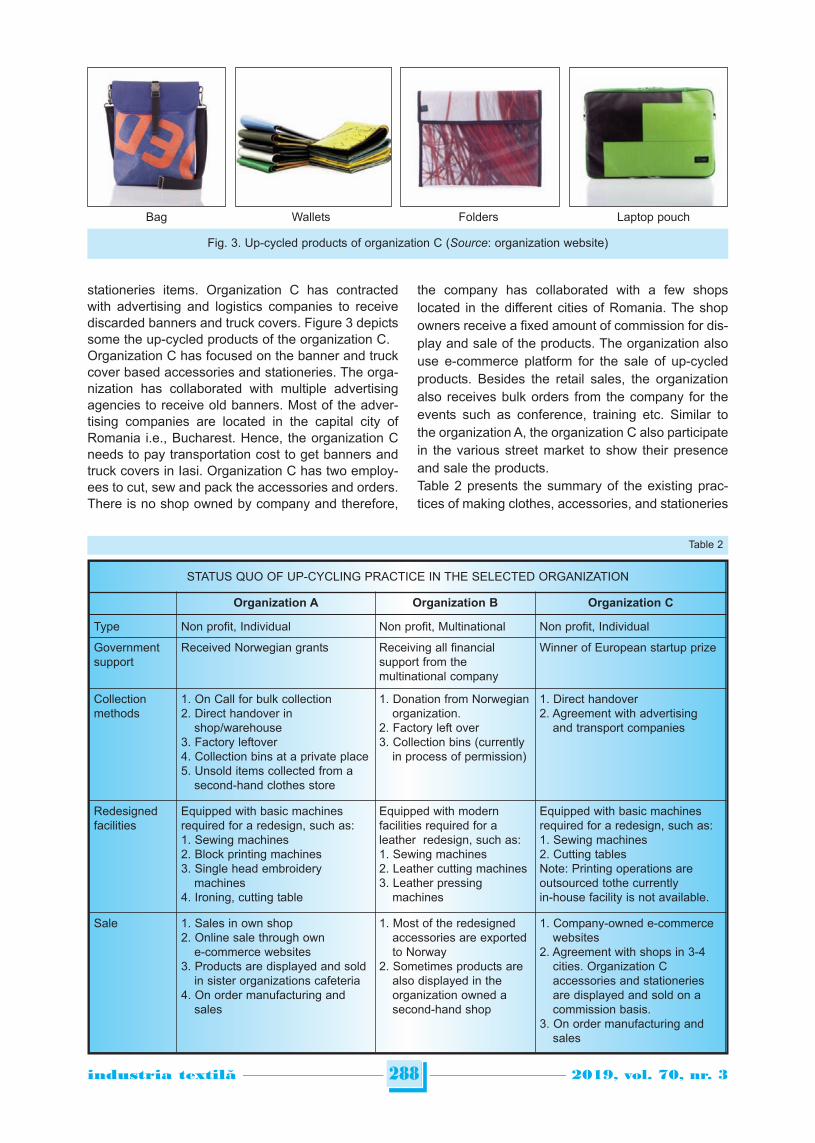
stationeries items. Organization C has contractedwith advertising and logistics companies to receivediscarded banners and truck covers. Figure 3 depictssome the up-cycled products of the organization C. Organization C has focused on the banner and truckcover based accessories and stationeries. The orga-nization has collaborated with multiple advertisingagencies to receive old banners. Most of the adver-tising companies are located in the capital city ofRomania i.e., Bucharest. Hence, the organization Cneeds to pay transportation cost to get banners andtruck covers in Iasi. Organization C has two employ-ees to cut, sew and pack the accessories and orders.There is no shop owned by company and therefore,
the company has collaborated with a few shopslocated in the different cities of Romania. The shopowners receive a fixed amount of commission for dis-play and sale of the products. The organization alsouse e-commerce platform for the sale of up-cycledproducts. Besides the retail sales, the organizationalso receives bulk orders from the company for theevents such as conference, training etc. Similar tothe organization A, the organization C also participatein the various street market to show their presenceand sale the products.Table 2 presents the summary of the existing prac-tices of making clothes, accessories, and stationeries
288industria textila 2019, vol. 70, nr. 3˘
Bag Wallets Folders Laptop pouch
Fig. 3. Up-cycled products of organization C (Source: organization website)
STATUS QUO OF UP-CYCLING PRACTICE IN THE SELECTED ORGANIZATION
Organization A Organization B Organization C
Type Non profit, Individual Non profit, Multinational Non profit, Individual
Government support
Received Norwegian grants Receiving all financialsupport from themultinational company
Winner of European startup prize
Collection methods
1. On Call for bulk collection 2. Direct handover in
shop/warehouse 3. Factory leftover 4. Collection bins at a private place 5. Unsold items collected from a
second-hand clothes store
1. Donation from Norwegianorganization.
2. Factory left over 3. Collection bins (currently
in process of permission)
1. Direct handover 2. Agreement with advertising
and transport companies
Redesigned facilities
Equipped with basic machinesrequired for a redesign, such as:1. Sewing machines 2. Block printing machines 3. Single head embroidery
machines 4. Ironing, cutting table
Equipped with modernfacilities required for aleather redesign, such as: 1. Sewing machines 2. Leather cutting machines 3. Leather pressing
machines
Equipped with basic machinesrequired for a redesign, such as:1. Sewing machines 2. Cutting tables Note: Printing operations areoutsourced tothe currentlyin-house facility is not available.
Sale 1. Sales in own shop 2. Online sale through own
e-commerce websites 3. Products are displayed and sold
in sister organizations cafeteria 4. On order manufacturing and
sales
1. Most of the redesignedaccessories are exportedto Norway
2. Sometimes products arealso displayed in theorganization owned asecond-hand shop
1. Company-owned e-commercewebsites
2. Agreement with shops in 3-4cities. Organization Caccessories and stationeriesare displayed and sold on acommission basis.
3. On order manufacturing andsales
Table 2
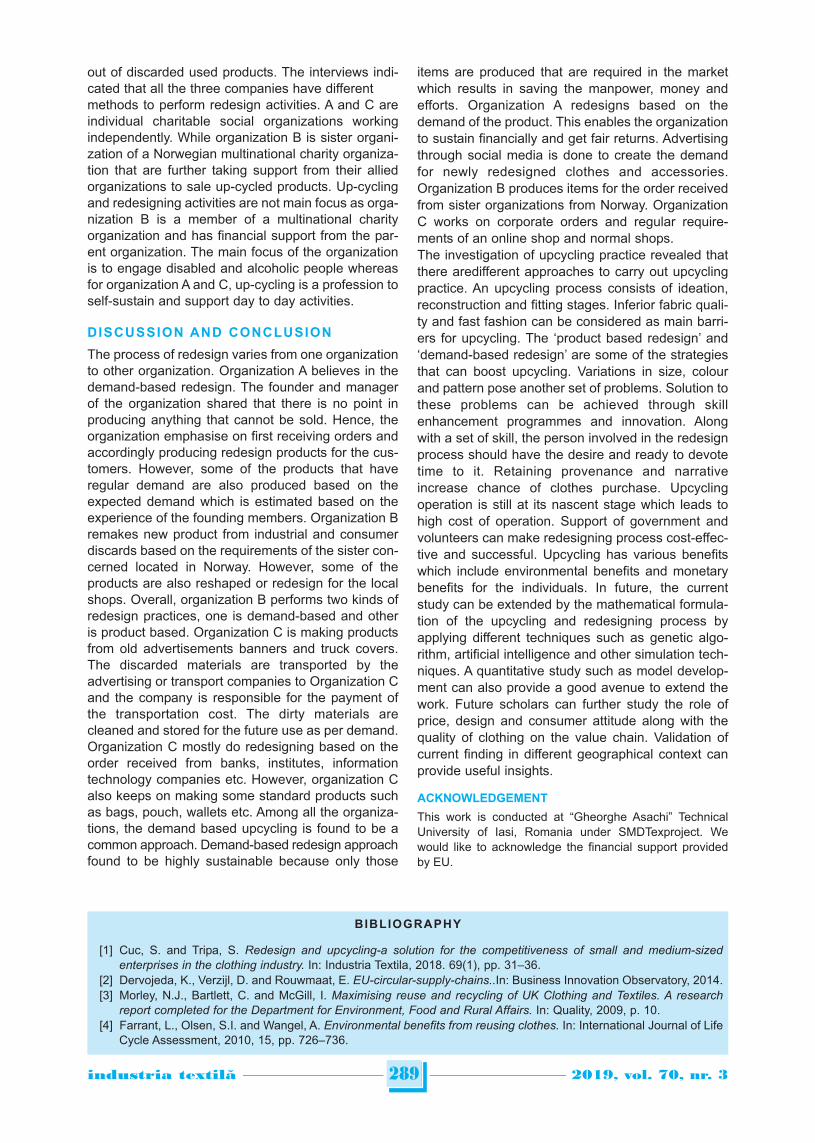
out of discarded used products. The interviews indi-cated that all the three companies have differentmethods to perform redesign activities. A and C areindividual charitable social organizations workingindependently. While organization B is sister organi-zation of a Norwegian multinational charity organiza-tion that are further taking support from their alliedorganizations to sale up-cycled products. Up-cyclingand redesigning activities are not main focus as orga-nization B is a member of a multinational charityorganization and has financial support from the par-ent organization. The main focus of the organizationis to engage disabled and alcoholic people whereasfor organization A and C, up-cycling is a profession toself-sustain and support day to day activities.
DISCUSSION AND CONCLUSION
The process of redesign varies from one organizationto other organization. Organization A believes in thedemand-based redesign. The founder and managerof the organization shared that there is no point inproducing anything that cannot be sold. Hence, theorganization emphasise on first receiving orders andaccordingly producing redesign products for the cus-tomers. However, some of the products that haveregular demand are also produced based on theexpected demand which is estimated based on theexperience of the founding members. Organization Bremakes new product from industrial and consumerdiscards based on the requirements of the sister con-cerned located in Norway. However, some of theproducts are also reshaped or redesign for the localshops. Overall, organization B performs two kinds ofredesign practices, one is demand-based and otheris product based. Organization C is making productsfrom old advertisements banners and truck covers.The discarded materials are transported by theadvertising or transport companies to Organization Cand the company is responsible for the payment ofthe transportation cost. The dirty materials arecleaned and stored for the future use as per demand.Organization C mostly do redesigning based on theorder received from banks, institutes, informationtechnology companies etc. However, organization Calso keeps on making some standard products suchas bags, pouch, wallets etc. Among all the organiza-tions, the demand based upcycling is found to be acommon approach. Demand-based redesign approachfound to be highly sustainable because only those
items are produced that are required in the marketwhich results in saving the manpower, money andefforts. Organization A redesigns based on thedemand of the product. This enables the organizationto sustain financially and get fair returns. Advertisingthrough social media is done to create the demandfor newly redesigned clothes and accessories.Organization B produces items for the order receivedfrom sister organizations from Norway. OrganizationC works on corporate orders and regular require-ments of an online shop and normal shops. The investigation of upcycling practice revealed thatthere aredifferent approaches to carry out upcyclingpractice. An upcycling process consists of ideation,reconstruction and fitting stages. Inferior fabric quali-ty and fast fashion can be considered as main barri-ers for upcycling. The ‘product based redesign’ and‘demand-based redesign’ are some of the strategiesthat can boost upcycling. Variations in size, colourand pattern pose another set of problems. Solution tothese problems can be achieved through skillenhancement programmes and innovation. Alongwith a set of skill, the person involved in the redesignprocess should have the desire and ready to devotetime to it. Retaining provenance and narrativeincrease chance of clothes purchase. Upcyclingoperation is still at its nascent stage which leads tohigh cost of operation. Support of government andvolunteers can make redesigning process cost-effec-tive and successful. Upcycling has various benefitswhich include environmental benefits and monetarybenefits for the individuals. In future, the currentstudy can be extended by the mathematical formula-tion of the upcycling and redesigning process byapplying different techniques such as genetic algo-rithm, artificial intelligence and other simulation tech-niques. A quantitative study such as model develop-ment can also provide a good avenue to extend thework. Future scholars can further study the role ofprice, design and consumer attitude along with thequality of clothing on the value chain. Validation ofcurrent finding in different geographical context canprovide useful insights.
ACKNOWLEDGEMENT
This work is conducted at “Gheorghe Asachi” TechnicalUniversity of Iasi, Romania under SMDTexproject. Wewould like to acknowledge the financial support providedby EU.
289industria textila 2019, vol. 70, nr. 3˘
BIBLIOGRAPHY
[1] Cuc, S. and Tripa, S. Redesign and upcycling-a solution for the competitiveness of small and medium-sizedenterprises in the clothing industry. In: Industria Textila, 2018. 69(1), pp. 31–36.
[2] Dervojeda, K., Verzijl, D. and Rouwmaat, E. EU-circular-supply-chains..In: Business Innovation Observatory, 2014.[3] Morley, N.J., Bartlett, C. and McGill, I. Maximising reuse and recycling of UK Clothing and Textiles. A research
report completed for the Department for Environment, Food and Rural Affairs. In: Quality, 2009, p. 10.[4] Farrant, L., Olsen, S.I. and Wangel, A. Environmental benefits from reusing clothes. In: International Journal of Life
Cycle Assessment, 2010, 15, pp. 726–736.
290industria textila 2019, vol. 70, nr. 3˘
Authors:
MANOJ KUMAR PARAS1,2,3
ANTONELA CURTEZA2
RUDRAJEET PAL3
YAN CHEN1
LICHUAN WANG1
1College of Textile and Clothing Engineering, Soochow University,Suzhou 215006, China
2“Gheorghe Asachi” Technical University of Iasi,Bulevardul Profesor Dimitrie Mangeron 67, Iasi, 700050, Romania
3Faculty of Textiles, Engineering and Business, University of Borås,Allégatan 1, 5013 9032 Borås, Sweden
Corresponding author:
LICHUAN WANG
e-mail: [email protected]
[5] Tipper, M.J., et al. Principles of the recovery and reuse of corporate clothing. In: Proceedings of the ICE – Waste
and Resource Management, 2010, 163 (November), p. 165–172.
[6] Woolridge, A.C., et al. Life cycle assessment for reuse/recycling of donated waste textiles compared to use of virgin
material: An UK energy saving perspective. In: Resources Conservation and Recycling, 2006, 46(1), pp. 94–103.
[7] Paras, M.K. and Curteza, A. Revisiting upcycling phenomena: a concept in clothing industry. In: Research Journal
of Textile and Apparel, 2018, 22(1), pp. 46–58.
[8] Paras, M.K., Pal, R. and Ekwall, D. Systematic literature review to develop a conceptual framework for a reuse-
based clothing value chain. In: The International Review of Retail, Distribution and Consumer Research, 2017,
pp. 1–28.
[9] Paras, M.K., et al. An exploratory study of Swedish Charities to develop a model for the reuse-based clothing value
chain. In: Sustainability, 2018, 10(4), p. 1176.
[10] Herriott, R.E. and Firestone, W.A. Multisite qualitative policy research: Optimizing description and generalizability.
In: Educational Researcher, 1983, 12(2), pp. 14–19.
[11] Czarniawska, B., Social science research: From field to desk, 2014, SAGE Publications.
[12] Bryman, A. and Bell, E. Business research methods, 2015, Oxford University Press.
INTRODUCTION
Textiles and clothing have been the major productsfor industrializing countries which played a criticalrole in Britain, North America, Japan and Turkey forthe last two decades. Before the World War II,Western Europe countries and the US controlled theworld economy as well as the industrial production.Afterwards, less developed countries took the controlof production and providing the raw materials.Industrial textile production totally moved to Japanafter 1940’s when she became the leader of eco-nomic development in the region of Asian. Later onhigh production costs had compelled for the newinvestments in other Asian countries such as Japan,Hong Kong, South Korea and Taiwan. During thesame period, textile industries in Europe (Germany,Italy, England, France) began to produce at largecapacities with the imported yarns provided from thenearest countries such as Turkey. Turkish textileindustry has begun its spreading across the countrywith the foundation of Turkish Republic in 1923. Thebig state enterprise “Sümerbank” encouraged for sec-tor with the initial developments on textile and appar-el sector until it was privatized. The new investments
in textile and apparel sector launched after the sec-ond half of 1995 when the quantitative restrictions intextile trade between Europe and Turkey were totallyeliminated. Turkish textile companies and exportersmaintain their presence in the most foreign marketsof Europe [1–2]. The geographical location allowingtrade in the region makes the country much moreadvantageous than its competitors. She has thedynamism for taking part in the new growing marketsas a result of globalization [3]. The profitability of themarkets in the country has improved a lot owing toconcentrating on marketing and distribution. It wasthought that Turkish Lira depreciation in 2018 andresponse of Turkish textile sector which is veryimportant among Europe and World textile industryshould be evaluated for the possible effects ofexchange rate fluctuations on Turkish firms.
FOREIGN EXCHANGE RISK IN TURKISHTEXTILE SECTOR
Importance of textile on Turkish economy
There has been an appreciable effect of Turkish tex-tile and clothing sector on Turkey’s development andgrowth for the last 30 years. It is known that sector
291industria textila 2019, vol. 70, nr. 3˘
The impact of foreign exchange movements on Turkish textile sector
DOI: 10.35530/IT.070.03.1591
YUSUF KAYA GIZEM GÜNAYDIN KARAKANEMILIA VISILEANU
REZUMAT – ABSTRACT
Impactul mișcărilor de schimb valutar asupra sectorului textil din Turcia
Datorită importanței lanțului de aprovizionare global și a exporturilor de înaltă tehnologie, importanța noilor piețe îndezvoltare crește treptat. Turcia păstrează poziția strategică pentru sectorul textil, fiind situată în punctul central dintreBalcani, Asia, Orientul Mijlociu, Africa de Nord, Europa de Est și Rusia. Poziția geografică care permite un comerț mult maiavantajos în regiune face ca țara să fie mult mai competitivă decât concurenții săi. Cu toate acestea, devalorizarea șivolatilitatea lirei turcești în 2018 au afectat grav sectorul textil din Turcia. Acest studiu urmărește să determine impactulfluctuațiilor cursului de schimb asupra performanțelor firmelor din industria textilă din Turcia între anii 2013 și 2017. În plus,a fost efectuată o analiză de regresie multiplă pentru a investiga impactul vechimii și mărimii firmei asupra perfor manțeiacesteia. Potrivit rezultatelor, volatilitatea cursului de schimb și dimensiunea firmelor au avut un efect negativ asupraperformanței firmelor, în timp ce vechimea firmei nu a avut nicio influență semnificativă asupra acestui indicator.
Cuvinte-cheie: schimb valutar, firme din industria textilă, sectorul textil din Turcia, performanța firmelor, valoarea firmelor
The impact of foreign exchange movements on Turkish textile sector
Due to importance of global supply chain and high-tech exports, importance of new developing markets is graduallyincreasing. Turkey keeps the strategic importance for textile sector being in the center of Balkans, Asia, Middle East, NorthAfrica, Eastern Europe and Russia. The geographical location allowing trade in the region makes the country much moreadvantageous than its competitors. However, devaluation and the exchange rate volatility of Turkish Lira in 2018 have beenseriously affecting Turkish textile sector. This study aims to determine the impact of exchange rate fluctuation on Turkishtextile firms’ performance between the years of 2013 and 2017. Additionally, multiple regression analysis was done in orderto investigate the impact of firms’ performance such as firm age and firm size on performance of the textile firms. Accordingto results, it was observed that exchange rate volatility had a negative effect on the firm performance and the firm size hada negative effect on firm performance while the firm age did not have any influence on firms’ performance significantly.
Keywords: exchange rate, textile firms, Turkish textile sector, firm performance, firm value
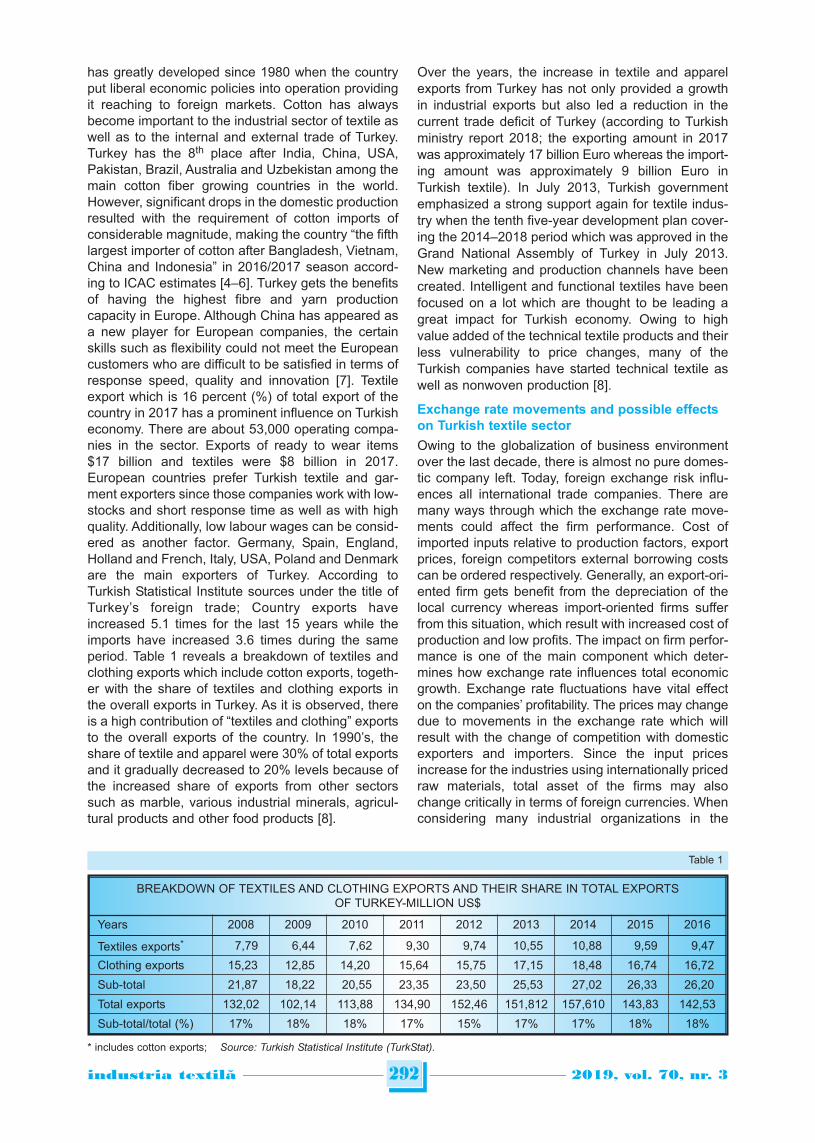
292industria textila 2019, vol. 70, nr. 3˘
has greatly developed since 1980 when the countryput liberal economic policies into operation providingit reaching to foreign markets. Cotton has alwaysbecome important to the industrial sector of textile aswell as to the internal and external trade of Turkey.Turkey has the 8th place after India, China, USA,Pakistan, Brazil, Australia and Uzbekistan among themain cotton fiber growing countries in the world.However, significant drops in the domestic productionresulted with the requirement of cotton imports ofconsiderable magnitude, making the country “the fifthlargest importer of cotton after Bangladesh, Vietnam,China and Indonesia” in 2016/2017 season accord-ing to ICAC estimates [4–6]. Turkey gets the benefitsof having the highest fibre and yarn productioncapacity in Europe. Although China has appeared asa new player for European companies, the certainskills such as flexibility could not meet the Europeancustomers who are difficult to be satisfied in terms ofresponse speed, quality and innovation [7]. Textileexport which is 16 percent (%) of total export of thecountry in 2017 has a prominent influence on Turkisheconomy. There are about 53,000 operating compa-nies in the sector. Exports of ready to wear items$17 billion and textiles were $8 billion in 2017.European countries prefer Turkish textile and gar-ment exporters since those companies work with low-stocks and short response time as well as with highquality. Additionally, low labour wages can be consid-ered as another factor. Germany, Spain, England,Holland and French, Italy, USA, Poland and Denmarkare the main exporters of Turkey. According toTurkish Statistical Institute sources under the title ofTurkey’s foreign trade; Country exports haveincreased 5.1 times for the last 15 years while theimports have increased 3.6 times during the sameperiod. Table 1 reveals a breakdown of textiles andclothing exports which include cotton exports, togeth-er with the share of textiles and clothing exports inthe overall exports in Turkey. As it is observed, thereis a high contribution of “textiles and clothing” exportsto the overall exports of the country. In 1990’s, theshare of textile and apparel were 30% of total exportsand it gradually decreased to 20% levels because ofthe increased share of exports from other sectorssuch as marble, various industrial minerals, agricul-tural products and other food products [8].
Over the years, the increase in textile and apparelexports from Turkey has not only provided a growthin industrial exports but also led a reduction in thecurrent trade deficit of Turkey (according to Turkishministry report 2018; the exporting amount in 2017was approximately 17 billion Euro whereas the import-ing amount was approximately 9 billion Euro inTurkish textile). In July 2013, Turkish governmentemphasized a strong support again for textile indus-try when the tenth five-year development plan cover-ing the 2014–2018 period which was approved in theGrand National Assembly of Turkey in July 2013.New marketing and production channels have beencreated. Intelligent and functional textiles have beenfocused on a lot which are thought to be leading agreat impact for Turkish economy. Owing to highvalue added of the technical textile products and theirless vulnerability to price changes, many of theTurkish companies have started technical textile aswell as nonwoven production [8].
Exchange rate movements and possible effectson Turkish textile sector
Owing to the globalization of business environmentover the last decade, there is almost no pure domes-tic company left. Today, foreign exchange risk influ-ences all international trade companies. There aremany ways through which the exchange rate move-ments could affect the firm performance. Cost ofimported inputs relative to production factors, exportprices, foreign competitors external borrowing costscan be ordered respectively. Generally, an export-ori-ented firm gets benefit from the depreciation of thelocal currency whereas import-oriented firms sufferfrom this situation, which result with increased cost ofproduction and low profits. The impact on firm perfor-mance is one of the main component which deter-mines how exchange rate influences total economicgrowth. Exchange rate fluctuations have vital effecton the companies’ profitability. The prices may changedue to movements in the exchange rate which willresult with the change of competition with domesticexporters and importers. Since the input pricesincrease for the industries using internationally pricedraw materials, total asset of the firms may alsochange critically in terms of foreign currencies. Whenconsidering many industrial organizations in the
BREAKDOWN OF TEXTILES AND CLOTHING EXPORTS AND THEIR SHARE IN TOTAL EXPORTS OF TURKEY-MILLION US$
Years 2008 2009 2010 2011 2012 2013 2014 2015 2016
Textiles exports* 7,79 6,44 7,62 9,30 9,74 10,55 10,88 9,59 9,47
Clothing exports 15,23 12,85 14,20 15,64 15,75 17,15 18,48 16,74 16,72
Sub-total 21,87 18,22 20,55 23,35 23,50 25,53 27,02 26,33 26,20
Total exports 132,02 102,14 113,88 134,90 152,46 151,812 157,610 143,83 142,53
Sub-total/total (%) 17% 18% 18% 17% 15% 17% 17% 18% 18%
Table 1
* includes cotton exports; Source: Turkish Statistical Institute (TurkStat).
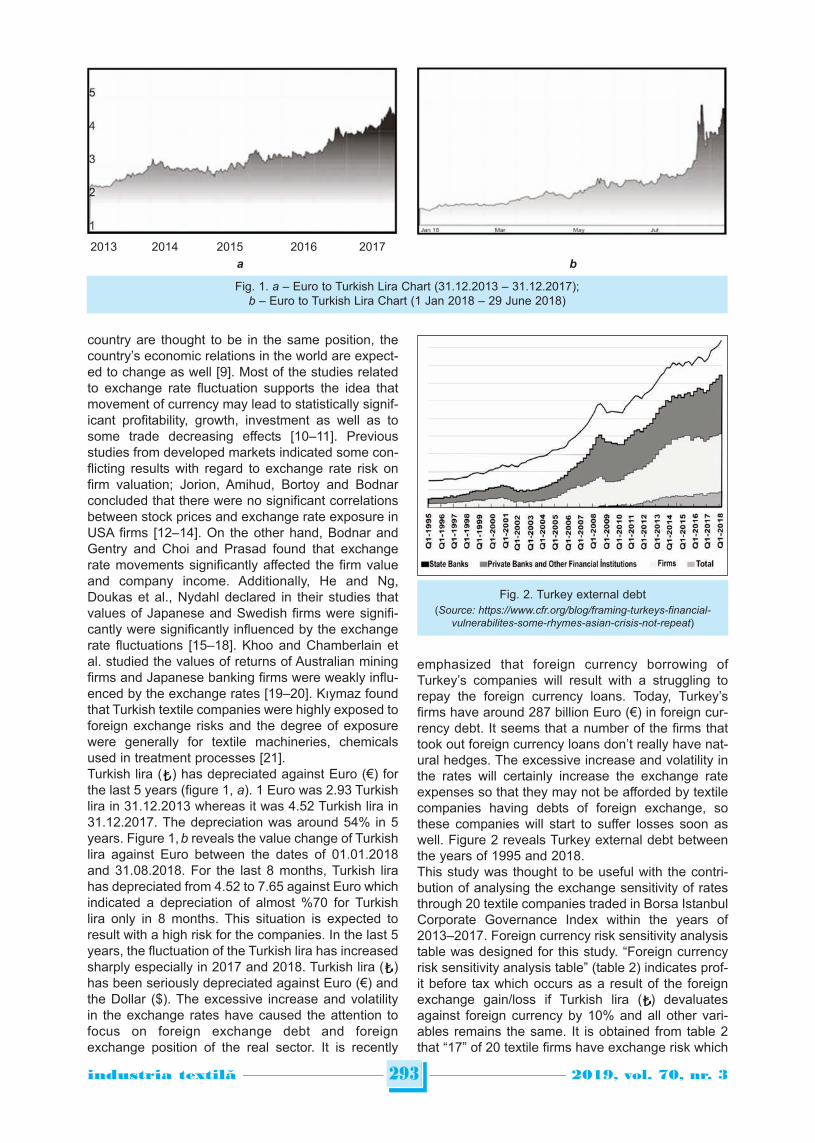
293industria textila 2019, vol. 70, nr. 3˘
country are thought to be in the same position, thecountry’s economic relations in the world are expect-ed to change as well [9]. Most of the studies relatedto exchange rate fluctuation supports the idea thatmovement of currency may lead to statistically signif-icant profitability, growth, investment as well as tosome trade decreasing effects [10–11]. Previousstudies from developed markets indicated some con-flicting results with regard to exchange rate risk onfirm valuation; Jorion, Amihud, Bortoy and Bodnarconcluded that there were no significant correlationsbetween stock prices and exchange rate exposure inUSA firms [12–14]. On the other hand, Bodnar andGentry and Choi and Prasad found that exchangerate movements significantly affected the firm valueand company income. Additionally, He and Ng,Doukas et al., Nydahl declared in their studies thatvalues of Japanese and Swedish firms were signifi-cantly were significantly influenced by the exchangerate fluctuations [15–18]. Khoo and Chamberlain etal. studied the values of returns of Australian miningfirms and Japanese banking firms were weakly influ-enced by the exchange rates [19–20]. Kıymaz foundthat Turkish textile companies were highly exposed toforeign exchange risks and the degree of exposurewere generally for textile machineries, chemicalsused in treatment processes [21]. Turkish lira (�) has depreciated against Euro (€) forthe last 5 years (figure 1, a). 1 Euro was 2.93 Turkishlira in 31.12.2013 whereas it was 4.52 Turkish lira in31.12.2017. The depreciation was around 54% in 5years. Figure 1, b reveals the value change of Turkishlira against Euro between the dates of 01.01.2018and 31.08.2018. For the last 8 months, Turkish lirahas depreciated from 4.52 to 7.65 against Euro whichindicated a depreciation of almost %70 for Turkishlira only in 8 months. This situation is expected toresult with a high risk for the companies. In the last 5years, the fluctuation of the Turkish lira has increasedsharply especially in 2017 and 2018. Turkish lira (�)has been seriously depreciated against Euro (€) andthe Dollar ($). The excessive increase and volatilityin the exchange rates have caused the attention tofocus on foreign exchange debt and foreignexchange position of the real sector. It is recently
emphasized that foreign currency borrowing ofTurkey’s companies will result with a struggling torepay the foreign currency loans. Today, Turkey’sfirms have around 287 billion Euro (€) in foreign cur-rency debt. It seems that a number of the firms thattook out foreign currency loans don’t really have nat-ural hedges. The excessive increase and volatility inthe rates will certainly increase the exchange rateexpenses so that they may not be afforded by textilecompanies having debts of foreign exchange, sothese companies will start to suffer losses soon aswell. Figure 2 reveals Turkey external debt betweenthe years of 1995 and 2018.This study was thought to be useful with the contri-bution of analysing the exchange sensitivity of ratesthrough 20 textile companies traded in Borsa IstanbulCorporate Governance Index within the years of2013–2017. Foreign currency risk sensitivity analysistable was designed for this study. “Foreign currencyrisk sensitivity analysis table” (table 2) indicates prof-it before tax which occurs as a result of the foreignexchange gain/loss if Turkish lira ( ) devaluatesagainst foreign currency by 10% and all other vari-ables remains the same. It is obtained from table 2that “17” of 20 textile firms have exchange risk which
Fig. 1. a – Euro to Turkish Lira Chart (31.12.2013 – 31.12.2017);b – Euro to Turkish Lira Chart (1 Jan 2018 – 29 June 2018)
2013 2014 2015 2016 2017a b
Fig. 2. Turkey external debt(Source: https://www.cfr.org/blog/framing-turkeys-financial-
vulnerabilites-some-rhymes-asian-crisis-not-repeat)
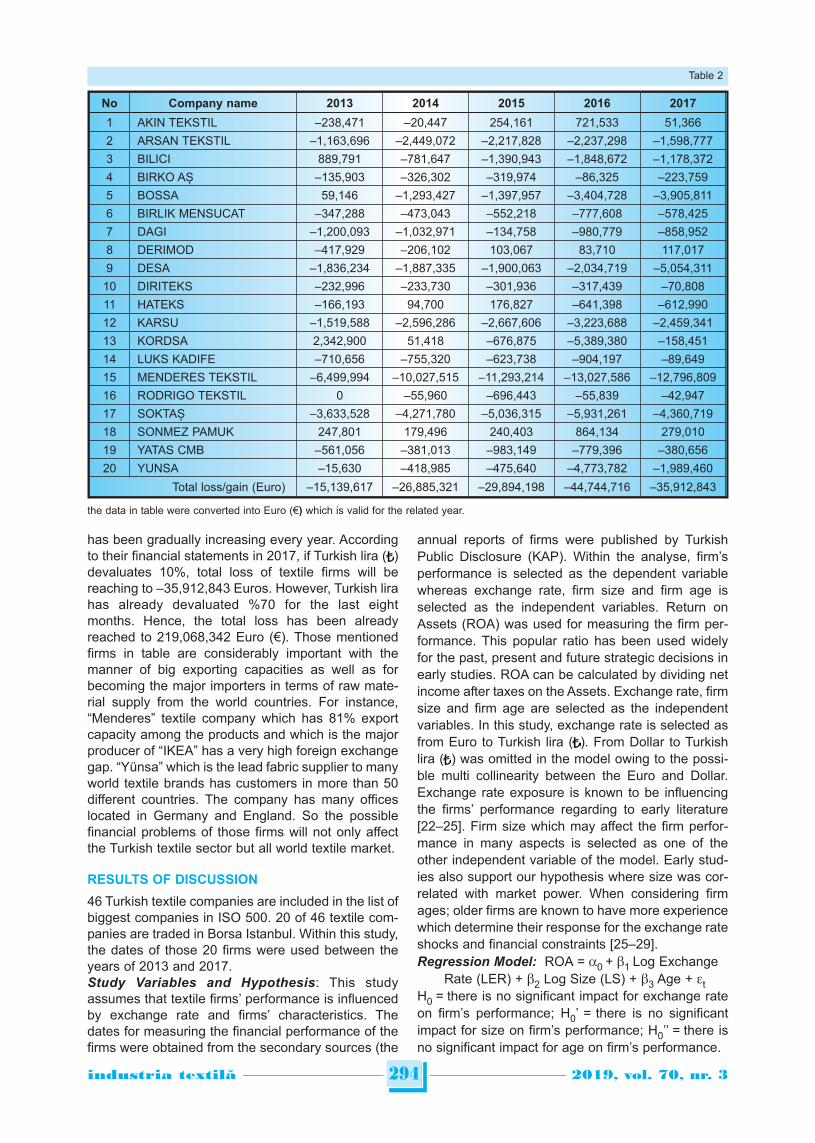
the data in table were converted into Euro (€) which is valid for the related year.
has been gradually increasing every year. Accordingto their financial statements in 2017, if Turkish lira ( )devaluates 10%, total loss of textile firms will bereaching to –35,912,843 Euros. However, Turkish lirahas already devaluated %70 for the last eightmonths. Hence, the total loss has been alreadyreached to 219,068,342 Euro (€). Those mentionedfirms in table are considerably important with themanner of big exporting capacities as well as forbecoming the major importers in terms of raw mate-rial supply from the world countries. For instance,“Menderes” textile company which has 81% exportcapacity among the products and which is the majorproducer of “IKEA” has a very high foreign exchangegap. “Yünsa” which is the lead fabric supplier to manyworld textile brands has customers in more than 50different countries. The company has many officeslocated in Germany and England. So the possiblefinancial problems of those firms will not only affectthe Turkish textile sector but all world textile market.
RESULTS OF DISCUSSION
46 Turkish textile companies are included in the list ofbiggest companies in ISO 500. 20 of 46 textile com-panies are traded in Borsa Istanbul. Within this study,the dates of those 20 firms were used between theyears of 2013 and 2017. Study Variables and Hypothesis: This studyassumes that textile firms’ performance is influencedby exchange rate and firms’ characteristics. Thedates for measuring the financial performance of thefirms were obtained from the secondary sources (the
annual reports of firms were published by TurkishPublic Disclosure (KAP). Within the analyse, firm’sperformance is selected as the dependent variablewhereas exchange rate, firm size and firm age isselected as the independent variables. Return onAssets (ROA) was used for measuring the firm per-formance. This popular ratio has been used widelyfor the past, present and future strategic decisions inearly studies. ROA can be calculated by dividing netincome after taxes on the Assets. Exchange rate, firmsize and firm age are selected as the independentvariables. In this study, exchange rate is selected asfrom Euro to Turkish lira ( ). From Dollar to Turkishlira ( ) was omitted in the model owing to the possi-ble multi collinearity between the Euro and Dollar.Exchange rate exposure is known to be influencingthe firms’ performance regarding to early literature[22–25]. Firm size which may affect the firm perfor-mance in many aspects is selected as one of theother independent variable of the model. Early stud-ies also support our hypothesis where size was cor-related with market power. When considering firmages; older firms are known to have more experiencewhich determine their response for the exchange rateshocks and financial constraints [25–29].Regression Model: ROA = a0 + b1 Log Exchange
Rate (LER) + b2 Log Size (LS) + b3 Age + etH0 = there is no significant impact for exchange rateon firm’s performance; H0’ = there is no significantimpact for size on firm’s performance; H0’’ = there isno significant impact for age on firm’s performance.
294industria textila 2019, vol. 70, nr. 3˘
No Company name 2013 2014 2015 2016 2017
1 AKIN TEKSTIL –238,471 –20,447 254,161 721,533 51,366
2 ARSAN TEKSTIL –1,163,696 –2,449,072 –2,217,828 –2,237,298 –1,598,777
3 BILICI 889,791 –781,647 –1,390,943 –1,848,672 –1,178,372
4 BIRKO AȘ –135,903 –326,302 –319,974 –86,325 –223,759
5 BOSSA 59,146 –1,293,427 –1,397,957 –3,404,728 –3,905,811
6 BIRLIK MENSUCAT –347,288 –473,043 –552,218 –777,608 –578,425
7 DAGI –1,200,093 –1,032,971 –134,758 –980,779 –858,952
8 DERIMOD –417,929 –206,102 103,067 83,710 117,017
9 DESA –1,836,234 –1,887,335 –1,900,063 –2,034,719 –5,054,311
10 DIRITEKS –232,996 –233,730 –301,936 –317,439 –70,808
11 HATEKS –166,193 94,700 176,827 –641,398 –612,990
12 KARSU –1,519,588 –2,596,286 –2,667,606 –3,223,688 –2,459,341
13 KORDSA 2,342,900 51,418 –676,875 –5,389,380 –158,451
14 LUKS KADIFE –710,656 –755,320 –623,738 –904,197 –89,649
15 MENDERES TEKSTIL –6,499,994 –10,027,515 –11,293,214 –13,027,586 –12,796,809
16 RODRIGO TEKSTIL 0 –55,960 –696,443 –55,839 –42,947
17 SOKTAȘ –3,633,528 –4,271,780 –5,036,315 –5,931,261 –4,360,719
18 SONMEZ PAMUK 247,801 179,496 240,403 864,134 279,010
19 YATAS CMB –561,056 –381,013 –983,149 –779,396 –380,656
20 YUNSA –15,630 –418,985 –475,640 –4,773,782 –1,989,460
Total loss/gain (Euro) –15,139,617 –26,885,321 –29,894,198 –44,744,716 –35,912,843
Table 2
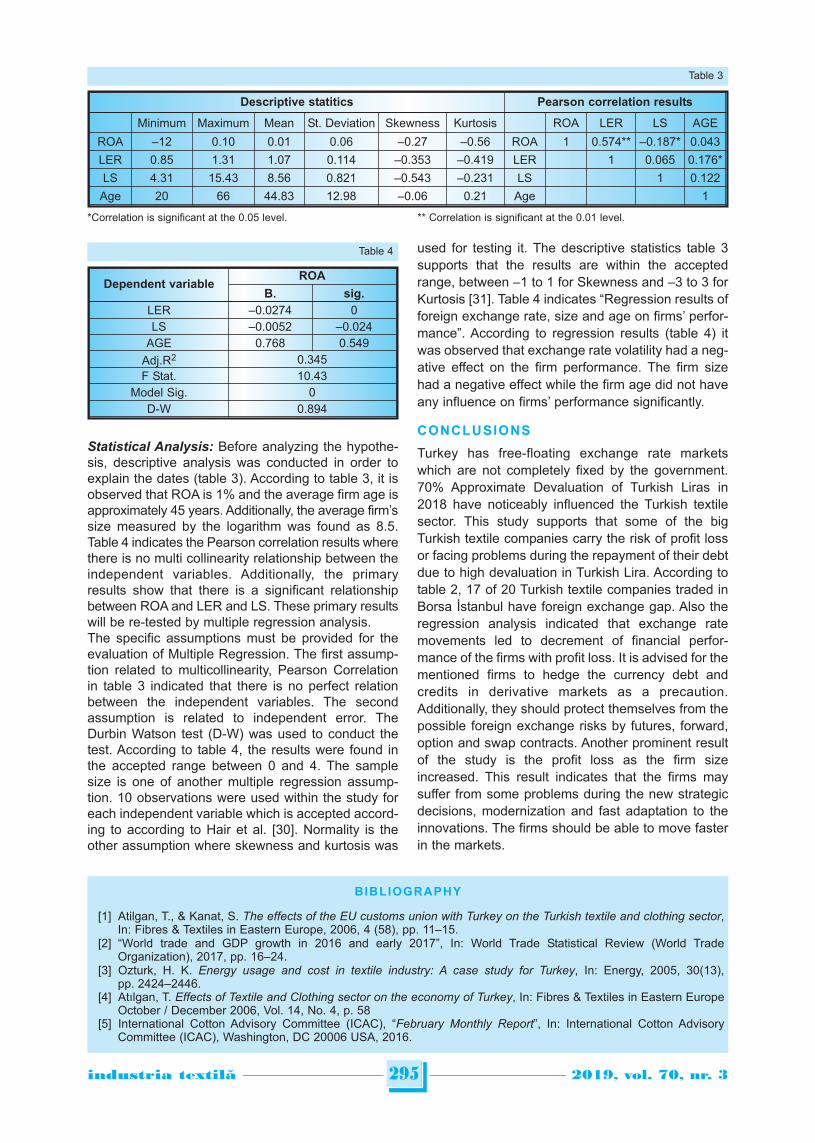
295industria textila 2019, vol. 70, nr. 3˘
BIBLIOGRAPHY
[1] Atilgan, T., & Kanat, S. The effects of the EU customs union with Turkey on the Turkish textile and clothing sector,In: Fibres & Textiles in Eastern Europe, 2006, 4 (58), pp. 11–15.
[2] “World trade and GDP growth in 2016 and early 2017”, In: World Trade Statistical Review (World TradeOrganization), 2017, pp. 16–24.
[3] Ozturk, H. K. Energy usage and cost in textile industry: A case study for Turkey, In: Energy, 2005, 30(13),pp. 2424–2446.
[4] Atılgan, T. Effects of Textile and Clothing sector on the economy of Turkey, In: Fibres & Textiles in Eastern EuropeOctober / December 2006, Vol. 14, No. 4, p. 58
[5] International Cotton Advisory Committee (ICAC), “February Monthly Report”, In: International Cotton AdvisoryCommittee (ICAC), Washington, DC 20006 USA, 2016.
Descriptive statitics Pearson correlation results
Minimum Maximum Mean St. Deviation Skewness Kurtosis ROA LER LS AGE
ROA –12 0.10 0.01 0.06 –0.27 –0.56 ROA 1 0.574** –0.187* 0.043
LER 0.85 1.31 1.07 0.114 –0.353 –0.419 LER 1 0.065 0.176*
LS 4.31 15.43 8.56 0.821 –0.543 –0.231 LS 1 0.122
Age 20 66 44.83 12.98 –0.06 0.21 Age 1
Table 3
*Correlation is significant at the 0.05 level. ** Correlation is significant at the 0.01 level.
Statistical Analysis: Before analyzing the hypothe-sis, descriptive analysis was conducted in order toexplain the dates (table 3). According to table 3, it isobserved that ROA is 1% and the average firm age isapproximately 45 years. Additionally, the average firm’ssize measured by the logarithm was found as 8.5.Table 4 indicates the Pearson correlation results wherethere is no multi collinearity relationship between theindependent variables. Additionally, the primaryresults show that there is a significant relationshipbetween ROA and LER and LS. These primary resultswill be re-tested by multiple regression analysis.The specific assumptions must be provided for theevaluation of Multiple Regression. The first assump-tion related to multicollinearity, Pearson Correlationin table 3 indicated that there is no perfect relationbetween the independent variables. The secondassumption is related to independent error. TheDurbin Watson test (D-W) was used to conduct thetest. According to table 4, the results were found inthe accepted range between 0 and 4. The samplesize is one of another multiple regression assump-tion. 10 observations were used within the study foreach independent variable which is accepted accord-ing to according to Hair et al. [30]. Normality is theother assumption where skewness and kurtosis was
used for testing it. The descriptive statistics table 3supports that the results are within the acceptedrange, between –1 to 1 for Skewness and –3 to 3 forKurtosis [31]. Table 4 indicates “Regression results offoreign exchange rate, size and age on firms’ perfor-mance”. According to regression results (table 4) itwas observed that exchange rate volatility had a neg-ative effect on the firm performance. The firm sizehad a negative effect while the firm age did not haveany influence on firms’ performance significantly.
CONCLUSIONS
Turkey has free-floating exchange rate marketswhich are not completely fixed by the government.70% Approximate Devaluation of Turkish Liras in2018 have noticeably influenced the Turkish textilesector. This study supports that some of the bigTurkish textile companies carry the risk of profit lossor facing problems during the repayment of their debtdue to high devaluation in Turkish Lira. According totable 2, 17 of 20 Turkish textile companies traded inBorsa İstanbul have foreign exchange gap. Also theregression analysis indicated that exchange ratemovements led to decrement of financial perfor-mance of the firms with profit loss. It is advised for thementioned firms to hedge the currency debt andcredits in derivative markets as a precaution.Additionally, they should protect themselves from thepossible foreign exchange risks by futures, forward,option and swap contracts. Another prominent resultof the study is the profit loss as the firm sizeincreased. This result indicates that the firms maysuffer from some problems during the new strategicdecisions, modernization and fast adaptation to theinnovations. The firms should be able to move fasterin the markets.
Dependent variableROA
B. sig.
LER –0.0274 0LS –0.0052 –0.024
AGE 0.768 0.549Adj.R2 0.345F Stat. 10.43
Model Sig. 0D-W 0.894
Table 4
296industria textila 2019, vol. 70, nr. 3˘
Authors:
YUSUF KAYA1, GIZEM GÜNAYDIN KARAKAN1,2, EMILIA VISILEANU3
1Pamukkale University, Buldan Vocational School, Accounting Programme, 20400, Buldan, Denizli, Turkey2Pamukkale University, Buldan Vocational School, Fashion&Design Programme, 20400, Buldan, Denizli, Turkey
3The National Research and Development Institute for Textiles and Leather, 030508, Bucharest, Romania
e-mail: [email protected]; [email protected]
Corresponding author:
YUSUF KAYA
e-mail: [email protected]
[6] Karaalp, H. S., & Yilmaz, N. D. Assessment of trends in the comparative advantage and competitiveness of theTurkish textile and clothing industry in the enlarged EU market, In: Fibres & Textiles in Eastern Europe, 2012, No. 3(92), pp. 8–12.
[7] Asalos, N., & Lordanescu, M. The contribution of clusters to increase the competitiveness of the textile and clothingindustry. Cluster analysis using location quotient method/Contributia clusterelor la cresterea competitivitatiiindustriei textile si de confectii. Analiza acestora prin metoda coeficientului de localizare, In: Industria Textila,2015, 66(6), p. 370.
[8] TUİK (TURKISH STATISTICAL INSTITUTE), «http://www.tuik.gov.tr/PreTablo.do?alt_id=1001,» [Online]. [Date ofaccess: 14 06 2018].
[9] Nagahisarchoghaei, M., Nagahi, M., & Soleimani, N. Impact of exchange rate movements on Indian firmperformance, In: International Journal of Finance and Accounting, 2018, 7(4), pp. 108-121, DOI:10.5923/j.ijfa.20180704.03.
[10] Aizenman, J., Edwards, S., & Riera-Crichton, D. Adjustment patterns to commodity terms of trade shocks: the roleof exchange rate and international reserves policies, 2012, In: Journal of International Money and Finance, 31, (8),pp. 1990–2016.
[11] Greenaway, D., Kneller, R., & Zhang, X. The effect of exchange rates on firm exports: The role of importedintermediate inputs, In: The World Economy, 2010, 33(8), pp. 961–986.
[12] Jorion, P. The exchange-rate exposure of US multinationals, In: Journal of business, 1990, pp. 331–345.[13] Amihud, Y., Levich, R. Exchange rates and the valuation of equity shares, In: Exchange Rates and Corporate
Performance, Irwin, New York, 1994, pp. 49–59.[14] Bartov, E. and Bodnar, G. M. Firm valuation, earnings expectations, and the exchange rate exposure effect, In:
Journal of Finance, 1994, Vol. 49, pp. 1755–85.[15] Bodnar, G. M., Gentry, W.M. Exchange rate exposure and industry characteristics: evidence from Canada, Japan,
and the USA, In: Journal of International Money and Finance, 1993, February, pp. 29–45.[16] He, J. and Ng, L. The foreign exchange exposure of Japanese multinational corporations, In: Journal of Finance,
Vol. 53, 1998, pp. 733–53.[17] Doukas, J., Hall, P. H. and Lang, L. H. P. The pricing of currency risk in Japan, In: Journal of Banking and Finance,
1999, Vol. 23, pp. 1–20.[18] Nydahl, S. Exchange rate exposure, foreign involvement and currency hedging of firms: some Swedish evidence,
In: European Financial Management, 1999, Vol. 5, pp. 241–57.[19] Khoo, A. Estimation of foreign exchange exposure: an application to mining companies in Australia, In: Journal of
International Money and Finance, 1994, vol. 13, issue 3, pp. 342–363[20] Chamberlain, S., Howe, J. and Popper, H. The exchange rate exposure of US and Japanese banking institutions,
In: Journal of Banking and Finance, 1997, Vol. 21, pp. 871–92.[21] Kiymaz, H. Estimation of foreign exchange exposure: an emerging market application, In: Journal of Multinational
Financial Management, 2003, 13(1), pp. 71–84.[22] Choi, J. J., & Prasad, A. M. Exchange risk sensitivity and its determinants: a firm and industry analysis of US
multinationals, In: Financial Management, 1995, pp. 77–88.[23] McGuire, J. B., Sundgren, A., & Schneeweis, T. Corporate social responsibility and firm financial performance, In:
Academy of management Journal, 1988, 31(4), pp. 854–872.[24] Kobeissi, N. (2004, March). Ownership structure and bank performance: evidence from the Middle East and North
Africa. Economic Research Forum.[25] Adler, M., & Dumas, B. (1984). Exposure to currency risk: definition and measurement, In: Financial management,
pp. 41–50.[26] Jorion, P. The exchange-rate exposure of US multinationals, In: Journal of business, 1990, pp. 331–345.[27] Shepherd, W. G. (1986) On the Core Concepts of Industrial Economics, In: H.W. De Jong and W. G. Shepherd, eds,
Mainstreams in Industrial Organization. Dordrecht: Martinus Nijhoff Publishers.[28] Leibenstein, H. (1976) Beyond Economic Man. Cambridge, MA: Harvard University Press.[29] Nagahisarchoghaei, M., Nagahi, M., & Soleimani, N. Impact of Exchange Rate Movements on Indian Firm
Performance, In: International Journal of Finance and Accounting 2018, 7(4): pp.108–121, DOI: 10.5923/j.ijfa.20180704.03.
[30] Hair.Jr., J. F., Black., W. C., Babin., B. J., Anderson., R. E., & L.Tatham., R. (2006). Multivariant Data Analysis.In: New Jersey: Pearson International Edition.
[31] Jain, T.R. & Aggarwal Dr. S.C. 2008. Quantitative methods for MBA. New Delhi: V.K. (India) Enterprises