economie ^i sociologie / economy and sociology 1 - … · economie ^i sociologie / economy and...
TRANSCRIPT

ECONOMIE ŞI SOCIOLOGIE / ECONOMY AND SOCIOLOGY 1
Nr. 3 / 2013
Revistă teoretico-științifică / Theoretical and scientifical journal2
Nr. 3 / 2013
ECONOMIE şi SOCIOLOGIE
REVISTĂ
Ministerul Economieial Republicii Moldova
Academia de Ştiinţea Moldovei
revistă teoretico-ştiinţifică, fondată în anul 1953
Institutul de Economie, Finanţe şi Statistică
Nr. 3 / 2013
ISSN: 1857-4130Revista este indexată în DOAJ.
Chişinău, 2013

ECONOMIE ŞI SOCIOLOGIE / ECONOMY AND SOCIOLOGY 3
Nr. 3 / 2013
COLEGIUL DE REDACŢIE:
Redactor-şef:Gheorghe ILIADI, doctor habilitat, profesor, Republica MoldovaRedactor-şef adjunct, compartimentul Economie:Vadim MACARI, doctor, conferenţiar cercetător, Republica MoldovaRedactor-şef adjunct, compartimentul Sociologie:Andrei TIMUŞ, membru corespondent, Republica Moldova
Membrii:Gheorghe MIŞCOI, membru corespondent, Republica MoldovaDavid SMALLBONE, doctor, profesor, Maria BritanieMichael GRINGS, doctor, profesor, GermaniaLuminiţa CHIVU, doctor, profesor, RomâniaAlexandr NECHIPELOV, academician, RusiaVasa LASZLO, doctor, conferenţiar, UngariaFelix ZINOVIEV, academician, profesor, UcrainaJamila BOPIEVA, doctor habilitat, profesor, KazahstanVilayat VALIYEV, doctor, AzerbaijanDumitru MOLDOVAN, membru corespondent, Republica MoldovaElena PĂDUREAN, doctor, RomâniaAlexandru STRATAN, doctor habilitat, Republica MoldovaGalina ULIAN, doctor habilitat, profesor, Republica MoldovaAlexandru GRIBINCEA, doctor habilitat, profesor, Republica MoldovaDmitrii PARMACLI, doctor habilitat, profesor, Republica MoldovaIon SÂRBU, doctor habilitat, profesor universitar, Republica MoldovaVictoria GANEA, doctor, conferenţiar, Republica MoldovaVictoria TROFIMOV, doctor, conferenţiar, Republica MoldovaTudor BAJURA, doctor habilitat, profesor, Republica MoldovaValeriu DOGA, doctor habilitat, profesor, Republica MoldovaTatiana MANOLE, doctor habilitat, profesor, Republica MoldovaVictor MOCANU, doctor, conferenţiar, Republica MoldovaAnatol ROJCO, doctor, conferenţiar, Republica MoldovaAngela TIMUŞ, doctor, conferenţiar, Republica MoldovaGalina SAVELIEVA, doctor, conferenţiar, Republica MoldovaRadu CUHAL, doctor, conferenţiar, Republica Moldova
Conform deciziei Comisiei Superioare de Atestare a CNAA, revista „Economie şi Sociologie” este inclusă în„Lista revistelor recomandate pentru a fi recunoscute în calitate de publicaţii ştiinţifice de profil” şi acreditată cuCategoria „B”.
Revista este indexată în DOAJ .© Institutul de Economie, Finanţe şi Statistică al AŞM şi ME
© Secţia de Sociologie a Institutului Integrare Europeană şi Ştiinţe Politice al AŞM
Preluarea textelor editate în revista „Economie şi Sociologie” este posibilă doar cu acordulautorului. Responsabilitatea asupra fiecărui text publicat aparţine autorilor. Opinia redacţiei nu coincide totdeauna cuopinia autorilor.
Redactor-şef CE: Iulita BÎRCĂRedactori (limba română): Andrian SCLIFOS, Tatiana PARVAN, Victoria BORDOS
Redactori (limba engleză): Eugenia LUCAŞENCO, Svetlana DODONDesigner copertă: Alexandru SANDULESCU
Redactare bibliografică: Nina DALINITCHI, Diana PELEPCIUC, Angelina CATANATehnoredactore: Nadejda TÎMBUR
Adresa redacţiei: Complexul Editorial, IEFS, MD-2064,or. Chişinău, str. Ion Creangă, 45. tel.: 022-50-11-30, fax: 022-74-37-94
web: www.iefs.md/complexul-editorial/; e-mail: [email protected]
Revistă teoretico-științifică / Theoretical and scientifical journal4
Nr. 3 / 2013
ECONOMY and SOCIOLOGY
REVISTĂ
Academy of Sciencesof Moldova
Ministry of Economyof the Republic of Moldova
Institute of Economy, Finance and Statistics
theoretical and scientifical journal, founded in 1953
Chisinau, 2013
No. 3 / 2013
ISSN: 1857-4130The journal is indexed in DOAJ.
ECONOMIE ŞI SOCIOLOGIE / ECONOMY AND SOCIOLOGY 5
Nr. 3 / 2013
EDITORIAL BOARD:
Editor-in-chief:Gheorghe ILIADI, PhD, Professor, Republic of MoldovaEditor-in-chief of Economics department:Vadim MACARI, PhD, Associate Professor, Republic of MoldovaEditor-in-chief of Sociology department:Andrei TIMUŞ, Associate Member, Republic of Moldova
Members:Gheorghe MIŞCOI, Associate Member, Republic of MoldovaDavid SMALLBONE, PhD, Professor, Great BritainMichael GRINGS, PhD, Professor, GermanyLuminita CHIVU, PhD, Professor, RomaniaAlexandr NECHIPELOV, Academician, RussiaVasa LASZLO, PhD, HungaryFelix ZINOVIEV, Academician, Professor, UkraineJamila BOPIEVA, PhD, KazakhstanVilayat VALIYEV, PhD, AzerbaijanDumitru MOLDOVAN, Associate Member, Republic of MoldovaElena PADUREAN, PhD, CCEE, Romanian Academy, RomaniaAlexandru STRATAN, PhD, Professor, Republic of MoldovaGalina ULIAN, PhD, Professor, Republic of MoldovaAlexandru GRIBINCEA, PhD, Professor, Republic of MoldovaDmitrii PARMACLI, PhD, Professor, Republic of MoldovaIon SÂRBU, PhD, Professor, Republic of MoldovaVictoria GANEA, PhD, Associate Professor, Republic of MoldovaVictoria TROFIMOV, PhD, Associate Professor, Republic of MoldovaTudor BAJURA, PhD, Professor, Republic of MoldovaValeriu DOGA, PhD, Professor, Republic of MoldovaTatiana MANOLE, PhD, Professor, Republic of MoldovaVictor MOCANU, PhD, Associate Professor, Republic of MoldovaAnatol ROJCO, PhD, Associate Professor, Republic of MoldovaAngela TIMUŞ, PhD, Associate Professor, Republic of MoldovaGalina SAVELIEVA, PhD, Associate Professor, Republic of MoldovaRadu CUHAL, PhD, Associate Professor, Republic of Moldova
According to the decision of the Supreme Attestation Commission of NCAA, the journal „Economy andSociology” is included in „The list of recommended journals to be recognized as scientific profile publications”,and is accredited with „B” category.
The journal is indexed in DOAJ.
© Institute of Economy, Finance and Statistics of ASM and ME© Sociology Department of Institute of European Integration and Political Science of ASM
The taking over of the texts that are published in the journal „Economy and Sociology” is possible only with theauthor’s agreement. Responsibility for each published text belongs to the authors. Authors views are not alwaysaccorded the editorial board’s opinion.
Editor-in-chief EC: Iulita BIRCAEditors (Romanian): Andrian SCLIFOS, Tatiana PARVAN, Victoria BORDOS
Editors (English): Eugenia LUCASENCO, Svetlana DODONDesigner: Alexandru SANDULESCU
Bibliographic editors: Nina DALINITCHI, Diana PELEPCIUC, Angelina CATANATehnoredactore: Nadejda TÎMBUR
Address: Editorial Complex, IEFS, MD-2064,Chisinau, 45, Ion Creanga str., tel.: 022-50-11-30, fax:022-74-37-94web: www.iefs.md/complexul-editorial/; e-mail: [email protected]

Revistă teoretico-științifică / Theoretical and scientifical journal6
Nr. 3 / 2013
CUPRINS
Maria DUNIN-WĄSOWICZLUPTA VALUTARĂ ÎN CALITATE DE PRACTICĂ A DESTRĂMĂRII ZONEI EURO: LOGICA GEO-ECONOMIEI ÎN LOCUL TEORIILOR EUROPENE INTEGRAŢIONISTE.............................................................. 9
Vasilii RYABOKONICONDIŢIILE MATERIALE DE PERFECŢIONARE A STRUCTURII FORŢEI DE MUNCĂ ÎN MEDIULRURAL........................................................................................................................................................................... 24
Simion CERTAN, Iulian Denis PURDESCUMEDITAŢII ASUPRA EXPERIENŢEI REFORMĂRII SISTEMELOR DE PENSII ……………………...………. 29
Natalia DOBRYANSKAIA, Vasilii POPOVICISTAREA ACTUALĂ ŞI PROBLEMELE DEZVOLTĂRII SECTORULUI AGRO-ALIMENTAR ALUCRAINEI …………………………………………………………………………………………………………… 39
Roman CHORNYIROLUL INFRASTRUCTURII SOCIALE ÎN FORMAREA ŞI DEZVOLTAREA POTENŢIALULUI MUNCIIRURALE ÎN UCRAINA……………………………………………………………………………………………… 43
Ivan LUCHIAN, Lilian CIOBANUCONCEPŢIILE TEORETICE PRIVIND BANCA VIITORULUI…………………………………………………… 47
Olga ŞTEFANIUCSTRATEGIA FINANCIARĂ: TRĂSĂTURI SPECIFICE ŞI FACTORI DE INFLUENŢĂ ÎN DOMENIULBANCAR........................................................................................................................................................................ 52
Silvestru MAXIMILIAN, Corina GRIBINCEAEVOLUŢIA CERERII ŞI OFERTEI LA RESURSELE ENERGETICE…………………………………………….. 59
Nelya CHORNAPROBLEMA DEFICITULUI RESURSELOR INVESTIŢIONALE ÎN CONTEXTUL DEZVOLTĂRIIINOVATOARE A PRODUCERII ALIMENTELOR ÎN UCRAINA………………………………………………... 67
Alexandru GRIBINCEA, Georgeta GHERGHINANECESITATEA DIMINUĂRII BĂNCILOR-GIGANTE…………………………………………………………… 71
Oxana KOVTUNAPLICAREA EXPERIENŢEI MONDIALE ÎN FORMAREA ŞI DEZVOLTAREA POTENŢIALULUIFINANCIAR AL GOSPODĂRIILOR CASNICE……………………………………………………………………. 76
Elvira NAVAL, Natalia MOCANUMODELAREA DEZVOLTĂRII SECTORULUI AGRO-INDUSTRIAL ÎN CONDIŢII DE INCERTITUDINEŞI RISC………………………………………………………………………………………………………………... 81
Petru CATAN, Viorica POPAEVALUAREA STABILITĂŢII FINANCIARE A SECTORULUI DE MICROFINANŢARE DIN REPUBLICAMOLDOVA…………………………………………………………………………………………………………… 89
Daniela DUCACAPACITĂŢILE INOVAŢIONALE ALE REPUBLICII MOLDOVA: POATE CHESTIONARULINOVAŢIONAL COMUNITAR SĂ CONTRIBUIE LA SUCCESUL UNEI ŢĂRI ÎN CURS DEDEZVOLTARE?............................................................................................................................................................ 96
Galina GLOBADEZVOLTAREA CULTURII PROCESULUI DECIZIONAL………………………………………………………. 105

ECONOMIE ŞI SOCIOLOGIE / ECONOMY AND SOCIOLOGY 7
Nr. 3 / 2013
Igor DOLGHIETAPELE DE FORMARE A PIEŢEI DE ASIGURĂRI DIN REPUBLICA MOLDOVA ŞI DEZVOLTAREAMODERNĂ A ACESTEIA…………………………………………………………………………………………… 112
Stela EFROS, Natalia BURLACUEVALUAREA CĂILOR ŞI METODELOR DE EFICIENTIZARE A REZULTATULUI ACTIVITĂŢII DEGESTIUNE A ANTREPRENORULUI CONSTRUCTIV…………………………………………………………… 121
Oleg CEBOTARI, Alexandru GRIBINCEAPERSPECTIVELE DEZVOLTĂRII ECONOMIEI MONDIALE ÎN PERIOADA POST-CRIZĂ ŞI DECREŞTERE ECONOMICĂ…………………………………………………………………………………………... 132
Iulian Denis PURDESCUASPECTE PRIVIND EVOLUŢIA PROTECŢIEI SOCIALE ÎN ROMÂNIA………………………………………. 143
Tatiana ANDREEVAPROBLEMELE ATRAGERII INVESTIŢIILOR ÎN INOVARE CA FACTOR DE CREŞTERE ECONOMICĂ AŢĂRII……………………………………………………………………………………………………………………. 150
Galina ZAPŞAMETODELE FISCALE DE MANAGEMENT A PROPRIETĂŢII CA INSTRUMENT DE REALIZARE ARELAŢIILOR DE PROPRIETATE ÎN SECTORUL AGRAR AL UCRAINEI ……………………………….. 156
Alexandru GRIBINCEA, Igor BARCARI, Amalia GURGUICIRCULAŢIA TURISTICĂ ÎNTRE REPUBLICA MOLDOVA ŞI ROMÂNIA: ABORDARE LOGISTICĂ(ASPECTE METODOLOGICE)……………………………………………………………………………………… 160
Ion PLATONINTERDEPENDENŢA RESURSELOR FORESTIERE CU ECONOMIA NAŢIONALĂ ŞI NECESITATEAASIGURĂRII DEZVOLTĂRII DURABILE A ACESTORA……………………………………………………... 175
Natalia IACHIMOVSURSELE DE INFORMAŢIE PENTRU ANALIZA REGIONALĂ: NECESITATE, DISPONIBILITATE,LACUNE ȘI RECOMANDĂRI……………………………………………………………………………………… 180
Lorina BURUIANĂANALIZA CADRULUI NORMATIV PRIVIND INVESTIŢIILE ÎN SECTORUL BANCAR – ELEMENTESENŢIAL ÎN DEZVOLTAREA BĂNCILOR DIN REPUBLICA MOLDOVA………………………………. 186

Revistă teoretico-științifică / Theoretical and scientifical journal8
Nr. 3 / 2013
CONTENTS
Maria DUNIN-WĄSOWICZCURRENCY WARFARE AS PRACTICE OF THE EUROZONE’S EFFILOCHEMENT: THE LOGIC OF GEO–ECONOMY IN LIEU OF THE EUROPEAN INTEGRATION THEORIES………………………………………... 9
Vasilii RYABOKONIMATERIAL CONDITIONS OF IMPROVING THE STRUCTURE OF LABOR FORCE IN THE RURALAREA.............................................................................................................................................................................. 24
Simion CERTAN, Iulian Denis PURDESCUREFLECTIONS ON THE EXPERIENCE OF PENSION SYSTEMS REFORM…………………………………… 29
Natalia DOBRYANSKAIA, Vasilii POPOVICICURRENT STATUS AND DEVELOPMENT PROBLEMS OF UKRAINIAN AGRO-FOOD SECTOR…………. 39
Roman CHORNYITHE ROLE OF SOCIAL INFRASTRUCTURE IN THE FORMATION AND DEVELOPMENT OF RURALUKRAINE LABOUR POTENTIAL.............................................................................................................................. 43
Ivan LUCHIAN, Lilian CIOBANUTHE ORETICAL CONCEPTS ON BANK OF FUTURE……………………………………………………………. 47
Olga ŞTEFANIUCFINANCIAL STRATEGY: SPECIFIC FEATURES AND INFLUENCE FACTORS IN THE BANKINGSYSTEM………………………………………………………………………………………………………………. 52
Silvestru MAXIMILIAN, Corina GRIBINCEAEVOLUTION OF THE DEMAND AND SUPPLY IN ENERGY RESOURCES…………………………………… 59
Nelya CHORNATHE PROBLEM OF INVESTMENT RESOURCES SCARCITY IN THE CONTEXT OF FOOD PRODUCTIONINNOVATION DEVELOPMENT IN UKRAINE…………………………………………………………………… 67
Alexandru GRIBINCEA, Georgeta GHERGHINANECESSITY TO DIMINISH THE GIANT BANKS………………………………………………………………… 71
Oksana KOVTUNTHE WORLD EXPERIENCE APPLICATION FOR THE FORMATION AND DEVELOPMENT OFFINANCIAL POTENTIAL OF HOUSEHOLDS.......................................................................................................... 76
Elvira NAVAL, Natalia MOCANUAGRICO-INDUSTRIAL SECTOR DEVELOPMENT MODELING UNDER UNCERTAINTY AND RISC…….. 81
Petru CATAN, Viorica SEPTELICIFINANCIAL STABILITY REVIEW OF THE MICROFINANCE SECTOR IN MOLDOVA................................... 89
Daniela DUCAMOLDOVA’S CHANCE TO INNOVATION: CAN THE CIS SURVEY HELP A DEVELOPING COUNTRYSUCCEED?.................................................................................................................................................................... 96
Galina GLOBADEVELOPMENT OF THE DECISION-MAKING CULTURE…………………………………………………....... 105
ECONOMIE ŞI SOCIOLOGIE / ECONOMY AND SOCIOLOGY 9
Nr. 3 / 2013
Igor DOLGHISTAGES OF FORMATION OF INSURANCE BUSINESS IN THE REPUBLIC OF MOLDOVA AND ITSMODERN DEVELOPMENT…………………………………………………………………………………………. 112
Stela EFROS, Natalia BURLACUTHE EVALUATION OF THE WAYS AND METHODS AS EFFICIENT MANAGEMENT ACTIVITYRESULT OF THE CONSTRUCTIVE ENTREPRENEUR…………………………………………………………... 121
Oleg CEBOTARI, Alexandru GRIBINCEAWORLD ECONOMIC PERSPECTIVES IN THE POST-CRISIS AND ECONOMIC GROWTH PERIODS…….. 132
Iulian Denis PURDESCUASPECTS REGARDING THE EVOLUTION OF SOCIAL PROTECTION IN ROMANIA………………………. 143
Tatiana ANDREEVAPROBLEMS OF THE ATTRACTION OF INVESTMENTS IN THE INNOVATION AS THE FACTOR OF THEECONOMIC GROWTH OF STATE………………………………………………………………………………… 150
Galina ZAPSHATAX METHODS OF PROPERTY MANAGEMENT AS AN INSTRUMENT OF PROPERTY RELATIONS INAGRICULTURE OF UKRAINE…………………………………………………………………………………….. 156
Alexandru GRIBINCEA, Igor BARCARI, Amalia GURGUITOURIST TRAFFIC BETWEEN MOLDOVA AND ROMANIA: A LOGISTICAL APPROACH(METHODOLOGICAL ISSUES)……………………………………………………………………………………. 160
Ion PLATONTHE INTERDEPENDENCE OF FOREST RESOURCES WITH THE NATIONAL ECONOMY AND THENECESSITY TO ENSURE THEIR SUSTAINABLE DEVELOPMENT…………………………………………… 175
Natalia IACHIMOVINFORMATION SOURCES FOR REGIONAL ANALYSIS: NECESSITY, AVAILABILITY, FLAWS ANDRECOMMENDATIONS................................................................................................................................................ 180
Lorina BURUIANAANALYSIS OF THE REGULATORY FRAMEWORK REGARDING INVESTMENTS IN THE BANKINGSECTOR – AS AN ESSENTIAL ELEMENT IN THE DEVELOPMENT OF BANKS OF MOLDOVA …………. 186

Revistă teoretico-științifică / Theoretical and scientifical journal10
Nr. 3 / 2013
LUPTA VALUTARĂ ÎN CALITATE DE PRACTICĂA DESTRĂMĂRII ZONEI EURO: LOGICAGEO-ECONOMIEI ÎN LOCUL TEORIILOR
EUROPENE INTEGRAŢIONISTE
Maria DUNIN-WĄSOWICZ, dr., Universitatea dinVarşovia, Institutul de Relaţii Internaţionale
CURRENCY WARFARE AS PRACTICEOF THE EUROZONE’S EFFILOCHEMENT:
THE LOGIC OF GEO–ECONOMY IN LIEU OFTHE EUROPEAN INTEGRATION THEORIES
Maria DUNIN-WĄSOWICZ, PhD, University ofWarsaw The Institute of International Relations
Deoarece destrămarea zonei euro a devenit o realitateși teoriile de integrare europeană , astfel cum sunt definiteîn teoriile existente, eşuează în a oferi o speranţă pentrusalvarea integrităţii monetare a UE, logica geo-economieieste predominantă între statele europene. În special,aceasta înseamnă că zona euro a introdus lupta valutarăfaţă de valutele statelor membre ale UE care nu folosescmoneda euro. Argumentul este că a apărut o schimbare deparadigmă departe de solidaritate faţă de politica destul delimitată, fapt diferit de ceea ce a fost înţeleas de integrareeuropeană până în prezent.
Această lucrare prezintă o abordare geo-economică pedouă niveluri pentru a analiza cum si de ce actualadestrămare a zonei euro-structurală și politică, suntrezolvate prin intermediul unor războaie valutare. La nivelteoretic, articolul susţine că un astfel de comportamentsubminează sistematic statutul monedei euro ca monedă deîncredere publică și reformulează beneficiile economice șiimportanţa internaţională a UE. Categoria empirică alucrării arată că moneda euro este percepută ca uninstrument de diferenţiere ce împiedică ritmul procesuluide extindere reală a UE, care a început în 2004 . Eforturiledin zona euro de a adopta structura sa instituţională și deguvernare exclusivă în ciuda riscurilor potenţialeimplicate, oferă toate elementele ale aceastei demonstraţii.
Concluzia duce la teza că trebuie să ne gândim maimult despre geo-economie, acest exemplu specific fiindrăzboaie valutare, pentru a discerne dacă aceastăparadigmă de IPE a devenit fie un obstacol sau un vehiculal “jocului” integrării europene.
Cuvinte-cheie: Zona euro, război valutar, geo-economie, integrare europeană, IPE .
Since the Eurozone’s Effilochement has become a factand European integration theories, as defined in existingtheories, falls short of offering a hope for the salvation ofEU’s monetary integrity, the logic of geo-economy isprevailing among the European states. In particular, itmeans that the Eurozone has introduced currency warfareagainst the currencies of EU states that do not use theeuro. The argument is that a paradigm shift away fromsolidarity towards quite narrow-minded policy hasoccurred; different from what has been understood byEuropean integration thus far.
This paper outlines a two - level geo-economic approachto analyse how and why the current Eurozone’sEffilochement - structural and political - are solved by meansof currency wars. On a theoretical level, the paper arguesthat such behaviour systematically undermines the status ofthe euro as a currency of public trust and reframes theeconomic benefits and international importance of the EU.The empirical tier of the work shows that the euro isperceived as a differentiation tool to impede the tempo of thereal enlargement process of the EU that began in 2004. TheEurozone’s efforts to adopt its exclusive institutional andgovernance structure despite the potential risks involved,provide all the elements of this demonstration.
The conclusion leads to the thesis that we need to bethink more about geo-economics, this specific examplebeing currency wars, to discern whether this paradigm ofIPE became either a hindrance or a vehicle of theEuropean integration ‘game’.
Key words: Eurozone, currency warfare, geo-economy, European integration, IPE.
JEL Classification: N14, O23, F30. F50
IntroductionSince the Eurozone’s Effilochement1 has become a fact
and European integration, as defined in existing theories,falls short of offering a hope for the salvation of EU’smonetary integrity, the logic of geo-economy is prevailingamong the European states. In particular, it means thatthe Eurozone (EZ) has introduced currency warfareagainst the currencies of EU states that do not use the euro(nEZ).
The argument is that a paradigm shift away fromsolidarity towards quite narrow-minded policy hasoccurred; different from what has been understood byEuropean integration thus far.
The EZ is going to be wider from the beginning of2014 thanks to the membership of Latvia2. Paradoxically,the political success of Latvia becomes another failure ofthe EZ inasmuch as it has demonstrated that its membersare unable to integrate any of the larger nEZ states.
1 Effilochment, fr.: a process of tearing to shreds.2 “Commission Concludes that Latvia is Ready to Adopt Euro in 2014,” (2013). Press Release, European Commission, Brussels, 5 June:1-3.
ECONOMIE ŞI SOCIOLOGIE / ECONOMY AND SOCIOLOGY 11
Nr. 3 / 2013
There is overwhelming evidence that a new model ofintegration is being applied.
This paper outlines a two-level geo-economic approach(Haliżak 2012, Luttwak 1991) to analyse how and whyEurozone’s current effilochement-structural and political-issolved by means of currency wars. On a theoretical level,the paper argues that such behaviour systematicallyundermines the status of the euro as a currency of publictrust and alters the economic benefits and internationalimportance of the EU. Its empirical tier demonstrates thatthe euro is perceived by the EZ and especially by Germany-its hegemon-as a differentiation tool to impede the tempo ofreal enlargement process of the EU that began in 2004.
I start with the notion of a currency war used as ageoeconomic instrument by states (Dunin-Wąsowicz 2012).The second part of the paper reviews how various stages ofsuch recent wars were exercised by Germany against theCzech Republic, Hungary and Poland (CHP). In the thirdpart I analyse Eurozone’s efforts to adopt its exclusiveinstitutional and governmental structure despite thepotential risks involved. The paper concludes with someconsiderations on why we need to be thinking more aboutthe paradigm of geo-economics, this specific example beingcurrency wars, that contributes to the theory of theEuropean integration ‘game’.
1. The logic of geoeconomic currency wars – makeit or break it?
How should we think about currency wars? The issuehad its greatest currency in the political theory of the 1920sand 1930s (Lieu 1939, Keynes 1932, Einzing 1931,Krzyżanowski 1926). Since then the practice has beenhardly considered by scholars. It emerged in the politicalsphere after over 80 years, when upheavals of the globalfinancial crisis within the period of 2007-2012 hasted theirrevival (Ahamed 2011, Irwin 2011, Collignon 2010). Acurrency war entails states that, in defence of their wealthand power, are apt to use the logic of geoeconomy. Itpostulates, that solving world’s contemporary dilemmas bymeans of warfare does not always become a zero–sumgame (Luttwak 1990/1991: 18-21). Alternatively, byharnessing monetary policy instruments as military ones,hostile currency collisions do have a profound impact ondistribution of power within the international arena (Gilpin,1981). Consequently, such competition between states mayand does trigger currency wars which damage both theprinciple and practice of cooperation within the worldfinancial space, as well as, in the international monetarysystem (IMS), understood as the main structural componentof this space (Dunin–Wąsowicz: 331-340).
(I) Hence, “currency wars” is a multidimensionalnotion, which comprises of three factors/levels indicatingthe aims (I) of such war, attributes (II) as well as theirmechanisms (III):
(II) a hegemon of the world financial space has beendeploying a strategy of a pre-emptive currency conflict,which is threatening to destabilize or remodel the world orregional financial spac
(III) a strategy is equal to a specifically stablemonetary or exchange rate policy determining theconditions of attainability of the world currency, as wellas, the arrangements of sudden changes within worldcapital flows. Thus, every country is able to continue onlysuch monetary policy, which goals have to stay in linewith the strategy provided by the hegemon;
(IV) a conflict is never announced, thus difficult to bequalified as activities which are continued within theframework of foreign monetary policy of the hegemon anddirected against the strategic goals of monetary-cum-exchange-rate policy of other states.
All of the above factors/levels of the notion inform usthat a currency war is in fact a conflict over principles ofmonetary policy, which mechanisms determine the worldbalance of payment (BoP). This balance had easily existedwhen states used bullion currency (Eichengreen 1996). Onthe other hand, the immanent feature of the fiat system isthe creation of imbalances. In their consequence surplusesand deficits emerge on trade/current accounts in the worldfinancial geoeconomic space.
One has to differentiate between two basic types ofimbalances: scheduled and destabilising. Scheduledimbalance (I-S) arise as a result of a multilateralagreement in regards to the rules of stability of theinternational monetary system. Such was the BrettonWoods Agreement. It assumed that the surplus in trade orpayment balance in the IMS was equal to the acceptanceof hegemon’s trade or current account deficit (Rodrik1986). The dynamics of global finances can cause theimbalance of the second type that is signified byuncontrolled surpluses and deficits. This may constitute afundamental imbalance (I-F)1, which prevents effectivestate economic policies as well as - as noted in the 70s byRobert Koehane and Joseph Nye – contributes to the riseof tension in economic relations between states (Koehane& Nye 1973). The I-F generates a pressure to limit,change direction or accelerate capital flow in order toreconstruct a balance.Indeed, the standard instruments of monetary andexchange rate policy used by the hegemon, within theframework of the international monetary system (IMS), intimes of peace, function as a ‘dyad of stability’ (DS). It isestablished in order to create the I-S to keep sustainingeconomic cooperation based on certain rules agreed by themain actors of the world financial space.These are its hegemon and states, which have relativelystrong currencies and/or significantly take part ininternational trade and/or possess substantial politicalstrength.
1 It is worth to note, that Bretton Woods Agreement indicated the possiblity of the existance of a fundamental imbalance, however itsdefinition was not provided; MD-W; comp: Eichengreen, B. (1996). Globalizing Capital, Princeton University: 96-100.
Revistă teoretico-științifică / Theoretical and scientifical journal12
Nr. 3 / 2013
In general, the ‘dyad of stability’ supports the politicalsystem promoted by the hegemon. As soon as the hegemonmodifies her attitudes about the political canon of relationswithin the international financial arena, it attempts tochange DS into a ‘dyad of destability’ (DD). The latter oneassumes an automatic conversion of the function of thehegemon’s currency from a ‘safe-haven’ currency into oneof a ‘threat’. Conflict is withheld in the moment ofconversion of I-F into I-S.
Such understood currency war, that should not beequated with transitory currency manipulations (Bergsten &Gagnon 2012), can be presented in the sequential gamemodel. It is known in game theory as the Stackelberg’sduopoly model (Sargent & Wallace 1981)1. According to itsrules, the hegemon that instigates a currency war is winningthis war, as long as, she is able to pressure states tomacroeconomic adjustments in regards to mechanisms ofmonetary and exchange rate policy, imposed by her.
The assumed definition of a currency war enablesidentifying the main actors of a regional financial space andits currency regime. Thus it can be applied to the EU, whereGermany acts as the hegemon (Blyth & Matthijs 2011,Bulmer & Paterson 2011, Laski & Podkaminer 2011). It isa hegemon of a special kind. It is obliged by EU treaties toobserve the rule of common European good with regard tothe economic relations within the EMU. In particular, it isassumed that every member of the monetary union is tocomply with the provision of art. 121.1 of the Lisbon treatywhich says that economic policy, including the policy ofexchange rates, becomes the common concern in the EU2.However, it is found that in practice of European monetaryintegration Germany used to act in concert with the logic ofgeoeconomy. In pursuit of its economic power, she stronglybut indirectly affects EMU members via its own specificmacroeconomic policy3 and/or European institutions usedby her as geoeconomic instruments. It, thus, created anumber of bilateral ‘dyads of destability’ within EMU inorder to secure its strategic political aims. Since 2007, thecrisis in the Eurozone resulted in the eruption of such DD ina form of currency wars, during which Germany stronglyexecuted its status of a hegemon (Ahamed 2011, Grauwe de2009). From then on, the trust in the euro as a commonEuropean currency weakened significantly amongstEuropeans. Overall, during the period September 2007-September 2013 it dropped by 12 percent from 63 percentto 51 percent (Eurobarometer 2013).
2. Hidden European currency wars: Germanyv. nEZ
Can currency wars fulminate against the nEZ as it hadhappened in the Eurozone? Can they undermine theperception of the euro? My answer to these questions is:‘yes’. Moreover Germany has to be named as the center ofincitig these difficulties. First of all, the course ofmonetary policy actions of more than a decadedemonstrates that Germany’s adherence to the geo-economics paradigm is capable of catalysing a politicalcondition in which a currency war is perceived as aregulating or stabilising mechanism between the EZ andthe nEZ. The debt crisis in the Eurozone made thisperception more salient. However, since a currency war isa long-lasting phenomenon, the starting point of which ishard to determine, for the sake for the analysis this one isidentified as beginning in the year 1999. At that time theeuro was introduced and Germany started to act as thehegemon of the EMU by breaching its legal basis4. It thusdecided to implement a long-term internal deflationstrategy that resulted in rapid German exports increasealongside lower labour costs. Such strategy coincided witha specifically stable monetary and exchange rate policywhich influenced the policy of the states—especiallyneighbouring ones (Becker & Jäger 2011), as explained inpart 1. Indeed, as the hegemon crystallised, the other mainactors became the three larger states of nEZ that joinedEU in 2004 (as members of EMU with derogation). Whatmeant that they had to fulfil certain rules in order to be letin by EZ countries, especially by Germany, and becomemembers of the EZ. These countries are the CzechRepublic, Hungary and Poland (CHP). In reality, all ofthem are ready to adopt the euro. Each of CHP has carriedpolicies determining their real convergence with the EZ.However, due to Germany’s specifically stablemacroeconomic policies, all of them have experiencedtensions between the national currency and the euro withinthe process of convergence.It is hence indispensable to answer three questions. First,in what way do the mechanisms of monetary andexchange rate policy utilised by the hegemon of theEuropean geoeconomic space determine these tensions?Second, how are these tensions an element of the intra-European Theatre of Currency War Operations (TCWO)?And third, whether and how they imply changes toconsidering the status of the euro as a currency of publictrust and international importance of the EU?
1 see also Collignon, S. (2003). “Is Europe Going Far Enough? Reflections on the Stability and Growth Pact, the Lisbon Strategy and theEU’s Economic Governance,” European Political Economy, Vol. 1, No 2:230.2 Art. 121.1 [ex art 99.3 EC] states that „Member States shall regard their economic policies as a matter of common concern and shallcoordinate them within the Council, in accordance with the provisions of Article 120”, TUE, cons.version (2012). 6655/7/08 REV 7,Brussels, 12 November.3 Within EMU, real exchange rate adjustment can only be brought about through changes in domestic prices and wages; Mundell, R.(1961). „A Theory of Optimum Currency Areas, American Economic Review, September: 60.4 Compare the notion of the minimal hegemony. It is the situation when the hegemon is no longer strong enough to devise systematicallypolicies capable of serving common interests; Cafruny, A., Ryner, M. (2006). „The EMU and the Transatlantic and Social Dimensions ofthe Crisis of the European Union,” Central and East European International Studies Association 4th Annual Convention, Tartu: 3.

ECONOMIE ŞI SOCIOLOGIE / ECONOMY AND SOCIOLOGY 13
Nr. 3 / 2013
As answers are many-sided and cannot be limited to theportraiture of monetary policies used, in the next two subunitsI trace the issue also within a wider political context.
2.1 Złoty vs. EuroSuggestions to include the Polish currency into the
European monetary regime first came about in the early 90sand coincided with the debate about the possibility of peggingthe Złoty (PLN) to the Ecu. These deliberations were put to anend by the 1993 decision of the European Council inCopenhagen about the obligatory character of the EMU andthe common European currency for the future member statesof Central and East Europe (Temprano–Arroyo & Feldman1998). However, scheduling the process of its introductionremained an open issue. The 1995 Madrid summit decision-that is three years before formal accession negotiationscommenced-pointed that the “creation of an economically andmonetarily stable environment”1 is the only suitable way ofcarrying out a “gradual and harmonious integration of EUcandidate countries”, apparently it turned out to be anannouncement of a long and complicated process.Nevertheless, a year later Poland attempted to pursue a one-sided euroisation option (Bratkowski & Rostowski 1999).These attempts were stopped by the EU, and during accessionnegotiations of 1998-2002 Poland received EMU membershipstatus with derogation2.
Beginning in 2003, that is before formal accession to theEU in 2004, first official warnings came from the EZdiscouraging new member states-and so Poland as well-from adopting the euro fast3. They were motivatedeconomically and related to the German assumption knownas the coronation strategy that the convergence within theEMU should be the last stage of monetary integration(Maes 2002). The analyses claimed that prematuremembership in EZ could subject Poland – as country withGDP much below EU average – to massive shocks thatcould hamper its developmental and budgetary capabilities.
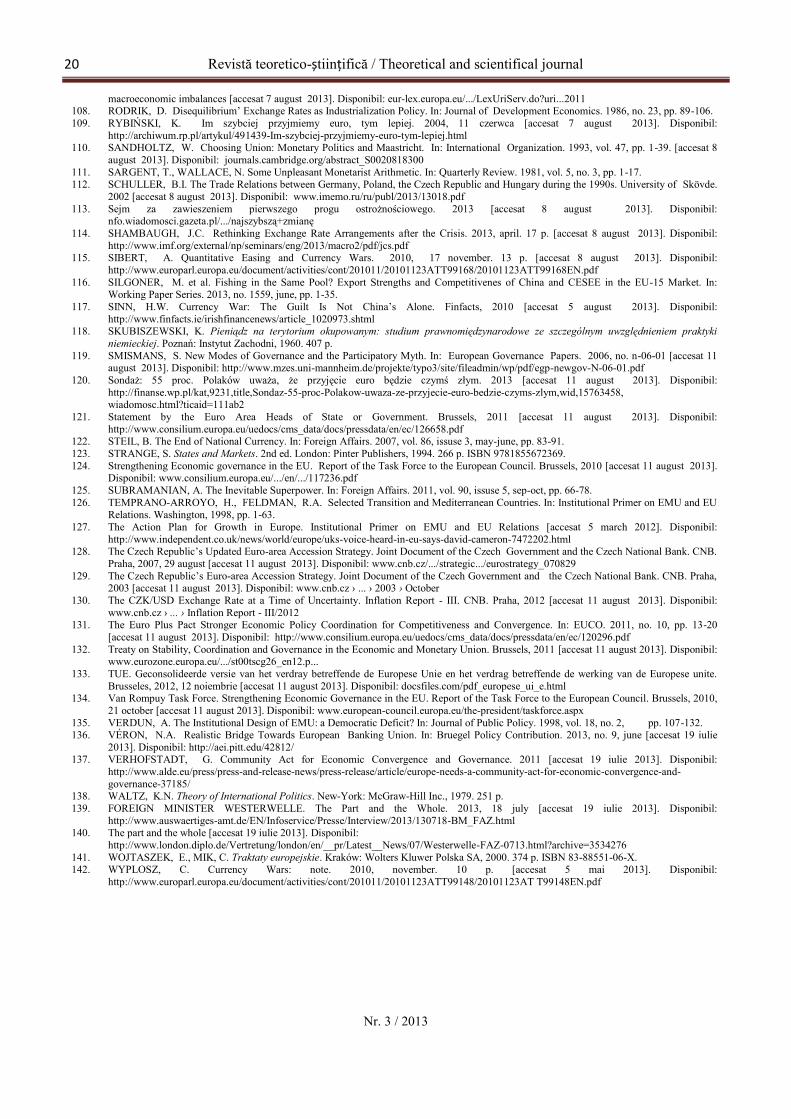
True, it was difficult to judge the power of suchwarnings during the preaccesion period. At least Poland’sexperience of intense economic cooperation with Germanyof 1993-1998 was not explicitly negative. Polish exports toGermany increased in spite of accumulating a seriousdeficit in trade balance4 (Tab. 1). At the same time, therewas no unequivocal opinion nor analyses with regard to thefunctioning of the EMU understood as an optimumcurrency area (Eichengreen, Hagen, von, 1993).
Nobody could have supposed that Germanywould be found amongst these countries which started toinfringe systematically the provisions of the Maastrichttreaty, as well as, the Stability and Growth Pact (SGP).Hence, the views predicting potential shocks wereconsidered with certain ambivalence. On one hand, theneed to adopt the euro as fast as possible, and motivatedby a certain raison d’etat, was articulated. It was stated,following the European integration principle’ reasoning,that maintaining the division within the EMU of statesusing different currencies has to be treated acounter-productive strategy because of undermining thecommon interest of EU and each state separately(Rybiński 2004).
On the other hand, some scholars and politiciansshared the same anxiety as EU experts. Eventually, Polandfrom accession in May 2004 started to pursue the so-called “I’d like to, but I’m afraid of…” tactics in relationto the EZ membership. Even though the authoritiesattempted to fulfil the provisions of Treaty of Maastricht,they did not make serious efforts to obtain membership5.One of the examples of the above-mentioned policyattitudes was the statement from 15 October 2007, issuedby Sławomir Skrzypek, the former president of theNational Bank of Poland. It declared that Poland, apt tofulfil the criteria of convergence, would be ready to enterERM II6 at the beginning of 2009. In 2011, the PrimeMinister, Donald Tusk, has declared that Poland is readyto enter euro zone in 2013. Currently, this kind ofcommitment relates to the year 2020 constituting quite afailure of Polish hopes to become a full member of the EUat the onset of the XXI century.
Examination of the PLN-EUR relations in referenceto the theoretical approach towards the phenomenon ofcurrency wars may supplement this political insight withnew elements. Yet, on the verge of the plannedintroduction to the euro, Poland held a slight surplus tradebalance (Tab. 1) with Germany mostly thanks to lowlabour costs (Chart 3). At the same time the economyperformed well (Chart 6).
However, starting from 2006, the inflationary effectsof catching up process as well as the attempts to increasewages have resulted in a growing trade deficit withGermany which followed the strategy of internaldevaluation.
1 European Council (1995). Conclusions, Madrid, 15-16 December.2 Art. 122 [109k] TWE; Wojtaszek, E., Mik, C., opr. (2000). Traktaty europejskie, Kantor Wyd. Zakamycze. 149-150.3 The EC commissioner Pedro Solbes warned against premature attempts at EMU participation by saying that „countries (would) losetheir exchange rate flexibility, while the process of structural change, cathing up and fiscal consolidation is not yet finished”, He alsostated that 2-years period of participation of new mamber-states in the ERM may be set on more restrictive conditions than bilateral bandof 15 percent; Reuters, 23 May; in: Dunin-Wąsowicz, M. (2003). „L’union économique et monétaire dans les pays en voie d’accession –intérêts économiques et politiques”, Reflets et Perspectives de la ve économique, Vol. XLII, No 3, DeBoeck Université, Brussels: 81.4 Schuller, B.-I. (2002). „The Trade Relations between Germany, Poland, the Czech Republic and Hungary during the 1990s,” Universityof Skövde, April: 18-19.5 “Integracja Polski ze Strefą Euro: Uwarunkowania Członkostwa i Strategia Zarządzania Procesem” [Poland’s Integration with the EuroArea: Conditions of Membership and the Strategy of the Management Proccess] (2005). Ministerstwo Finansów, August: 1-48.6 “Poland set to join ERM II in 2009, says Skrzypek”; Central Banking ((2007). 16 October: http://www.centralbanking.com/central-banking/news/1407130/poland-set-join-erm-ii-2009-skrzypek [Access: 20 October 2007].
Revistă teoretico-științifică / Theoretical and scientifical journal14
Nr. 3 / 2013
The results of such policy have been fortified both byundermining the SGP and cheap imports from China whichpartially crowded out imports from Poland (Silgoner et al)1.These three factors particularly then were to sharpen thebilateral economic relations and along with the crisis of 2007.This is why Poland has abandoned the relatively low andsteady interest rate policy, which in April 2006, provided thecountry with a title of one of the three countries with moststable prices in the EU. In consequence Polish currencyweakened significantly, first in 2009 and later, also in 2011(Chart 5)2 when Germany, oppressed by recession, introducedthe policy of limiting the outflow of capital. In general, startingfrom the beginning of the crisis until 2012, PLN-EURexchange rate showed high changeability. This is why Poland,unlike states in the South, could enter the path of developing asurplus in its trade balance with Germany, however its overallbalances were negative (Tab. 2).
In sum, German policy within the EMU based on thepremises of geoeconomy, which inherently disregard theprinciple of common European good (relating to strive forrelative advantage against other states), influenced badlyPoland’s path towards membership in the EZ. Thus, Poland,which soon after accession was heading for convergence,decided to drop the policy of strict compliance with theMaastricht criteria, not only in relation to monetary policy.This decision bore fruit and for a while guaranteed moderationof the influence the EZ crisis and the slump in Germany hadon Polish economy. Nevertheless, the recession hasendangered Poland at length. Following the policy of EBC, theauthorities of the National Bank of Poland, were forced toimplement policy of low interest rates3. This, in turn, has beentriggering a jettison effect amongst people toward the euro. In2002, 63 % of the Polish population was convinced that, oneday, the euro should replace the Polish złoty. The currentpublic opinion poll done by TNS Polska states that the only11% of respondents are to understand the adoption of the euroas the good solution for Poland and its economy4. What ismore, the present government sought it necessary to abandonthe constitutional provision of abiding budget threshold ofpublic debt at the level of 50% of GDP5. Besides, legalprojects aimed to limit the independence of the National
Bank of Poland are under the governmental consideration.2.2 Koruna and Forint vs. EuroIn principle, in late 1990s the authorities and the elites
of the Czech Republic and Hungary were much moresceptical about the idea of accepting the euro than thePolish6 ones. The dominating opinion in both countrieswas that the EZ project was an exclusionary undertaking.Indeed, the EZ demanded from new members a moresophisticated approach towards convergence criteria incomparison to long-term EU members. Therefore theCzech Republic and Hungary decided to introduce theeuro no sooner than in 2010. Current statements of suchintent refer to the year 2020 or after.
How then were the policies of the koruna (CZK) andthe forint (HUF) limited by the hegemon of the EMU?The experience of the Czech Republic from the pre-negotiation period (1993-1998) was ambiguous (Tab. 1).Its trade with Germany grew, although the trade ofGermany with the Czech Republic grew much faster: byfour times7. Moreover, the mode of relations CZK v. DEMDEM mirrored the general developments in the Czecheconomy where the current account registered a highdeficit, and financial flows on the capital account werehuge (Smidkova 1998). In effect, koruna strengthenedstrongly by keeping on average a real appreciation at thattime. Nevertheless, Czech Republic decided to apply the‘catching up’ strategy thanks to developing its export withGermany (Tab. 2). Thus, next round of strongappreciations occurred, especially in the 2002, by morethan 10% alongside marginally low trade balance withGermany. In the years 2002-2005, Czechs, againfollowing Germany, have significantly lowered the unitlabour cost (Chart 4). This is why, in the middle of 2005,the National Bank of the Czech Republic introducedhistorically low interest rates of 1.75%. After 2006, theCzech Republic officially resigned from accepting theeuro in 2010. Once they abandoned the low interest ratesstrategy, the real exchange rates of koruna - euro started togrow, mainly via increase of trade with Germany. In 2009however, the Czech Republic witnessed a severerecession, similar to what was happening in Germany.
1 Silgoner, M., Steiner, K., Wörz, J., Schitter, Ch. (2013). „Fishing in the Same Pool? Export Strengths and Competitivenes of China andCESEE in the EU-15 Market,” Working Paper Series no 1559, EBC, June: 28-29.2 At the second part of 2011 ocurred a strong depreciation of the Polish złoty and then within the period of September-December 20011the NBP interviened on the money market; Information Bulletin (2011). NBP, IB 4/2011; Shambaugh, J.C. (2013). „Rethinking ExchangeRate Arrangements after the Crisis,” George Washington University and NBER, Washington, DC, April 16–17: 9.3 In March 2013 a reference rate is established at 2,5 percent and is is balanced by the deposit rate kept at 1 percent; NBP (2013).http://www.nbp.pl (Access: 29 March 2013).4 In 2002, 63% of the Polish people were convinced that, one day, the Euro should replace the Polish złoty. The current public opinionpoll done by TNS Polska has said the the only 11% of respondents are to understand the adoption of the Euro as the good solution forPoland and its economy; PAP (2013). “Sondaż: 55 proc. Polaków uważa, że przyjęcie euro będzie czymś złym,” Gazeta Wyborcza(daily), 25.06: 7; Dunin-Wąsowicz, M. (2003), “L’union économique…”, op. cit.: 73–88.; Compare also European Central Bank (2013).“Annual Review of the International Role of the Euro,” Frankfurt, July 2013: 29.5 By the end of July 2013 both chambers of the Polish Parliament Sejm accepted the governmental claim of loosing the fiscal discpline;PAP (2013). “Sejm za zawieszeniem pierwszego progu ostrożnościowego,” Gazeta Wyborcza (daily), 26.07: 15.6 Dunin-Wąsowicz, M. (2007). “Sovereignty and Money in the Process of European Integration – From the Dual Perspective”; in:Piasecki, R. (ed.) (2007). Transition of Central European Economies and Enterprises, SWSPiZ, Łódź:117–136.7 Schuller, B.-J., (2002). “The Trade Relations…,” op. cit.: 14.
ECONOMIE ŞI SOCIOLOGIE / ECONOMY AND SOCIOLOGY 15
Nr. 3 / 2013
Thus, after the first increase of interest rates,starting from 2010, they have been lowered again (Chart 5)and trade balance both with Germany and intra-EU grew.At the same time however, deficit on currentaccounts widened. It was the floating exchange rate ofkoruna, which became the main shock absorber for theCzech Republic’s economy1 and then the efforts to continuethe ‘catching up’ process failed. Hence, the functioning ofthe EMU-especially viewed in the context of Germanattitudes toward principles of monetary and macroeconomicpolicies in the monetary union- have ensured Czechs thatthe euro is a project about narrow political and economicgoals rather than about true European integration (Adam etal. 2012:11).
Similar conclusions can be drawn from the analysis ofthe forint-euro relation. A few years before the accession,Hungarian trade with Germany was expanding strongly -relative to total trade and GDP - and Hungary noted aslightly positive balance of trade (Tab 2). However, at thattime there were real appreciations of the Hungarian forintand the German mark depreciated in real terms toward theforint2. After EU accession, the situation did not changemuch, although Hungary traded with Germany well. TheHungarian attempts to implement inner deflation byintroducing an inflation targeting regime turned out to be afailure and the forint appreciated further along the stronginner deflation of Germany.
The political efforts to stabilise the Hungarian currencypolitically by proclaiming in 2008 year 2012 as time ofattaining the level of readiness to enter the EZ were also afailure. Thus, in 2009 Hungary, followed Germany and runinto a severe economic breakdown. Eventually, Hungarywas plagued by low growth and high debt for much of thelast decade. Moreover, Hungarian government has decidedto implement a legal act, which put limits on theindependence of the Hungarian National Bank. At the sametime, some reforms dismantling the monitoring of publicfinances were introduced (Kopits 2011). Both changes havedemonstrated strong anti-euro sentiment mirroring the fearsthat EMU has become a project which is going to blow outthe EU and its status as an important political actor of theinternational arena (Kirchick 2013).
2.3 Specificity of the TCWOThe cases described point out the tensions occurring in
the monetary and exchange rate policy in CHP in thecontext of German monetary policy. Indeed, from the CHPpoint of view, German exchange rate policy in years 1993-1998 was favourable towards trading, although it wasdirected at its inner devaluation, which supported Berlin’sambitions of fulfiling of the Maastricht criteria to join themonetary union.
Ergo, it was perceived as positive in terms ofextending the EU. The accession negotiations (1998-2003)have not particularly changed the situation. Nevertheless,an expensive euro, used by Germany from 1999, as wellas her specific internal macroeconomic policies imposeddifficult process of appreciation of CHP nationalcurrencies. The period since the membership in the EU tillthe outbreak of the crisis exacerbated these problems andnarrowed policy options or responses to external shocksthat have previously buffeted Polish, Czech andHungarian economies. Consequently, in years 2009-2012all of these states were forced to modify their strategicgoals and halt running policies which could bring themcloser to the membership in the EZ.
In sum, currency wars executed according togeoeconomic interests, are not just about currency andeconomics, they are also very much about politics. Onecould say that in the case German v. CHP the period 1999-2012 of their trade relations was characterised by theexistance of diverse DD which led to different types ofimbalances either between these states or between the EZand the nEZ. Clearly, to quote Robert Mundell, economicstrength of the country with its own currency relies on thiscountry only (Mundell 1961). Nevertheless, the externalconditions in form of monetary-cum-exchange-rate-policies executed by the hegemon of a currency unionmay negatively modify its economic status. Notsurprisingly, this has been the case of these three statesthat were in German’s line of economic fire. Eventually, itrevealed that the EMU can be perceived as a classicalmonetary alliance in which the actions of the states aredetermined by their economic strength rather then as anunique undertaking based on the endorsment of theprinciple of a European common good within theframework of the economic and monetary policies. Theinternational role of the currency of such EMU maydecline (ECB 2013).
3. The European integration theories: off the point?Could the described course of events have become
foreseeable by CHP in a preaccesion time? Possibly ‘yes’.However, this could only have been though under theassumption that an enlarged Europe-and thus EMU-wouldexacerbate both political and economic conflicts amongstits members.
Indeed, at the end of the XX century the Europeandebate was dominated by the vast body of analysesindicating that the three deficits-the democratic deficit ofEMU, the deficit of an economic government and apolitical union or the deficit of common identity-wouldlead to major problems in the EU (Verdun 1998, Płowiec1993, Sandholtz 1993).
1 Czech Republic-2013 Article IV Consultation Concluding Statement (2013). IMF, Washington, May 20:http://www.imf.org/external/np/ms/2013/052013.htm [Access: 5.06.2013].2 Schuller, B.-J., (2002). „The Trade Relations…,” op. cit.: 13.

Revistă teoretico-științifică / Theoretical and scientifical journal16
Nr. 3 / 2013
At the same time, research on Europeanmonetary integration focused on certain conditions uponwhich convergence could appear (Dyson 2002, Radaelli2000, Moravcsik 1998). However negative monetaryoccurrences - denying the ideational influence of Europeanintegration – were not to necessarily taken intoconsideration by CHP. Their then generally positiveattitudes toward the developments within the EMUwere justified. From some expert reports cameinsights that a monetary union could become an exemplarof politics that follows the principle of a Europeancommon good (Collignon 2000, Milward 1992). Theargument was that the provisions of the European treatiesincorporated this principle in relation to the monetary andexchange rate policies. Hence, the Czech Republic,Hungary and Poland-strategically oriented towards joiningthe political space of Western Europe-had not voicedfundamental political controversies which would undermineGerman attitudes toward the principle upon whichaccession negotiations to the EU and thus to the EMU werebased on.
Nevertheless, as shown by Luttwak and Gilpin, suddendisruption and economic malaise, or unique conditions suchas financial hyperglobalization may jeopardise attitudestoward cooperation and unleash conflict that originates indifferentiated distributional interests. In consequence, statesstrive to consolidate their economic power by aiming toexpand their geoeconomic space in the international systemby employing different types of warfare. In the case of theEMU, the course of integration has evolved into a process ofdisintegration caused by Germany’s quest for the leadershipwithin the European financial structures. There were twofactors, which intensified the propensity of Germany to actwith severity against other states. The first one is bound tothe functioning of the EZ1. However, it was thecrisis-the second factor-which affected further difficultGerman relations with other states within the framework ofthe EMU.
To consider the first issue, one must say, that inheyday of the euro the expertise with regard to therelations of the EZ v. nEZ was not developed enough. Itwas beyond discussion that nEZ had to stick firmlyto the Maastricht criteria and thus there were almostno analyses, which questioned its economic orpolitical rationale (Gros et al. 2002). The rejection of theLithuanian membership into the EZ in 2006 based on theargument that the Lithuanian inflation exceeded the levelaccepted by the Commission as referential (2.66%) by0.06%2 was the evidence that thinking about the ideaof integration was somewhat duobius (Baltaduonis &Jurgilas 2006).
In particular, the troublesome monetary politics ofGermany toward CHP were perceived as an exceptionrather than the rule of divergence, which could not beapplied toward the states of the EZ (Gros et al 2002:71).
In fact, there were a few experts who were seriouslyconsidering the argument that at least two criteria of thereal convergence such as the criterion of the price stabilityas well as the exchange rate criterion should bereinterpreted (Pisani-Ferry et al. 2008). Consequently,within CHP has appeared an afterthought that monetaryrelations between states-even within the framework of onepolitical bloc such as the EU-have to be subordinated to itscompetitive character.
The crisis-the second factor-has affected Germany’srelations with CHP even further by applying an approachtoward differentiation commonly known as the need fordeeper integration within the EZ. Some of the provisionsof the so-called Six-Pack are a specific evidence of theargument. Indeed, they are designed to improve economicgovernance in the EU. At the same time however, theysanction a differentiation between the EZ and n EZ byapplying legal disctinctions with regard the economicpolicy objectives and goals to comply with (Six-PackRegulations 2011). Signed on 2 March 2012 (by EU 25)the treaty on stability, coordination and managementwithin the Economic and Monetary Union (so–called“fiscal compact”, TSCM) becomes a subsequent exampleof such attitude. Indeed, ‘fiscal compact’ modifiesgovernance within the EMU. It is however mainlyaddressed to the EZ states (Pisani-Ferry, Sapir & Wolff2012). More, it does not revamp the fundamental faults ofthe EMU such as the lack of fiscal union or Europeanbonds (Dunin-Wąsowicz ed. 2012). Consequently, thefiscal compact became a serious signal of the divisionbetween two parts of EU: with the euro and without theeuro. Although the subsequent proposals for a radicalchange in the financial set-up of the euro area - such as abanking union - are going in accordance of the provisionsof the Lisbon Treaty (Véron 2013, Davies 2012), they arein a breach with the idea of the European integrationpromoting the EU as the single political actor of theinternational arena. Guido Westerwelle’s statementregarding the political deepening of the EZ hassymbolically sealed this division (Westerwelle 2013),which is commonly disguised as the need to stick to theprinciple of different speeds.
Again, the process of applying by Germany thegeoeconomic approach has been manifested within theframework of monetary and exchange rate policy towardsaccession countries in the first place. These signals havenot been fully considered by politicians of the EZ3
members (Popescu 2013, Hankel et al 2010).
1 At present, only three Eurozone states - Estonia, Luxembourg and Finland - meet the criteria of debt and deficit; ECB (2013).2 Baltaduonis R., Jurgilas M. (2006). “What Are the Economic Arguments Against Lithuania’s Euro Bid?,” Euroobserver/ Comment, 05.05. – 10:06 CET;http://www.sp.uconn.edu/~rib01002/ EUobserver.html.3 The Eurozone is not in essence an optimum currency area. The crisis did not cause Eurozone problems, but has merely highlighted them. Thus, the problem of the EZ is NOTits geograpghical size. The problem is the LACK of a proper fiscal coordination which intensifies the financial assymetric shocks; Hankel et al 2010.
ECONOMIE ŞI SOCIOLOGIE / ECONOMY AND SOCIOLOGY 17
Nr. 3 / 2013
Thus, the belief in desirability to establish the euro asthe single currency in all states of the EU is associated witha sense of political seclusion amongst some nEZ membersespecially from CHP.
Conclusions: unpleasant politics and the unkindparadigm
This paper explored the nature of current process ofEurozone’s Effilochement via currency wars. The first partdeveloped an analytical tier that proposed the notion of acurrency war. The suggested concept put forward byDunin-Wąsowicz is built on the work of Gilpin, Luttwakand Haliżak, whose analyses in international relationssought to prove that interconnectedness and globalizationare not supposed to limit conflicts, including ones in thefinancial space. Thus, states, instead of applying the logicof integration are likely to use the rationale of geoeconomy.It enables them to influence certain changes within themonetary space of international or regional monetarysystems. This influence, expressed by currency wars, hasbeen harnessing monetary policy instruments as if theywere military ones.
The second part used that analytical proposal todemonstrate that a geo-economic approach is employed byGermany within the European monetary regime. The findingsconfirm that it has practised the geoeconomic approach indeploying currency wars against some states of the EMU.
Yet, this articles demonstrates how the CzechRepublic, Hungary and Poland face an awkward treatmentby Germany and this set in motion policies, whichpreclude them to come closer to real convergence with theEZ economy.
The paper revealed also a few issues with regards tothe relations of the EZ v. the nEZ that till now have beenoverlooked. First, although currency wars within the EZhave been scrutinized, such monetary relations betweenthe hegemon of the EZ and some nEZ states have not yetbeen adequately analysed. Second, these currency warsforced the Czech Republic, Hungary and Poland to backaway from the political and economic strategies to adoptthe euro in a predictable future. Third, the EU is unable togenerate honest mechanism of EMU enlargement. Thus,the new thinking about the future of the euro as thecommon currency of the EU is needed. Suffice to note, atthe moment of writing of this article, the situation betweenthe EZ and the nEZ seems quite unclear: the crisisdid not lead to the adoption by the EU of institutionaland governance structure which would represent theinterests of all states of the EMU. Just the opposite:the geoeconomic approach was launched and the exerciseof inter-state solidarity became a political pretence withinthe EU, and the Eurozone’s effilochement is stillprogressing.
References:1. AHAMED, L. Currency Wars, Then and Now. How Policymakers Can Avoid the Perils of the 1930s. In: Foreign Affairs. 2011, march-april,
vol. 90, issuse 2, pp. 92-103.2. Agreed Lines of Communication by Euro Area Member States. Brussels, 2012, 30 january [accesat 1 februarie 2012]. Disponibil:
http://www.consilium.europa.eu/uedocs/cms_data/docs/pressdata/en/ec/127633.pdf3. AHEARNE, A., PISANI-FERRY, J. The Euro: Only For Agile. In: Breugel Policy Brief. 2006, no. 1, pp. 1-8.4. Analyses of The Czech Republic’s Current Economic Alignment With The Euro Area. Praha: CNB, 2012. 121 p.5. Analysis of the Convergence Process From the Point of View of the Financial Crisis. Budapest: MNB, 2010. 108 p.6. ANDREWS, D.M., ed. International Monetary Power. Ithaca: Cornell University Press, 2006. 224 p. ISBN 978-0801444562.7. ANNETT, A. Enforcement and the Stability and Growth Pact: How Fiscal Policy Did and Did Not Change Under Europe’s Fiscal Framework.
In: Working Paper. 2006, no. 06 (116), 1 may, pp. 1-34.8. ARGHYROUA, M.G., KONTONIKAS, A. The EMU Sovereign-Debt Crisis: Fundamentals, Expectations and Contagion [accesat 1 februarie
2012]. Disponibil: http://ideas.repec.org/p/euf/ecopap/0436.html
9. BECKER, J., JÄGER, J. From an Economic Crisis to a Crisis of European Integration, paper presented at IIPPE. In: Neoliberalism and theCrisis of Economic Science: conference, 20-22 may. Istanbul, 2011, pp. 1-27.
10. BEGG, I. Economic Governance in an Enlarged Euro Area. In: Economic Papers. 2008, no. 311, pp. 1-30.11. BERGSTEN, C.F., GAGNON, J.E. Currency Manipulation, the US Economy, and the Global Economic Order. In: PIIE, Policy Brief. 2012,
no. 12, 25 december, pp. 1-3.12. BIBOW, J. The Euro Debt Crisis and Germany’s Euro Trilemma. In: Working Paper. 2012, no. 721, pp. 1-42.13. BLANCHARD, O., FITOUSSI, J-P. Mark and Budgetary Politics in Europe. Oxford, 1993. 101 p. ISBN 978-0-19-877362-7.14. BLYTH, M., MATTHIJS, M. Why Only Germany Can Fix the Euro. 2011 [accesat 12 december 2012]. Disponibil:
http://triplecrisis.com/why-only-germany-can-fix-the-euro15. BRATKOWSKI, A., ROSTOWSKI, J. Zlikwidować złotego [To eliminate the Złoty]. 1999 [accesat 30 august 2013]. Disponibil:
www.bankofalbania.org/.../rostowski_ang_22616. PISANI-FERRY et al. Coming of Age: report on the euro area. Brussels, 2008. 122 p. ISBN 9789078910060.17. BULMER, S., PATERSON, W. A. Life More Ordinary? Ten Theses On a Normalization of Germany’s Role in the EU. In:
Paper for the European Union Studies Association Biennial: conference, 3-5 march. Boston, 2011, pp. 1-22.18. BÜTZER, S., JORDAN, Ch., STRACCA, L. Macroeconomic Imbalances. A Question of Trust? In: Working Paper. 2013, no. 1584, august,
pp. 1-46.19. CAFRUNY, A., RYNER, M. The EMU and the Transatlantic and Social Dimensions of the Crisis of the European Union. In: Central and East
European International Studies Association: 4th. Annual Convention, 25-27 june 2006. Tartu, 2006 [accesat 30 august 2013]. Disponibil:www.ceeisaconf.ut.ee/orb.../Cafruny_Ryner.do...
20. CECCO, M. Money and Empire: The international gold standard, 1890-1914. Lanham, 1974. 254 p.21. COLLIGNON, S. Is Europe Going Far Enough? Reflections on the Stability and Growth Pact, the Lisbon Strategy and the EU’s Economic
Governance. In: European Political Economy. 2003, vol. 1, no. 2, pp. 222-247.22. COLLIGNON, S. How to Avoid Currency Wars [accesat 30 august 2013]. Disponibil:
http://www.europarl.europa.eu/document/activities/cont/201011/20101123ATT98408/20101123ATT98408EN.pdf23. EUROPEAN COMMISSION. Commission Concludes that Latvia is Ready to Adopt Euro in 2014. Brussels, 2013, 5 june. 3 p.24. Convergence Report. European central bank. 2013, june. 79 p. [accesat 30 august 2013]. Disponibil:
https://www.ecb.europa.eu/pub/pdf/conrep/cr201306en.pdf
Revistă teoretico-științifică / Theoretical and scientifical journal18
Nr. 3 / 2013
25. Convergence Report. European central bank. 2004. 246 p. [accesat 30 august 2013]. Disponibil:www.ecb.europa.eu/pub/pdf/conrep/cr2004en.pdf
26. Council Regulation (EU): no. 1177 of 8 november 2011, amending Regulation (EC): no. 1467/97 on speeding up and clarifying theimplementation of the excessive deficit procedure [accesat 30 august 2013]. Disponibil: eur-lex.europa.eu/.../LexUriServ.do?uri
27. CSAJBÓK, A., CSERMEL, Á. Adopting The Euro in Hungary: Expected Costs, Benefits and Timing. Budapest: National Bank of Hungary,2002. 207 p.
28. Czech Republic - 2013 Article IV Consultation Concluding Statement. IMF. Washington, 2013, 20 may [accesat 5 june 2013]. Disponibil:http://www.imf.org/external/np/ms/2013/052013.htm
29. DARVAS, Z., SZAPARY, G. Euro Area Enlargement and Euro Adoption Strategies. In: Economic Paper. European Commission, Directorateof Economic and Financial Affairs. 2008, no. 304, february [accesat 30 august 2013]. Disponibil: ec.europa.eu/.../publication12093_en.pdf
30. DAVIES, H. Europe’s Flawed Banking Union. Project syndicate. 2012, 18 october [accesat 30 august 2013]. Disponibil: www.project-syndicate.org/.../europe-s-democr
31. Deauville Declaration. Franco–German Declaration, Statement for the France-Germany-Russia Summit. 2010, 18 october. [accesat 30 august2013]. Disponibil: www.euo.dk/.../Franco-german_declaration.pdf
32. DEHESA. G. Global Imbalances. Currency Wars and the Euro. 2010, 17 november. 10 p. [accesat 30 august 2013]. Disponibil:http://www.europarl.europa.eu/document/activities/cont/201011/20101123ATT99188/20101123ATT99188EN.pdf
33. DOWLING, S. Is a German ‘Fourth Reich’ Emerging? 2011, 15 november [accesat 30 august 2013]. Disponibil:http://www.globalpost.com/dispatch/news/regions/europe/111114/germany-fourth-reich-euro-zone-dominance
34. DUNIN-WĄSOWICZ, M., ed. Integracja europejska i nowy ład gospodarczy. Report The European Integration and The New EconomicOrder. Warszawa: SCHOLAR, 2012 [accesat 30 august 2013]. Disponibil: www.bibliofil.com.pl/integracja-europejska-i-n
35. DUNIN-WĄSOWICZ, M. Instrumentarium geoekonomiczne w polityce monetarnej i kursowej państwa: wojna walutowa vs. In: E.HALIŻAK. Geoeconomic. Warszawa, 2012. ISBN 978-83-7383-573-3 [accesat 30 august 2013]. Disponibil:http://scholar.com.pl/sklep.php?md=products&id_p=2231
36. Exchange–Rate and Monetary Policy. In: M.E. HALIŻAK, ed. Geoeconomy. Warszawa: University of Warsaw, 2009, june, pp. 327-357.37. Suwerenność i pieniądz w Europie, 1870-2002. Warszawa: WUW. 2008.38. Why 2012 is Well on for the Euro. In: Europe’s Journal. 2008, vol. 4, no. 1 [accesat 30 august 2013]. Disponibil:
http://www.europesworld.org/SearchByCurrentIssue.aspx?IssueId=LastIssue39. Sovereignty and Money in the Process of European Integration – From the Dual Perspective. In: R. PIASECKI, ed. Transition of Central
European Economies and Enterprises. Łódź: SWSPiZ, 2007, pp. 117-136.40. Dolar i Euro: epizody z suwerenności i hegemonii. Dollar and Euro: Episodes of Sovereignty and Hegemony Polska w Europie, kwartalnik,
Wydawca: Fundacja. In: Polska w Europie .,2005, vol. 43, no. 1, pp. 27-55.41. L’union économique et monétaire dans les pays en voie d’accession - intérêts économiques et politiques. In: Reflets et Perspectives de la ve
économique. DeBoeck Université. 2003, vol. XLII, no. 3, pp. 73-88.42. DYSON, K., ed. European States and the Euro. Oxford, 2002 [accesat 1 august 2013]. Disponibil:
ukcatalogue.oup.com/.../9780199250257.do43. BORG, A. Economic and Financial Affairs. Brussels, 2009. 31 p. [accesat 1 august 2013]. Disponibil:
http://register.consilium.europa.eu/pdf/en/09/st16/st16838.en09.pdf44. EICHENGREEN, B. From Currency Warfare to Lasting Peace. 2010, 30 september [accesat 1 august 2013]. Disponibil:
http://www.voxeu.eu/article/currency-warfare-lasting-peace45. EICHENGREEN, B. Globalizing Capita. Princeton University Press. 1996 [accesat 1 august 2013]. Disponibil:
journals.cambridge.org/abstract_S021261090046. EINZING, P. The Fight for Financial Supremacy. London: Macmillan, 1931. 180 p.47. EFSF Framework Agreement and European Financial Stability Facility. 2010, 7 june [accesat 4 august 2013]. Disponibil:
www.efsf.europa.eu/.../20111019_efsf_framew48. Europe’s Reluctant Hegemon. In: The Economist. 2013, 15 june, pp. 99-105.49. EUROPEAN CENTRAL BANK. The International Role of the Euro. Frankfurt, 2011, july. 18 p. ISBN 978-92-899-1017-0; ISSN 1725-6583.50. EUROPEAN CENTRAL BANK. The International Role of the Euro. Frankfurt, 2013, july. 81 p. ISBN 978-92-899-1017-0; ISSN 1725-
6583.51. EUROMEMO GROUP. Confronting the Crisis: Austerity or Solidarity. 2010. 4 p. [accesat 4 august 2013]. Disponibil:
http://heterodoxnews.com/htnf/htn109/Summary_EuroMemorandum_2010_11.pdf52. European Council. Brussels, 2010, 28-29 october. 20 p. [accesat 4 august 2013]. Disponibil:
http://www.consilium.europa.eu/uedocs/cms_data/docs/pressdata/en/ec/139197.pdf53. Term Sheet on ESM. In: European Council. Brussels, 2011, 24-25 march, pp. 21-34 [accesat 4 august 2013]. Disponibil:
http://www.consilium.europa.eu/uedocs/cms_data/docs/pressdata/en/ec/120296.pdf54. Madrid european council 15-16 december. Presidency conclusions. Madrid, 1995 [accesat 4 august 2013]. Disponibil:
http://www.europarl.europa.eu/summits/mad1_en.htm55. EVENETT, S.J., ed. The US-Sino Currency Dispute: new insights frome economics, politics and law. Centre for Economic Policy Research.
London, 2010 [accesat 4 august 2013]. Disponibil: www.worldcat.org/oclc/693808157?56. FEUERSTEIN, S., GRIMM, O. The Enlargement of the European Monetary Union. In: Bank i Kredyt. 2007, luty, pp. 1-18.57. GAŁGANEK, A. Zmiana w globalnym systemie międzynarodowym. Supercykle i wojna hegemoniczna. Poznań, 1992. ISBN 83-232-0577-9.58. Germany's Schäuble Calls for New EU Treaty. 2011 [accesat 3 march 2013]. Disponibil: http://www.euractiv.com/euro-finance/germanys-
sch-uble-calls-new-eu-treaty-news-50725659. GILPIN, R. War and Change in International Politics. Cambridge: Cambridge University Press. 1981 [accesat 4 august 2013]. Disponibil:
www.people.fas.harvard.edu/.../Gilpin1981.pdf60. GRAUWE, P. The Fragility of the Eurozone’s Institutions. In: Open Economies Review. 2009, no. 21 (1), pp. 167-174.61. GROS, D. et al. The Euro at 25. Special report on enlarge. Brussels, 2002.62. GRUBEL, H. The Evolution of the Theory of Monetary Integration. Burnaby: Simon Fraser University, 2006.63. HALIŻAK, E.M., ed. Geoekonomia. Warsawa, 2012. 186 p.64. HANKEL, W., HAUSKRECHT, A., STUART, B. The Euro-Project at Risk. In: Working Paper. Center for European Integration Studies,
Rheinische Friedrich-Wilhelms-Universität. 2010, no. B 04, pp. 1-30 [accesat 5 august 2013]. Disponibil:www.econstor.eu/bitstream/.../638549396.pdf
65. HIRSHMAN, A.O. National power and the structure of foreign trade. University of California Press. 1980 [1945] [accesat 5 august 2013].Disponibil: davidthsu.files.wordpress.com/.../hirschman-stat
66. HORVÁTH, R. Exchange Rate Variability, Pressures and Optimum Currency Area Criteria: Lessons for the Central and Eastern EuropeanCountries. In: Working Paper. Series 8. CNB. 2005, no. 8, december, pp. 1-26 [accesat 5 august 2013]. Disponibil:

ECONOMIE ŞI SOCIOLOGIE / ECONOMY AND SOCIOLOGY 19
Nr. 3 / 2013
www.cnb.cz/en/.../cnb.../cnbwp_2005_08.pdf67. HRYCKIEWICZ, A., PAWŁOWSKA, M. Czy nowy nadzór spełni swoje zadanie? Zmiany w nadzorze finansowym w Europie oraz ich
konsekwencje dla Polski. In: Materiały i Studia: zeszyt. 2013, no. 289, pp. 1-36.68. Hungary 2011 Article IV Consultation And Second Post- Program Monitoring Discussions: report no. 12/13. Washington, 2011 [accesat 5
august 2013]. Disponibil: www.imf.org/external/pubs/ft/.../2012/cr1213.p69. Information Bulletin. Warsaw, 2011, no. 4. 109 p. ISSN 1230-0020 [accesat 5 august 2013]. Disponibil:
http://www.nbp.pl/en/publikacje/biuletyn/2011_4en.pdf70. Integracja Polski ze Strefą Euro: Uwarunkowania Członkostwa i Strategia Zarządzanie Procesem [Poland’s Integration with the Euro Area:
Conditions of Membership and the Strategy of the Management Process]. Ministerstwo Finansów. 2005 [accesat 5 august 2013]. Disponibil:www.mf.gov.pl/.../1_Integracja_Polski_ze_stref
71. IRWIN, G.A. Esprit de Currency. In: Finance & Development. IMF. 2011, june, pp. 30-33 [accesat 5 august 2013]. Disponibil:papers.ssrn.com/sol3/papers.cfm?abstract_id
72. JONES, E., VERDUN, A. The Political Economy of European Integration. Theory and Analysis. London: Routledge, 2005. 223 p. ISBN978-0415340649.
73. KEOHANE, R., NYE, J.S. World Politics and the International Economic System. In: C.F. BERGSTEN, ed.. The Future of the InternationalEconomic Order. Lanham: Lexington Books, 1973 [accesat 5 august 2013]. Disponibil:http://books.google.md/books/about/The_Future_of_the_International_Economic.html?id=u3UEAQAAIAAJ&redir_esc=y
74. KEYNES, J.M. The World’s Economic Outlook. The Atlantic monthly. 1932, may [accesat 5 august 2013]. Disponibil:www.theatlantic.com/past/docs/.../keynesf.htm
75. KIRCHICK, J. The Orban Effect: EU Conservatives Have a Hungary Problem. Spiegel Online International. 2013, 29 may [accesat 3 june2013]. Disponibil: http://www.spiegel.de/international/europe/hungarian-government-puts-european-conservatives-in-tough-spot-a-902620.html
76. KINDLEBERGER, C. Manias, Panics, and Crashes. 5th ed. New York, 2005. 309 p. ISBN 0-471-46714-6.77. KIRSHNER, J. Currency and Coercion – The Political Economy of International Monetary Power. Princeton: University Press, 1995. 289 p.78. KOPITS, G. Can Fiscal Discipline Be Reconciled with Fiscal Sovereignty? In: BANCA D'ITALIA. Rules and Institutions for sound Fiscal
Policy after the Crisis: seminari e convegni Workshops and Conferences Perugia. 31 march-2 april 2011. Rome, 2012, pp. 387-400.79. KRZYŻANOWSKI, A. Zaufanie: trust. In: Czasopismo Skarbowe. Warszawa, 1926, rok I, no. 3, pp. 1-2.80. LASKI, K., PODKAMINER, L. The Basic Paradigms of EU Economic Policy-Making Need to be Changed. In: Journal of Economics. 2012,
no. 36, pp. 253-270.81. LIEU, D.K. The Sino–Japanese Currency War. In: Pacific Affairs. University British Columbia. 1939, vol. 12, no. 4, december, pp. 413-426.82. LUTTWAK, E.N. From Geopolitics to Geo–economic. Logic of Conflict, Grammar of Commerce. In: The National Interest. 1990, no. 20, pp.
17-23.83. MAES, I. On The Origins oF The Franco-German EMU Controvercies. In: Working Paper. National Bank of Belgium. 2002, no. 34, pp. 1-
46.84. MANTEGA, G. Apresentação do ministro da Fazenda, durante palestra na Federação das Indústrias do Rio de Janeiro (Firjan). 2010 [accesat
17 septembro 2013]. Disponibil: http://www.fazenda.gov.br85. MARZINOTTO, B., SAPIR, A., WOLFF, G.B. What kind of fiscal union. In: Bruegel Policy Brief. 2011, no. 6, pp. 2-8.86. METZ, S., CUCCIA, P. Defining War for the 21st Century. Strategic Studies Institute. Carlise: US Army War College, 2011. 71 p. ISBN 1-
58487-472-4.87. MIDLARSKI, M.I. Handbook of War Studies. Vol. II. Ann Arbor: University of Michigan press, 2000. 564 p. ISBN 9780472067244.88. MIDLARSKY, M.I. Handbook of War Studies. Vol. I. Boston: Unwin Hyman, 1989. 372 p. ISBN 9780044970552.89. MILWARD, A.S., BRENNAN, G., FEDERICO, G. The European Rescue of the Nation-State. Berkeley: University of California Press.
1992. 447 p. ISBN 9780520081376.90. MODELSKY, G. Long-Term Trends in World Politics. In: Journal of World-System Research. 2005, vol. 11, no. 2, december, pp. 195-206.91. MORAVCSIK, A. The Choice for Europe: Social Purpose and State Power from Messina to Maastricht. Ithaca: Cornell University Press,
1998. 514 p. ISBN 9780801435096.92. MUNDELL, R.A. A Theory of Optimum Currency Areas. In: American Economic Review. 1961, vol. 51, issue 4, september, pp. 657-665.93. MUNDELL, R. Uncommon Arguments for Common Currencies. In: H.G. JOHNSON, A.K. SWOBODA, ed.. The Economics of Common
Currencies. Sydney: Allen and Unwin. 1973, pp. 114-132.94. NBP. Narodowy Bank Polski. 2013 [accesat 29 March 2013]. Disponibil: http://www.nbp.pl95. ODELL, J.S. U.S. International Monetary Policy: Markets, Power, and Ideas as Sources of Change. Princeton: Princeton University Press.
Princeton, 1982. 385 p. ISBN 9780691022123.96. PISANI-FERRY, J., SAPIR, A., WOLFF, G. The Messy Rebuilding of Europe. Bruegel: Policy Brief. Brussels, 2012. 719 p.97. PŁOWIEC, U. Traktat z Maastricht. 1993 [accesat 6 august 2013]. Disponibil: books.google.com/books?isbn=838936359398. RZECZPOSPOLITA POLSKA. Program Konwergencji. Warszawa, 2004. 38 p. [accesat 6 august 2013]. Disponibil:
polskawue.gov.pl/.../Programy_konwergencji/p99. POPESCU, O. Opuszczona przez Zachód Europa Środkowa zaczyna mówić jednym głosem [The Abandoned Europe Starts to Speak Up With
One Voice]. Stratfor, 2013 [accesat 7 august 2013]. Disponibil: forsal.pl/.../716755,opuszczona-przez-zachod-e100. Public Opinion in the European Union: Standard Eurobarometer 79. 2013, spring. 33 p. [accesat 7 august 2013]. Disponibil:
http://ec.europa.eu/public_opinion/archives/eb/eb79/eb79_first_en.pdf101. RADAELLI, C.M. Whiter Europeanization? Concept Stretching and Substantive Change. In: European Integration online Papers, 2000
[accesat 7 august 2013]. Disponibil: http://eop.or.at/eiop/texte/2000-008a.htm102. Regulation (EU): no. 1092/2010 of the European Parliament and of the Council of 24 august 2010 on European Union macro-prudential
oversight of the financial system and establishing a European Systemic Risk Board [accesat 7 august 2013]. Disponibil:www.esma.europa.eu/.../Reg_1092_2010_ESR
103. Regulation (EU): no. 1093/2010 of the European Parliament and of the Council of 24 authority, amending Decision no. 716/2009/EC andrepealing Commission Decision 2009/78/EC [accesat 7 august 2013]. Disponibil: www.esrb.europa.eu/shared/pdf//shared/pdf/EBA-en.pdf?
104. Regulation (EU): no. 1173/2011 of the European Parliament and of the Council of 16 august 2011 on the effective enforcement of budgetarysurveillance in the euro area [accesat 7 august 2013]. Disponibil: eur-lex.europa.eu/.../LexUriServ.do?uri...2011
105. Regulation (EU): no. 1174/2011 of the European Parliament and of the Council of 16 august 2011 on enforcement measures to correctexcessive macroeconomic imbalances in the euro area [accesat 7 august 2013]. Disponibil: eur-lex.europa.eu/.../LexUriServ.do?uri...2011
106. Regulation (EU): no. 1175/2011 of the European Parliament and of the Council of 16 august 2011 amending Council Regulation (EC): no.1466/97 on the strengthening of the surveillance of budgetary positions and the surveillance and coordination of economic policies [accesat 7august 2013]. Disponibil: eur-lex.europa.eu/.../LexUriServ.do?uri...2011
107. Regulation (EU): no. 1176/2011 of the European Parliament and of the Council of 16 august 2011 on the prevention and correction of
Revistă teoretico-științifică / Theoretical and scientifical journal20
Nr. 3 / 2013
macroeconomic imbalances [accesat 7 august 2013]. Disponibil: eur-lex.europa.eu/.../LexUriServ.do?uri...2011108. RODRIK, D. Disequilibrium’ Exchange Rates as Industrialization Policy. In: Journal of Development Economics. 1986, no. 23, pp. 89-106.109. RYBIŃSKI, K. Im szybciej przyjmiemy euro, tym lepiej. 2004, 11 czerwca [accesat 7 august 2013]. Disponibil:
http://archiwum.rp.pl/artykul/491439-Im-szybciej-przyjmiemy-euro-tym-lepiej.html110. SANDHOLTZ, W. Choosing Union: Monetary Politics and Maastricht. In: International Organization. 1993, vol. 47, pp. 1-39. [accesat 8
august 2013]. Disponibil: journals.cambridge.org/abstract_S0020818300111. SARGENT, T., WALLACE, N. Some Unpleasant Monetarist Arithmetic. In: Quarterly Review. 1981, vol. 5, no. 3, pp. 1-17.112. SCHULLER, B.I. The Trade Relations between Germany, Poland, the Czech Republic and Hungary during the 1990s. University of Skövde.
2002 [accesat 8 august 2013]. Disponibil: www.imemo.ru/ru/publ/2013/13018.pdf113. Sejm za zawieszeniem pierwszego progu ostrożnościowego. 2013 [accesat 8 august 2013]. Disponibil:
nfo.wiadomosci.gazeta.pl/.../najszybszą+zmianę114. SHAMBAUGH, J.C. Rethinking Exchange Rate Arrangements after the Crisis. 2013, april. 17 p. [accesat 8 august 2013]. Disponibil:
http://www.imf.org/external/np/seminars/eng/2013/macro2/pdf/jcs.pdf115. SIBERT, A. Quantitative Easing and Currency Wars. 2010, 17 november. 13 p. [accesat 8 august 2013]. Disponibil:
http://www.europarl.europa.eu/document/activities/cont/201011/20101123ATT99168/20101123ATT99168EN.pdf116. SILGONER, M. et al. Fishing in the Same Pool? Export Strengths and Competitivenes of China and CESEE in the EU-15 Market. In:
Working Paper Series. 2013, no. 1559, june, pp. 1-35.117. SINN, H.W. Currency War: The Guilt Is Not China’s Alone. Finfacts, 2010 [accesat 5 august 2013]. Disponibil:
http://www.finfacts.ie/irishfinancenews/article_1020973.shtml118. SKUBISZEWSKI, K. Pieniądz na terytorium okupowanym: studium prawnomiędzynarodowe ze szczególnym uwzględnieniem praktyki
niemieckiej. Poznań: Instytut Zachodni, 1960. 407 p.119. SMISMANS, S. New Modes of Governance and the Participatory Myth. In: European Governance Papers. 2006, no. n-06-01 [accesat 11
august 2013]. Disponibil: http://www.mzes.uni-mannheim.de/projekte/typo3/site/fileadmin/wp/pdf/egp-newgov-N-06-01.pdf120. Sondaż: 55 proc. Polaków uważa, że przyjęcie euro będzie czymś złym. 2013 [accesat 11 august 2013]. Disponibil:
http://finanse.wp.pl/kat,9231,title,Sondaz-55-proc-Polakow-uwaza-ze-przyjecie-euro-bedzie-czyms-zlym,wid,15763458,wiadomosc.html?ticaid=111ab2
121. Statement by the Euro Area Heads of State or Government. Brussels, 2011 [accesat 11 august 2013]. Disponibil:http://www.consilium.europa.eu/uedocs/cms_data/docs/pressdata/en/ec/126658.pdf
122. STEIL, B. The End of National Currency. In: Foreign Affairs. 2007, vol. 86, issuse 3, may-june, pp. 83-91.123. STRANGE, S. States and Markets. 2nd ed. London: Pinter Publishers, 1994. 266 p. ISBN 9781855672369.124. Strengthening Economic governance in the EU. Report of the Task Force to the European Council. Brussels, 2010 [accesat 11 august 2013].
Disponibil: www.consilium.europa.eu/.../en/.../117236.pdf125. SUBRAMANIAN, A. The Inevitable Superpower. In: Foreign Affairs. 2011, vol. 90, issuse 5, sep-oct, pp. 66-78.126. TEMPRANO-ARROYO, H., FELDMAN, R.A. Selected Transition and Mediterranean Countries. In: Institutional Primer on EMU and EU
Relations. Washington, 1998, pp. 1-63.127. The Action Plan for Growth in Europe. Institutional Primer on EMU and EU Relations [accesat 5 march 2012]. Disponibil:
http://www.independent.co.uk/news/world/europe/uks-voice-heard-in-eu-says-david-cameron-7472202.html128. The Czech Republic’s Updated Euro-area Accession Strategy. Joint Document of the Czech Government and the Czech National Bank. CNB.
Praha, 2007, 29 august [accesat 11 august 2013]. Disponibil: www.cnb.cz/.../strategic.../eurostrategy_070829129. The Czech Republic’s Euro-area Accession Strategy. Joint Document of the Czech Government and the Czech National Bank. CNB. Praha,
2003 [accesat 11 august 2013]. Disponibil: www.cnb.cz › ... › 2003 › October130. The CZK/USD Exchange Rate at a Time of Uncertainty. Inflation Report - III. CNB. Praha, 2012 [accesat 11 august 2013]. Disponibil:
www.cnb.cz › ... › Inflation Report - III/2012131. The Euro Plus Pact Stronger Economic Policy Coordination for Competitiveness and Convergence. In: EUCO. 2011, no. 10, pp. 13-20
[accesat 11 august 2013]. Disponibil: http://www.consilium.europa.eu/uedocs/cms_data/docs/pressdata/en/ec/120296.pdf132. Treaty on Stability, Coordination and Governance in the Economic and Monetary Union. Brussels, 2011 [accesat 11 august 2013]. Disponibil:
www.eurozone.europa.eu/.../st00tscg26_en12.p...133. TUE. Geconsolideerde versie van het verdray betreffende de Europese Unie en het verdrag betreffende de werking van de Europese unite.
Brusseles, 2012, 12 noiembrie [accesat 11 august 2013]. Disponibil: docsfiles.com/pdf_europese_ui_e.html134. Van Rompuy Task Force. Strengthening Economic Governance in the EU. Report of the Task Force to the European Council. Brussels, 2010,
21 october [accesat 11 august 2013]. Disponibil: www.european-council.europa.eu/the-president/taskforce.aspx135. VERDUN, A. The Institutional Design of EMU: a Democratic Deficit? In: Journal of Public Policy. 1998, vol. 18, no. 2, pp. 107-132.136. VÉRON, N.A. Realistic Bridge Towards European Banking Union. In: Bruegel Policy Contribution. 2013, no. 9, june [accesat 19 iulie
2013]. Disponibil: http://aei.pitt.edu/42812/137. VERHOFSTADT, G. Community Act for Economic Convergence and Governance. 2011 [accesat 19 iulie 2013]. Disponibil:
http://www.alde.eu/press/press-and-release-news/press-release/article/europe-needs-a-community-act-for-economic-convergence-and-governance-37185/
138. WALTZ, K.N. Theory of International Politics. New-York: McGraw-Hill Inc., 1979. 251 p.139. FOREIGN MINISTER WESTERWELLE. The Part and the Whole. 2013, 18 july [accesat 19 iulie 2013]. Disponibil:
http://www.auswaertiges-amt.de/EN/Infoservice/Presse/Interview/2013/130718-BM_FAZ.html140. The part and the whole [accesat 19 iulie 2013]. Disponibil:
http://www.london.diplo.de/Vertretung/london/en/__pr/Latest__News/07/Westerwelle-FAZ-0713.html?archive=3534276141. WOJTASZEK, E., MIK, C. Traktaty europejskie. Kraków: Wolters Kluwer Polska SA, 2000. 374 p. ISBN 83-88551-06-X.142. WYPLOSZ, C. Currency Wars: note. 2010, november. 10 p. [accesat 5 mai 2013]. Disponibil:
http://www.europarl.europa.eu/document/activities/cont/201011/20101123ATT99148/20101123AT T99148EN.pdf

ECONOMIE ŞI SOCIOLOGIE / ECONOMY AND SOCIOLOGY 21
Nr. 3 / 2013
Statistical AnnexTables: 1-2Charts: 1-6
Statistical Annex - TablesTable 1
Balance of Trade* and Current Account of The Czech Rp., Hungary & Poland, 1995-1998 (mln USD)Years The Czech Republic Hungary Poland
BoT CA BoT CA BoT CA
DE Total % GDP Total DE Total % GDP Total DE Total % GDP Total
1995 56,4 - 3 672,3 - 7,0 - 1 367,2 85,7 - 2 501 - 5,4 - 1 266 1 041,5 - 6 154,8 - 4,4 - 6 154,8
1996 - 372,9 - 5 900,8 - 10,1 - 4 310,0 - 13,74 - 3 057 - 6,5 - 1 408 - 765,4 - 7 287 - 5,0 - 3 264
1997 - 529,6 - 4 589,6 - 8,8 - 3 210,3 1 397,8 - 1 990 - 4,2 - 1 812 - 1 724 - 16 556,2 - 2,9 -16 556,2
1998 211,5 - 2 578,2 - 4,5 - 1 044,3 1 167,1 - 2 690 - 5,2 - 3 026 - 2 175 - 18 824,7 - 1,4 -18 824,7
Sources: CNB, MNB, NBP, various volumes.*: excluding servicesDE: Germany
Table 2Balance of Trade* and Current Accounts of The Czech Rp., Hungary & Poland,1999-2011 (mln €)
Y’s
The Czech Republic Hungary Poland
BoT CA BoT CA BoT CA
DE Intra’27
Total %GDP
Total DE Intra’27
Total %GDP
Total DE Intra’27
Total %GDP
Total
1999 1 337 - - 1 933 - 3,6 - 992,7 1 425 - -2 044 - 2,6 - 3 531 - 6 267,1 - -14 146 - 9,1 - 11 719
2000 1 488 - - 3 600 - 6,2 - 2 567,5 2 258 - -3 180 - 8,4 - 4 352 - 600,6 - -13 327 - 7,7 - 11 181
2001 653 1 959 - 3 491 - 5.5 - 2 961,9 2 745 3 719 -2 496 - 5,9 - 3 577 394 - 6 413 - 8 557 - 4,6 - 6 641
2002 857 3 703 - 2 416,4 - 2,9 - 3 939,6 3 265 4 891 -2 203 - 4,8 - 4 929 - 150 - 5 461 - 7 701 - 4,0 - 5 924
2003 1 152 4 930 - 2 179,1 - 2,7 - 4 937,1 2 581 4 807 -2 898 - 5,5 - 6 382 627 - 3 078 - 5 077 - 2,4 - 4 878
2004 101 3 171 - 699,7 - 0,5 - 4 490,3 898 3 768 -2 446 - 4,3 - 7 136 - 2 084 - 5 854 -10 736 - 4,2 -10 736
2005 - 147 3 636 1 354,9 2,0 - 2 070,6 470 3 537 -1 460 - 3,2 - 6 091 3 935 - 5 019 - 5 856 - 1,9 - 5 856
2006 - 17 5 051 2 401,2 2,0 - 3 561,4 669 3 707 - 417 - 2,6 - 5 197 - 5 394 - 4 158 -10 425 - 3,0 -10 425
2007 12 7 164 4 227,8 3,4 - 3 221,7 1 050 6 518 1 370 - 0,1 - 6 602 - 8 636 - 7 953 -19 245 - 4,5 -19 245
2008 1 264 10 508 4 147,7 2,8 - 4 610,5 750 7 151 - 565 - 0,2 - 7 774 -11 530 11 828 -23 799 - 5,8 -23 799
2009 3 237 9 854 6 832 5,0 - 9 455,4 1 357 8 583 3 371 0,4 332 - 4 532 166 -12 152 - 2,8 -12 152
2010 4 217 12 712 7 916,9 5,4 - 4 142,2 2 078 10 581 3 215 5,6 1 065 - 6 286 250 -18 129 - 3,8 -18 129
2011 13 383 15 700 5 009,9 5,8 - 3 305,7 4 692 10 100 3 393 7,0 808 9 886,5 1 200 -17 977 - 3,4 -17 977
Sources: CNB, Eurostat, MNB, NBP - various volumes.*: excluding servicesDE: Germany
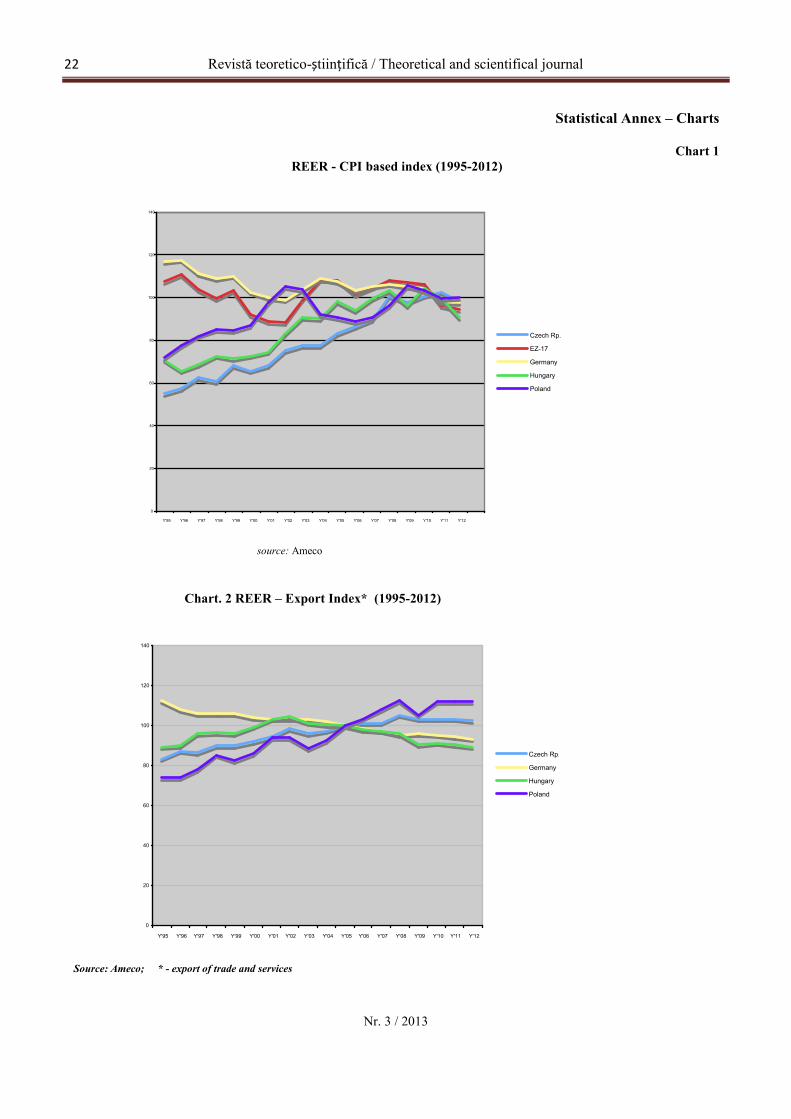
Revistă teoretico-științifică / Theoretical and scientifical journal22
Nr. 3 / 2013
Statistical Annex – Charts
Chart 1REER - CPI based index (1995-2012)
source: Ameco
Chart. 2 REER – Export Index* (1995-2012)
Source: Ameco; * - export of trade and services
0
20
40
60
80
100
120
140
Y'95 Y'96 Y'97 Y'98 Y'99 Y'00 Y'01 Y'02 Y'03 Y'04 Y'05 Y'06 Y'07 Y'08 Y'09 Y'10 Y'11 Y'12
Czech Rp.
EZ-17
Germany
Hungary
Poland
0
20
40
60
80
100
120
140
Y'95 Y'96 Y'97 Y'98 Y'99 Y'00 Y'01 Y'02 Y'03 Y'04 Y'05 Y'06 Y'07 Y'08 Y'09 Y'10 Y'11 Y'12
Czech Rp.
Germany
Hungary
Poland
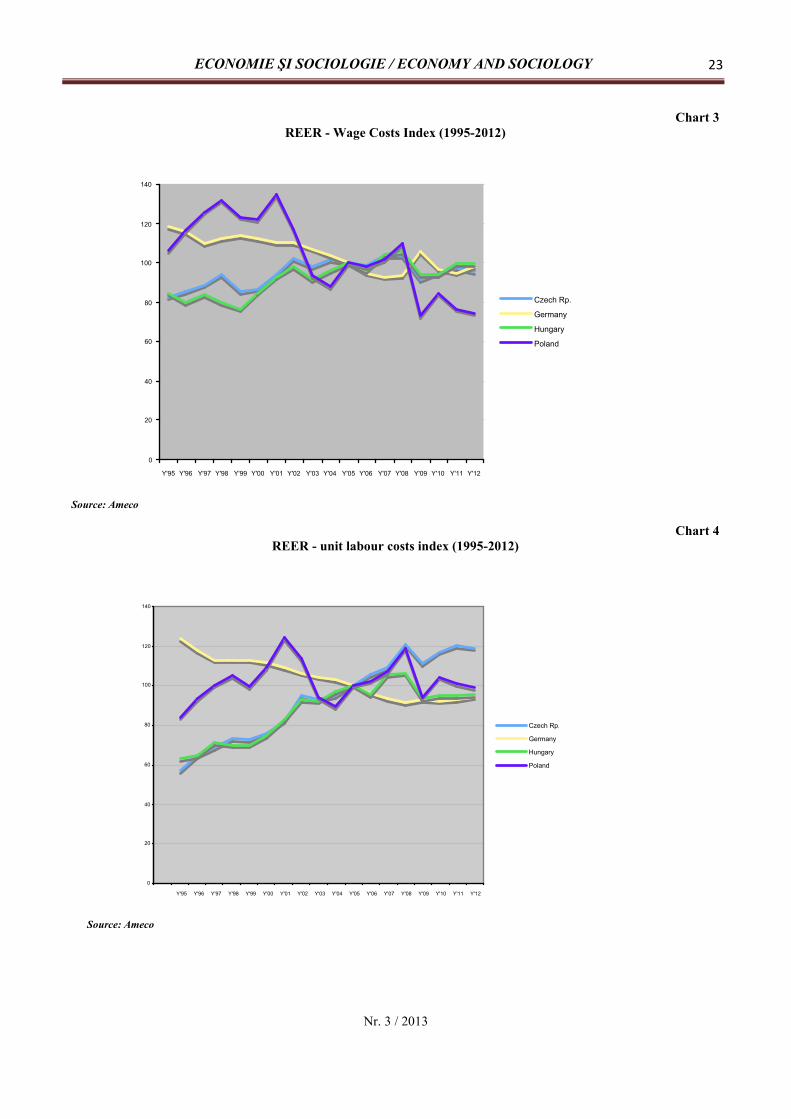
ECONOMIE ŞI SOCIOLOGIE / ECONOMY AND SOCIOLOGY 23
Nr. 3 / 2013
Chart 3REER - Wage Costs Index (1995-2012)
Source: Ameco
Chart 4REER - unit labour costs index (1995-2012)
Source: Ameco
0
20
40
60
80
100
120
140
Y'95 Y'96 Y'97 Y'98 Y'99 Y'00 Y'01 Y'02 Y'03 Y'04 Y'05 Y'06 Y'07 Y'08 Y'09 Y'10 Y'11 Y'12
Czech Rp.
Germany
Hungary
Poland
0
20
40
60
80
100
120
140
Y'95 Y'96 Y'97 Y'98 Y'99 Y'00 Y'01 Y'02 Y'03 Y'04 Y'05 Y'06 Y'07 Y'08 Y'09 Y'10 Y'11 Y'12
Czech Rp.
Germany
Hungary
Poland

Revistă teoretico-științifică / Theoretical and scientifical journal24
Nr. 3 / 2013
Chart 5Policy Interest Rates: Czech Rp., Hungary, Germany* & EA** (1995-2012)
Sources: CNB, NBH, ECB, BB, NBP* - data till the end of 1998** - data from the January 1999rates of EZ - as set up by ECB in period ’99-2012
Chart 6GDP in the Czech Rp. Hungary, Poland, Germany and EZ-12, 1995-2012 (2013f)
Source: Eurostat, IMF.Recomandat spre publicare: 12.08.2013
0
5
10
15
20
25
30
35
40
11 10 9 8 7 6 5 4 3 201
'05 12 11 10 9 8 7 6 5
Czech Rp.
EZ
Germany
Hungary
Poland
-8
-6
-4
-2
0
2
4
6
8
1995 1996 1997 1998 1999 2000 2001 2002 2003 2004 2005 2006 2007 2008 2009 2010 2011 2012 2013
Czech Rp.
EZ
Germany
Hungary
Poland

ECONOMIE ŞI SOCIOLOGIE / ECONOMY AND SOCIOLOGY 25
Nr. 3 / 2013
CONDIŢIILE MATERIALEDE PERFECŢIONARE A STRUCTURII FORŢEI
DE MUNCĂ ÎN MEDIUL RURAL
MATERIAL CONDITIONSOF IMPROVING THE STRUCTURE OF LABOR
FORCE IN THE RURAL AREA
Vasilii RYABOKONI, dr., membru corespondent alAcademiei Naţionale de Ştiinţe Agrare din Ucraina
Vasilii RYABOKONI, PhD, corresponding member of theNational Academy of Agrarian Sciences of Ukraine
În articolul dat sunt determinate condiţiile materiale defuncţionare a agriculturii şi a particularităţilor deimplementare a activităţii de muncă a persoanelor dinmediul rural în condiţiile de formare a sistemului desecuritate alimentară din Ucraina.
Cuvinte cheie: forţă de muncă, forţă de producţie,instrument de muncă, bunuri materiale, condiţii materiale.
There are determined the material conditions of thefunctioning of agriculture and peculiarities ofimplementation of work activity by people from rural areasin conditions of formation of the food security system ofUkraine.
Key words: labour force, productive force, labour tool,material goods, material conditions.
JEL Classification: E31, J21, J62, R10
The structure of the labor force of agriculture representsa complex and multifaceted phenomenon. Its formation,development and improvement are under the directinfluence of the productive forces and production relations.Classic economists noted that the basis for the developmentof society is the development of the productive forces,especially the improvement of labour tools. Withoutconnection of workforce with tools there is not possible theprocess of labor itself and ultimately the process ofproduction of material goods. But this relationship does notappear as something fixed or static. On the contrary, itshould be considered in its motion and development.Factors of production and the relations of production havealso an influence on the qualitative and quantitative ratio ofthe elements of the productive forces. Thus, under theinfluence of technical progress, qualitative changes takeplace in the means of labor. They are constantly evolvingand improving. And in order to "turn them out from onlypossible in real and current use values" there is a need forchanges in the labor force.
On the one hand, the means of production are themeasures of human labor development, the materializationof accumulated knowledge, experience, and mastery of theman, on the other hand, their effective use requires acorresponding level of training of the workforce. That isthe level of development of the workforce should reflectthe nature and level of development of the means ofproduction. There is a constant dialectical relationshipbetween personal and real factors of production.
With regard to agriculture, this means that the profoundchanges in the technical basis of agricultural productionhave a significant impact on the nature and content of thework, leading to certain structural changes of labor force,demanding much to the worker himself, to his level ofeducation and training.
Thus, it should be taken into account the specific of thebranch of agriculture. In agriculture, as in any otherbranches, the impact of environmental conditions on theformation of the structure of the labor force happens in itsspecific directions, namely:
1. The man in the framework of biological relationshipsis included in the total structure of the biosphere.
Therefore, the evolution of man as a living organism isin accordance with the laws of natural science togetherwith the rest of the biosphere and nanosphere, influencingon them and at the same time, experiencing the opposite oftheir influence. A certain role is played by the productionactivities of the society.
2. The process of production in agriculture is closelyrelated to climatic conditions, which to some extentdetermine the level and nature of the professional skills ofthe labor force and its qualification.
3. Production activity of a man in agriculture isassociated with such specific means of production such asland, productive and working livestock, perennial fruitcrops, etc. This fact has a certain effect on the quantitativeand qualitative aspects of labor force. Land scarcity as amean of production involves the process of increasingthe utilization of the workforce and its release intoother branches through the use of mechanization inagriculture.
The interaction of economic and natural laws does notchange the overall direction of the structural changes of theworking force in the rural area, but at the same time, itimposes on them a certain effect, associated in particularwith the seasonality of production, biologicalcharacteristics of land and living organisms.
Presenting an integral component of the total laborforce in society, the total labor force in agriculture isdeveloped as part of a whole. At the same time, in theposition of private sector, it has a number of internalpatterns of development that determine its specificity andare, respectively, the subject of a special study. From thepoint of view of simple labor process, formation of the totallabor force in agriculture is determined by the peculiaritiesof the development of its productive forces, in particular bythe influence of biological, climatic and otherenvironmental factors on the overall status (level andspecificity) of social labor in agriculture - its specialization,cooperation, combination and concentration.
In the analysis of the division of labor between industryand agriculture, classic economists noted an importanttrend in the structural changes of the labor force, due to thedevelopment of productive forces.

Revistă teoretico-științifică / Theoretical and scientifical journal26
Nr. 3 / 2013
The concern is that the relative number of peopleemployed in agriculture, can not only be determined by thenumber of directly employed individuals in it - a lot ofindividuals are involved in agricultural production whoindirectly are not subordinated to it directly. Justifying theprocess of liberation of labor force from agriculture, classiceconomists stressed that it takes part because in larger scaleof production - with a large farming - labor becomes moreproductive, but also because a large part of the non-agricultural population carries out the work in agriculture,bringing the agriculture a constant capital, such as fertilizers,seeds, all kinds of machineries. Thus, the development ofproductive forces determines the two-way process in themovement of labor in the countryside: the absolute reductionof the directly engaged persons in agricultural productionand increase of the number of producers, indirectly takingpart in it, and the absolute and relative reduction in thenumber of people employed in agriculture in the process ofdivision of labor is accompanied by qualitative changes inthe workforce. This is especially evident at the stage oftechnical modernization of agricultural production, which isthe basis of changes in the nature and content of theagricultural labor, transforming it into a variety of industriallabor and acting as a peculiar form of implementation of therequirements of certain economic laws.
Technical re-equipment of agriculture in itsdevelopment goes through several stages. The first stage ischaracterized by a partial mechanization and introductioninto production of individual machines and mechanisms.During this period, there are only created the conditionsand prerequisites for the conversion of agricultural labor ina variety of industrial one. The introduction of machinerycontributes to fundamental changes in the technical basis ofproduction, to the further division of labor, to thequantitative growth of occupations of narrow profile,progressive changes in the nature and content of the labour.
Already at the initial stage, the introduction ofmachinery, especially tractors, has played a crucial role inthe progressive rise of agricultural production, as well as inthe restructuring of the psychology of the peasant. In thefirst phase, there were decided mainly the issues related toquantitative saturation of agriculture with individualmachines and mechanisms.
At the second stage, there is carried out the transitionfrom mechanization of certain types of work to thecomprehensive mechanization of production processes. Inplace of disparate machines and mechanisms, a system ofmachines comes, which actively promotes the growth oflabor productivity, reduces the employment, especially inthe horse-hand and poorly mechanized operations, the lessuse of manual labor, the change in the relationship betweenphysical and mental labor in the direction of increasing theshare of the latter and restructuring of the labor force.
For the third phase, there is characteristic the transitionfrom the complex mechanization to the wide automation ofall parts of the production, which fundamentally changesthe content, nature of work, the role and the place of man inthe course of labour activity. Automated productionrequires a correspondingly high level of professional andskilled training of staff, its education and culture.
Characteristic features of technical modernization ofagriculture at the present stage are its transition from themechanization of individual types of work to complexmechanization and automation of production processes. Inaddition to the quantitative growth of new machinery andmechanization of individual processes, there is morenoticeable the introduction into the production ofmachinery systems. In the course of industrialization,division of labour is increasing and on this basis, theconcentration and specialization of agricultural productionincrease on the basis of inter-farm cooperation and agro-industrial integration, here also takes place the process ofexpanding and deepening of ties in industry andagriculture. In this regard, agricultural labor gets aqualitatively new content, which in agriculture andlivestock, in the degree of its development is getting closerto the work of the industrial type. The industrialization ofagricultural production serves as an objective necessity andprerequisite for improving the total labor force in the ruralarea. This is determined by several factors. Achieving thegoal of production is impossible without the dynamicdevelopment of all sectors of the economy. A particularlyimportant role is played by agriculture, which is designedto meet the growing needs of the population in food andfeed industry.
This problem can be solved by strengthening the role ofintensive factors and reduce the number of people employedin agriculture, which is impossible without further industrialtransformation of the industry. Only with the development ofindustrialization and the growth on this basis of theproductivity of labor, agriculture can be considered as alabor pool for the industry and the non-production sphere.Efficiency and high-use of the new agricultural technologyrequires not only the quantitative growth of skilled workers,but also the continuous improvement of their knowledge. Onthe one hand, the industrialization of agricultural acts needsto improve the quantitative objective of labor and on theother hand, it creates for this fact relevant prerequisites. Forexample, the transition of agriculture on an industrial basishelps to improve working conditions, a change in its natureand content, as well as raising the incomes of the ruralworkers and, thus, to a better meeting of their material needs.At the same time, there is expanding the scope of the law ofeconomy of time, which makes it possible to increase thedegree of satisfaction and spiritual needs – there appear timefor cultural rest, vocational and general education, sports,etc.
In the 80’s of the twentieth century in the Ukraine, thepace of industrial development have greatly strengthen thematerial and technical base of agriculture, it is based therehave been profound quantitative and qualitative changesthat affected the growth of labour force and necessities ofagriculture.
Given the importance of the industrialization ofagriculture in order to improve the efficiency of socialproduction, and based on the current level of developmentof industry, there has been accepted the direction onaccelerating the pace of modernization of agriculture andconvergence of the agricultural labor in terms of itscapabilities with the industrial labor.

ECONOMIE ŞI SOCIOLOGIE / ECONOMY AND SOCIOLOGY 27
Nr. 3 / 2013
Special significance is given to issues of improving thequality of the supplied equipment, the establishment of asystem of machines for the comprehensive mechanizationof production processes in crop growing, universalization,unification of technology, the rational relation of theenergy capacity and working machines. On the fields ofcollective farms and state farms began to come morepowerful and high speed tractors, grain and beet harvesters,both of domestic and foreign production and otherequipment. Saturation with the new technology has allowedmuch to raise the level of mechanization of production,shorten the work, and for the sectors – to pass tomechanization and partial automation.
At the same time, in the 90’s, the situation with thematerial base of agriculture began to deteriorate rapidly.The transition of the agricultural sector to the marketrelations, the distortions in the implementation of theagrarian reform, the abolition of collective farms and state
farms, a process which was accompanied by a naturalstretching techniques on various bottom of the barrel, haveled to a complete collapse of economies and the collapse oftheir technical support. The agriculture is provided withmain agricultural machinery with 50 - 60%, taking intoaccount the fact that almost 90% of the vehicles are in needof major repairs.
Each year, farms write off 8-10 times more vehiclesthan they buy the new ones. In 2001-2010, the fixed assetsof the national economy increased by 5.5 times, and inagriculture, on the contrary, decreased by 20%. By thelevel of provision of material and technical resources,Ukraine lags far behind the developed countries. Onaverage in Ukraine on 1 ha of agricultural land, there are 5to 7 times less fixed assets compared with agriculturalenterprises with updated material-technical base.
The year dynamics data show a sharp decrease in thenumber of vehicles in farms (Table 1).
Table 1Availability of agricultural machinery in agricultural enterprises (the end of 2011)*
1991 1996 2000 2005 2011 % 2011 to1991
Tractors thousand units 497,3 441,7 318,9 216,9 147,1 29,5
Engine power of tractors, MW. 31423 28078 20611 14792 12656 40,2
Harvesters, thousand pieces. 105,2 85,9 65,2 47,2 32,1 30,5
Corn harvesters, thousand pieces. 15,3 12,0 7,9 4,8 2,3 15,0
Beet harvesters,thousand units 19,8 18,3 13,0 8,5 3,8 19,2
Source:* Agriculture of Ukraine, Statistical Book, 2011, page 203
Not the best situation happens with the ensuring of rural household with techniques, as shown by the sample survey data(Table 2).
Table 2Availability of agricultural machinery in rural households in 2012 (%)*
All ruralhouseholds
Including the households with the land area
0,5 ha and less 0,51-1,00 ha 1.01 ha and more
Households that possess techniqueincluding: 14,8/100 8,7/100 14,4/100 28,8/100
Tractor 16,7 3,5 11,6 28,4Combine 1,7 0,4 0,9 3,1
Drill 9,4 2,3 7,6 15,2
Truck 3,4 1,9 1,5 5,5
Tiller 13,8 3,2 11,4 22,3Source:* The main agricultural characteristics of households in the rural areas in 2012. Statistical newsletter, Statisticscivil service, p.20

Revistă teoretico-științifică / Theoretical and scientifical journal28
Nr. 3 / 2013
During the years of independence, the production ofagricultural machinery drastically reduced. If in 1990 therewere produced 106 thousand tractors and 57 thousandseeders, then in 2011, respectively, 6.4 and 4.9 thousand,which accounted for only 6 percent and 9 percent. All thishas led to a significant increase of the load per unit oftechnical tool, as well as to market saturation withtechnique of foreign manufacturers.
Scientists from NSC "Institute of Agrarian Economics"estimate that technological needs of agriculture in thetechnical means shall be calculated in the amount of about300 billion UAH, that is, for 10 years, every year it isnecessary to buy equipment in the amount of 22 - 28 billionUAH. In fact, it is purchased at ten times less, and on theUkrainian market more than 70% of equipment isimported. All of the major campaigns (agriculturalholdings) work only on imported machinery. In 2011, therewere purchased 586 harvesters, including 78.7% of foreignproduction. Of course, foreign technology with its technicaland economic performance is far superior to domestic one.In particular, it allows during the processing of soil andseeding more than 7 times reducing consumption of oil, 10times the cost of labor, more than twice the directoperational costs.
Today, the world market for agricultural machinery ispractically divided between transnational companies suchas "John Deere", "New Holland", "AGCO", and «SameDeutz Far." The share of these companies, particularly inthe tractor market in the U.S. consists in 95%, WesternEurope - 85%. In Western Europe, more than five thousandof agricultural engineering companies are working. Ofcourse, the domestic producers can not afford to competewith such companies, therefore, it is not surprising that theimported equipment is purchased for the sum of times greaterthan the national one.
Given the fact that nearly 17 million hectares of land arein the use of agro-enterprises with an area of less than 500hectares, as well as in the households which are forced due tothe lack of financial resources to use outdated technology,and that the need of such households is only tractors with 18 -40 hp in the amount of 200 thousand units, there is a seriousproblem on the agenda regarding the reproduction anddevelopment of material and technical base of agriculture.Transition of agricultural production to industrial railsnecessitates the significantly increase of the energy output.Given the specificity of agricultural production and theexperience of the developed capitalist countries, energypower-labor in agriculture should be higher than in industry.The growth of energy power-labor is provided as an increasein the total capacity of the mechanical engines, and thewidespread use of electric energy.Electricity plays a leading role in changing technology andproduction techniques. It brings together machinery andmechanisms in a single system, provides the rhythm of theirwork and the continuity of the production cycle, and createsreal conditions for the comprehensive mechanization andautomation of production. Such processes are related to theelectrification like the conversion of agricultural labor in avariety of industrial one, displacement of manual labor withmachinery, changing the social aspect of the rural area.
However, agriculture still lags far behind on total energyconsumption and the level of energy available for the laborforce. From year to year there is a strong tendency to reducethe energy facilities in farms. In particular, in 2011 comparedwith 1991, the power capacity decreased by 73.3 millionkWh, or three times. There are not used yet the greatpossibilities inherent in replacing other forms of electricalenergy. Electrical energy has the potential to be widely usedfor the treatment of soil, weeding, threshing grain, pre-treatment of seeds, animal exposure, etc. All this leads tosignificant savings of labor and materials in agriculturalproduction.
In a number of cases in the agricultural sector, asevidenced by the expertise available in our country andabroad, it is economically viable to use renewable energy.
In 2010, energy costs in the cost structure of agriculturalproducts accounted for 18%, and in crop production - 23.1%.At the same time, the industry has great potential for theproduction of energy resources, at the same time consumingonly about 1% of biofuels and waste from the total energyconsumption. The use of renewable energy sources can bemade in the following directions:
- expansion of agricultural products for biofuels;- production using wind turbines with mechanical,
thermal and electrical energy;- getting cold and low temperature heat - at the expense of
solar and geothermal energy;- higher utilization of wind and solar energy for some
activities.The widespread use of alternative energy in agriculture is
an objective condition for the further economic growth andfor solving the problems of unemployment. Active work inthis direction is carried out in European countries, includingGermany who is leading, providing 25% of employment inthis sector in the EU. It is planned that by 2020, thedevelopment of alternative energy sources will allow toincrease the number of jobs in Germany by 140 thousand,Poland - 160 thousand, Spain, Italy and France - respectively120, 140 and 60 thousand.
In Ukraine, according to the national project "Energy ofNature" (Ukrainian Presidential Decree from 08.09.2010) isthere is planned before 2015 to build 2,000 MW of windenergy capacity and up to 1,000 MW of solar powers, whichwill enable annually to produce 4.5 - 5.0 billion kWh of cleanelectricity.To unleash the potential of agriculture production and use ofalternative energy sources a number of measures areprovided, including:
- expansion of facilities for the production of biofuelsfrom agricultural raw materials;
- development and introduction of new biofueltechnologies;
- implementation of production standards for the use ofcrop rotation with roomy energy crops, etc.
However, agriculture represents not only the use of newforms of energy is at an early stage, but still there is notsolved the problem of replacing unproductive manual labor.In particular, the level of mechanization of certain types ofcrop work is not sufficient; there is a lot of manual labor workin the livestock sector.
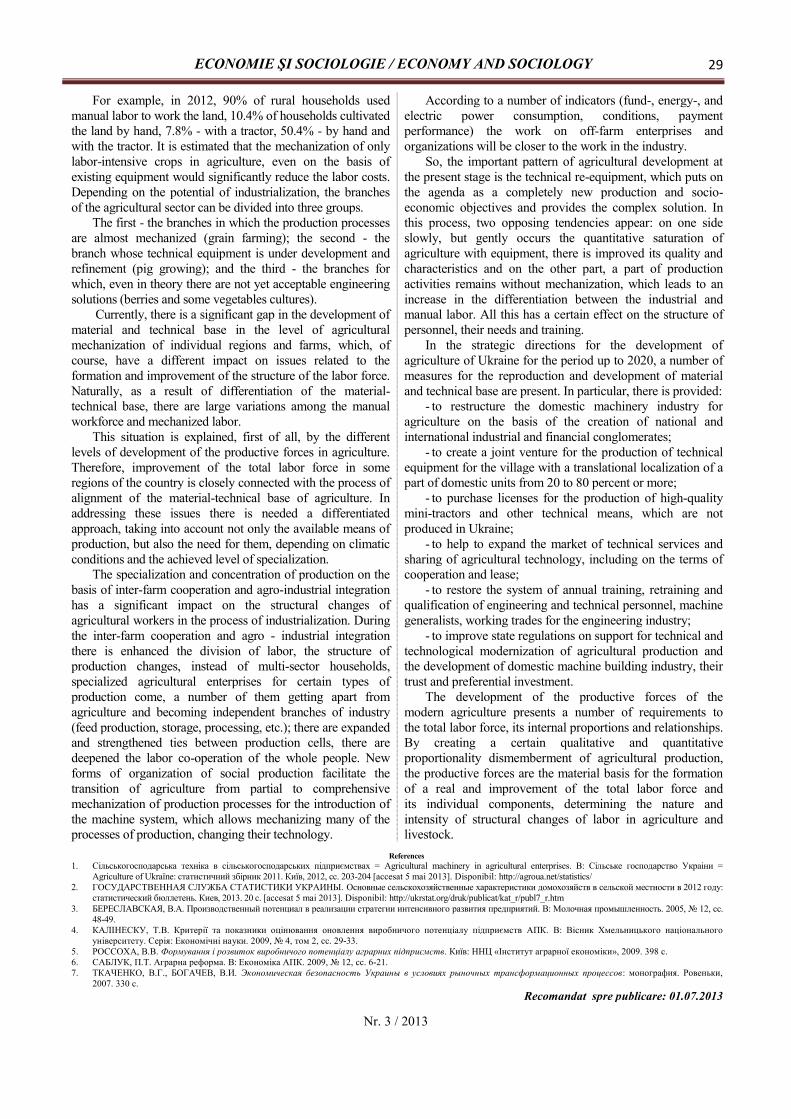
ECONOMIE ŞI SOCIOLOGIE / ECONOMY AND SOCIOLOGY 29
Nr. 3 / 2013
For example, in 2012, 90% of rural households usedmanual labor to work the land, 10.4% of households cultivatedthe land by hand, 7.8% - with a tractor, 50.4% - by hand andwith the tractor. It is estimated that the mechanization of onlylabor-intensive crops in agriculture, even on the basis ofexisting equipment would significantly reduce the labor costs.Depending on the potential of industrialization, the branchesof the agricultural sector can be divided into three groups.
The first - the branches in which the production processesare almost mechanized (grain farming); the second - thebranch whose technical equipment is under development andrefinement (pig growing); and the third - the branches forwhich, even in theory there are not yet acceptable engineeringsolutions (berries and some vegetables cultures).
Currently, there is a significant gap in the development ofmaterial and technical base in the level of agriculturalmechanization of individual regions and farms, which, ofcourse, have a different impact on issues related to theformation and improvement of the structure of the labor force.Naturally, as a result of differentiation of the material-technical base, there are large variations among the manualworkforce and mechanized labor.
This situation is explained, first of all, by the differentlevels of development of the productive forces in agriculture.Therefore, improvement of the total labor force in someregions of the country is closely connected with the process ofalignment of the material-technical base of agriculture. Inaddressing these issues there is needed a differentiatedapproach, taking into account not only the available means ofproduction, but also the need for them, depending on climaticconditions and the achieved level of specialization.
The specialization and concentration of production on thebasis of inter-farm cooperation and agro-industrial integrationhas a significant impact on the structural changes ofagricultural workers in the process of industrialization. Duringthe inter-farm cooperation and agro - industrial integrationthere is enhanced the division of labor, the structure ofproduction changes, instead of multi-sector households,specialized agricultural enterprises for certain types ofproduction come, a number of them getting apart fromagriculture and becoming independent branches of industry(feed production, storage, processing, etc.); there are expandedand strengthened ties between production cells, there aredeepened the labor co-operation of the whole people. Newforms of organization of social production facilitate thetransition of agriculture from partial to comprehensivemechanization of production processes for the introduction ofthe machine system, which allows mechanizing many of theprocesses of production, changing their technology.
According to a number of indicators (fund-, energy-, andelectric power consumption, conditions, paymentperformance) the work on off-farm enterprises andorganizations will be closer to the work in the industry.
So, the important pattern of agricultural development atthe present stage is the technical re-equipment, which puts onthe agenda as a completely new production and socio-economic objectives and provides the complex solution. Inthis process, two opposing tendencies appear: on one sideslowly, but gently occurs the quantitative saturation ofagriculture with equipment, there is improved its quality andcharacteristics and on the other part, a part of productionactivities remains without mechanization, which leads to anincrease in the differentiation between the industrial andmanual labor. All this has a certain effect on the structure ofpersonnel, their needs and training.
In the strategic directions for the development ofagriculture of Ukraine for the period up to 2020, a number ofmeasures for the reproduction and development of materialand technical base are present. In particular, there is provided:
- to restructure the domestic machinery industry foragriculture on the basis of the creation of national andinternational industrial and financial conglomerates;
- to create a joint venture for the production of technicalequipment for the village with a translational localization of apart of domestic units from 20 to 80 percent or more;
- to purchase licenses for the production of high-qualitymini-tractors and other technical means, which are notproduced in Ukraine;
- to help to expand the market of technical services andsharing of agricultural technology, including on the terms ofcooperation and lease;
- to restore the system of annual training, retraining andqualification of engineering and technical personnel, machinegeneralists, working trades for the engineering industry;
- to improve state regulations on support for technical andtechnological modernization of agricultural production andthe development of domestic machine building industry, theirtrust and preferential investment.
The development of the productive forces of themodern agriculture presents a number of requirements tothe total labor force, its internal proportions and relationships.By creating a certain qualitative and quantitativeproportionality dismemberment of agricultural production,the productive forces are the material basis for the formationof a real and improvement of the total labor force andits individual components, determining the nature andintensity of structural changes of labor in agriculture andlivestock.
References1. Ciльськогосподарська технiка в сiльськогосподарських пiдприємствах = Agricultural machinery in agricultural enterprises. В: Ciльське господарство Украiни =
Agriculture of Ukraїne: статистичний збiрник 2011. Київ, 2012, сс. 203-204 [accesat 5 mai 2013]. Disponibil: http://agroua.net/statistics/2. ГОСУДАРСТВЕННАЯ СЛУЖБА СТАТИСТИКИ УКРАИНЫ. Основные сельскохозяйственные характеристики домохозяйств в сельской местности в 2012 году:
статистический бюллетень. Киев, 2013. 20 с. [accesat 5 mai 2013]. Disponibil: http://ukrstat.org/druk/publicat/kat_r/publ7_r.htm3. БЕРЕСЛАВСКАЯ, В.А. Производственный потенциал в реализации стратегии интенсивного развития предприятий. В: Молочная промышленность. 2005, № 12, сс.
48-49.4. КАЛІНЕСКУ, Т.В. Критерії та показники оцінювання оновлення виробничого потенціалу підприємств АПК. В: Вісник Хмельницького національного
університету. Cерія: Економічні науки. 2009, № 4, том 2, сс. 2933.5. РОССОХА, В.В. Формування і розвиток виробничого потенціалу аграрних підприємств. Київ: ННЦ «Інститут аграрної економіки», 2009. 398 с.6. САБЛУК, П.Т. Аграрна реформа. В: Економіка АПК. 2009, № 12, сс. 6-21.7. ТКАЧЕНКО, В.Г., БОГАЧЕВ, В.И. Экономическая безопасность Украины в условиях рыночных трансформационных процессов: монография. Ровеньки,
2007. 330 с.Recomandat spre publicare: 01.07.2013

Revistă teoretico-științifică / Theoretical and scientifical journal30
Nr. 3 / 2013
MEDITAŢII ASUPRA EXPERIENŢEIREFORMĂRII SISTEMELOR DE PENSII
Simion CERTAN, dr. hab., prof. univ.,Universitatea Agrară de Stat din Moldova
Iulian Denis PURDESCU,Universitatea de Stat din Moldova
REFLECTIONS ON THE EXPERIENCEOF PENSION SYSTEMS REFORM
Simion CERTAN, PhD, Associate ProfessorState Agrarian University of Moldova
Iulian Denis PURDESCU,Moldova State University
Apariţia noului sistem socio-economic deschis faţă delume, declanşarea procesului de conjugare a eforturilorproprii cu cele ale comunităţii internaţionale, integrareaeconomică în Uniunea Europeană, mutaţiile structurale îndemografia populaţiei impun, fără îndoială, mutaţiiimportante nu numai de formă, ci mai ales de fond, însistemul naţional de pensii. Evident, un rol important înelaborarea şi aplicarea sistemului eficient de pensii îirevine studiului practicii acumulate de ţările lumii.
În articol autorii meditează asupra mutaţiilor ce s-auprodus în sistemele de pensii în diferite regiuni ale lumii,urmăresc practica funcţionării acestora şi vin cu unelepropuneri ce ar schimba situaţia în sistemul naţional depensii spre mai bine, ar accelera adaptarea acestuia lacerinţele politicii sociale a Uniunii Europene.
Cuvinte cheie: sistem, pensie, politici, reforme,mecanisme, eficienţă.
The appearance of the new socio-economic systemwhich is open to the world, , the triggering the process ofjoin of efforts with the international community, theeconomic integration in the EU, the structural changes inpopulation demographics require undoubtedly significantchanges not only in form, but also in background, thenational pension system. Obviously, an important role indeveloping and implementing effective pension system lieswithin the study practice accumulated over the world.
In the article the authors reflect on what change occurredin pension systems in different regions of the world, pursuingtheir operation practice and come up with some proposalsthat would change the situation in the national pension systemfor the better, would accelerate its adaptation to therequirements of European Union social policy.
Key words: system, pension, policies, reforms,mechanisms, efficiency.
JEL Classification: J21, J 29, J81, R10
Introducere. Pentru toate ţările protecţia socială a fostşi rămâne suportul existenţei anumitor categorii depopulaţie şi, prin urmare, constituie un factor dearmonizare a dezvoltării economice. Astăzi protecţiasocială, care include şi sistemul de pensii, se complicăconsiderabil din motiv că populaţia tării îmbătrâneşte. Aşa,din totalul populaţiei celor mai mari cinci ţări europene,16% sunt persoane cu vârsta trecută de 65 de ani. S-aestimat că peste nu mai mult de 30 de ani, această cifră vafi de 25%. Astfel de fenomene sunt caracteristice nu doarnumai pentru Europa, ci şi pentru Japonia, SUA şi altestate.
Schimbările economice şi sociale ce se produc încomunitate impun o permanentă adaptare şi readaptare asistemelor de pensii. În acest scop se impune o analiză asistemelor de pensii practicate în diferite regiuni ale lumii,atât de ţările cu economie prosperă, cât şi de ţările în cursde dezvoltare. Scopul investigaţiei este studiul evoluţiei,tendinţelor şi mutaţiilor structurale în sistemele de pensiiale diferitor ţări, factorii care le cauzează şi formulareaunor propuneri ce le-ar face mai eficiente.
Reformarea sistemelor de pensii pe continentulamerican
America de Nord. Unele state din această zonă ausisteme de pensii, care îmbină sistemele de securitatesocială de tip „pay-as-you-go”, oferind pensii modeste, cuscheme ocupaţionale de pensii, puternic capitalizate,majoritatea bazate pe prestaţii definite.
Reforma în America de Nord s-a realizat treptat.Schimbarea lentă mai întâi, s-a produs în schemeleocupaţionale. În principal, acestea sunt orientate mai multspre schimbarea modelelor de ocupare şi a structurii
Introduction. For all countries, social protection wasand it still is existence support for certain categories of thepopulation and, therefore, constitutes an harmonizationfactor for economic development. Today social protection,which includes pension system, is complicated becausecountry's population is ageing. Thus, out of totalpopulation of five largest European countries, 16% arepeople with age over 65 years. It has been estimated that inno more than over 30 years, this number will be of 25%.Such phenomena are characteristic not only for Europe butalso for Japan, U.S.A. and other countries.
Economic and social changes that occur in thecommunity require constant adjustment and readjustmentof pension systems. For this is required an analysis ofpension systems in different regions of the world, ofprosperous economy countries and also of developingcountries. The purpose of the investigation is the study ofevolution, of trends and of structural changes in pensionsystems of different countries, factors that cause them andformulation of proposals that would make them moreeffective.
From the pension systems’ reformation within theAmerican continent
North America. Some states in this region havepension systems that combine social security systems of"pay-as-you-go" pension, offering a modest occupationalpension scheme, strongly capitalized, most based ondefined benefits.
The reform in North America was realized gradually.Slow changes first occurred in occupational schemes.Mainly, they are oriented towards changing patterns ofemployment and industry structure, rather than to the
ECONOMIE ŞI SOCIOLOGIE / ECONOMY AND SOCIOLOGY 31
Nr. 3 / 2013
industriei decât spre conversia schemelor existente.Majoritatea întreprinderilor noi urmează schemele orientatespre contribuţii definite. Multe întreprinderi oferă astfel descheme pentru noii angajaţi [1].
America latină. Reformarea sistemelor de pensii înţările Americii Latine considerabil au fost influenţate demodelul chilian care, sub multe aspecte, a devenitprototipul modelelor de pensii în statele din EuropaCentrală şi de Est.
Încă în anul 1980 Guvernul din Chile a schimbatsistemul de pensii de stat prin sistemul de conturi deeconomii de pensii (CEP) condus de companii private.Mărimea pensiei lucrătorului se determină din suma debani acumulaţi în anii de lucru. Angajatorul în fiecare lunăvirează 10% din salariul angajatului în contul de economiial acestuia. Norma respectivă se aplică numai asupravenitului anual ce depăşeşte 22 000 de dolari. Angajatulbenevol poate introduce suplimentar în CEP 10% dinsalariul lunar. Angajatul, dacă vrea să iasă la pensie maidevreme sau să primească pensie mai mare, va introducemai mult de 10% din salariul lunar. Statul acordă pensieminimă garantată doar pentru lucrătorii cu cel puţin 20 deani contribuţie.
Reforma sistemului de pensii în Chile a inclus prezenţaobligatorie a lucrătorilor noi şi participarea voluntară acelor vechi, la sistemul nou, capitalizat, strict reglementatşi administrat privat. Sistemul CEP se bazează pereglementări draconice, cum ar fi un singur cont pentrulucrător, un singur fond de pensii, limite investiţionaleprecise.
Rata medie reală de creştere a fondurilor de pensii afost de aproximativ 12%, iar nivelul real de creştereindividuală pentru asiguraţi a fost mai mic cu 3-5%, dincauza costurilor mari. Au fost introduse obligaţiuni înscopul acoperirii contribuţiei plătite de lucrători la vechiulsistem, astfel încât costurile ridicate ale tranziţiei au fostfinanţate prin reducerea cheltuielilor altor programe şi prinacoperirea deficitului.
La începutul anilor ’90 ai secolului trecut, a fost pusă înpractică a doua generaţie de reforme în Peru, Columbia şiArgentina. În Columbia şi Peru, sistemul de pensii privateeste oferit ca alternativă sistemului public. În Columbia,lucrătorilor le este permisă trecerea între sistemul public şiprivat la fiecare trei ani. În Argentina, toţi lucrătorii trebuiesă contribuie la o componentă publică, de tip „pay-as-you-go”, care oferă o pensie de bază. Aceasta este completatăprin participare obligatorie fie la o componentă privată, cucontribuţie definită, fie la o componentă publică, cuprestaţii definite.
Cele trei ţări au introdus schimbări orientate sprelimitarea, unificarea şi diminuarea schemelor publice. Înstructurarea şi proiectarea componentelor lor private, ele austudiat în detalii exemplul chilian, în mod special în ceea cepriveşte reglementările şi controlul CEP. În societăţile deadministrare a fondurilor de pensii se reglementeazăprofitul minim relativ, deşi acest lucru a fost recenteliminat în Peru. Columbia şi Argentina oferă pensiiminime.
Mai recent, Mexic, Bolivia şi El Salvador au formulatlegi privind reforma pensiilor fundamentate pe fonduri de
conversion of the existing schemes. Most of the newenterprises follow the schemes oriented to definedcontributions. Many companies offer such schemes to newemployees [1].
Latin America. Pension reforms in Latin Americahas been greatly influenced by the Chilean model which, inmany ways, became the prototype for retirement models inthe states of Central and Eastern Europe.
Still in 1980 the Chilean government changed thepension system through the state pension savings accounts(PSA) led by private companies. Worker’s pension amountis determined by amount of money accumulated duringworked years. Monthly, employer transfers 10% of theemployee's salary in its savings account. That rule appliesonly to the annual income that exceeds 22,000$. Voluntary,employee can introduce additional in PSA 10% of themonthly salary. The employee, if he wants to retire early orto receive higher pension, will introduce more than 10% ofmonthly salary. State offers guaranteed minimum amountof pension only for to the workers with at least 20 years ofcontribution.
Pension reform in Chile included obligatory presenceof new works and voluntary participation of older ones tothe new system, which was capitalized, privately managedand strictly regulated. The PSA is based on draconianlegislation such as one account for the worker, a singlepension fund, accurate investment limits.
The average real growth of pension funds wasapproximately 12%, but the actual increasion for individualpolicyholders was lower by 3-5% due to high costs. Bondswere introduced to cover the contribution paid by workersfrom the old system so that high costs of transition wasfinanced by reduction of other programs costs and in thisway cover deficit.
In the early 90’s of the last century, was implementedthe second generation of reforms in Peru, Colombia andArgentina. In Colombia and Peru, the private pensionsystem is offered as an alternative to the public system. InColombia, workers are allowed to switch between publicand private system every three years. In Argentina, allworkers must contribute to a public component, as the"pay-as-you-go" one, which provides a basic pension. Thisis completed by a compulsory attendance either to a privatecomponent, with a defined contribution, or to a publiccomponent with defined benefits.
The three countries have introduced changes aimed atlimiting, unification and reduction of public schemes. Inthe structure and design of their private parts, the threecountries studied closely the example of Chile, specificallyin terms of regulations and control of PSA. Themanagement companies of pension funds regulate theminimum profit ratio, although this has recently beenremoved from Peru, Colombia and Argentina provideminimum pensions.
More recently, Mexico, Bolivia and El Salvador havemade laws regarding reform of pension based oncapitalized pension funds, privately managed.
Bolivia took over and implemented a privatizationprogram funded by selling public enterprises to foreignstrategic investors, in the mission of new capital and
Revistă teoretico-științifică / Theoretical and scientifical journal32
Nr. 3 / 2013
pensii capitalizate, administrate privat.Bolivia a preluat şi a pus în aplicare un program de
privatizare prin capitalizare, vânzând întreprinderilepublice investitorilor strategici străini în misiunea infuzieide capital nou şi tehnologii moderne. Jumătate din sumeleobţinute prin privatizare au fost rezervate rezidenţilorlocali, în formă de unităţi în fonduri naţionale de pensii,care au fost create. Două grupuri străine – spaniole, aucâştigat licenţa internaţională, fiind licenţiate pentrucrearea şi administrarea fondurilor naţionale de pensii.Celor două fonduri de pensii li se cere să aibă un portofoliude investiţii diversificat şi internaţional, dar cu ocomponentă naţională însemnată. De asemenea, ele aurestricţii privind nivelul comisioanelor pe care pot să-lacorde [2].
Reformarea sistemului de pensii în OrientulMijlociu şi Africa
Orientul Mijlociu. Turcia se confruntă cu problemefinanciare puternice ale sistemului public de pensii,aproape în totalitate necapitalizat. Mai mult, nu se apeleazăla hotărâri cu privire la reforme sistemice a modelului depensii.
În ţările arabe sistemele de pensii sunt asiguratesubstanţial cu resurse financiare. Sistemele de pensii suntformate prin capitalizare. Contribuţiile angajaţilor suntrelativ mari. Resursele acumulate în fondurile de pensii, înmulte ţări arabe, alcătuiesc peste 20% din PIB. Totuşi,profiturile din investiţiile acestor fonduri au fost, în marealor majoritate, inadecvate necesităţilor. În termeni reali elesunt moderat negative, cu excepţia Iordaniei şi Egiptului. Oexcepţie importantă o reprezintă Israelul, care recent aintrodus sisteme private de pensii, formate pe bazeopţionale.
Africa de nord. Majoritatea ţărilor din aceastăregiune au structuri publice, parţial capitalizate, care seconfruntă cu probleme imense, din cauza deteriorăriiprogresive a ratelor de dependenţă ale sistemului, a ratelorde înlocuire ridicate şi a nivelului redus al profituluiprovenit din investiţii. În unele ţări precum Tunisia, Maroc,Iordania, Egipt s-au implementat unele măsuri parţiale cuprivire la reformarea sistemului de pensii. Acestea suntorientate spre majorarea profitului din investiţii şidiminuarea costurilor administrării sistemului de pensii.Practic, încă nu se preconizează reforme sistemice.
Africa sub-sahariană. Cu excepţia Africii de Sud,care dispune de un sistem de pensii eficient. Numeroaseleţări africane anglofone dispun de fonduri naţionale, caresuferă de rate negative ale profitului. În termeni reali,sistemele de pensii ale acestor ţări se caracterizează şi prinerodarea echilibrelor financiare. Kenia face excepţie prinintenţia de a privatiza fondul naţional de pensii.
Ţările africane francofone aplică sisteme publice de tip„pay-as-you-go” cu beneficii definite, care au problemefinanciare, în ciuda structurii demografice, în care dominătinerii. Aceasta se datorează acoperirii limitate şi evaziuniifoarte răspândite. Măsurile de îmbunătăţire a acestorsisteme se focalizează pe reforma administrativă [3].
Reformarea sistemului de pensii în Asia şi Australia Asia de Est. Pentru Singapore şi Malaezia sunt
caracteristice fondurile de pensii naţionale cu rate ridicate
technologies infusion. Half of the proceeds obtainedthrough privatization were booked for the local residents inthe form of units of national pension funds that have beencreated. Two foreign groups – Spanish – gainedinternational license, being licensed to create and managetheir pension funds. The two pension funds are required tohave a diversified portfolio of international investments,but with a substantial national component. They also haverestrictions on the fees that they can provide [2].
Pension system reformation in Middle East andAfrica
Middle East. Turkey faces strong financial problemsof the public pension system, almost all being noncapitalized. Moreover, there is no appeal to decisions onsystemic reform of the pension model.
In Arab countries pension systems are securedsubstantially with financial resources. Pension systems areformed by capitalization. Employee contributions arerelatively high. The resources accumulated in pensionfunds in many Arab countries, make up over 20% of GDP.However, profits from the investment of these funds were,for the most part, inadequate to the needs. In real termsthey are moderately negative, with the exception of Jordanand Egypt. An important exception is Israel that recentlyintroduced private pension systems formed on optionalbasis.
North Africa. Most countries in this region havepublic structures, partially capitalized that face to colossalproblems due to progressive deterioration of the system ofdependency rates, high replacement rates and lower levelsof profit from investments. In some countries like Tunisia,Morocco, Jordan, Egypt were implemented partialmeasures on reforming of the pension system. They aregeared toward reducing of the increasion in profit frominvestments and pension administration costs. Basically,there are not expected any systemic reforms yet.
Sub-Saharan Africa, with the exception of SouthAfrica, which has an effective pension system. Thenumerous Anglophone African countries have nationalfunds that go through negative rate of profit. In realterms, pension systems of these countries are characterizedby erosion of financial balances. Kenya makes anexception with the intention to privatize the nationalpension fund.
The Francophone African countries apply the publicsystem of "pay-as-you-go" type with defined benefits,which have financial problems, despite the demographicstructure where youth dominates. This is due to the limitedcoverage and widespread evasion. The measures toimprove these systems are focused on administrativereform [3].
Reforming the pension system in Asia and Australia East Asia. For Singapore and Malaysia are
characteristic national pension funds with high rates ofcontribution, large capital reserves, real relatively lowreturns and low operating costs. Recently, it has been givena great opportunity to invest the financial resources onauthorized markets, including foreign markets.
Other East Asian countries have public pensionsystems, partly capitalized and non capitalized, with a

ECONOMIE ŞI SOCIOLOGIE / ECONOMY AND SOCIOLOGY 33
Nr. 3 / 2013
de contribuţie, cu o mare rezervă de capital, cu profiturireale relativ reduse şi cu costuri de operare scăzute. Decurând, a fost acordată o posibilitate sporită de a investiresursele financiare pe pieţe autorizate, inclusiv pieţeleexterne.
Alte ţări din Asia de Est au sisteme de pensii publice,parţial capitalizate sau necapitalizate, cu o acoperirelimitată, fiind încă sisteme tinere. De aceea, cheltuielilepentru administrarea sistemelor de pensii sunt relativ mici.Totuşi, populaţia din regiune îmbătrâneşte repede şipresiunile financiare se amplifică. Acestea se mai amplificăşi datorită evaziunii şi profiturilor scăzute din investiţii. Sediscută deja posibilitatea unor reforme sistemice, care arputea implica fie realizarea sistemelor cu mai multecomponente, fie realizarea unor fonduri de prevenire amicşorării resurselor din fondurile de pensii.
În China sistemul actual de pensii are ca bază schemenecapitalizate, cu beneficii definite, administrate deîntreprinderi cu proprietate de stat. În prezent se practicăunirea acestor întreprinderi, fie la nivel regional, fie la nivelde ramuri industriale. Această soluţie oferă numai orezolvare doar parţială a problemei deoarece acesteîntreprinderi au din ce în ce mai multe probleme financiare.
China se mai confruntă şi cu o altă problemă, pe termenlung, generată de îmbătrânirea foarte rapidă a populaţieidatorită politicilor de control a natalităţii. Evident China astudiat posibilitatea realizării unei reforme sistemice amodelului practicat. Reforma sistemică în domeniulpensiilor în această ţară se preconizează a fi orientatăcurând spre o componentă publică, necapitalizată, oferindpensii modeste şi spre o componentă capitalizată, bazată peconturi individuale. Însă, astfel de reformare asistemului de pensii este zădărnicită, printre altele, decosturile mari [4].
În Japonia fondurile de pensii cresc rapid, darşicheltuielele ce ţin de sistemul de pensii tind să explodeze,dacă vârstele de pensionare nu vor spori însemnat [5].
Coreea,într-o măsură mult mai mică, practică sistemede pensii dezvoltate, dat fiind că se confruntă cu presiunidemografice imense.
Asia Centrală şi de Sud. India, Pakistan şi SriLanka au capitalurile tradiţionale de acoperire anecesităţilor mai mici, dar nu negative ca în Africa. Acumexistă o necesitate incontestabilă de a modifica acestefonduri în sisteme de tip „pay-as-you-go”, cu prestaţiidefinite, care ar avea un grad mărit de acoperire [6].
Ţările Asiei Centrale, care au fost republici în fostaUniune Sovietică, au probleme similare cu cele ale Rusiei.Aceste ţări au structuri demografice cu ponderea sporită apopulaţiei de vârstă pensionară. Unele dintre ele,Kazahstan şi Uzbekistan, analizează posibilitatea de apractica sisteme de pensii obligatorii, asemănătoare celordin America Latină. Celelalte ţări au sistem financiarnedezvoltat pentru a realiza cu succes reforme sistemiceîn domeniul pensiilor. În momentul de faţă, aceste ţări faceforturi pentru pregătirea bazei de reformare a sistemuluide pensii.
Australia a introdus legislaţia, care face obligatoriischemele de pensii ocupaţionale cu contribuţii definite.Componentele sunt obligatoriu capitalizate, construite pe
limited coverage, being still young systems. Therefore, theexpenditures for pension systems’ administration arerelatively small. However, the region's population is agingrapidly and financial pressures are amplified. This is alsodue to evasion and low profits from investment. It is beingalready discussed the possibility of systemic reforms thatmight involve either achieve multi-component systems orrealization of prevention funds for decreasing resources ofpension funds.
In China the current pension system is based on noncapitalized schemes, with defined benefits managed bystate-owned enterprises. Currently, is being practiced anunion of these companies either at regional level or at thelevel of industries. This solution provides only a partialresult to the problem just as these companies haveincreasingly more financial problems.
China also faces another long term problem, driven byvery rapid population aging due to birth control policies.Obviously China has studied the feasibility of a systemicreform of the practiced model. The systemic pensionreform in this country is expected soon to be orientedtoward a public component, non capitalized, offeringmodest pensions and to a capitalized component, based onindividual accounts. However, such a pension reform isslowed, among others, by high costs [4].
In Japan, pensions funds are growing rapidly, as well asthe expenses related to pension system tend to explode ifretirement ages will not significantly increase [5].
Korea, in a much smaller amount practices developedpension schemes, since it faces huge demographicpressures.
Central and South Asia. India, Pakistan and SriLanka have traditional capital of needs coverage less, butnot negative as in Africa. Now, there is an undeniable needof changing these systems funds to the "pay-as-you-go"ones, with defined benefits, which would have an increasedcoverage degree [6].
Central Asian countries that were former Sovietrepublics have problems similar to those of Russia. Thesecountries have demographic structures with increased shareof retirement age population. Some of them, Kazakhstanand Uzbekistan, analyze the possibilities to practicemandatory pension systems, like those in Latin America.Other countries have underdeveloped financial system inorder to successfully achieve systemic reforms in pensions.Presently, these countries are making efforts to prepare thebasis for pension reforming.
Australia introduced legislation that makesmandatory the occupational pension schemes with definedcontributions. Components are compulsory capitalized,built on enterprise schemes and on supplementary statepensions, which existed previously. This country ensurespensions to all residents in retirement age, depending ontheir incomes or properties.
Reforming pensions in EuropeEuropean countries differ both in terms of level of
economic development and pension systems. TypicallyEuropean countries are grouped in the East, Central andWest.
European pension system is homogeneous, firstly, from
Revistă teoretico-științifică / Theoretical and scientifical journal34
Nr. 3 / 2013
schemele de întreprindere şi pe pensiile complementare destat, ce existau anterior. Ţara respectivă asigură pensiituturor rezidenţilor în vârstă pensionară, în funcţie deveniturile sau proprietăţile acestora.
Reformarea sistemului de pensii în EuropaŢările din Europa diferă atât din punct de vedere al
nivelului de dezvoltare economică cât şi a sistemelor depensii. De regulă ţările europene se grupează în cele de Est,Centru şi Vest.
Sistemul de pensii european este neomogen, mai întâi,din punct de vedere legislativ. Sistemele europene de pensiipot fi divizate în două categorii:
1. cele cu legi permisive, pentru care competiţia întrefonduri este acerbă;
2. cele cu sisteme mai puţin flexibile, unde – o datăce s-a conturat o structură a pieţei – barierele de intraresunt uriaşe.
Sistemele de pensii ale tuturor ţărilor europene s-audovedit nesustenabile pe termen lung, ce obligă lareformarea sistemelor europene de pensii. Mai mult, de-alungul anilor s-a instituit o administrare defectuoasă afondurilor de pensii de către stat, fapt ce încă o datăgenerează deficite substanţiale în bugetele asigurărilorsociale. Astfel, în mod repetat, se constatănecesitateareformăriisistemelor de pensii, în sensul preluării de cătreadministrarea privată a cât mai mult din contribuţiilecolectate prin sistemul public.
Modul în care s-a iniţiat şi se realizează reformareasistemelor de pensii diferă în ţările europene din Est Centruşi Vest.
Europa de Centru şi de Est. Ţările din Europa deEst, au păstrat în mod ereditar sisteme de pensii publice detip pay-as-you-go, cu prestaţii definite, aproape universale.Ele se confruntă cu probleme financiare datoritădeteriorării ratei de dependenţă a sistemului şi modalităţi deindexare a pensiilor. Unele ţări din această regiune auiniţiat reformarea sistemului de pensii prin creştereavârstelor de pensionare, modificarea criteriilor pentrupensiile de invaliditate, diminuarea ratelor de înlocuire.
În Federaţia Rusă reformarea sistemului de pensii esteorientată spre a-i oferi cetăţeanului posibilitatea de a dispunede o astfel de pensie, pe care el singur şi-a câştigat-o.
Pensia va fi compusă din trei părţi:• pensia de bază, care se finanţează din bugetul federal
şi se acordă pentru toţi la fel, indiferent de salariulpersoanei concrete;
• pensia de asigurare sau de acumulare condiţionată,care se finanţează din veniturile fondului de pensii de stat şise indexează, reieşind din ritmul inflaţiei;
• pensia din acumulări, care se formează pe conturiindividuale prin contribuţiile personale de la 2% până la6% în funcţie de vârsta lucrătorului.
În Rusia există peste 1000 de fonduri private de pensii,marea lor majoritate fiind mici şi operând ca aşa numitecluburi de economii pe conturi individuale.
În ţările din Europa de Est şi de Centru, care deja audevenit membre ale Uniunii Europene, legislaţia cu privirela sistemul de pensii se află la polul opus ţărilor cu vechimemai mare în UE, iar raportul între pensionari şicontribuabili este de trei la doi, riscă ca sistemul de pensii
a legal perspective. European pension systems can bedivided into two categories:
1. Those with permissive laws for which competitionbetween funds is fierce;
2. Those with less flexible systems, where – onceyou emerged a market structure – the barriers to entry arehuge.
The pension systems of all European countries provedto be unsustainable on a long-term, which requiresreforming pension systems in Europe. Furthermore, overthe years it was established a mismanagement of pensionfunds by the state, which again generates substantialdeficits in social insurance budgets. Thus, repeatedly, thereis a need to reform the pension systems by privateadministration taking over as much of the contributionscollected by the public.
The way the pension reforms were initiated and carriedout differs in the Eastern European countries, Centre andWest ones.
Central and Eastern Europe. The countries ofEastern Europe, have kept hereditary the pay-as-you-gopublic pension systems, with defined benefits, almostuniversal. They face financial problems due to damage ofsystem dependency rate and pension indexationarrangements. Some countries in this region have initiatedreform of the pension system by rising the retirement age,changing the criteria for disability pensions, reducingreplacement rates.
In the Russian Federation pension reform is oriented togive the citizen the opportunity to have such a pension,which he has won by himself.
Pension will consist of three parts:- basic pension which is financed from the federal
budget and is given equally to everyone, regardless of theactual salary of the person;
- insurance pension or conditional accumulation whichis financed from the state pension fund revenues and isindexed based on the inflation rate;
- pension from accumulations which is formed onindividual accounts through personal contributions from 2to 6% depending on the age of the worker.
In Russia there are over 1,000 private pension funds,most of which are small and operating as so-called clubs ofsavings on individual accounts.
In the countries of Eastern and Central Europe, whichhave already become members of the European Union,legislation on pension system is opposite to the older EUcountries and the ratio between pensioners and taxpayers isthree to two, risks that the pension system to becomebankrupt in not more than 15 years.
It requires not only the initiation but also theacceleration of pension reform. Central and Eastern Europestarted the reform of pension systems in force, Poland andHungary being the most convincing in this way.
Obviously, this requires considerable financialresources. The costs of the reform beginning wereestimated at 600 million USD, of which only commissionagents involved in attracting the 9 million taxpayers wouldrise to 200 million USD.
In reforming of the pension system in Poland have been
ECONOMIE ŞI SOCIOLOGIE / ECONOMY AND SOCIOLOGY 35
Nr. 3 / 2013
să devină falimentar cel mult peste 15 ani.Se impune nu doar iniţierea, ci şi accelerarea reformării
sistemului de pensii. Centrul şi estul Europei a demaratreformarea sistemelor de pensii în forţă, Polonia şi Ungariafiind cele mai convingătoare în acest sens.
Evident, ce cer resurse financiare considerabile.Costurile pentru începerea activităţilor de reformare au fostestimate la 600 mil USD, din care doar comisioaneleagenţilor antrenaţi în atragerea celor 9 milioane decontribuabili s-ar ridica la 200 mil USD.
În procesul de reformare a sistemului de pensii dinPolonia s-au format fonduri private de pensii cu utilizareaunei finanţări parţiale din resurse obţinute prin procedurilede privatizare.
În Ungaria, fondurile opţionale de pensii private s-audezvoltat mai lent în pofida faptului că au beneficiat deimpozitare generoasă. În iulie 1997 Ungaria a adoptatlegislaţia necesară pentru introducerea sistemuluiobligatoriu de pensii private [7].
În România succesul va aparţine administratorilor defonduri, care vor porni de la o infrastructură deja existentă,sinergiile fiind evidente. Lecţia poloneză accentuează şiimportanţa unui control adecvat din partea instituţiilorguvernamentale abilitate, pentru a evita obstacolele sauneregulile apărute în timpul implementării reformei.
Foarte puţine ţări impun condiţii ce ar părea draconiceoricăror manageri de fonduri care aştepta ceva în înlocuirea investiţiilor efectuate şi al riscurilor la care s-au expus.Sub acest aspect se deosebeşte Republica Cehă care aadoptat o lege cereduce influenţa sistemuluide tipul pay-as-you-go, cu prestaţii precise şi încurajează creareafondurilor de pensii private opţionale. Ea a prevăzut şisubvenţii din partea statului, care se adaugă la conturileindividuale ale lucrătorilor.Costul fiscal al subvenţiilorpoate fi mare, dar nu aşa de mare ca în cazul unui sistembazat pe contribuţii deductibile din impozite. Fondurile depensii sunt administrate de grupuri financiare în dezvoltareşi pot suferi în caz de faliment al acestora.
Croaţia, Slovenia, Albania şi altele manifestă intenţii dea efectua reforme sistemice asemănătoare cu modelul dinArgentina, incluzând o componentă publică, necapitalizată,plătind o pensie de bază şi o componentă capitalizată,bazată pe conturi private şi contribuţii legiferate. Adoua componentă se poate fundamenta pe scheme susţinutede patroni sau pe administrarea de către societăţispecializate [8].
Europa de Vest şi-a ales propriul sistem de pensii,mai mult sau mai puţin privat, respingând să urmezemodelul implementat de Statele Unite, în cadrul căruiafondurile de pensii administrate privat strânge nu mai puţinde 75% din PIB.
De menţionat că în ţările Europei de Vest, potrivitestimărilor, cuantimul pensiilor datorate de stat va atingedimensiuni periculoase. Se evidenţiază sub acest aspectOlanda, unde cuantimul pensiilor datorate de stat în PIB(tabelul 1) va creşte de la 5,7% în anul 2000 la 21,1% înanul 2040. Cea mai mică creştere a cuantimului pensiilordatorate de stat în PIB, de la 11,1% în anul 2000 la 14,9%în anul 2040, se preconiza pentru Suedia.
formed private pension funds with the usage of partialfunding from resources obtained through privatizationprocedures.
In Hungary, optional private pension funds have grownslowly despite that they had benefited from generaltaxation. In July 1997 Hungary passed the legislationnecessary to introduce mandatory private pensionsystem [7].
In Romania the success will belong to those fundmanagers that will start from the already existinginfrastructure, the synergies being obvious. The Polishlesson emphasizes the importance of adequate control ofthe authorized governmental institutions, in order to avoidobstacles or irregularities occurred during theimplementation of the reform.
Very few countries impose conditions that wouldseem draconian to any fund managers who expectsomething in replacement of made investments and of therisks to which they have been exposed. Under this aspectthe Czech Republic is distinguished, it passed a law thatreduces the influence of the pay-as-you-go system withprecise benefits and encourages the creation ofoptional private pension funds. It also provided grants fromthe state, which are added to workers' individualaccounts. The fiscal cost of subsidies can be great, but notas high as in the case of a system based on contributionsdeductible from tax. Pension funds are managed byfinancial groups in development and may suffer in case oftheir bankruptcy.
Croatia, Slovenia, Albania and others manifest intentsto make systemic reforms similar to the model inArgentina, including a public component, non capitalized,paying a basic pension and a capitalized component, basedon private accounts and legislated contributions. Thesecond component may underlie on the schemes supportedby the owners or on the administration by specializedcompanies [8].
Western Europe has chosen its own pension system,more or less private, rejecting to follow the modelimplemented by the United States, where private pensionfunds collect no less than 75% of GDP.
To be noted is the fact that in Western Europe,according to estimates, the amount of pensions owed by thestate will reach dangerous dimensions. The Netherlandsis highlighted in this aspect, where the amount ofpensions owed by the state in GDP (Table 1) willincrease from 5.7% in 2000 to 21.1% in 2040. The smallestincrease in the amount of pensions owed by the state inGDP from 11.1% in 2000 to 14.9% in 2040 was expectedfor Sweden.
This situation caused the conversion of the publicpension system of "pay-as-you-go" type with thebenefits outlined in a scheme of "pay-as-you-go" withdefined contribution. This involves the creation ofnotional individual accounts, of a direct link betweencontributions and benefits, and of notional interest lendingin the balance of accumulated funds. At retirement,workers get an annual rent from the public system, whichreflects the life expectancy at retirement and notionalinterest rate.
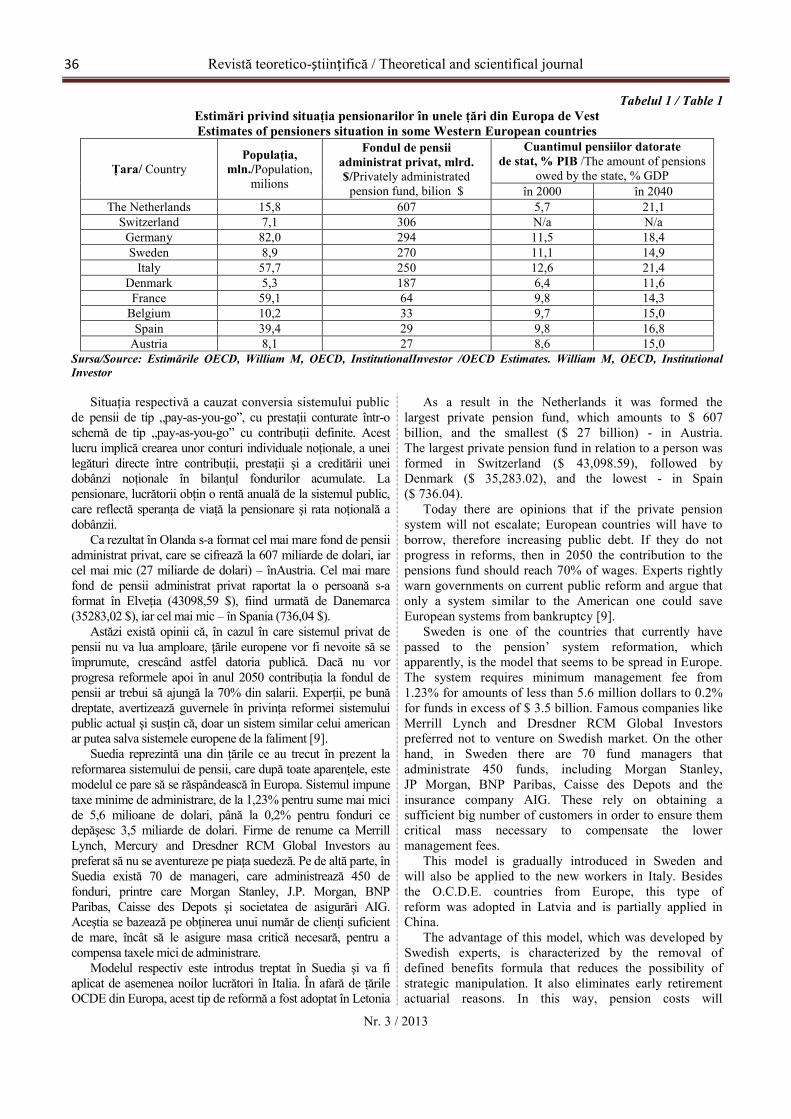
Revistă teoretico-științifică / Theoretical and scientifical journal36
Nr. 3 / 2013
Tabelul 1 / Table 1Estimări privind situaţia pensionarilor în unele ţări din Europa de VestEstimates of pensioners situation in some Western European countries
Ţara/ CountryPopulaţia,
mln./Population,milions
Fondul de pensiiadministrat privat, mlrd.$/Privately administrated
pension fund, bilion $
Cuantimul pensiilor datoratede stat, % PIB /The amount of pensions
owed by the state, % GDPîn 2000 în 2040
The Netherlands 15,8 607 5,7 21,1Switzerland 7,1 306 N/a N/a
Germany 82,0 294 11,5 18,4Sweden 8,9 270 11,1 14,9
Italy 57,7 250 12,6 21,4Denmark 5,3 187 6,4 11,6
France 59,1 64 9,8 14,3Belgium 10,2 33 9,7 15,0
Spain 39,4 29 9,8 16,8Austria 8,1 27 8,6 15,0
Sursa/Source: Estimările OECD, William M, OECD, InstitutionalInvestor /OECD Estimates. William M, OECD, InstitutionalInvestor
Situaţia respectivă a cauzat conversia sistemului publicde pensii de tip „pay-as-you-go”, cu prestaţii conturate într-oschemă de tip „pay-as-you-go” cu contribuţii definite. Acestlucru implică crearea unor conturi individuale noţionale, a uneilegături directe între contribuţii, prestaţii şi a creditării uneidobânzi noţionale în bilanţul fondurilor acumulate. Lapensionare, lucrătorii obţin o rentă anuală de la sistemul public,care reflectă speranţa de viaţă la pensionare şi rata noţională adobânzii.
Ca rezultat în Olanda s-a format cel mai mare fond de pensiiadministrat privat, care se cifrează la 607 miliarde de dolari, iarcel mai mic (27 miliarde de dolari) – înAustria. Cel mai marefond de pensii administrat privat raportat la o persoană s-aformat în Elveţia (43098,59 $), fiind urmată de Danemarca(35283,02 $), iar cel mai mic – în Spania (736,04 $).
Astăzi există opinii că, în cazul în care sistemul privat depensii nu va lua amploare, ţările europene vor fi nevoite să seîmprumute, crescând astfel datoria publică. Dacă nu vorprogresa reformele apoi în anul 2050 contribuţia la fondul depensii ar trebui să ajungă la 70% din salarii. Experţii, pe bunădreptate, avertizează guvernele în privinţa reformei sistemuluipublic actual şi susţin că, doar un sistem similar celui americanar putea salva sistemele europene de la faliment [9].
Suedia reprezintă una din ţările ce au trecut în prezent lareformarea sistemului de pensii, care după toate aparenţele, estemodelul ce pare să se răspândească în Europa. Sistemul impunetaxe minime de administrare, de la 1,23% pentru sume mai micide 5,6 milioane de dolari, până la 0,2% pentru fonduri cedepăşesc 3,5 miliarde de dolari. Firme de renume ca MerrillLynch, Mercury and Dresdner RCM Global Invеstors aupreferat să nu se aventureze pe piaţa suedeză. Pe de altă parte, înSuedia există 70 de manageri, care administrează 450 defonduri, printre care Morgan Stanley, J.P. Morgan, BNPParibas, Caisse des Depots şi societatea de asigurări AIG.Aceştia se bazează pe obţinerea unui număr de clienţi suficientde mare, încât să le asigure masa critică necesară, pentru acompensa taxele mici de administrare.
Modelul respectiv este introdus treptat în Suedia şi va fiaplicat de asemenea noilor lucrători în Italia. În afară de ţărileOCDE din Europa, acest tip de reformă a fost adoptat în Letonia
As a result in the Netherlands it was formed thelargest private pension fund, which amounts to $ 607billion, and the smallest ($ 27 billion) - in Austria.The largest private pension fund in relation to a person wasformed in Switzerland ($ 43,098.59), followed byDenmark ($ 35,283.02), and the lowest - in Spain($ 736.04).
Today there are opinions that if the private pensionsystem will not escalate; European countries will have toborrow, therefore increasing public debt. If they do notprogress in reforms, then in 2050 the contribution to thepensions fund should reach 70% of wages. Experts rightlywarn governments on current public reform and argue thatonly a system similar to the American one could saveEuropean systems from bankruptcy [9].
Sweden is one of the countries that currently havepassed to the pension’ system reformation, whichapparently, is the model that seems to be spread in Europe.The system requires minimum management fee from1.23% for amounts of less than 5.6 million dollars to 0.2%for funds in excess of $ 3.5 billion. Famous companies likeMerrill Lynch and Dresdner RCM Global Invеstorspreferred not to venture on Swedish market. On the otherhand, in Sweden there are 70 fund managers thatadministrate 450 funds, including Morgan Stanley,JP Morgan, BNP Paribas, Caisse des Depots and theinsurance company AIG. These rely on obtaining asufficient big number of customers in order to ensure themcritical mass necessary to compensate the lowermanagement fees.
This model is gradually introduced in Sweden andwill also be applied to the new workers in Italy. Besidesthe O.C.D.E. countries from Europe, this type ofreform was adopted in Latvia and is partially applied inChina.
The advantage of this model, which was developed bySwedish experts, is characterized by the removal ofdefined benefits formula that reduces the possibility ofstrategic manipulation. It also eliminates early retirementactuarial reasons. In this way, pension costs will
ECONOMIE ŞI SOCIOLOGIE / ECONOMY AND SOCIOLOGY 37
Nr. 3 / 2013
şi este parţial aplicat în China.Avantajul acestui model, care a fost elaborat de experţi
suedezi, se caracterizează prin înlăturarea formulei prestaţiilordefinite, care diminuează posibilitatea manipulării strategice. Deasemenea, el elimină motivaţiile actuariale pentru pensionareanticipată. În acest mod, costurile sistemului de pensii vorscădea, permiţând crearea conturilor de capitalizare individuală.
Modelul suedez include costuri de operare mai reduse, darstimulează foarte puţin dezvoltarea pieţelor de capital, în specialîn primii ani ai reformei. Rata noţională a dobânzii folosită poatefi mult mai mică decât rata reală a profitului posibil de obţinut încazul unor conturi individuale capitalizate, care sunt investiteîntr-un portofoliu divers.
În Germania până în anul 2002 fondul de pensii se formapreponderent din contul contribuţiilor speciale. La realizareastagiului de muncă complet (45 de ani) mărimea pensiei alcătuia70% din ultimul salariu net. În anul 2001 Camera Supremă aBundestagului a aprobat legea cu privire la reformarea pensiilorde stat care, în esenţă, a deschis calea asigurării cu pensiiprivate.
Potrivit acesteea s-au făcut recomandări în ceea ce priveşteformarea de fonduri de pensii private, prin contribuţiaobligatorie a angajaţilor cu doar 0,5% din salariul brut. Chiar şiaceste propuneri modeste au întâmpinat rezistenţă din parteasindicatelor şi opoziţiei, acuzând Guvernul că se foloseşte dereforma sistemului de pensii pentru a opera reduceri de buget.
În Italia, reforma sistemului de pensii, a fost adoptată în anul1998 şi a restricţionat pătrunderea managerilor de fond doar lacei cu o vechime de peste cinci ani în activitate şi care aveau, înacelaşi timp, cel puţin 10 miliarde de dolari în activeadministrate de aceştia. Câştig au obţinut companiile localefoarte mari, fiind puţine subsidiarele celor străine, care să fi avutastfel de performanţe pe plan local. Situaţia Italiei esteasemănătoare cu a celorlalte ţări europene, statisticileprezentând apropiata falimentare a sistemului de pensii.
Reforma sistemului de pensii în Franţa a fost mult întârziată,de teama revoltei populaţiei în cazul reducerii nivelului depensii. Din această cauză, francezii nu au reuşit să implementezemăsuri radicale, ci doar câţiva paşi premergători reformei, caeliminarea pensionării anticipate [10].
O altă cauză a ritmului încetinit al acestei reforme oconstituie caracterul facultativ al contribuţiilor la sistemul privatşi lipsa facilităţilor fiscale acordate contribuabililor. Unfragment din contribuţii nu a urmat traiectoria fondurilor private,creând şi mai multă confuzie şi neîncredere în sistem Lipsacontrolului asupra agenţilor de vânzări a generat numeroasepractici frauduloase. De exemplu, dintre cei 500 000 decontribuabili atraşi de asiguratorul britanic Norwich Union,25% erau decedaţi, studenţi sau şomeri, deci persoane, care nuaveau posibilitatea să se înscrie în cadrul unui fond.
În astfel de situaţie critică se află nu doar Franţa, ci şiGermania şi Italia, ţări care atrag acum marile companii ceadministrează fonduri. Motivul este că, în aceste trei ţări nu s-aimpus încă nici un grup financiar, ca fiind cel mai puternic înadministrarea fondurilor de pensii.
Se consideră că sistemul de pensii propus de Marea Britanieeste cel mai avansat. Sistemul propus pentru viitor presupunecontribuţia voluntară a forţei de muncă, iar taxele deadministrare a fondurilor de numai 1%. Aceste restricţii nu i-auîndepărtat pe administratorii de fonduri. Ei sunt convinşi că pot
decrease, allowing the creation of individual capitalizationaccounts.
The Swedish model include lower operating costs butboosts very little the development of capital markets,especially in the early years of reform. The notional rate ofthe used interest can be much lower than the actual rate ofprofit possible to be obtained in the case of individualcapitalization accounts that are invested in a diverseportfolio.
In Germany until 2002 the pension fund was mostlyformed by the account of the special contributions. Toachieve the full employment stage (45 years) the pensionamount was 70% of the last net salary. In 2001 theSupreme Chamber of the Bundestag approved the law onstate pension reform which essentially opened the door toprivate pension insurance.
According to this one, recommendations were maderegarding the formation of private pension funds throughcompulsory contribution for employees with only 0.5% ofgross salary. Even these modest proposals have metresistance from trade unions and the opposition accusingthe government that it uses pension reform to operatebudget cuts.
In Italy, the pension reform was adopted in 1998 andhas restricted the entry of those fund managers with morethan five years of work experience and had, meanwhile, atleast 10 billion $ in assets managed by them.Earnings obtained large local companies, being fewsubsidiaries of foreign ones which had locally suchperformances. Italy's situation is similar to other Europeancountries, statistics showing the forthcoming bankruptcy ofpension system.
Pension reform in France was much delayed, fearing ariot of the population if reducing the level of pensions.Therefore, the French failed to implement radicalmeasures, only a few steps leading up to the reform, as theelimination of early retirement.
Another reason for the slow pace of this reform is thevoluntary nature of contributions from the private sectorand the lack of tax incentives for taxpayers. An excerptfrom the contributions did not follow the path ofprivate funds, creating more confusion and mistrust in thesystem. The lack of control over the sales generatednumerous fraudulent practices. For example, out ofthe 500,000 taxpayers attracted by the British insurerNorwich Union, 25% were deceased, students orunemployed, so people who did not have the opportunity toenroll in a fond.
In such a critical situation is not only just France, butalso Germany and Italy, countries that attract largecompanies now that manage funds. The reason is that inthese three countries any financial group has not yetachieved as being the most powerful in the administrationof pension funds.
It is considered that the pension system proposed by theUK is the most advanced. The proposed system for thefuture involves the voluntary contribution of labor and fundmanagement fees of only 1%. These restrictions havenot removed the fund managers. They are convinced thatthey can stay on the market if they reduce their costs
Revistă teoretico-științifică / Theoretical and scientifical journal38
Nr. 3 / 2013
rezista pe această piaţă, dacă îşi reduc costurile cu 80-90%.Strategia acestora va fi astfel obţinerea unor volume decontribuţii cât mai mari, ceea ce va duce la consolidarea pieţei,doar 6-7 manageri de fonduri deţinând controlul absolut. MareaBritanie are cea mai amplă piaţă a pensiilor din Europa, dar careînsumând 1200 miliarde de dolari, cedează celei din StateleUnite, care totalizează 4200 miliarde de dolari.
Creşteri notabile în ceea ce priveşte reformarea sistemelorde pensii au fost înregistrate de Olanda şi Elveţia, iar Suedia şiIrlanda sunt îndestulător de dezvoltate pentru aplicarea unuisistem privat de pensii. De partea cealaltă, în Italia şi Spania,lucrurile se dezvoltă mai lent, deşii reforma a fost începută cuceva timp în urmă. Franţa şi Germania, două dintre ţărileeuropene cu cuantumul cel mai ridicat de contribuţii, au, însă,dificultăţi în a convinge sindicatele şi grupurile locale deinfluenţă de necesitatea reformei. Motivul ar consta înpresupusa scădere a nivelului pensiilor, ce ar urma în rezultatulreformei, pensii, care la ora actuală sunt considerate a fi destulde generoase.
Elveţia, Olanda şi Danemarca, au sisteme ocupaţionale maicuprinzătoare, acoperind peste 80% din toţi lucrătorii,comparativ cu Statele Unite şi Marea Britanie, unde acoperireaeste sub 50%. Totuşi, permiţând diferite tipuri de scheme depensii personale, în ultimele două ţări, acoperirea efectivă estemai mare şi în creştere.
În contrast, numeroasele ţări din Europa continentală,asimilând şi Austria, precum şi ţările sud europene, au, fiescheme de pensii nedezvoltate, fie scheme de pensiiocupaţionale, necapitalizate. Franţa, Italia, Spania, Portugalia,Grecia şi alte ţări, care se confruntă cu probleme financiare,opun rezistenţă puternică reformării sistemice a sistemului depensii.
Concluzii. În concluzie constatăm că în ţările lumiis-aucreat diferenţe semnificative în elaborarea şi aplicarea sistemuluieficient de pensii, cauzate de particularităţile economice şisociale a fiecărui stat. Incontestabil, la reformarea sistemului depensii în orice ţară, se cere ca particularităţile respective să fieonorate. Însă, reformarea sistemului de pensii se impune a firealizată, pornind de la una din următoarele concepţii [11]:
1. Concepţia liberală a protecţiei sociale – constă înacordarea încrederii forţelor pieţei libere, în care fiecare trebuiesă fie capabil să-şi asigure o anumită protecţie în concordanţă cudemnitatea umană. Familia este cea, care trebuie să asiguresolidaritatea între generaţii. Asigurările private permit fiecăruiasă-şi acopere riscurile după consideraţii proprii, asumându-şiplata costurilor implicate. Asistenţa de caritate este de origineprivată (biserica, particulari) şi asigură ajutare pentru cei maisăraci.
2. Concepţia mutualistă – se sprijină pe principiul asocierii,astfel, că persoanele se organizează în asociaţii de ajutorreciproc, la care cotizează toţi pentru a acoperi riscurilefiecăruia.
3. Concepţia socializată (etatistă) – presupune implicareastatului în asigurarea protecţiei sociale, potrivit căreia toatepersoanele din colectivitate au dreptul la o anumită protecţiesocială, independent de contribuţia lor la finanţare. Aceastăconcepţie este cea mai răspândită în Europa, unde mareamajoritate a riscurilor sociale se acoperă de către autoritateapublică, deşi în toate ţările există şi asociaţii de ajutor reciproc siorganizaţii de binefacere.
by 80-90%. Their strategy will thus be to obtainbigger volume contribution, which will strengthen themarket, just 6-7 fund managers holding absolute control.Britain has the largest pension market in Europe buttotaling 1.200 billion, surrenders the U.S. totaling 4.200billion.
Notable increases in the pension reforms were recordedby the Netherlands and Switzerland, Sweden and Irelandare sufficiently developed to apply the private pensionsystem. On the other hand, in Italy and Spain, things growmore slowly, although the reform was started some timeago. France and Germany, two of the European countrieswith the highest amount of contributions, however, havedifficulty in persuading trade unions and local groups ofinfluence about the need for reform. The reason lies in thealleged decline in pension levels that would result in theoutcome of the reform, pensions which at present times areconsidered to be quite generous.
Switzerland, the Netherlands and Denmark, haveoccupational schemes more comprehensive, covering over80% of all workers compared to the United States andGreat Britain, where the coverage is below 50%. However,allowing for different types of personal pension schemes,in these last two countries, effective coverage is larger andgrowing.
In contrast, the numerous countries in continentalEurope, assimilating Austria as well as the southernEuropean countries, have either undeveloped pensionschemes or occupational pension schemes, non capitalized.France, Italy, Spain, Portugal, Greece and other countriesfacing financial problems resist strong to the systemicreform of the pension system.
Conclusions. In conclusion we ascertain that in theworld countries have been created significant differences inthe development and implementation of effective pensionsystem due to the economic and social development ofeach state. Undoubtedly, to the pension system reform inany country, it is required that those feature to be honored.However, pension reform is required to be made from oneof the following concepts [11]:
1. Liberal conception of social protection - which is toprovide trust to the free market forces, where each must beable to provide some protection in accordance with humandignity. The family is the one that must insure solidaritybetween generations. Private insurance allow everyone tocover the risks after its own considerations, assuming thepayment of the involved costs. Charity assistance is of aprivate origin (church, private owners) and provideshelping the poorest;
2. Mutualistic conception – is based on the principle ofassociation, so that people are organized in mutualassociations, to which all pay to cover everyone’s risks.
3. Socialized conception (statist) – requires state’sinvolvement in social protection, according to which allpersons are entitled to specific community welfare,regardless of their contribution to the funding. Thisconception is most prevalent in Europe, where the majorityof social risks are covered by the public authority, althoughin all countries there are mutual associations and charityorganizations.

ECONOMIE ŞI SOCIOLOGIE / ECONOMY AND SOCIOLOGY 39
Nr. 3 / 2013
O altă trăsătură comună a tuturor programelor de reformarea sistemelor de pensii este reprezentată de creşterea substanţialăa rolului componentelor de pensii capitalizate, administrateprivat şi reducerea rolului componentei publice, care, înmajoritatea cazurilor, se bazează pe redistribuire şi protejareaîmpotriva sărăciei a persoanelor în vârstă [12].
Considerăm oportun ca, atât România, cât şi RepublicaMoldova să promoveze reforme sistemice, care ar include ocomponentă publică, necapitalizată, plătind o pensie de bază şi ocomponentă capitalizată, bazată pe conturi private şi contribuţiilegiferate.
Componenta publică se recomandă a fi formată din resurselepublice centrale şi locale. Componenta capitalizată bazată pefondurile de pensii private să se formeze prin contribuţiapersoanelor fizice, aportul firmelor, în care activează acestepersoane şi subvenţiile din partea statului, care se adaugă laconturile individuale ale lucrătorilor.
Fondurile de pensii private să fie deductibile din impozite şiconturile individuale să fie administrate de grupuri financiareşi/sau societăţi specializate.
Another common feature of all the pension systemreform programs is the substantial increase in the role ofcapitalized pension components, privately managed, andthe reduce of the public component role, which in mostcases are based on redistribution and protection againstpoverty of old aged persons [12].
We consider it appropriately that both Romania andMoldova should promote systemic reforms that wouldinclude a public component, non capitalized, paying a basicpension and a capitalized component based on privateaccounts and legislated contributions.
The public component is recommended to be composedof central and local resources. The capitalized componentis based on private pension funds should be formed by theindividuals’ contribution, the share of the companies wherethese persons work and the subsidies from the state, whichare added to workers' individual accounts.
Private pension funds should be tax deductible andindividual accounts should be managed by financial groupsand/or specialized companies.
Referinţe bibliografice / References:1. NEGRU, T. Practica asigurărilor comerciale. București: Ed. WoltersKluwer, 2010. 336 p. ISBN 978-606-8201-28-3.2. CONSTANTINESCU, D.A. Tratat de asigurări. Vol. I. București: Ed. Economică, 2004. 544 p. ISBN 973-709-013-6.3. MOȘTEANU, T. Politici fiscale și bugetare pentru reformarea economiei și relansarea creșterii economice.
București: Ed. Economică, 2003, 208 p. ISBN 9735908190.4. NEGRU, T. Economia asigurărilor: metode, tehnici, soluţii. București: Ed. WoltersKluwer, 2010. 312 p. ISBN 978-
606-8201-14-6.5. ACHIM, M.L. Asigurările de bunuri și persoane în economia cunoașterii. București: Ed. Economică, 2008. 232 p.
ISBN 978-973-709-371-4.6. CONSTANTINESCU, D.A. Tratat de asigurări. Vol. II. București: Ed. Economică, 2004. 552 p. ISBN 973-709-014-4.7. POLITIS, A. Managementul agenţiei de asigurări: ghid practic. Ediţie revizuită. București: Ed. C.H. Beck, 2011.8. ENE, S., ENACHE, S. Pensii, prestaţii sociale și asigurări: teorie și practică. București: Ed. Monitorul Oficial, 2012.
304 p. ISBN 973-567-793-0.9. DOBROTĂ, N. Liberalizarea schimburilor economice externe. Avantaje și riscuri pentru România. București: Ed.
Economică, 2003. 388 p. ISBN 973-590-785-2.10. ANGELESCU, C., STĂNESCU, I. Politica de creștere economică. Ediţia a-II-a. București: Ed. Economică, 2011.11. MOARCĂȘ COSTEA, C.-A. Istrumente de coordonare a sistemelor de securitate social. București: Ed. C.H. Bech,
2011. 205 p. ISBN 978-973-115-887-7.12. BRAN, F., IOAN, I., MANEA, Gh. Globalizarea: manifestări și reacţii. București: Ed. Economică, 2012. ISBN 978-
973-709-594-7.
Recomandat spre publicare: 20.05.2013

Revistă teoretico-științifică / Theoretical and scientifical journal40
Nr. 3 / 2013
STAREA ACTUALĂ ŞI PROBLEMELEDEZVOLTĂRII SECTORULUI AGRO-ALIMENTAR
AL UCRAINEI
CURRENT STATUS AND DEVELOPMENTPROBLEMS OF UKRAINIAN AGRO-FOOD
SECTOR
Natalia DOBRYANSKAIA, dr., prof. univ., catedraTeorie economică şi economia afacerilor
Vasilii POPOVICI, dr., prof. univ., decanul facultăţiiEconomie, Universitatea Agară de Stat din Odesa
Natalia DOBRYANSKAIA, PhD, Associate Professor,chair of economic theory and business economy
Vasilii POPOVICI, PhD, Associate Professor, dean ofthe Economic faculty, Odessa Agrarian State University
În acest articol este relatată starea actuală șiproblemele din sectorul agro-alimentar. De asemenea, suntanalizate dinamica producţiei şi consumul de lapte înUcraina. Totodată, sunt stabilite motivele de bază alenivelul scăzut al consumului de lapte.
Cuvinte cheie: sectorul agro-alimentar, produselactate, producerea și consumul de lapte, eficienţă.
There is observed the current state and problems of theagro-food sector. The dynamics of production andconsumption of milk in Ukraine are analyzed. The basicreasons for the low level of consumption of milk areestablished.
Keywords: agro-food sector, dairy farming, productionand consumption of milk, efficiency.
JEL Classification: Q10, Q12Introduction. Stock rising is the most important sector
of the livestock.Products of this industry are perishable; the delayed
sales of milk are associated with large losses. And perhapsthe reason is that milk production is unprofitable.
The reasons for this situation in the livestock sector areseveral. First, during the reform years the growth ofelectricity price, agricultural machinery, lubricants,technological equipment for livestock farms, feed and feedadditives significantly outpaced the growth in prices foragricultural products. Secondly, processing and tradingcompanies established a monopoly on the purchase price,while the selling price did not provide compensation for thecost of production. Thirdly, a sharp reduction in statesupport and increased cost of credit resources have resultedin the destruction of the productive capacity of livestock,the transition to the primitive technologies with rising costsof labor and production costs. Fourth, the lack of fundsfrom farms drastically reduced the realization of breedingstock and the impact of breeding enterprises on commodityproduction. As a result, many households do not perform aqualitative repair of the herds, and the high-value geneticpotential of livestock is sold for meat. Fifth, uncontrolledfood imports had a negative impact not only on thedomestic producers, but also on the market saturation,determining the price situation on it. The reason for that isalso an imperfect national customs policy.
Analysis of the research. Problems of development ofcompetitive agro-food sector are present in the works ofsuch Ukrainian scientists as M.I. Malik, P.T. Sabluk, I.F.Miller, V.I. Mesel - Veselyak, M.V. Zosi - Kior and otherscientists. But there are many unresolved issues of theindustry development and its re-creation.
The purpose of this paper is to identify ways toincrease the scope of agro-food production in Ukraine ingeneral and the development of measures to support thedevelopment of the industry.
The results of research. Milk production in Ukraine isconstantly increasing, but consumption remains one of thelowest in Europe.
Despite the lack of benefits and reduction of livestock,milk production in Ukraine is growing. But the Ukrainiansconsume it a little - one and a half times less than, forexample, the Russians. There is an issue in the interferenceof high prices for dairy products and stereotypes about theirlow quality.
In 2012, production of all kinds of milk has increasedin the Ukraine. Thus, in January - April 2012 the volume ofproduction increased by 2.8% year -to-year. Tetra Pakexperts claim that milk production increases due to thedecline in the share of holdings of the private sector andincreasing the share of farms, where the efficiency ishigher.
With the growth of milk production in Ukraine thenumber of livestock continues to decline (for January-April 2012 by 1.2%, to 2,624 thousands). Milk prices thatare set for private households may be significantly lowerthan for agricultural enterprises. In addition, theprofitability of milk production declined after the abolitionof subsidies in 2011.
Growth of milk production in the country was mainlyprovided by agricultural enterprises: in January - April, anincrease in them was about 14.7%, whereas in thehouseholds there was a decline of 0.8%.
Investors are investing today in large scale productionfacilities with the expectation that a cow will get not 3, butalready 5.5-6 tons of milk per year. In Ukraine there isfinally an understanding that there should be received theoutput of qualitative products with which you can go notonly to domestic but also on international markets.
Profitability of milk production in 2011 declined froman average of 27% to 17%. But the collapse of the purchaseprices this year forces manufacturers to operate at a loss.There can be said a lot about the attractiveness of thebusiness if the purchase price of milk was 4.5-5 UAH perliter (2012 - 3.1-2.6 UAH per liter).
Prices of dairy companies in September 2012 amountedto 5.51 UAH/kg, or 3.0% more than in September 2011, ascan be seen from Figure 1.

ECONOMIE ŞI SOCIOLOGIE / ECONOMY AND SOCIOLOGY 41
Nr. 3 / 2013
2 , 8 0
3 , 1 93 , 3 4 3 , 4 1 3 , 4 8 3 , 5 7
3 , 3 23 , 0 9
2 , 7 62 , 5 7 2 , 4 9
2 , 3 52 , 5 5 2 , 4 9 2 , 5 1
5 , 1 3 5 , 2 5 5 , 3 5 5 , 4 3 5 , 4 8 5 , 5 3 5 , 6 5 5 , 6 4 5 , 6 3
7 ,2 4 7 ,2 5 7 ,2 2 7 ,1 7 7 ,1 4 7 ,0 1 6 ,9 46 ,7 8 6 ,6 9 6 ,6 8 6 ,6 6 6 ,6 3
5 , 5 95 , 5 6 5 , 5 2 5 , 4 9 5 , 4 9 5 , 5 1
6 ,6 4 *
2 ,0и ю л .1 1 ав г .1 1 се н .1 1 о к т .1 1 н о я .1 1 д ек .1 1 я н в .1 2 ф ев .1 2 м ар .1 2 ап р .1 2 м ай .1 2 и ю н .1 2 и ю л .1 2 ав г .1 2 се н .1 2 о к т .1 2
Ц е н а р е а л и за ц и и м о л о ка с .- х. п р е д п р и я т и я м и (б е з Н Д С ), гр н /кгЦ е н а п р о и зв о д и т е л е й (б е з Н Д С ), гр н /кгЦ е н а м о л о ка н а п р о д укт о в ы х р ы н ка х, гр н /л
* situation on 30.10.2012Fig 1. Dynamics of prices for milk in Ukraine
The average selling price of milk by agriculturalenterprises in September 2012 was 2.51 UAH/kg (excludingVAT), which is 24.9% less than in the corresponding
period of the last year.Compared to August of this year, the price of the milk
by agricultural enterprises in September rose by 0.8%.
216,4 208,0 187,0 172,0 163,8 177,6 212,5 218,4 215,6
927,1
826,7743,0
608,2
928,2
834,4
1199,1 1135,11013,7
915,0
772,0696,2
591,2 616,0
856,6
989,5
1233,2 1230,9 1219,2 1161,81050,0
178,5 175,3245,0 247,9 247,5 233,6
982,7
518,6
412,7 440,7 644,1
771,1
988,2 983,0 971,7
июл.11 авг.11 сен.11 окт.11 ноя.11 дек.11 янв.12 фев.12 мар.12 апр.12 май.12 июн.12 июл.12 авг.12 сен.12
Производство молока с.-х. предприятиями, тис. тПроизводство молока хозяйствами населения, тыс. тПроизводство молока всеми категориями хозяйств, тыс т
Fig. 2. Dynamics of milk production in Ukraine
As Figure 2 shows, in January - September 2012, allcategories of farms produced 8,948.4 thousand tons ofmilk, which is by 2.6% more than in January - September2012.
Milk production by agricultural enterprises in January -September 2012 amounted to 1974.3 thousand tons, whichis by 13.4% more than in the corresponding period of 2012
In terms of consumption of dairy products, Ukraine ison one of the lowest places among European countries. Onaverage, one Ukrainian consumes about 34 liters of milkper year (not counting other dairy products), which isalmost four times less than in Finland, and 1.5 times lessthan in Russian Federation.
Ukrainians consume little milk and dairy products. Atpresent, the level of consumption of these products inUkraine is lower than is recommended by about 30%.
According to international recommendations, an adultshould consume about 700 ml of milk and milk productsper day.
In subsequent years, the trend even intensifies. Duringthe years 2011-2014 the consumption will increase from275 million liters to 300.2 million liters, in annual terms -by 2.9%, forecasted the experts from Tetra Pak. The maindriver is the growing demand by people in developingcountries with low incomes (2-8 USD per day). Anincreasing demand is expected in Asia, Africa and LatinAmerica - here the consumption will increase from 70billion liters in 2011 to almost 80 billion liters in 2014.Mostly (+20.8%) will increase the consumption of dairyproducts in the Asia- Pacific region. In Eastern Europe, themarket will grow by only 0.6 % , and in Western Europe -will stagnate (-0.3%).
Preţul de realizare a laptelui a întreprinderilor, fără TVA, grivne/kgPreţul producătorilor, fără TVA, grivne/kgPreţul pentru lapte pe pieţele alimentare, grivne/kg
Producerea laptelui la întreprinderi agricole, mii toneProducerea laptelui la întreprinderi gospodăreşti, mii toneProducerea laptelui la toate tipurile de întreprinderi, mii tone

Revistă teoretico-științifică / Theoretical and scientifical journal42
Nr. 3 / 2013
As for the most popular dairy products, the followingcategories most actively grew in 2008-2011: flavored milk(+4.5% per year), milk for children and adolescents(+9.5%) and milk drinks (+12,5%). In 2011-2014 there isexpected to be continued the strong growth in thesesegments, but the most powerful figures may show yoghurt(increase by 4.7% per year) and low-fat cream (an increaseof 4.5%).
The Ministry of Agrarian Policy and Food of Ukrainepredicts an increase in milk production this year by 3-4% -up to 11,5-11,7 million tons.
In all categories of farms, the total milk productionincreased in 19 regions, and significantly - in the farms ofPoltava (11.7%), Kharkiv (9.7%), Cherkasy (by 7.1%),Rivne ( 6%) and Ternopil (5.6%) regions.
The average milk yield per cow for the first quarter inagrarian enterprises is about 1050 kg, which is 16% morethan in the corresponding period of 2011. So, high milkproduction in the I quarter of households were in Kiev(1372 kg), Cherkassy (1284 kg), Poltava (1208 kg),Kherson (1,153 kg), Kharkov (1149 kg), and Vinnitsaregions (1,124 kg) and in the Crimea (1113 kg).
A segment of milk and dairy products in Ukraineoccupies one third of the total food market in the country.Such significant volumes make the sector underobservation by both the food industry operators, and fromthe government agencies that are taking measures toregulate the market.
According to a survey conducted by the companyResearch & Branding Group in April 2012 (collection ofinformation was made by means of personal interviews in24 regions of Ukraine and Crimea by a quota samplerepresentative for the adult population by place ofresidence, gender and age), 75% of Ukrainians buy dairyproducts at least once a month or more. According to thestudy, in most of cases, Ukrainians buy milk 1 timebiweekly (30.8%) or 2-3 times per week (29.3%). Sourcream and yogurt - once a week (33.1% and 23.8%,respectively), granular cheese, cottage cheese every fifthperson buys 1-2 times a month. At the same time,fermented baked milk, yogurt, cheese curds and glazed arenot included in the list of the first consumer products - theyare bought much less by the Ukrainians. Thus most of theUkrainians - more than half of the population - in the lastmonth did not buy curds, coated cheese (68%), yogurt(56.8%) and fermented baked milk (55.7%). Among thefood products of almost every second Ukrainian in the lastmonth there were not present cheese and cottage cheese,and a third of the citizens did not use a significant healthmilk product like kefir.
The competitive environment is so dense that the levelof consumption of certain TM does not exceed 8.8% (basedon survey of research company Research & BrandingGroup). TM leaders whose products are bought most oftenare: TM "President", "Dobrynia", "Happy Milkman","Dobryana", "Buttermilk", "Zlagoda", "Galicina".
In 1998, Ukraine introduced the program of state supportfor milk producers in the form of subsidies at the expense ofthe VAT refund from the sale of finished dairy products.Farms receive it on a monthly basis, and farmers - twice a
month through the milk processing enterprises. In 2010 itwas decided to change this mechanism - after the entry intoforce of the new Tax Code, farmers began to list the VAT inthe special fund of the state budget. And in 2011 thecompensation allocations for the milk were no longeraccorded (grants totaled 970 mln. UAH the year before).
In 2012, the Cabinet of Ministers once again addressesthe problems in the milk market. In March, Prime MinisterNikolay Azarov charged the Ministry of Agrarian Policyand Food to develop a mechanism of direct mail subsidiesto milk producers, as well as reduce the cost of the feedprogram. In April, the Minister of Agrarian Policy NikolayPrysyazhnyuk presented a program to increase the numberof cows, according to which the government has allocated aspecial fund of the state budget of 1.08 billion USD forsubsidies for farmers that grow cattle. It is expected thatthis will increase the number of cows which is grown in theprivate sector by 30%, to 2.65 million cows.
Stimulating the growth of cows, the government doesnot stimulate an increase in milk production in Ukraine, theparticipants of the market are assured of this. Providingsubsidies for the rearing of cattle may lead to the fact thatin the milk market will be a situation, which at one timewas observed in the sugar market. In one year, the statebudget allocates funds to plant beets, and the next year dueto the overproduction of sugar the state had to buy thissugar in state reserves, because due to excess production inthe market and falling prices sugar mills were not in aposition to pay off with the landowners.
Stimulating the growth of cows, the government doesnot stimulate an increase in milk production in Ukraine.
The main task of the government should be to promotethe consumption of milk and dairy products in the country.For example, today, France and the Scandinavian countriesconsume over 590 kg of milk per person per year, theBaltic countries - more than 300 kg, Russia - about 250 kg.In Ukraine, the figure stands at 200 kg. In many EUcountries there are made advertising campaigns to promotedairy products.
An increase in exports would be a significant boost tothe market. Milk is produced in Ukraine in sufficientvolume. In particular, Ukraine cannot now deliver dairyproducts in the EU, as it would need to pass thecertification of the whole cycle of production: from thefield on which there are grown food for the cows, to thefinished products - milk and milk products, which areproduced at dairy companies.
For the development of dairy cattle breeding in Ukraine,the state should at least partially offset the costs ofmanufacturers. Dairy farming requires a high level of capitalexpenditures. According to our estimates, the capital costs perone cow in Ukraine are 10-12 thousand USD.
Without waiting for government support, milkprocessing enterprises have started to invest in production.Currently, manufacturers and producers of milk have theirown places, and this has pushed to create a project like"Milkiland agro", bringing together 16 cooperatives with17 thousand members, who in 2011 produced 24 tons ofmilk. At Danone, for example, there is a program ofsupplier development, which provides partial funding for

ECONOMIE ŞI SOCIOLOGIE / ECONOMY AND SOCIOLOGY 43
Nr. 3 / 2013
the acquisition of either animal or plant refrigerationequipment. Due to this program, it is planned to increasethe supply of milk from these farms by 25% over the nextthree years.
The implementation of the genetic potential of mostspecies in our country is constrained by the poor forage.Consumption of all types of feed per conventional head ofcattle is 3-4 times less than that is required under theintensive dairy farming run. Despite the decline of numberof cows, food supply does not improve, but rather getsworse.
An important element in the system of supportproducing enterprises, processing and marketing of milkshould be the promotion and regulation of procurement,wholesale and retail prices.
Each agricultural enterprise can successfully implementa plan for the production of products, if it is to have asufficient number of productive animals.
The increase in the productivity of the animals is thebase of the growth of production in terms of intensification.
The main source of replenishment of the herd is toobtain offspring from breeding stock. Unaccomplished plan
may occur due to the barrenness of cows, dead bornoffspring.
An important source of recruitment and reproduction ofthe herd is the purchase of breeding animals.
The main indicator of the intensification of milkproduction is the animals’ productivity. Increaseproductivity at will allow at low costs to increase theprofitability of production.
Conclusions. One of the most important ways toimprove the organization of production of cattle breeding isto justify in the most rational way in terms of a particularagricultural enterprise the means to grow animals and themanagement of the sector. They have a decisive influenceon the formation of a system of machines for themechanization of work processes and organization of theseprocesses, they determine the choice of form oforganization of labor on farms and complexes and theireconomic performances.
Therefore, the combination of the aforementionedorganizational - economic factors with the state support ofagricultural development will enable it to produce high-quality products and competitive dairy cattle.
References1. Продовольча і сільськогосподарська організація ООН (FAO) [accesat 5 mai 2013]. Disponibil: http:
www.fao.org2. ПРИСЯЖНЮК, М.В., ЗУБЕЦЬ, М.В. та ін. Аграрний сектор економіки України (стан і перспективи
розвитку). Київ: ННЦ ІАЕ, 2011. 1008 с.
Recomandat spre publicare: 15.07.2013
Revistă teoretico-științifică / Theoretical and scientifical journal44
Nr. 3 / 2013
ROLUL INFRASTRUCTURII SOCIALE ÎNFORMAREA ŞI DEZVOLTAREA POTENŢIALULUI
MUNCII RURALE ÎN UCRAINA
THE ROLE OF SOCIAL INFRASTRUCTUREIN THE FORMATION AND DEVELOPMENT
OF RURAL UKRAINE LABOUR POTENTIAL
Roman CHORNYI, dr., prof. univ.,Universitatea Naţională de Economie din Ternopil,
Ucraina
Roman CHORNYI, PhD, Associate Professor,Ternopil National Economic University,
Ucraina
Articolul analizează starea de dezvoltare ainfrastructurii şi a reţelei sociale, totodată subliniază şirolul acesteia în formarea şi dezvoltarea potenţialuluiforţei de muncă din mediul rural din Ucraina. Autorulpropune să fie introduse inovaţii în acest proces deacumulare de investiţii fixe, cu posibilitatea de aîmbunătăţi şi a spori capacitatea reţelelor infrastructuriisociale, care, la rândul lor, vor stimula dezvoltareapotenţialului forţei de muncă din mediul rural.
The article analyzes the state of social infrastructuredevelopment and network and outlines their role in theformation and development of labor potential of ruralUkraine. It is suggested to introduce the innovations andconnected with this the fixed investment accretion process,giving the opportunity to improve and increase the capacityof social infrastructure networks, which in turn stimulatethe development of rural labor potential.
Cuvinte cheie: infrastructură socială, factor,potenţialul forţei de muncă, dezvoltare.
Key words: social infrastructure, factor, labourpotential, development.
JEL Classification: J21, J 29, J81, R10
Introducere. Actualitatea articolului este dificil deevaluat, deoarece căutarea modalităţilor pentru aîmbunătăţi formarea şi dezvoltarea forţei de muncă înzonele rurale, este permanent pe ordinea de zi a societăţii.Una dintre aceste metode este cea de dezvoltare ainfrastructurii sociale în zonele rurale, a căror rol în acestproces este în continuă creştere.
Introduction. The article topicality is difficult totransvalue, because the search of ways to improve theformation and development of the rural areas labourpotential is permanently on the agenda of society. One ofthese ways is the development of social infrastructure inrural areas, whose role in this process is constantlyincreasing.
Cele mai recente analize ale cercetărilor. Un numărde oameni de ştiinţă din ţară subliniază că infrastructurasocială, creşterea impactului asupra eficienţei producţiei prinintermediul forţei productive dominante a societăţii, adicăindividuale, este promovată dezvoltarea potenţialului forţei demuncă şi îmbunătăţirea productivităţii în ansamblu aangajaţilor individuali în special. Astfel, Salivonchyk A.M.subliniază că capacitatea oamenilor de a lucra sporeşte princreşterea nivelului de educaţie, cultură şi nivelul tehnic alangajaţilor, reducerea costurilor de timp, reducereamorbidităţii prin crearea condiţiilor sociale şi cele ale vieţiifavorabile [6].
Alţi oameni de știinţă, de exemplu, Şevciuk L.T.subliniază faptul, că infrastructura socială, prin creareacondiţiilor pentru îmbunătăţirea nivelului de educaţie,calificare, cultură, viaţă, petrecerea timpului liber, acţioneazăca un factor determinant al capacităţii de muncă prin formareade abilităţi fizice şi mentale la locul de muncă [7]. Cu toateacestea, schimbarea tranzitorie a situaţiei sociale şi economicedin sate necesită un studiu aprofundat al problemei descrise.
The latest researches analysis. A number of domesticscientists emphasize that the social infrastructure,increasing the impact on production efficiency throughthe society dominant productive force i.e. individual,it promotes the labour potential development andimproves overall productivity of the individual employeein particular. Thus, Salivonchyk A.M. emphasizes thatthe ability of people to work increase through theraising the educational, cultural and technical level ofemployee, reducing time costs, reducing morbiditythrough the creation of favourable social and livingconditions [6].
Other scientists, for instance Shevchuk L.T. stress thatsocial infrastructure, by creating conditions for improvingthe level of education, qualification, culture, life,leisure, acts as determinant of labor capacity through theformation of physical and mental abilities to work [7].However, the transient change in social and economicsituation in the village requires profound study of theoutlined problem.
Scopul articolului este de a arăta rolul infrastructuriisociale moderne în formarea şi dezvoltarea potenţialului demuncă în zonele rurale în societatea ucraineană de astăzi.
The aim of the article is to show the role of themodern social infrastructure in formation and developmentof rural areas labour potential in today's Ukrainian society.
Materialul de bază. Recent, starea infrastructuriisociale în zonele rurale s-a înrăutăţit: nivelul scăzut dedezvoltare, care nu poate susţine capacitatea reţelei şcolare,facilităţile reţelei de grădiniţe, centre medicale sunt reduse,şi altele.
Deşi pe lângă infrastructura de locuinţe şi cea socialănedezvoltată din zonele rurale, starea critică a şcolilorsecundare şi lipsa şcolilor profesionale din mediul rural,
The basic material. Recently, the state of socialinfrastructure in rural areas became worse; the low level ofdevelopment which does not hold up i.e. the schoolnetwork capacity, the kindergarten network facilities,medical centers and etc. are reduced.
Although beside undeveloped social and housinginfrastructure in rural areas, the critical state of secondaryschools and the lack of rural vocational school, rather
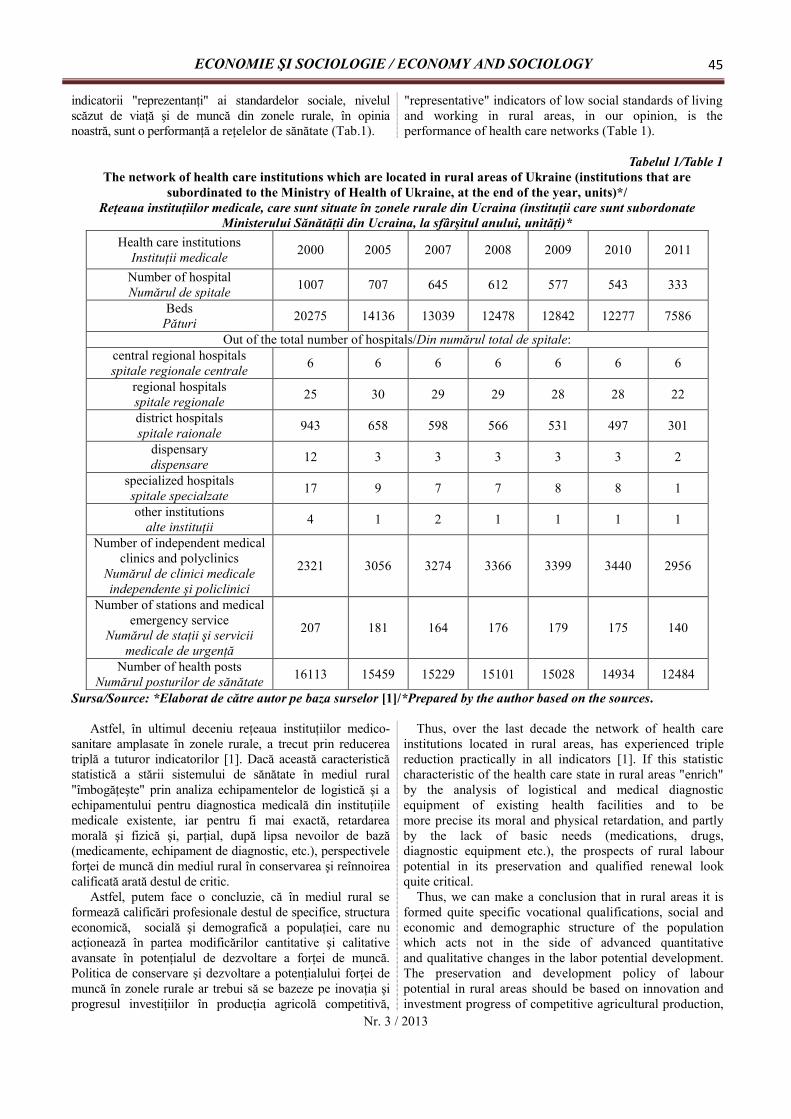
ECONOMIE ŞI SOCIOLOGIE / ECONOMY AND SOCIOLOGY 45
Nr. 3 / 2013
indicatorii "reprezentanţi" ai standardelor sociale, nivelulscăzut de viaţă şi de muncă din zonele rurale, în opinianoastră, sunt o performanţă a reţelelor de sănătate (Tab.1).
"representative" indicators of low social standards of livingand working in rural areas, in our opinion, is theperformance of health care networks (Table 1).
Tabelul 1/Table 1The network of health care institutions which are located in rural areas of Ukraine (institutions that are
subordinated to the Ministry of Health of Ukraine, at the end of the year, units)*/Reţeaua instituţiilor medicale, care sunt situate în zonele rurale din Ucraina (instituţii care sunt subordonate
Ministerului Sănătăţii din Ucraina, la sfârşitul anului, unităţi)*Health care institutions
Instituţii medicale 2000 2005 2007 2008 2009 2010 2011
Number of hospitalNumărul de spitale 1007 707 645 612 577 543 333
BedsPături 20275 14136 13039 12478 12842 12277 7586
Out of the total number of hospitals/Din numărul total de spitale:central regional hospitalsspitale regionale centrale 6 6 6 6 6 6 6
regional hospitalsspitale regionale 25 30 29 29 28 28 22
district hospitalsspitale raionale 943 658 598 566 531 497 301
dispensarydispensare 12 3 3 3 3 3 2
specialized hospitalsspitale specialzate 17 9 7 7 8 8 1
other institutionsalte instituţii 4 1 2 1 1 1 1
Number of independent medicalclinics and polyclinics
Numărul de clinici medicaleindependente şi policlinici
2321 3056 3274 3366 3399 3440 2956
Number of stations and medicalemergency service
Numărul de staţii şi serviciimedicale de urgenţă
207 181 164 176 179 175 140
Number of health postsNumărul posturilor de sănătate 16113 15459 15229 15101 15028 14934 12484
Sursa/Source: *Elaborat de către autor pe baza surselor [1]/*Prepared by the author based on the sources.
Astfel, în ultimul deceniu reţeaua instituţiilor medico-sanitare amplasate în zonele rurale, a trecut prin reducereatriplă a tuturor indicatorilor [1]. Dacă această caracteristicăstatistică a stării sistemului de sănătate în mediul rural"îmbogăţeşte" prin analiza echipamentelor de logistică şi aechipamentului pentru diagnostica medicală din instituţiilemedicale existente, iar pentru fi mai exactă, retardareamorală şi fizică şi, parţial, după lipsa nevoilor de bază(medicamente, echipament de diagnostic, etc.), perspectiveleforţei de muncă din mediul rural în conservarea şi reînnoireacalificată arată destul de critic.
Astfel, putem face o concluzie, că în mediul rural seformează calificări profesionale destul de specifice, structuraeconomică, socială şi demografică a populaţiei, care nuacţionează în partea modificărilor cantitative şi calitativeavansate în potenţialul de dezvoltare a forţei de muncă.Politica de conservare şi dezvoltare a potenţialului forţei demuncă în zonele rurale ar trebui să se bazeze pe inovaţia şiprogresul investiţiilor în producţia agricolă competitivă,
Thus, over the last decade the network of health careinstitutions located in rural areas, has experienced triplereduction practically in all indicators [1]. If this statisticcharacteristic of the health care state in rural areas "enrich"by the analysis of logistical and medical diagnosticequipment of existing health facilities and to bemore precise its moral and physical retardation, and partlyby the lack of basic needs (medications, drugs,diagnostic equipment etc.), the prospects of rural labourpotential in its preservation and qualified renewal lookquite critical.
Thus, we can make a conclusion that in rural areas it isformed quite specific vocational qualifications, social andeconomic and demographic structure of the populationwhich acts not in the side of advanced quantitativeand qualitative changes in the labor potential development.The preservation and development policy of labourpotential in rural areas should be based on innovation andinvestment progress of competitive agricultural production,
Revistă teoretico-științifică / Theoretical and scientifical journal46
Nr. 3 / 2013
crescând astfel calitatea vieţii locuitorilor din mediul rural,crescând veniturile din muncă şi bunăstarea socială şieconomică a locuitorilor din mediul rural.
Productivitatea scăzută a muncii agricole este cauzată destarea imperfectă a proceselor de producţie mecanizate, şi, îngeneral, cultura scăzută de inovare în mediul rural. Aceastăcultură inovatoare şi dinamică poate defini vectori dedezvoltare a economiei rurale şi oferi oportunităţi adecvateprocesului de reproducere a potenţialului forţei de muncă înzonele rurale. Lucrul inovator este de a găsi noi abordări înrezolvarea problemelor existente, arăta rezultatul prinintermediul noilor tehnologii, produse, mecanisme deorganizare a procesului de muncă şi este baza pentru sferelede evoluţie a forţei de muncă şi, astfel, afectează în moddirect fluxul, ciclul de reproducere a potenţialului forţei demuncă în zonele rurale. Modelele inovatoare în agricultură artrebui să crească fabricarea produselor agricole şi săinfluenţeze asupra eficienţei proceselor sale [2].
Situaţie de urgenţă în domeniul proprietăţii intelectualepentru agricultură, un sector cheie al forţei de muncă înzonele rurale este caracterizat prin tendinţe de stagnare. Înspecial, numărul de documente create de tehnologie înagricultură, vânătoare şi silvicultură în anul 2011 a scăzut –pentru invenţii – la 6, de model de utilitate – la 7, de designindustrial – 2. În general, cantitatea tehnologiei înaltestabilite în industrie numără doar 0,01% din numărul total detehnologii înalte stabilite în Ucraina [4].
Nivelul de implementare a tehnologiilor avansate îndomeniul agriculturii este scăzut. În anul 2011, au fostutilizate doar 15 tehnologii înalte în agricultură, în timp cecifra corespunzătoare pentru industria minieră şi cea defabricare a fost în total de 7802, electricitate, gaze şi apă aunumărat 464, educaţie - 869 etc. [4].
Datele privind propunerile raţionale arată tendinţelenegative durabile din sfera sectorului de inovare înagricultură. Deci, la fel ca în anul 2011, în termeni deactivităţi economice, în ţară au fost folosite 11595 depropuneri de raţionalizare, sectorul agricol a reprezentat doar13 din acestea, iar în anul 2010, activităţile de afaceriagricole, în general, nu au utilizat sugestiile raţionale.
Cultura inovatoare scăzută, cererea întreprinderiloragricole insolvabile, lipsa unei politici eficienteprotecţioniste a condus la o scădere semnificativă aproducţiei agricole şi ineficienţa sa practică.
De exemplu, dacă în anul 1990 au fost produse 4357.8 detone de carne (greutatea de sacrificare), atunci în anul 2010,volumul a scăzut de două ori şi a fost 2059.0 de tone. Înspecial, carnea de vită şi viţel, timp de 20 de ani, a scăzut demai mult de 4 ori, iar cea de porc de aproape 3 ori.Tendinţele pozitive în domeniul producţiei de produsemajore animale în dinamica din ultimii 20 de ani au fostcaracterizate doar prin producţia de păsări [3, p.121].
În legătură cu statul şi reorganizarea fermelor colectivecare a dus la distrugerea lor efectivă, azi fermele privateoferă mai mult de 80% din producţia naţională de lapte şiaproximativ 45% din cea de carne, în timp ce în anul 1990,71% din carne şi 76% din producţia de lapte era furnizată deferme [3, p. 124].
Prevalenţa în structura bovinelor majore a produselorzootehnice din categoria gospodăriilor nu oferă satisfacţie
increasing the rural residents’ quality of life, risinglabor income and social and economic welfare of ruralresidents.
The low productivity of agricultural labor is caused bythe imperfect state of production processes mechanizationand generally low innovation culture in the countryside.This innovative culture and its dynamics define theeconomic development vectors of rural economy andprovide the adequate opportunities reproduction process oflabour potential in rural areas. The innovative work that isto find new approaches in solving existing problems showsthe result through new technologies, products,organizational mechanisms of labour process and is thebasis for the labor evolution spheres and thus directlyaffects the reproductive cycle flow of labour potential inrural areas. Innovative models in agriculture shouldincrease the agricultural products manufacturing andinfluence on the efficiency of its processes [2].
The urgent situation in the area of intellectual propertyfor agriculture as a key sector of labour in rural areas ischaracterized by stagnation tendencies. In particular, thenumber of the documents created by technology inagriculture, hunting and forestry in 2011 decreased - forinventions - to 6, for utility model - to 7, of industrialdesign - 2. In general, the amount of established hightechnology in the industry counted only 0.01% outof the total number of established high technology inUkraine [4].
The level of advanced technologies implementation inthe field of agriculture is low. In 2011, only 15 hightechnologies in agriculture were used, while thecorresponding figure for the mining and manufacturingindustry was in total 7802, electricity, gas and watercounted 464, education - 869 etc. [4].
The data on the rational suggestions use show the durablenegative trends in the sphere of agriculture innovationsector. So as in 2011, in terms of economic activities, in thecountry 11,595 rationalization proposals has been used, theagricultural sector accounted only 13, and in 2010 theagricultural business activities didn’t use rationalsuggestions at all.
The low innovation culture, demand insolventagricultural enterprises, the lack of an effectiveprotectionist policy led to a significant decline inagricultural production and its practical ineffectiveness.
For example, if in 1990 the meat (slaughter weight)4,357.8 tons was produced but in 2010 the volumedecreased in twice and it was 2,059.0 tons. In particular, thebeef and veal production for 20 years, declined in morethan 4 times, as for pork it was almost 3 times. The positivetrends in the production of major livestock products in thedynamics over the last 20 years have been characterizedonly for the poultry production [3, p.121].
In connection with the state and collective farmsreorganization which led to their actual destruction, today theprivate farms provide more than 80% of national milkproduction and about 45% of meat, while in 1990 71% meatand 76% of milk production were supplied by farms [3, p.124].
The prevalence in the structure of major cattle breedingproducts by households category do not provide full
ECONOMIE ŞI SOCIOLOGIE / ECONOMY AND SOCIOLOGY 47
Nr. 3 / 2013
deplină a stării alimentelor de origine animală, faciliteazămunca în zonele rurale naturalizare şi complică foarte multprocesul de standardizare şi control asupra respectăriicalităţii produselor fabricate şi asupra siguranţei. Mai multdecât atât, marea majoritate a produselor din gospodăriileindividuale este folosită pentru nevoile proprii, care, larândul său, duce nu numai la o reducere a participării activela crearea de resurse alimentare de stat, dar, de asemenea,duce la excepţia gospodăriilor cu contracţie monetară şi,astfel, creşte capacitatea totală a efectului cererii.
Datele statistice privind structura mărfurilor de comerţexterioare asigură că, în anul 2010, au fost exportate animalevii şi produse de origine animală în valoare de 771 400 000de dolari, în timp ce au fost importate 1.242 miliarde dedolari [5, p. 258]. Evident, importurile predominante deanimale, tehnologii şi ingrediente pentru hrană există dinstrăinătate. Cu toate acestea, dezvoltarea şi utilizarea noilortehnologii, avansate în agricultură, crearea liniilor de înaltăperformanţă şi a raselor de vite, expansiunea păşunilor,potrivit experţilor din industrie, va stabiliza şi va creştetreptat producţia de lapte şi carne din ţară [2].
satisfaction of the state in foods of animal origin it facilitatesthe labor in rural areas naturalization and greatly complicatesthe process of standardization and control over compliancewith manufactured product quality and safety. Moreover, thevast majority produced in private households products isused for their own needs, which in turn leads not only to areduction in active participation in creation the state foodresources, but also causes the exception of households withmonetary contraction and thus increase the overall capacity ofeffective demand.
Statistical data on the commodity structure of foreigntrade assure that in 2010 living animals and products ofanimal origin $ 771.4 million were exported, while theywere imported on $ 1242 million [5, p. 258]. Obviously, thepredominant livestock imports of animals, technology andfeed ingredients exist from abroad. However, thedevelopment and use of new, advanced technologies infarming, creating high-performance lines, breeds of cattle,pasture expansion, according to industry experts, willstabilize and gradually increase the production of milk andmeat in the country [2].
Concluzii. Astfel, inovarea şi procesul asociat deacumulare a capitalului fix ar trebui, în opinia noastră, să fieconsiderate foarte importante pentru dezvoltareapotenţialului de muncă în localităţile rurale, la fel şi creştereaprin nivelul tehnic şi tehnologic al managementului, muncaşi capitalul în zonele rurale, productivitatea, profitabilitateasa pentru locuitorii de la sate a crescut şi infrastructura deservicii se dezvoltă astfel, încât, în general, are un impactdirect asupra reproducerii ocupării forţei de muncă în zonelerurale şi a potenţialului de dezvoltare, calificarea şi stareaprofesională şi psiho-emoţională în zonele rurale.
Forţa de muncă scăzută şi parţial lipsa potenţialelormecanisme de motivare a muncii în mediul rural se reflectădirect prin productivitatea scăzută.
Căutarea modalităţilor de optimizare a utilizării potenţialuluiforţei de muncă în agricultură, extinderea activităţiloreconomice în zonele rurale şi creşterea componentelormotivaţionale ale forţei de muncă pentru rezidenţii mediuluirural prin atenţia sporită a guvernului pentru asigurareacondiţiilor de viaţă decente a locuitorilor mediului rural şi aforţei de muncă au un impact pozitiv asupra dezvoltării forţei demuncă în zonele rurale şi promovarea creşterii caracteristicilorsale cantitative şi calitative.
Conclusions. Thus, innovation and associatedaccretion process of fixed investment should, in ouropinion, be considered very important for the developmentof rural settlements labour potential as growththrough technical and technological level of management,labour and capital ratio in rural areas, the productivity,its profitability to residents of villages has beenincreased, and service infrastructure develops that ingeneral has a direct impact on rural employmentreproduction and development potential, qualificationand professional and psycho-emotional state in ruraldistricts.
Weakness and partly lack of labour potential motivationmechanisms in rural area is directly reflected through lowproductivity.
The search of ways to optimize the use of agriculturallabor potential, expansion of economic activities inrural areas and increasing rural residents labor motivationalcomponents by the increased government attentionto provide decent social conditions of rural residentslife and labor have a positive impact on the developmentof rural areas labor potential and promote the growthof its quantitative and qualitative characteristics.
Referinţe bibliografice / References1. STATE STATISTICS SERVICE OF UKRAINE. Health care and morbidity in Ukraine in 2011: statistic bulletin.
Kyiv, 2012. 89 p.2. LUCHYK, S.D. The innovative part of the mechanism maintaining labour potential of the village [accesat 5 februarie
2013]. Disponibil: http:// www.nbuv.gov.ua3. STATE STATISTICS SERVICE OF UKRAINE. Agriculture of Ukraine 2010. Kyiv, 2011. 258 p.4. STATE STATISTICS SERVICE OF UKRAINE. Creation and use of high technology and intellectual property rights
in the Ukraine in 2011: report [accesat 5 februarie 2013]. Disponibil: http:// www.ukrstat.gov.ua5. STATE STATISTICS SERVICE OF UKRAINE. Statistical Yearbook of Ukraine for 2010. Kyiv, 2011. 258 p.6. САЛІВОНЧИК, О.М. Роль і значення соціальної інфраструктури в ринковій економіці. В: Спецпроект: анализ
научных исследований: VI международная научно-практическая конференция, 30-31 мая 2011 [accesat 5februarie 2013]. Disponibil: http://www.confcontact.com/20110531/ej5_salivon.htm
7. SHEVCHUK, L.T. Medical and social aspects of labor potential: regional analysis and forecast. Lviv, 2001. 489 p.
Recomandat spre publicare: 04.04.2013

Revistă teoretico-științifică / Theoretical and scientifical journal48
Nr. 3 / 2013
CONCEPŢIILE TEORETICEPRIVIND BANCA VIITORULUI
THEORETICAL CONCEPTSON BANK OF FUTURE
Ivan LUCHIAN, dr., conf. univ.,Institutul International de Management IMI-NOVA
Lilian CIOBANU, drd.,Academia de Studii Eeconomice din Moldova
Ivan LUCHIAN, PhD, University Lecturer,Institutul International de Management IMI-NOVA
Lilian CIOBANU, PhD student,Academia de Studii Eeconomice din Moldova
Banca viitorului a dvenit subiectul discuţiilor ştiinţifice îndomeniul economic. Banca viitorului este banca, ce dispunede un set de technologii unicale, care permit clienţilor de adesfăşura transacţii financiare, aflându-se oriunde, în oricemoment al zilei şi al săptămânii, în mod rapid, eficient şisigur. Crearea acestui tip de bancă va avea loc prin formarea,în conformitate cu prevederile concepţiei “Bank 2.0”şitrecerea la“Bank 3.0”. Aceasta va duce la extindereacantitativă şi calitativă a sistemului bancar, a cărei aspectesunt descrise în acest articol.
Cuvinte cheie: banca viitorului, produs bancare, clientulbăncii, tehnologie bancară
Bank of the future has become the subject of scientificpolemics in economic domain. Bank of the future - it is abank with a set of unique technologies that allow customersto perform financial transactions from anywhere, at any timeof day and any day of the week, quickly, effectively andsafely. The establishment of this type of bank will take placethrough the formation in accordance with the design of“Bank 2.0” conception and training to “Bank 3.0”. This willlead to quantitative and qualitative expansion of banking,which aspects are described in this article.
Key words: bank of the future, banking products, bankcustomer, bank technology
JEL Classification: E01, E50, E58, F24, F43
Introducere. Banca viitorului a devenit obiectulpolemicilor ştiinţifice în mediul economic, ţinându-se cont deconstituirea unui nou tip de economie – cea a cunoaşterii, carecreează, propagă şi face uz de cunoştinţe, toate acestea pentrua spori creşterea lor şi competitivitatea [3].
De asemenea, trebuie de ţinut cont de lărgirea şi adâncireaglobalizării financiare ca un proces, care în ultimă instanţă vaconduce la crearea unei pieţe financiare unice şi, drept urmare,la mărirea fluxurilor internaţionale de capital [1].
Drept rezultat, în mod generalizat, se poate afirma, căbanca viitorului este o instituţie financiară, în a căreidisponibilităţi se conţin tehnologii unicale, care permitclienţilor de a desfăşura operaţiuni financiare în orice parte alumii în orice moment în mod operativ, eficient şi sigur [7].
Conţinutul de bază. În legătură cu formarea imaginiibăncii viitorului poate fi prezentată concepţia cercetătoruluiamerican Brett King a „Băncii 2.0”, considerând bancatradiţională ca „Banca 1.0”, care urmează să evolueze din anii70 ai secolului XX până în prezent într-un nou tip de bancă.
„Banca 2.0” este o bancă orientă către client, ocupată deridicarea permanentă a calităţii produselor sale, a căreibusiness se bazează pe implementarea masivă a tehnologiilorinformaţionale [8].
Concepţia Băncii 2.0 poate fi examinată prin prisma a treiaspecte [2].
Primul aspect examinează evoluţia comportamentuluiconsumatorilor, începând cu apariţia Internetului, continuatăcu fenomenul recent de Blackberry, reţelele sociale, iPhone,etc. Reieşind din faptul, că aşteptările clienţilor din ce în cemai mult se detaşează de modelele de servicii tradiţionale,managementul instituţiilor financiare trebuie să se orientezenu numai spre profitabilitate, ci şi spre respectarea intereselorconsumatorilor, protecţia brandului, precum şi managementulactivelor şi a stării financiare.
Al doilea aspect este orientat spre perfecţionarea canalelorde distribuţie a produselor bancare prin implementarea unortehnologii bancare noi, având ca bază aplicarea largă atehnologiilor informaţionale.
Introduction. Bank of the future has become thesubject of scientific polemics economic environment,taking into account the establishment of a new type ofeconomy – of the knowledge that create, promote andmake use of knowledge, all to enhance their growth andcompetitiveness [3].
We also need to take in to account for broadening anddeepening financial globalization as a process that willultimately lead to the creation of a single financial marketand, therefore, increased international capital flows [1].
As a result, on the whole, we can say that the future ofthe bank is a financial institution, the availability ofwhich contained unique technologies that enablecustomers to conduct financial transactions anywhere inthe world at any time in force, effective and safe [7].
The basic content. In connection with future bankimaging concept can be presented American researcherBrett King "Bank 2.0", considering that traditional bank"Bank 1.0", which will evolve in the 70s of the twentiethcentury to the present in a new kind of bank [2].
"Bank 2.0" - is a client-oriented bank occupiedcontinuously raising the quality of its products, whosebusiness is based on massive deployment of informationtechnologies [8].
The conception of Bank 2.0 can be examined in termsof three aspects [2].
The first part examines the evolution of consumerbehavior since the advent of the Internet, continued withthe recent phenomenon of Blackberry, Social Networks,iPhone, etc. Given the fact that customer expectationsincreasingly detaches more traditional service models,management of financial institutions should focus notonly on profitability, but also to the interests ofconsumers, brand protection, asset and financialmanagement.
The second aspect is aimed at improving thedistribution channels of banking products through theimplementation of new banking technologies, building on

ECONOMIE ŞI SOCIOLOGIE / ECONOMY AND SOCIOLOGY 49
Nr. 3 / 2013
Al treilea aspect examinează elaborarea, implementarea şipromovarea inovaţiilor bancare ca factor principal alsuccesului competiţiei bancare în secolul XXI.
Însă evoluţia concepţiei băncii urmează să continue sprecrearea „Băncii 3.0”, care este legată de practicarea activităţiibancare preponderent în mediul virtual, în cadrul căreiacontactul personal cu clientul obişnuit în cadrul activităţiibancare clasice, de fapt, va deveni un serviciu auxiliarpersonal excepţional de elită.
Savanţii ruşi menţionează necesitatea transformăriibăncilor, pentru a face faţă cerinţelor pieţei în viitor, în patrudirecţii de bază: mobilitatea, socializarea, personalitatea şiproactivitatea [5]:
1. Mobilitatea. Dispozitivele noi pătrund pe piaţă, lărgindcategoriile de vârstă ale consumatorilor produselor bancare.De exemplu, în Rusia cel mai în vârstă client al bănciiSberbank, care foloseşte produsele ei în regim on-line are 90ani. În viitor un număr tot mai mare de persoane vor gestionafinanţele lor personale de sinestătător. Experţii occidentalisunt siguri, că sarcina de bază a tehnologiilor moderne este dea aduce banca acolo şi atunci, unde şi când este nevoie de ea.Banca viitorului este legată de telefonul mobil, care va devenianalogia portmoneului şi va permite de a plăti cumpărăturile şiserviciile diverse. În el va fi montat cipul NFC, сare vapermite cu a atingere de a desfăşura tranzacţii bancare,ultimele fiind mai sigure faţă de operaţiunile cu carduri,deoarece operatorii au posibilitatea de a urmări telefonulmobil după numărul de identificare. Accesul la produselebancare va deveni accesibil permanent şi momentan.
Recent în cadrul subdiviziunilor teritoriale ale Citibank dela New-York au fost create zonele de autodeservire. Prinesenţă, acestea sunt pereţi cu dispozitive pentru primireanumerarului de la cecurile cu citire autormată, primireasolicitărilor pentru produsele băncii şi alte servicii.
De asemenea, băncile occidentale au începutimplementarea serviciilor de consultare video. În acest scopunele di ele fac legătura cu clienţii, aplicând tehnologia Skype.Drept continuare a acestei idei au devenit chişcurile videodestinate accesului non-stop în formă video a colaboratoruluicentrului de contact şi primirii documentelor necesare, care seobţin de la o imprimantă montată.
Un alt dispozitiv cu perspectivă poate fi considerat cardreader-ul mobil. Din anul 2009 a început folosirea unor astfelde dispozive cu marca Square. Card reader-ul de acest tippoate fi conectat la un telefon mobil şi permite, în acest fel,acceptarea plăţilor cu ajutorul cardurilor de către oricecomerciant mărunt.
2. Socializarea. Pentru a fi fericit, omul trebuie în modobligator să comunice cu cineva. Omul interacţionează cudouă medii: intern şi extern. Băncile viitorului vor tinde săpătrundă în ambele medii. De exemplu, pentru mediul intern opersoană poate controla în comun cu rudele sale bugetulfamiliei. De asemenea, ar putea fi binevenită posibilitatea de aefectua decontări reciproce cu prietenii: de exemplu, uşor de asolicita şi de a rambursa datoriile. Aceasta devine deosebit deoportun în cadrul procesului de globalizare, caracterizată prindeplasarea liberă a oamenilor, încât în unele cazuri membriifamiliei sunt dispersaţi în diferite localităţi şi chiar diferiteţări. De asemenea, clientului poate să-i fie interesant de acompara cheltuielile sale cu cheltuielile unui grup social, lacare el se referă. În acest caz informaţia de acest gen poate fi
the extensive application of information technologies.The third part examines the development,
implementation and promotion of banking innovations asthe main factor for the success of banking competition inthis century.
But the development of the bank concept willcontinue to create "Bank 3.0", which is mainly related tothe practice of banking in the virtual environment, inwhich regular personal contact with the customer inclassical banking actually become an ancillary serviceexceptional personal elite.
Russian scientists mention the need to transformbanks to meet future market requirements in fourdirections: mobility, socialization, personality andproactivity [5]:
1. Mobility. New devices entering the market,broadening age categories of consumers of bankingproducts. For example, in Russia the old customer of thebank Sberbank, which uses its on-line products has 90years. In the future an increasing number of people willindependently manage their personal finances. Westernexperts are confident that the basic task of moderntechnology is to bring bank where and when and where itis needed. Bank's future is linked to the mobile phone willbecome the analogy wallet and will allow you to paypurchases and services. In it will be installed NFC chip,which will allow by a touch to conduct bankingtransactions are safer than last card operations asoperators are able to track mobile identification number.Access to affordable banking products will becomepermanent and now.
Recently in the subdivisions of Citibank in New Yorkwere created areas of self banking. By essence, thesedevices are walls for receiving cash from checks toautomatic reading, receiving requests for bank productsand services.
Also, Western banks have started implementing videoconsultation services. To this end some of them connectwith customers, using Skype technology. As acontinuation of this idea, became Gazebo for non-stopvideo in video form to contact the Center and receivingnecessary documents, which are obtained from aninstalled printer.
Another device perspective can be considered mobilecard reader. Since 2009 began using such brandedInstruments Square. Card reader of this type can beconnected to a mobile phone and allows in this way,accepting payments using cards from any petty trader.
2. Socialization. To be happy, one has the obligationto communicate with someone. Man interacts with twoenvironments: internal and external. Future banks willtend to get in both environments. For example, a personcan control the internal environment together with itsrelatives the family budget. Also welcome would be ableto perform mutual settlements with friends: for example,easy to apply and to repay debts. This particularlyappropriate in the process of globalization, characterizedby the free movement of people, when in some casesfamily members are dispersed in different locations andeven different countries. Also, the customer may beinteresting to compare its costs with the costs of a social
Revistă teoretico-științifică / Theoretical and scientifical journal50
Nr. 3 / 2013
prezentată în mod depersonalizat.Actualmente, o bancă din Germania oferă clienţilor
posibilitatea folosirii portalului său în calitate de paginăpersonală pentru accesarea reţelelor sociale şi obţinereainformaţiei de pe ele. Pentru aceasta banca calculeazăbonusuri, care pot fi folosite pentru obţinerea reducerilor laprodusele bancare.
În general, în acest scop banca, spre exemplu, poate săelaboreze o aplicaţie de conectare la Facebook, care să includădeservirea standardă de gestiune a finanţelor, aplicaţii pentruschimbul reducerilor cu prietenii în reţeaua socială, precum şiun oficiu virtual video la distanţă pentru consumul serviciilorbancare de bază.
3. Personalizarea. Băncile tind să facă serviciile sale maiatractive pentru consumatori. Aceasta presupune, că bancacunoaşte cine este clientul ei şi care sunt necesităţile lui lamomentul dat. Personalizarea permite formarea unui contactmai personal, mai apropiat şi de încredere dintre bancă şiclienteul ei, ceea ce permite fidelizarea ultimului faţă deprima.
În urma implementării masive a tehnologiilor bancareavansate bazate pe automatizarea operaţiunilor bancare şiautodeservirea clienţilor, se vor elibera resurse umane încadrul băncilor pentru formarea relaţiilor de încredere dintrebancă şi clienţii ei referitoare la gestiunea finanţelor ultimilor.Subdiviziunile teritoriale ale băncilor se vor transforma înteritorii, unde cu ajutorul dispozitivelor speciale se vor puteaelabora scenarii diferite privind strategiile financiare aleclienţilor.
Posibilităţi largi în contextul abordat oferă internet-bankingul pentru formularea unor oferte personale pentruclienţi şi crearea unui sistem flexibil de informare aconsumatorilor referitor la produsele bancare.
4. Proactivitatea reprezintă aptitudinea, care ajută opersoană să obţină rezultate înalte. Direcţiile de bază aleactivităţii băncilor proactive sunt legate de crearea aşa-numitului sistem de supermarket, care va permite fiecăruiclient să aleagă produsul bancar, care să corespundă exactnecesităţilor sale.
De asemenea, băncile viitorului pot realiza funcţia deamintire. Înţelegând ciclul de viaţă ale clientului, banca îipoate aminti despre plăţile posibile (inclusiv în baza reţelelorsociale). Astfel, băncile pot utiliza informaţia disponibilăpentru a înlătura barierele de formare a relaţiilor dintre bancăşi clientul său.
Mai mult ca atât, în SUA deja au fost elaborate deînregistrare video, care permit fixarea reacţiei clienţilor lastandurile informaţionale, obiectele care atrag atenţia lor ş. a.Astfel de sisteme în viitorul apropiat vor deveni instrumenteutile pentru studierea preferinţelor clienţilor.
În continuare pot fi prezentate transformările de bază înactivitatea bancară.
Principalele din ele, cel mai probail, vor avea loc pe piaţabancară retail. Dat fiind faptul, că aproape toate operaţiunilefinanciare vor putea fi desfăşurate în mediul virtual, se vareduce substanţial importanţa punctelor permanente devânzare a produselor bancare. În cadrul deservirii bancare derutină a clienţilor – persoane fizice contactul lor fizic culucrătorii bancari vor deveni mai curând un gen de exotică sauservcii bancare auxiliare specifice, ceea ce va conduce lamodificarea principială a modelelor de vânzare a produselor
group to which he refers. In this case, such informationmay be presented on a depersonalized.
Currently, a bank in Germany offers its customersthe possibility to use the portal as a personal pagefor accessing social networks and gather informationon them. For this bank calculates bonuses, whichcan be used to obtain the reductions in bankingproducts.
In general, for this purpose the bank, for example, candevelop an application to connect to Facebook, includingfinance management service standards, applications forsharing with friends reductions in social network and avirtual office for remote video consumption of basicbanking services.
3. Customizing. Banks tend to make its services moreattractive to consumers. This implies that the bank knowswho her client and his needs are at the moment.Customizing allow for a more personal contact, closerand trust between the bank and its clients, enablingloyalty last to the first.
Following the implementation of massive advancedbanking technologies based automation and self-servicebanking customers will release resources within the banksto form relationships of trust between the bank and itscustomers about financial management past. Branches ofthe banks will turn into regions where using specialdevices will be able to develop different scenarios forclients' financial strategies.
Approach provides ample opportunities in the contextof Internet banking for personal customers making themmore flexible and create a consumer information onbanking products.
4. Proactivity is a complex of skills that help a personto achieve high results. Basic directions of activity ofbanks are proactive about creating so-called supermarketsystem that allows each customer to choose bankingproduct that exactly matches their needs.
Also, banks of future can achieve memory function.Understanding the life cycle of the customer, the bankmay remember about possible payments (including thesocial networks). Thus, banks may use the informationavailable to remove barriers to the formation ofrelationships between the bank and its client.
Moreover, the U.S. has already been developed videorecording that allows fixing customer reaction toinformation stands, Their eye-catching items. Such asystem in the near future becomes useful tools forstudying the customer preferences.
Further, could be presented basic transformations inBanking.
The main of them, the most probably, will take placeon the retail banking market. Given that almost allfinancial transactions will be conducted in a virtualenvironment, it will substantially reduce the importanceof permanent points of sale of banking products. Duringroutine servicing bank clients - individuals their physicalcontact with bank employees will soon become a kind ofexotic or ancillary banking specific catalog that willlead to changing patterns principled selling bankingproducts.
Basic sales agent f will become bank worker -
ECONOMIE ŞI SOCIOLOGIE / ECONOMY AND SOCIOLOGY 51
Nr. 3 / 2013
bancare.Agentul de bază de vânzări va deveni lucrătorul bancar -
consultant, prezentat în câteva comunităţi virtuale, în care else va bucura de o anumită popularitate şi încredere, inclusiv încalitate de reprezentant oficial al băncii, ceea ce îi va prmite înmod oficial de a consulat membrii comunităţii referitor laselectarea şi consumul produselor bancare. Drept exemplu,consultantul băncii poate fi membrul comunităţii absolvenţilorşcolii, absolvenţilor facultăţii, vizitatorul permanent al uneicafenele, membrul unor comunităţi virtuale bazate pe interesecomune. Participanţii acestor comunităţi pot deveni clienţiibăncii.
Menţinerea acestui model de vânzări va fi efectuată decătre lucrătorii din back-office, în a căror funcţii va intraasistenţa produselor vândute de către consultanţi şidesfăşurarea tranzacţiilor, care vor necesita oformarea fizică adocumentelor. De asemenea, ei pot pregăti şi desfăşuratranzacţiile repetate cu clienţii.
Experţii în domeniul abordat consideră, că tendinţa debază în activitatea bancară retail va fi eficientizarea acesteiaprin dezicerea de produsele nesolicitate de clienţi şitransmiterea produselor solicitate, dar neeficiente pentrubancă, partenerilor de afaceri ai băncilor prin externalizare.Hipermarketurile bancare, care tind să ofere un număr maximposibil de produse bancare în speranţa, că ele îşi vor găsi, înultimă instanţă, consumatorul, în mare parte vor dispărea, iar,în acelaşi timp, se vor răspândi băncile organizate dupăprincipiul „periuţei de dinţi”, adică instituţiile financiare, carevor oferi numai acele produse bancare, care sunt vital necesareclienţilor şi pe care le pot oferi în mod frecvent (chiar zilnic)la cea mai înaltă calitate [4].
De asemenea, sunt evidenţiate alte şase direcţii dedezvoltare a activităţii bancare cu amănuntul [4].
1. Creşterea extensivă din contul atragerii clienţilor noi şi aproduselor bancar „uşoare” (depozitele, creditele cash şi POS,business-ul tranzacţional) se va opri şi băncile vor fi impuse sămărească volumul vânzărilor secundare (cross-sell, up-sell)din contul produselor „grele” (ipotecii, internet şi mobilebanking, brokerajul ş.a.), care va fi posibilă doar în cazulorganizării calitative a activităţii de consultare.
2. Separararea băncilor în subdiviziuni de bază, în care sevor forma relaţiile băncilor cu clienţii şi reţeaua auxiliară(cuburile mobile, bancomatele, chioşcurile video).
3. Crearea subdiviziunilor în reţelele partenerilor,principalii din care vor fi cele de comerţ cu amănuntul.
4. Creşterea numărului băncilor virtuale fără oficii fizice,legătura cu clienţii se forma prin intemediul Internetului,telefoanelor mobile şi planşetelor. Baza activităţii lor oconstituie deservirea clienţilor la distanţă: prezentareaelectronică în timp real a extraselor din conturile clienţilor,schimbul valutelor din conturi, deschiderea depozitelor,efectuarea plăţilor şi a operaţiunilor de creditare.
5. Dezvoltarea sistemelor integrate de distribuire aproduselor bancare De exemplu, clientul poate comunica culucrătorul băncii cu ajutorul telefonului, apoi să iniţiezetranzacţia din oficiul său cu ajutorul Internetului şi să ofinalizeze în stradă cu ajutorul bancomatului.
6. Băncile pot diversifica ofertele lor clienţilor – persoanefizice prin prestarea pe lângă serviciilor bancare şi a celornebancare. Oficiile teritoriale ale băncilor pot deveni locurispecial amenajate, unde pe lângă folosirea produselor bancare,
consultant presented within virtual communities, wherehe will enjoy a certain popularity and trust, including asofficial representative of the bank, which willformally a primeval consulate community on theselection and use of banking products. As an example, thebank can be adviser community member schoolgraduates, college graduates, permanent visitor of a cafe,a member of virtual community based on commoninterests. Participants in these communities can becomebank customers.
Maintaining this sales model will be done by back-office workers, whose functions will come in support ofproducts sold by consultants and conduct transactions thatwill require physical registration of documents. They alsomay prepare and carry out repeated transactions withcustomers.
Experts in the concerned field consider that theunderlying trend in banking retail will streamline it bydetaching the products unsolicited reviews andtransmitting the requested products, but inefficient for thebank, business partners banks outsourcing. Hypermarketsbank, which tend to provide the maximum possiblenumber of banking products in the hope that they willfind, ultimately, the consumer, will largely disappear, andat the same time will spread banks organized by the"teeth brush", ie financial institutions, which will provideonly those banking products that are vital to the client andthey can provide frequently (even daily) to the highestquality [4].
They also highlighted other six directions ofdevelopment of retail banking [4].
1. Extensive growth at the expense of attracting newcustomers and banking "light" products (deposits, cashloans and POS transactional business) will stop and thebanks will be forced to increase the volume of secondarysales of "heavy" products (cross-sell, up-sell) of account(mortgage, internet and mobile banking, brokerage, etc.),which will be possible only if the qualitative organizationof business consultation.
2. Separation of banking basic subdivisions, whichwill form relationships with customers and banksauxiliary supply (cubes phones, ATMs, kiosks, video).
3. Creating of subdivisions in partner networks,which will be the main retail.
4. Increase virtual banks number without physicaloffices, witch contact directly its customers as theInternet, mobile phones and Planchettes. The basis oftheir work is the remote customer service: real-timeelectronic submission of statements of customer accounts,exchanging currencies in the accounts, deposit, paymentand lending operations.
5. Development of integrated distribution of bankingproducts, for example, the client can communicate withthe bank employee on the phone, then to initiate thetransaction in his office over the Internet and on the streetwith a complete ATM.
6. Banks can diversify their offer customers -individuals by providing besides banking andnon-banking ones. Field offices of banks can becomespecial places where besides using banking products,customers will be able to relax, communicate with

Revistă teoretico-științifică / Theoretical and scientifical journal52
Nr. 3 / 2013
clienţii se vor putea odihni, să comunice cu alte persoane, săservească o cafea, să participe la conferinţe, seminare, concerte.
Business-ul bancar corporativ se va schimba într-o măsurămai mică. Relaţiile dintre subiectele acesteia va avea uncaracter mai puţin virtual faţă de cele formate cu clienţii -persoane fizice, iar compania (societatea pe acţiuni) va rămâneunitatea de bază a economiei.
Creşterea proporţiilor ramurilor economiei va conduce laapariţia alianţelor stabile ale băncilor globale şi a companiilorglobale, legată de interpătrunderea ricporcă a capitalurilor şicrearea proiectelor comune în diferite domenii de activitate.Serviciile băncilor clienţilor corporativi va avea preponderentun caracter complex. De exemplu, banca va oferi simultanserviciile de decontări, serviciile de organizare a finanţării(atât legate de creditare, cât şi de atragerea capitalului),serviciile de asigurare, serviciile de gestiune a fondului depensii al întreprinderii.
Luând în consideraţie concurenţa serioasă cu caracteratotcuprinzător, băncile vor avea dificultăţi cu atragereaclienţilor noi. De aceea, se va răspândi practica de creare aclienţilor cu ajutorul fondurilor venture şi participarea băncilorprin intermediul structurilor afiliate în capitalul agenţiloreconomici cu perspectivă.
În afară de cele menţionate, pot fi remarcate uneleparticularităţi ale schimbării organizării activităţii băncilor.Reţeaua largă de filiale ca totalitate a oficiilor existente şisuplimentare îşi va pierde importanţa. Cel mai probabil este caîn practica bancară să fie implementat principiul „un oraş – unoficiu”, iar oficiul va fi important mai curând din punctul devedere al imaginii, decât al funcţionalităţii necesare. Deasemenea, treptat va dispărea necesitatea lucrului în comun alîntregului colectiv într-o singură clădire. Va fi lărgită practicamuncii intelectuale la domiciliu, precum şi a creăriicolectivelor temporare de creaţie pentru îndeplinirea unorsarcini deosebit de importantă.
others, serve coffee, attend conferences, seminars,concerts.
The corporate banking business will change to a lesserextent. Relations between its subjects will have a virtualcharacter less than those formed with clients - individualsand company (joint stock company) will remain the basicunit of the economy.
Increase of proportion of economy sectors willconduct the emergence of stable alliances, global banksand global companies linked by mutual penetration ofcapital and the creation of joint projects in differentfields. Banking services to corporate clients will bemainly a complex character. For example, the bank willsimultaneously provide settlement services, financingservices organization (both related lending and attractingcapital) services, insurance services, management ofcompany pension fund.
Given the comprehensive nature of seriouscompetition, banks will have difficulties to attract newcustomers. Therefore, the practice will spread tocreate clients with venture funds and banks' participationin the capital through affiliated economic structuresoutlook.
In addition to the above, can be observed somepeculiarities of work organization changes in banks. Widenetwork of branches as a whole existing and additionaloffices will lose importance. Most likely is that thebanking practice to be implemented the principle "onecity - an office", and office will soon be important fromthe point of view of the image, less of the functionality.
It also will gradually disappear the need of worktogether the entire collective in the same building. Theintellectual labor practice at home will be widened, andthe creation of temporary creative collectives to meetsome very important tasks.
Referinţe bibliografice / References1. ARESTIS, P., BASU, S. Financial Globalization and Regulation. In: Working Paper. 2003, no. 397, december [accesat
5 mai 2013]. Disponibil: http://www.levyinstitute.org/pubs/wp397.pdf2. Bank 2.0 [accesat 5 mai 2013]. Disponibil: http://www.banking4tomorrow.com/bank-2-03. Reţeaua Naţională de Cercetare şi Inovare în domeniul Serviciilor - RENACESER [accesat 5 mai 2013]. Disponibil:
www.cercetareservicii.ase.ro4. Банки будущего. "Дифференцируйся или умри!". 2012, 26 ноября [accesat 5 mai 2013]. Disponibil:
http://banki39.ru/text/149325. БУРЦЕВА, С., КАЛАЧЕВА, А., МАТВЕЕВА, Е. Банки будущего: международный опыт [accesat 5 mai 2013].
Disponibil: http://www.buk.irk.ru/library/sbornik_12/burceva.pdf6. Виртуальный банк: особенности нового вида банковских услуг [accesat 5 mai 2013]. Disponibil:
http://ria.ru/economy/20080820/150530457.html#ixzz2Z5rsGutA7. ОРЛОВА, А.С. Дистанционное банковское обслуживание как перспективное направление развития
современного банка [accesat 5 mai 2013]. Disponibil: http://sisupr.mrsu.ru/2012-1/PDF/8_kds/Orlova.pdf8. ПОПОВ, Андрей. Банк превращается в «виртуальную сущность [accesat 5 mai 2013]. Disponibil:
http://ibusiness.ru/blogs/21388
Recomandat spre publicare: 12.05.2013

ECONOMIE ŞI SOCIOLOGIE / ECONOMY AND SOCIOLOGY 53
Nr. 3 / 2013
STRATEGIA FINANCIARĂ: TRĂSĂTURISPECIFICE ŞI FACTORI DE INFLUENŢĂ
ÎN DOMENIUL BANCAR
FINANCIAL STRATEGY: SPECIFICFEATURES AND INFLUENCE FACTORS
IN THE BANKING SYSTEM
Olga ŞTEFANIUC, dr., conf. univ.,Universitatea de Stat din Moldova
Olga STEFANIUC, PhD, Associate Professor,State University of Moldova
Strategia financiară reprezintă un model de formare,utilizare şi evidenţă ale resurselor financiare ale băncii înperspective de lungă durată. Ea constituie un element alstrategiei generale şi determină direcţiile de dezvoltare îndomenii ca: politica creditară, politica de investiţii, politicade emisie, politica de depozite, politica ratei dobânzii, politicade dividend, politica de susţinere a lichidităţii curente. Deci,strategia financiară formează politica financiară a băncii cuscopul creării gestiunii eficiente a fluxurilor financiare.
Financial strategy is a model of training,tracking anduse of financial resources of the bank in the long run. It isan element of the overall strategy and it determines thedevelopment directions in the areas of credit policy,investment policy, broadcasting policy, deposit policy,interest rate policy, dividend policy, liquidity policysupport. So, the financial strategy forms the Bank'sfinancial policy in order to create an efficientmanagement of financial flows.
Cuvinte cheie: strategie, management strategic, bancăcomercială, strategie financiară, resurse financiare, politicăfinanciară, lichiditate, rentabilitate.
Key words: strategy, strategic management,commercial banks, financial strategy, financial resources,financial policy, liquidity, profitability.
JEL Classification: G21, G33, F43, E58
Introducere. Strategia globală constituie fundamentulstrategiilor parţiale referitoare la domeniile specifice aleactivităţii bancare, care corespund domeniilor stabilite înstatutul băncii şi la nivelul cărora obiectivele, opţiunilestrategice şi resursele, ce urmează fi angajate, au dimensiunimai reduse. Aceste strategii determină modele decomportament pe o piaţă concretă şi după un anumit domeniude activitate. Precizarea detaliilor respective prin strategiilefuncţionale permite înţelegerea strategiei de ansamblu a bănciide către majoritatea componentelor acesteia, clarificareaacelor părţi ale strategiei, care vizează domenii funcţionalespecifice.
Conţinutul de bază. Strategia financiară este o direcţieprioritară a strategiei generale a băncii comerciale, caredetermină obiectivele principale ale activităţii financiare şimodurile de tratare în realizarea lor practică. Spre deosebirede majoritatea întreprinderilor în alte domenii ale economiei,în bănci nu există nici o direcţie de producţie, deoarecedirecţia dată este înlocuită de direcţia financiară. Aceastădeosebire determină:
- statutul băncii ca o organizaţie financiară;- specializarea profesională a salariaţilor, şi aceştia, în
majoritate, sunt finanţişti;- caracterul serviciilor acordate: servicii financiare şi
informaţie financiară;- domeniul de activitate care reprezintă piaţa financiară.Deci, structura strategiei financiare a băncii este
mai complexă şi poate fi prezentată în felul următor(Schema 1).
În schemă putem observa, că toate strategiile bănciicomerciale sunt interdependente. În elaborarea şi realizareapractică a strategiei financiare a băncii participă diferitesubdiviziuni în dependenţă de mărimea băncii. Cu cât maimare este banca, evident, este şi mai complicată structuraorganizatorică de gestiune, cu atât mai multe subdiviziuni suntantrenate în procesul de elaborare a strategiei financiare. Deexemplu, în corporaţii bancare mari, aşa ca Societé Generale,în acest proces sunt antrenate proprietarii, preşedintele,departamentul de credit, departamentul de investiţii,
Introduction. The overall strategy is the foundationof partial strategies related to specific areas of banking,which correspond to the areas set out in the bank’s status,and at the level of which, the objectives, strategic optionsand resources to be employed are smaller. Thesestrategies cause the actual market behavior patterns aftera certain domain. Detailing the respective strategiesfunctional that allow understanding the bank's overallstrategy by most of its components, elucidating thoseparts of the strategy which are aimed at specificfunctional areas.
The basic content. Financial strategy is a prioritydirection of the overall strategy of the commercial bank,which determines the main objectives of the financialactivity and the modes of treatment in their practicalrealization. Unlike most companies in other sectors of theeconomy, in banks there is no production directionbecause this direction is replaced by the financialdirection. This distinction determines:
- the statute of the Bank as a financial organization;- professional specialization of the employees and
they are mostly financiers;- nature of provided services: financial services and
financial information;- the activity are is represented by the financial market.Therefore, the bank's financial strategy structure is
more comprehensive and can be presented as follows(Scheme 1).
In the diagram we can see that all the strategies of thecommercial bank are interdependent. In the developmentand practical implementation of the bank's financialstrategy are involved different divisions, depending onthe size of the bank. The bigger the bank, of course, themore complicated is the organizational structure ofmanagement, the more subdivisions are involved in theprocess of development of the financial strategy. Forexample, in large banking corporations, such as SocietéGenerale, the owners are involved in this process, thePresident, the credit department, the department of

Revistă teoretico-științifică / Theoretical and scientifical journal54
Nr. 3 / 2013
departamentul de bugetare, departamentul de gestiune alichidităţii, departamentul de analiză şi prognoză financiară,trezoreria, cât şi subdiviziunile băncii ce corespund gestiuniiserviciilor respective segmentelor pieţei financiarecorespunzătoare.
budgetary investments, department of liquiditymanagement, financial analysis and forecastingdepartment, treasury and bank subdivisions whichcorrespond to the management of services of theappropriate financial market segments.
Schema 1. Structura strategiei financiare a băncii comerciale/Scheme 1. Financial strategy structure of the commercial bank
Sursa/Source: [1, p. 68].
Trebuie de menţionat, că în sectorul bancar, strategiafinanciară are trăsături specifice, care sunt determinate de unşir de factori [6, p. 728].
1. Necesitatea gestiunii resurselor atrase, pentru că numaiîn domeniul bancar raportul între resursele proprii şi resurseleatrase constituie mai mult decât 1:10. Acest fapt determinădouă elemente, care trebuie să fie luate în considerare înelaborarea strategiei financiare:
- responsabilitatea specială a tuturor departamentelorpentru eficacitatea hotărârilor manageriale, atât la nivelstrategic, cât şi la nivel operativ;
- controlul mai riguros asupra activităţii financiare a bănciicomerciale din partea Băncii Naţionale a Moldovei,direcţionat spre asigurarea intereselor clienţilor şi societăţii.
2. Banca gestionează nu pur şi simplu mijloacele băneşti,
It should be noted that the financial strategy in thebanking field has specific characteristics, which aredetermined by a number of factors [6, p. 728].
1. The need of management for the attractedresources, because only in the banking system therelationship between own resources and the raised fundsis more than 1:10. This created two elements that must beconsidered when developing the financial strategy:
- the special responsibility of all departments foreffective managerial decisions, both on the strategic level,and on the operational level;
- stricter control on the financial activity of thecommercial bank by the National Bank, directed towardsensuring the interests of clients and society.
2. Bank manages not simply cash resources, but
MISIUNEA BĂNCIIŞI STRATEGIA EI DE PIAŢĂ/
BANK MISSION AND MARKETSTRATEGY
STRATEGIA FINANCIARĂ/FINANCIAL STRATEGY
Orientarea strategică generalăspre prioritatea lichidităţii
şi securităţii/Overall strategic guidance
to liquidity and securitypriority
Orientarea strategicăgenerală spre prioritatea
rentabilităţii/Overallstrategic guidance
of the priorityof profitabilityPolitica de susţinere a lichidităţii curente/
Liquidity policy support
Politica ratei dobânzii/Interest rate policy
Politica de emisie/Broadcasting
policy
Politica de depozit/Deposit policy
Politica de credit/Credit policy
Politica de investiţii/Investment policy
Politica de dividende/Dividend policy

ECONOMIE ŞI SOCIOLOGIE / ECONOMY AND SOCIOLOGY 55
Nr. 3 / 2013
ci fluxuri financiare. Pe piaţa financiară, banca, de fapt, esteun regulator, care gestionează circuitul monetar, care trebuiesă fie eficient şi operativ.
3. Strategia financiară a băncii, în mare măsură, depindede politica financiară a statului. Prin domeniul bancar sepromovează un complex de măsuri regulatorii, cu caracterstrategic, unite în politica monetar-creditară a băncii centrale.
4. Pentru strategia financiară a băncii este specificăexistenţa unui număr mare de politici financiare pe domeniide activitate, deoarece banca activează pe mai multe segmenteale pieţei financiare şi pentru fiecare segment trebuie să fieelaborată o strategie aparte, de exemplu, o strategie dedepozite, o strategie de creditare, o strategie de menţinere alichidităţii etc.
5. Activitatea bancară, în mare măsură, este supusăinfluenţei negative diferitor riscuri financiare, care depind deurmătorii factori:
- nivelul de stabilitate mai scăzut şi prognoza dezvoltăriipieţelor financiare mai dificilă în comparaţie cu alte pieţe;
- dependenţa înaltă a intereselor financiare ale băncii decorectitudinea afacerilor clienţilor şi respectarea eticiiprofesionale din partea concurenţilor;
- dependenţa înaltă a băncii de schimbările neaşteptate aleconjuncturii pieţelor deservite.
Strategia financiară a băncii este orientată spre asigurareaconexiunii raţionale între trei parametrii ce caracterizeazăsituaţia băncii, şi anume:
- nivelul lichidităţii ce corespunde cerinţelor reglementatede către BNM;
- gradul de siguranţă, admisibil de către clienţii şipartenerii băncii;
- nivelul de rentabilitate, admisibil de majoritateaacţionarilor băncii.
Angrenând aceşti trei parametri strategici de gestiune, seaccentuează necesitatea balansării permanente la îmbinarea atrei scopuri antagoniste. Lichiditatea înaltă şi siguranţa bănciiexclude nivelul înalt de rentabilitate şi, invers, tendinţa de aobţine profit mai înalt permanent măreşte proporţionalprobabilitatea apariţiei riscurilor financiare. De aceea, nu suntproporţii optimale şi universale între aceşti trei parametri.Fiecare din ei trebuie să determine în strategia financiară abăncii priorităţi proprii, care rezultă din obiectivelecomportamentului strategic de piaţă al băncii comerciale. Înrealizarea strategiei, aceste proporţii se vor schimbapermanent în dependenţă de situaţia pe piaţă, dar orientarealor generală rămâne constantă până la momentul corectăriiradicale a misiunii băncii.
În situaţia dată sunt posibile două variante de gestiunestrategică.
Prima variantă este orientarea strategică spreprofitabilitatea înaltă a băncii. Varianta dată presupune, caprioritate strategică să fie acordată profitabilităţii mai înalte,care poate fi asigurată prin diminuarea cerinţelor faţă desiguranţa băncii, dar cu condiţia, că toate cerinţele privindlichiditatea, reglementate de către BNM, vor fi respectate. Deobicei, această strategie este tipică pentru o bancă în careproprietarii au orientări valorice cu caracter economicincorect. Ca rezultat, pentru maximizarea veniturilor, eleobligă managerii executivi să promoveze o strategiefinanciară intenţionat periculoasă pentru interesele de piaţă petermen lung ale băncii. Această variantă presupune orientarea
financial flows as well. The bank, on financial market, infact, is a governor that manages cash flow, which shouldbe effective and efficient.
3. The bank's financial strategy largely depends on thefinancial policy of the state. Through the banking systemare promoted a complex of regulatory measures withstrategic character unified in the monetary-creditaryoriented policy of the central bank.
4. For the financial strategy of the bank the existanceof a large number of financial policies on activity fields isspecific, because the bank operates in several segments ofthe financial market and for each segment must bedeveloped a unique strategy; for example a strategy fordeposits, a stratedy for credits, a strategy for maintainingliquidity, etc..
5. Banking acivity is largely subject to the negativeinfluence of different financial risks that depend on thefollowing factors:
- low level of stability and forecast for financialmarket development is more difficult compared withother markets;
- high dependence of the financial interests of thebank on correctness of the bank clients' businesses andthe professional ethics from competitors;
- high dependence of the bank to unexpected changesof the served market’s conjuncture.
The bank's financial strategy aims at ensuring rationalconnection between the three parameters that characterizethe bank, namely:
- the liquidity level that meets the requirementsregulated by the BNM;
- acceptable level of safety by bank customers andpartners;
- acceptable level of profitability by the majorityshareholders of the bank.
Uniting these three strategic management parametersemphasizes the need for permanent balancing combiningthree antagonistic purposes. High liquidity and banksafety exclude the high level of profitability andconversely, the tend to get higher profits proportionallyincreases the likelihood of permanent financial risks.Therefore, there are no universal optimum proportionsbetween these three parameters. Each of them mustdetermine in the bank's financial strategy its ownpriorities resulting from the strategic behavior of markettargets of the commercial bank. In the accomplishment ofthe strategy these proportions will change constantlydepending on the market situation, but overall orientationremains constant until the radical correction of themission of the bank.
In this situation there are two possible variants ofstrategic management.
First is the strategic focus on high profitability of thebank. The given option assumes that strategic priority isgiven to higher profitability, that can be achieved byreducing the safety requirements of the bank, but with thecondition that all liquidity requirements, regulated by theBank, will be respected. Usually, this strategy is typicalfor a bank where the owners have incorrect economicvalue orientations. As a result, to maximize revenue theyrequire executive managers promote a harmful financial

Revistă teoretico-științifică / Theoretical and scientifical journal56
Nr. 3 / 2013
corespunzătoare principalelor politici financiare ale băncii, şianume:
1. politica menţinerii lichidităţii presupune reducerea ei câtmai posibilă ca rezultat al pierderilor din cauza riscurilor;totodată, respectarea normativelor lichidităţii este asigurată cuatragerea resurselor suplimentare, de exemplu, a creditelorinterbancare;
2. politica ratei dobânzii presupune orientarea spremenţinerea diapazonului larg al ratelor dobânzii între resurseleatrase şi cele investite, de asemenea, şi utilizarea ratelordobânzii flotante, care asigură creşterea veniturilor băncii;
3. politica de emisie presupune orientarea spre emitereavalorilor mobiliare cu rentabilitate scăzută şi nu excludeposibilitatea operaţiunilor speculative cu ele;
4. politica de depozite presupune orientarea spremenţinerea ratelor dobânzii la nivelul minim accesibil de cătredepunători;
5. politica investiţională şi politica de credite presupunorientarea spre rentabilitatea înaltă a portofoliilorcorespunzătoare.
Varianta examinată asigură băncii câteva avantaje,principalul din care constă în posibilitatea de a majoraveniturile băncii, care vor fi mai înalte de nivelul mediu peramură. Şi mai mult, prin realizarea succesivă a acesteistrategiei pe o perioadă destul de lungă (minim 3 ani), secontribuie la îmbunătăţirea ratingului băncii şi la majorareacotării acţiunilor ei, comparativ cu acţiunile concurenţilor.Acestea permit atragerea acţionarilor noi, deci majorareacapitalul propriu al băncii.
Cu toate acestea, varianta examinată are şi un şir deneajunsuri. Urmărirea rentabilităţii înalte măreşte riscurilecorespunzătoare în activitatea băncii şi, ca o consecinţă,pierderile în toate domeniile ale activităţii. Şi mai mult,promovarea acestei strategiei nu contribuie la sporireaatractivităţii preţurilor la serviciile acordate ce implicăextinderea pieţelor deservite. În cele din urmă, realizareaacestei strategiei cere de la administrarea băncii ridicareacontinuă a nivelului culturii de caracter organizatorico-managerial ca un instrument principal al rezistenţei împotrivariscurilor inevitabile. Având în vedere aceste neajunsuri,varianta dată poate fi recomandată băncilor care dispun:
- sau de preferinţe concurenţiale, care permit menţinereaatractivităţii serviciilor, cu toate că preţurile sunt umflate,
- sau de susţinerea neformală din partea statului, cepermite minimizarea riscurilor, având acces la informaţiileconfidenţiale politice, comerciale şi financiare, cu altecuvinte, folosind metode de concurenţă neconştiincioasă(necinstită).
Varianta a două reprezintă orientarea strategică spresiguranţa ridicată şi lichiditatea permanentă a băncii. Strategiapresupune, ca prioritatea să fie acordată nivelului mai ridicatal siguranţei şi rezervei lichidităţii a băncii, care sunt asiguratepe seama diminuării cerinţelor din partea proprietarilor faţă derentabilitatea băncii. Această orientare a strategiei financiareeste tipică pentru băncile, misiunea cărora este bazată pe ostrategie a dezvoltării limitate, dar proprietarii sunt orientaţispre menţinerea businessului bancar pe termen lung. Carezultat, pentru asigurarea stabilităţii financiare, ei admitrentabilitatea mai scăzută, cerând de la managementulexecutiv promovarea strategiei financiare, bazate peminimizarea riscurilor activităţii bancare. Strategia examinată
strategy intentionally for the long-term interests of thebank in the financial market. This option requires properorientation of the main bank's financial policy, namely:
1. maintaining liquidity policy involves reducing it aspossible, as the result of losses from risks, whilepreserving liquidity norms is provided by attractingadditional funding, for example, interbank loans;
2. interest rate policy involves focussing onmaintaining a wide range of interest rates between fundsraised and invested resources, and also using floatinginterest rates, which improve the bank's income;
3. broadcasting policy orientation involves theissuance of estate values with low profitability and do notexclude the possibility of speculative operations withthem;
4. deposit policy involves focussing on maintaininginterest rates at the least accessible levels by depositors;
5. investment policy and credit policy involvingproper orientation and high return portfolios.
The examined option provides the bank severaladvantages, the main of which is the possibility toincrease the bank's income, which will be higher than theindustry average. And more, the success of theimplementation of this strategy on a long enough period(min 3 years), helps improve the bank rating and listing,its shares increase compared to competitors' actions. Thishelps attract new shareholders, raising equity capital ofthe bank.
However, the option under consideration has anumber of drawbacks. Pursuing higher profitabilityincreases corresponding risks in the bank's activity and,as a consequence, the losses in all areas of business. Andmore, the promotion of this strategy does not contributeto raising the prices of services provided involving theexpansion of served markets. Finally, the implementationof this strategy requires the bank management tocontinuously raises the level of organizational andmanagerial culture of character as the main instrument ofresistance against unavoidable risks. Given thesedrawbacks, this version can be recommended to banksthat have:
- or competitive preferences, that allow to maintainthe attractiveness of services, although the prices areinflated,
- or informal support from the state, which allows tominimize risks, having access to confidential political,commercial and financial information, in other words,using the methods of the unconscious competition(unfair).
Option two is the strategic orientation to high safetyand permanent liquidity of the bank. The strategy requiresthat priority be given to the higher level of safety andliquidity reserve bank are insured by the owners of lowerrequirements on bank profitability. This orientation of thefinancial strategy is typical for banks, the mission ofwhich is based on a limited development strategy, but theowners are oriented towards maintaining long-termbanking business. As a result, to ensure financial stabilitythey allow lower profitability, asking the executivemanagement to promote financial strategies based onminimizing the risks of banking. The considered strategy
ECONOMIE ŞI SOCIOLOGIE / ECONOMY AND SOCIOLOGY 57
Nr. 3 / 2013
determină şi orientarea respectivă a principalelor politicifinanciare şi anume:
1. politica menţinerii lichidităţii presupune nu numaicorespunderea strictă a normativelor Băncii Naţionale, dar şicrearea rezervei permanente a lichidităţii ce permite protejareaactivităţii băncii de la riscurile force majeure;
2. politica ratei dobânzii presupune orientarea spremicşorarea diferenţei între dobânzile la resursele atrase şiresursele investite şi utilizarea mecanismului flotant aldiapazonului ratelor dobânzii, care asigură nu numaiinteresele băncii, dar şi cele ale clienţilor;
3. politica de emisie presupune orientarea spre emisiavalorilor mobiliare relativ rentabile şi exclude posibilitateaoperaţiunilor speculative cu ele;
4. politica de depozite presupune orientarea spremenţinerea ratelor dobânzii atractive pentru clienţii,îmbunătăţirea continuă a asortimentului depozitelor, majorândcota depunerilor pe termen lung, utilizarea ratelor dobânziiflotante;
5. politica de credite şi politica de investiţii presupunorientarea spre prioritatea portofoliilor respective spresiguranţă înaltă, dar cu rentabilitate mai scăzută.
Această variantă asigură băncii câteva avantaje. Avantajulprincipal constă în posibilitatea de a asigura băncii ratingul desiguranţă înaltă şi, deci, a ridica atractivitatea ei pentru clienţişi investitori. Un alt avantaj constă în posibilitatea băncii de apreveni riscul lichidităţii, adică problemele cu BancaNaţională. Şi în cele din urmă, orientarea spre acest tip destrategie financiară nu cere un nivel înalt al culturiiorganizatorico-manageriale, ca în prima variantă.
Din punct de vedere al proprietarilor, dezavantajulprincipal al acestei variante constă în rentabilitatea scăzută şi,deci, nivelul scăzut al veniturilor. Şi mai mult, promovareaacestei strategiei nu contribuie la majorarea rapidă acapitalului propriu din două surse principale posibile, şianume din profitul net şi veniturile din emisii noi de acţiuni.Varianta dată a strategiei poate fi recomandată majorităţiibăncilor comerciale, dar trebuie de menţionat, că proceseleformării şi realizării practice ale strategiei financiare sebazează pe metodologia generală a managementului strategic.În ţările dezvoltate, această metodologie a fost elaborată peparcursul câtorva decenii, bazându-se pe experienţa enormă aactivităţii diferitor tipuri de instituţii financiare. Elaborândstrategia financiară în băncile autohtone, trebuie luată înconsiderare şi influenţa unui şir de factori suplimentari, caresunt determinaţi de condiţii specifice ale dezvoltăriieconomiei de tranziţie.
În primul rând, specificul strategiei financiare estedeterminat de cerinţele BNM privind mărimea minimă acapitalului propriu al băncilor comerciale. Strategia BNM estedirecţionată spre majorarea nivelului de capitalizare a băncilorcomerciale ca o sarcină prioritară. Conform Regulamentuluicu privire la suficienţa capitalului ponderat la risc [5],începând cu 31 decembrie 2011, cuantumul capitalului minimnecesar se stabileşte în mărimea de 150 milioane de lei, darîncepând cu 31 decembrie 2012 – în mărimea de 200 milioanede lei sau aproximativ 12,5 milioane de euro. Dar, deexemplu, mărirea medie a capitalului propriu al bănciloreuropene şi americane depăşeşte 45 milioane de euro, înJaponia ea constituie aproximativ 70 milioane de euro. Acestfactor influenţează foarte mult scopurile generale ale
determines the orientation of the main financial policy,namely:
1. the maintaining liquidity policy requires not onlystrict compliance of regulations of the National Bank, butalso creating permanent liquidity reserve which allows thebank to protect its activities in exeptional cases;
2. interest rate policy involves focussing onreducing the difference between the interest on the fundsraised and invested resources and use a tuningfork mechanism floating interest rate, which ensures notonly the interests of the bank, but those of the customersas well;
3. broadcasting policy involves orientation tobroadcasting estate vluables at relative costs and excludesthe possibility to speculate with them;
4. deposit Policy involves focussing on maintaininginterest rates attractive to customers, continuouslyimproving deposit assortment, increasing the share of termdeposits, using floating interest rates;
5. the policy loans and investment policy involveorientation to the priority of those portfolios and highsafety, but lower profitability.
This version provides several advantages for the bank.The main advantage is the possibility to ensure the bank'shigh safety rating and thus, raise its attractiveness tocustomers and investors. Another advantage is thepossibility to prevent the bank's liquidity risk, whichmeans problems with the National Bank. And finally, theorientation of this type of financial strategy does notrequire a high-level of the managerial and organizationalculture, as in the former option.
From the point of view of the owners, the maindisadvantage of this variant is low profitability and hence,low incomes. And more, the promotion of this strategydoes not contribute to the rapid increase of equitypossible from two main sources, namely net profit andrevenue from new emission of shares. Time version of thestrategy can be recommended to most commercial banks,but it should be noted that the process of training andpractical implementation of this financial strategy isbased on the general methodology of strategicmanagement. In developed countries, this methodologyhas been developed over decades, based on enormousexperience activity based on different types of financialinstitutions. When developing the financial strategy indomestic banks, should be considered the influence of anumber of additional factors, which are determined byspecific conditions of the transitory economydevelopment.
First, the specific financial strategy is determined bythe minimum size requirements of BNM regarding theequity of commercial banks. Bank strategy is directedtowards increasing the level of capitalization ofcommercial banks as a priority. According to theRegulation on capital adequacy primarly at risk, [5], fromDecember 31, 2011, the amount of minimum capital is inan amount of 150 mln. lei, but from 31 December 2012 -in the amount of 200 mln. lei or about 12.5 million euros.But for example, the average increase of equity inEuropean and American banks exceeds 45 million euros,and in Japan it is close to 70 million euros. This factor
Revistă teoretico-științifică / Theoretical and scientifical journal58
Nr. 3 / 2013
strategiei, determinând nivelul mai scăzut al ambiţiilor, oatenţie deosebită ritmului creşterii capitalului, necesitateaoptimizării cheltuielilor proprii etc.
De asemenea, el influenţează şi alegerea metodelorconcrete în domeniile specifice ale strategiei financiare. Deexemplu, politica creditară a băncilor autohtone nu presupunenici o posibilitate de acordare a creditelor mari sauinvestiţiilor în ramuri cheie ale sectorului real al economieianume din cauza insuficienţei capitalului. Politica de emisieorientată spre creşterea forţată a capitalului pune banca înpericolul înlocuirii neplanificate a proprietarilor sau alpierderii independenţei financiare faţă de creditori.
Un alt factor, care trebuie luat în calcul, constă îndisproporţia în structura activelor şi pasivelor, care s-a formatsub influenţa factorilor de macromediu. O lege fundamentalăa economiei de piaţă determină o dependenţă directă a oferteifaţă de cererea solvabilă, şi piaţa serviciilor bancare nureprezintă o excepţie. Băncile autohtone, din momentulînceperii activităţii, şi-au format structura pasivelor şiactivelor orientându-se anume după această cerere, însăstructura acestora în băncile străine se deosebeşte esenţial decea din băncile autohtone. De exemplu, cererea la crediteleinvestiţionale există din partea întreprinderilor autohtone, darcererea solvabilă se manifestă mai mult din partea sfereicirculaţiei, dar nu din sectorul real al economiei. De asemeneaîn ţările occidentale, până la 65% din populaţia aptă de muncăapelează la creditele ipotecare pentru construcţii şicumpărarea locuinţelor, în timp ce în ţara noastră, cerereasolvabilă la aceste produse bancare reprezintă nu mai mult de7%. Toate acestea determină disproporţii respective înstructura portofoliilor de credite ale băncilor autohtone. Şi maimult, asupra structurii pasivelor şi activelor influenţează şispecificul pieţei financiare al economiei de tranziţie, deexemplu, orientarea băncilor spre piaţa „banilor scurţi”.
De asemenea, în condiţiile nefavorabile pentruintroducerea tehnologiilor informaţionale moderne îngestiunea fluxurilor financiare şi operaţiunilor concrete semanifestă încă un factor ce influenţează formarea strategieifinanciare. În ţările dezvoltate, aceste tehnologii cuprindtoaste aspectele activităţii bancare, de la sistemul global aldecontărilor interbancare (SWIFT) până la diferite tehnologiiInternet de colaborare cu clienţii în regim „on-line”.
Mai sunt şi aşa factori, ca specificul politicii financiare destat, specificul businessului autohton şi altele, care auinfluenţă esenţială asupra formării şi realizării strategieifinanciare a băncii.
Concluzii. Aşadar, strategia financiară a băncii estedeterminată de cerinţele teoriei generale a managementuluistrategic, dar cu specificarea domeniului de activitate. Cerinţaprincipală constă în determinarea paritetului relativ alintereselor financiare ale băncii ca un agent economic, aleclienţilor şi proprietarilor. Nerespectarea acestei cerinţeconduce la consecinţe negative grave. În primul rând,nerespectarea intereselor băncii ce se manifestă în retragereapermanentă a cotei principale a profitului net în favoareaproprietarilor, conduce la înrăutăţirea competitivităţii bănciipe piaţa deservită, ceea ce determină lipsa permanentă aresurselor pentru finanţarea dezvoltării strategice, de exemplu,introducerea tehnologiilor noi, realizarea programelor demarketing etc. Nerespectarea intereselor clienţilor în favoareamaximizării profitului conduce la reducerea segmentului
greatly influences the overall goals of the strategy,resulting in a lower level of ambition, attention to thegrowth rate of the capital, the need to optimize expensesetc.
This also influences the choice of specific methods inspecific areas of financial strategy. For example,domestic banks' lending policy does not require anypossibility of granting large loans or investments in keysectors of the real sector of the economy namely due toinsufficient capital. Broadcasting policy aimed atincreasing by force the capital of the bank puts in dangerthe owners in case of an unplanned replacement or loss offinancial independence from creditors.
Another factor that must be considered, is thedisproportion in the structure of assets and liabilities,which was formed under the influence of macroenvironment factors. A fundamental law of the marketeconomy leads to a direct dependence of the offer ofsolvent demand, and banking market is no exception.Domestic banks, from the start of their activity, haveformed a liabilities and assets structure, namely directingthis request, but their structure differs essentially fromforeign banks and their domestic banks. For example,there is demand for investment loans from domesticenterprises, but manifests solvent demand more from thesphere of circulation, but not in the real sector of theeconomy. Also, in Western countries, up to 65% of thepopulation capable of work, use and purchase mortgageloans for housing construction, while our country solventdemand for these types of products do not represent morethan 7%. All of these cause such disproportions in thestructure of loan portfolios of domestic banks. More, thestructure of assets and liabilities and the specific of thefinancial market influences and economic transition, egbanks to market orientation "short money".
Another factor that influences the formation offinancial strategy is manifested in unfavorable conditionsfor the introduction of modern information technologiesin the management of financial flows and concreteoperations. In developed countries these technologiesinclude all the aspects of banking, from global system ofinterbank settlements (SWIFT) to various Internettechnologies for collaborative arrangements withcustomers "on-line".
There are specific factors such as the financial policyof the state, local and other specific bussines who haveessential influence on the formation and implementationof the financial strategy of the bank.
Conclusions. Hence, the bank's financial strategy isdetermined by the requirements of the general theory ofstrategic management, but specifying the area of activity.The main requirement is to determine the relativeparitetof financial interests of the bank as a trader,customers and owners. Failure leads to serious negativeconsequences. First, the failure of bank interestsmanifested in the permanent withdrawal of the main shareof the net profit for the owners, leading to worseningcompetitiveness on the market of banking services,causing permanent lack of resources to finance strategicdevelopment, for example, the introduction of newtechnologies, program marketing etc. Failure to respect
ECONOMIE ŞI SOCIOLOGIE / ECONOMY AND SOCIOLOGY 59
Nr. 3 / 2013
deservit şi, ca urmare, la reducerea rezultatelor financiareobţinute. Nerespectarea intereselor proprietarilor, ce semanifestă în minimizarea sistematică a dividendelor, areurmătoarele consecinţe:
- reducerea posibilităţilor băncii de majorare a capitaluluisocial prin emisia suplementară a acţiunilor, care devinneatractive pentru potenţialii investitori;
- în perioadele deosebit de dificile, contribuie la reducereasemnificativă a acţionarilor şi la scăderea inevitabilă acursului acţiunilor pe piaţa valorilor mobiliare.
Altă cerinţă este legată de necesitatea asigurăriiflexibilităţii strategiei financiare cu posibilitatea ei de adoptarela schimbările inevitabile ale mediului extern şi care nuîntotdeauna pot fi prognozate, şi cu resursele disponibilepentru implementarea strategiei. În condiţiile economieinaţionale, această cerinţă este de actualitate sporită deoarece,la instabilitatea pieţei financiare, se adaugă şi corectărilepermanente ale politicii statului.
Altă cerinţă este determinată de caracterul complex alstrategiei financiare, toate direcţiile activităţii financiare sunt,în mare măsură, interdependente. Astfel, gestiunea proceselorde atragere şi de investire a resurselor trebuie să fie strictcoordonată după sumele, termenele şi ratele, ce se reflectă întoate politicile financiare ale băncii: în politica de gestiune alichidităţii, în politica ratelor dobânzii, politica de creditareetc. Dar trebuie de menţionat, că discordanţa scopurilorstrategice este tipică nu numai la nivelul subdiviziunilorbăncii, dar şi la nivelul diferitor direcţii ale activităţii băncii.Fără coordonarea respectivă, posibilitatea realizării lorpractică este imposibilă. Varianta optimală constă înasigurarea susţinerii reciproce continue în toate direcţiiledezvoltării strategiei financiare.
client's interests in favor of profit in the maximizationresults in the segment served and, therefore, reducefinancial results. Failure to respect the owners’ interestswho express interest in minimizing systematic dividendshave the following consequences:
- reducing the Bank's ability to increase capitalthrough issuing auxiliary actions that are unattractive topotential investors;
- in times of great hardship significantly reduceshareholders which becomes the inevitable decline in theshare price on the securities market.
Another requirement is related to the need for flexiblefinancial strategy thet can adapt to inevitable changes inthe external environment which can not always bepredicted, and the resources available to implement thestrategy. The national economy this requirement hasincreased because the current financial market instabilityand corrections added permanent state policy.
Another requirement is determined by the complexityof the financial strategy, all directions of financial activityare largely interdependent. The management process ofattracting investment and resources must be strictlycoordinated by the amounts, terms and rates, which arereflected in all the bank's financial policies: the policymanagement of liquidity, interest rate policy, creditpolicy, etc. But it should be noted that different strategicgoals are typical not only in the subdivisions of the bank,but in the bank's various lines of business as well.Without coordination, the possibility of their realization isvirtually impossible. Best option is to provide mutualsupport in all directions of the continuously developingfinancial strategy.
Referinţe bibliografice / References1. АЛАВЕРДОВ, А. Стратегический менеджмент в коммерческом банке. Москва: Маркет ДС, 2009. 576 с.
ISBN 978-5-94416-043-0.2. LYNCH, Richard. Strategia corporativă. Chişinău: ARC, 2002. 938 p. ISBN 9975612458.3. МОРОЗОВА, Т.Ю. Разработка эффективной стратегии банка. В: Управление в кредитной организации. 2011,
№ 4, июль-август [ accesat 25 mai 2013]. Disponibil: www.reglament.net/bank/mng/ 2011_ 4_article.htm4. POPA, Ion. Management strategic. Bucureşti: Ed. Economică, 2004. 328 p. ISBN 973-590-946-4.5. Regulamentul cu privire la suficienţa capitalului ponderat la risc, aprobat prin Hotărârea Consiliului de administraţie al
Băncii Naţionale a Moldovei: nr. 269 din 17.10.2001. In: Monitorul Oficial al Republicii Moldova. 2001, nr. 130, art.310.
6. BOGDAN, Ioan. Tratat de management financiar-bancar. Bucureşti: Ed. Economică, 2002. 920 p. ISBN9735906821.
7. ТУРБАНОВ, А., ТЮТЮННИК, А. Банковское дело. Операции, технологии, управление. Москва: АльпинаПаблишер, 2010. 688 с. ISBN 978-5-9614-1082-2.
8. ЛАВРУШИНА, О.И. Управление деятельностью коммерческого банка. Москва: Юристъ, 2003. 688 с. ISBN 5-7975-0549-5.
Recomandat spre publicare: 20.06.2013

Revistă teoretico-științifică / Theoretical and scientifical journal60
Nr. 3 / 2013
EVOLUŢIA CERERII ŞI OFERTEILA RESURSELE ENERGETICE
EVOLUTION OF THE DEMAND AND SUPPLYIN ENERGY RESOURCES
Silvestru MAXIMILIAN, dr. hab., ULIMCorina GRIBINCEA, drd., IEFS
Silvestru MAXIMILIAN, PhD, ULIMCorina GRIBINCEA, PhD student, IEFS
Evoluţia economică, socială şi politică a societăţii umanedin ultimele decenii a pus în prim plan problematicaresurselor naturale de care dispune globul terestru, oameniide ştiinţă punându-şi, cu tot mai multă seriozitate, întrebareaîn ce măsură aceste resurse vor putea susţine dezvoltareaeconomică şi în perspectivă, vor putea asigura hrana şisupravieţuirea unei populaţii în continuă creştere şi vor puteacontribui la eradicarea subdezvoltării. Accentuarea unorfenomene majore – explozia demografică, tendinţa deepuizare a unor resurse naturale, deteriorarea calităţiimediului, subdezvoltarea etc. – a fost şi este discutată cu totmai multă responsabilitate de către specialişti, elaborându-seun număr mare de prognoze pentru o perspectivă de duratăvariabilă. Tendinţa de epuizare a unor resurse naturale esteun alt fenomen pentru lumea contemporana şi care va deveni,în mod sigur, si mai accentuat în viitorul apropiat.Valorificarea tot mai intensă a unor resurse naturaleepuizabile, cu rezerve reduse, şi refacerea într-un ritm lent aunor resurse regenerabile ridică cu acuitate problemaconservării acestor resurse. În ultimele decenii, s-a accentuattendinţa de risipă a energiei şi a materiilor prime în societate.Se produc bunuri lipsite de o absolută utilitate, impuse în modartificial prin reclama sau prin oscilaţiile modei, iar multeproduse sunt concepute în aşa fel încât să dureze puţin,pentru a-l obliga pe cumpărător să le înlocuiască. Civilizaţiade "consum" este caracterizată ca o „societate care aruncă”,populaţia statelor dezvoltate (18% din populaţia globului)risipind sub forma de deşeuri 20 până la 25% din producţiamaterială a lumii. Consumul exagerat de materii prime şicombustibili a fost favorizat de preturile relativ reduse aleacestora, menţinute sub presiunea intereselor companiilortransnaţionale, preţuri care au defavorizat, în schimb, ţărileîn curs de dezvoltare. În consecinţă, consumul de materiiprime şi combustibili s-a orientat spre resursele cele mai uşoraccesibile, care au fost intens exploatate, abandonându-separţial unele resurse mai greu accesibile, care pot fiexploatate doar la un preţ relativ mai ridicat (de exemplu,cărbunii din vestul Europei). Un exemplu grăitor de epuizarea unei resurse care se regenerează cu greu şi în timpîndelungat este cel al exploatărilor neraţionale a petrolului şimaterialului lemnos din pădurile globului. Exploatarealemnului s-a accentuat în mod deosebit în ultimele decenii,odată cu creşterea consumului industrial şi în alte ramuri aleeconomiei, ajungând la peste 3 miliarde m3 şi depăşind într-omaniera foarte îngrijătoare nivelul capacităţii de regenerarenaturală (2,7 miliarde m3/an).
Cuvinte cheie: resurse energetice, cerere, ofertă,consum, produs intern brut.
Economic, social and political development of humansociety in recent decades put to the fore the issue ofnatural resources available to the earth; scientists areasking ever more seriously the question to what extentthese resources can support the economic development inthe future, can provide food and survival of a growingpopulation and will be able to contribute to theeradication of underdevelopment. The emphasis of majorevents – the population explosion, the trend of depletion ofnatural resources, environmental deterioration,underdevelopment etc. – was and it is still discussed withincreasing responsibility by specialists, being drafted alarge number of forecasts for a variable durationperspective. The trend of depletion of natural resources isanother phenomenon of the contemporary world and thatwill become, certainly, even more pronounced in the nearfuture. Harnessing the increasing exhaustible naturalresources with low reserves and a slow recovery ofrenewable resources raises acutely the issue regarding theconservation of these resources. In recent decades, thereis a tendency to waste energy and raw materials in thesociety. There are produced goods without an absoluteutility, being imposed artificially by advertising or fashionswings and many products are designed in such a way thatit takes little to compel the buyer to replace them. The"consumption" civilization is characterized as a "societythat throws" the population of developed countries (18%of world population) dispelling waste form 20 to 25% ofthe material production of the world. Excessiveconsumption of raw materials and fuel was favoured bytheir relatively low prices, maintained under the pressureof interests of transnational companies, prices thatdisfavoured, however, the developing countries.Consequently, consumption of raw materials and fuelturned to the easily accessible resources that have beenheavily exploited, partially abandoning some lessaccessible resources that can be exploited only at arelatively higher price (e.g. coal from Western Europe). Agood example of a resource exhaustion which regenerateshard and for a long time is the irrational exploitation ofoil and wood from forests of the earth. Wood exploitationhas increased especially in recent decades, with theincrease in industrial consumption and in other sectors ofthe economy, reaching over 3 billion m3 and overtaking ina worrying manner the natural regeneration capacity (2.7billion m3/year).
Keywords: energy, demand, supply, consumption,gross domestic product.
JEL Classification: L71, L60, O25
Introducere. Resursele energetice sunt în atenţia tuturorcercetătorilor ştiinţifici şi structurilor guvernamentale dintoate ţările. În perioada 1997-2012, consumul pe scarămondială a petrolului, gazului natural, cărbunelui, uraniuluis-a majorat, respectiv, de 1,7; 2,6; 1,9; 1,5 ori. Rezervelemondiale de petrol sunt concentrate în: Eurasia – 76,4%;
Introduction. Energy resources are monitored by allscientists, government structures in all countries. In theperiod 1997-2012, the global consumption of oil, naturalgas, coal, uranium increased, respectively by 1.7, 2.6, 1.9,1.5 times. Global oil reserves are focused in: Eurasia –76.4% Africa – 6.6%; America – 14.7% Australia – 0.3%;
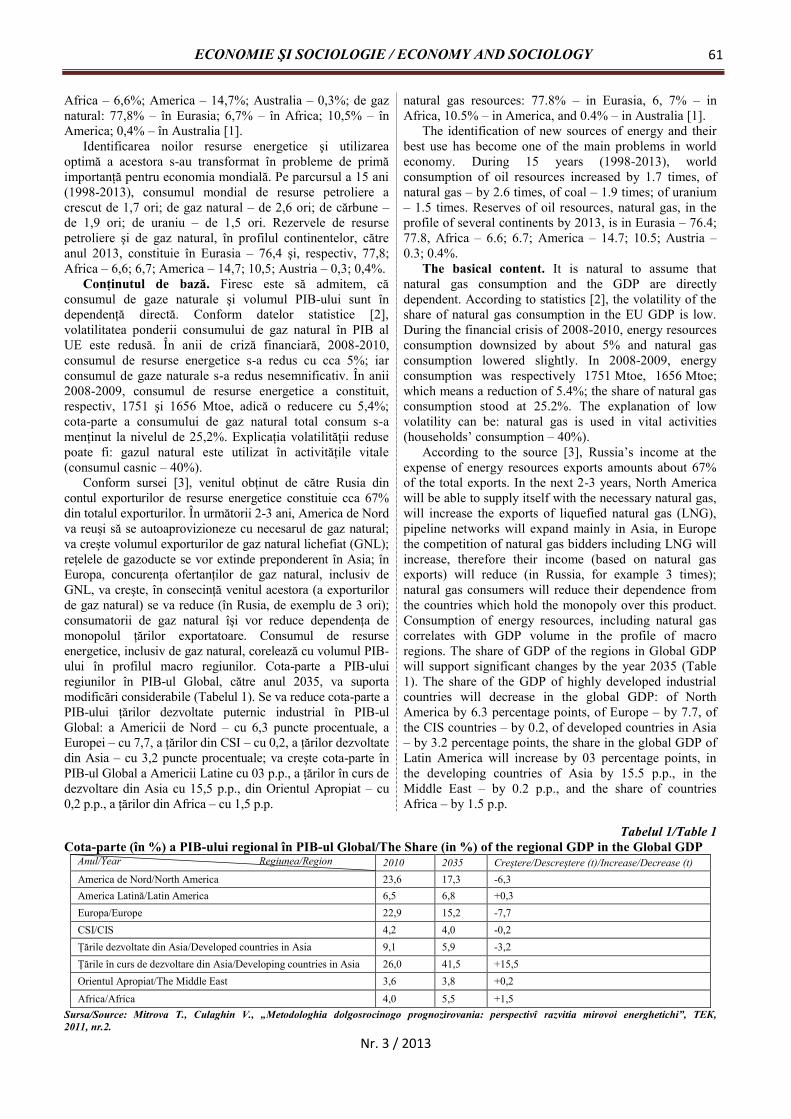
ECONOMIE ŞI SOCIOLOGIE / ECONOMY AND SOCIOLOGY 61
Nr. 3 / 2013
Africa – 6,6%; America – 14,7%; Australia – 0,3%; de gaznatural: 77,8% – în Eurasia; 6,7% – în Africa; 10,5% – înAmerica; 0,4% – în Australia [1].
Identificarea noilor resurse energetice şi utilizareaoptimă a acestora s-au transformat în probleme de primăimportanţă pentru economia mondială. Pe parcursul a 15 ani(1998-2013), consumul mondial de resurse petroliere acrescut de 1,7 ori; de gaz natural – de 2,6 ori; de cărbune –de 1,9 ori; de uraniu – de 1,5 ori. Rezervele de resursepetroliere şi de gaz natural, în profilul continentelor, cătreanul 2013, constituie în Eurasia – 76,4 şi, respectiv, 77,8;Africa – 6,6; 6,7; America – 14,7; 10,5; Austria – 0,3; 0,4%.
Conţinutul de bază. Firesc este să admitem, căconsumul de gaze naturale şi volumul PIB-ului sunt îndependenţă directă. Conform datelor statistice [2],volatilitatea ponderii consumului de gaz natural în PIB alUE este redusă. În anii de criză financiară, 2008-2010,consumul de resurse energetice s-a redus cu cca 5%; iarconsumul de gaze naturale s-a redus nesemnificativ. În anii2008-2009, consumul de resurse energetice a constituit,respectiv, 1751 şi 1656 Mtoe, adică o reducere cu 5,4%;cota-parte a consumului de gaz natural total consum s-amenţinut la nivelul de 25,2%. Explicaţia volatilităţii redusepoate fi: gazul natural este utilizat în activităţile vitale(consumul casnic – 40%).
Conform sursei [3], venitul obţinut de către Rusia dincontul exporturilor de resurse energetice constituie cca 67%din totalul exporturilor. În următorii 2-3 ani, America de Nordva reuşi să se autoaprovizioneze cu necesarul de gaz natural;va creşte volumul exporturilor de gaz natural lichefiat (GNL);reţelele de gazoducte se vor extinde preponderent în Asia; înEuropa, concurenţa ofertanţilor de gaz natural, inclusiv deGNL, va creşte, în consecinţă venitul acestora (a exporturilorde gaz natural) se va reduce (în Rusia, de exemplu de 3 ori);consumatorii de gaz natural îşi vor reduce dependenţa demonopolul ţărilor exportatoare. Consumul de resurseenergetice, inclusiv de gaz natural, corelează cu volumul PIB-ului în profilul macro regiunilor. Cota-parte a PIB-uluiregiunilor în PIB-ul Global, către anul 2035, va suportamodificări considerabile (Tabelul 1). Se va reduce cota-parte aPIB-ului ţărilor dezvoltate puternic industrial în PIB-ulGlobal: a Americii de Nord – cu 6,3 puncte procentuale, aEuropei – cu 7,7, a ţărilor din CSI – cu 0,2, a ţărilor dezvoltatedin Asia – cu 3,2 puncte procentuale; va creşte cota-parte înPIB-ul Global a Americii Latine cu 03 p.p., a ţărilor în curs dedezvoltare din Asia cu 15,5 p.p., din Orientul Apropiat – cu0,2 p.p., a ţărilor din Africa – cu 1,5 p.p.
natural gas resources: 77.8% – in Eurasia, 6, 7% – inAfrica, 10.5% – in America, and 0.4% – in Australia [1].
The identification of new sources of energy and theirbest use has become one of the main problems in worldeconomy. During 15 years (1998-2013), worldconsumption of oil resources increased by 1.7 times, ofnatural gas – by 2.6 times, of coal – 1.9 times; of uranium– 1.5 times. Reserves of oil resources, natural gas, in theprofile of several continents by 2013, is in Eurasia – 76.4;77.8, Africa – 6.6; 6.7; America – 14.7; 10.5; Austria –0.3; 0.4%.
The basical content. It is natural to assume thatnatural gas consumption and the GDP are directlydependent. According to statistics [2], the volatility of theshare of natural gas consumption in the EU GDP is low.During the financial crisis of 2008-2010, energy resourcesconsumption downsized by about 5% and natural gasconsumption lowered slightly. In 2008-2009, energyconsumption was respectively 1751 Mtoe, 1656 Mtoe;which means a reduction of 5.4%; the share of natural gasconsumption stood at 25.2%. The explanation of lowvolatility can be: natural gas is used in vital activities(households’ consumption – 40%).
According to the source [3], Russia’s income at theexpense of energy resources exports amounts about 67%of the total exports. In the next 2-3 years, North Americawill be able to supply itself with the necessary natural gas,will increase the exports of liquefied natural gas (LNG),pipeline networks will expand mainly in Asia, in Europethe competition of natural gas bidders including LNG willincrease, therefore their income (based on natural gasexports) will reduce (in Russia, for example 3 times);natural gas consumers will reduce their dependence fromthe countries which hold the monopoly over this product.Consumption of energy resources, including natural gascorrelates with GDP volume in the profile of macroregions. The share of GDP of the regions in Global GDPwill support significant changes by the year 2035 (Table1). The share of the GDP of highly developed industrialcountries will decrease in the global GDP: of NorthAmerica by 6.3 percentage points, of Europe – by 7.7, ofthe CIS countries – by 0.2, of developed countries in Asia– by 3.2 percentage points, the share in the global GDP ofLatin America will increase by 03 percentage points, inthe developing countries of Asia by 15.5 p.p., in theMiddle East – by 0.2 p.p., and the share of countriesAfrica – by 1.5 p.p.
Tabelul 1/Table 1Cota-parte (în %) a PIB-ului regional în PIB-ul Global/The Share (in %) of the regional GDP in the Global GDP
Anul/Year Regiunea/Region 2010 2035 Creştere/Descreştere (t)/Increase/Decrease (t)America de Nord/North America 23,6 17,3 -6,3America Latină/Latin America 6,5 6,8 +0,3Europa/Europe 22,9 15,2 -7,7CSI/CIS 4,2 4,0 -0,2Ţările dezvoltate din Asia/Developed countries in Asia 9,1 5,9 -3,2Ţările în curs de dezvoltare din Asia/Developing countries in Asia 26,0 41,5 +15,5Orientul Apropiat/The Middle East 3,6 3,8 +0,2
Africa/Africa 4,0 5,5 +1,5Sursa/Source: Mitrova T., Culaghin V., „Metodologhia dolgosrocinogo prognozirovania: perspectivî razvitia mirovoi energhetichi”, ТЕК,2011, nr.2.
Revistă teoretico-științifică / Theoretical and scientifical journal62
Nr. 3 / 2013
Aceste modificări cantitative nici pe departe nu mărturisescdespre dezvoltarea „furtunoasă”, de exemplu, a Chinei, Indiei şiBraziliei. Ţările, unde munca este ieftină, se transformă înpoligon de asamblare, fiind importatoare de tehnologii moraldepăşite în ţările industrial puternic dezvoltate, dar care pot fiprofitabile în condiţiile unei subremunerări a muncii. Aceste ţărivor avea un „avânt” în dezvoltarea economică în dependenţă devolumul de „gunoi tehnologic”. Cererea la produsele finite, înţările exploatatoare de tehnologii moral depăşite, se menţine înexclusivitate datorită numărului mare de locuitori şi nu creşteriiveniturilor muncitorilor.
În viitorul apropiat, America de Nord va trece laautoasigurare cu gaz-natural. Preţurile înalte la resurselepetroliere, deci şi la gazele naturale au contribuit laeficientizarea lucrărilor de punere în funcţiune a tot mai multestocuri subterane de gaze naturale; tehnologiile de lichefiere agazului natural au contribuit la reducerea comerţuluimonopolist al Rusiei, la apariţia pe piaţa UE a mai multorofertanţi de gaze naturale; preţurile înalte la gazele naturale aucreat premise pentru dezvoltarea în UE a tehnologiilor cu unconsum redus de resurse energetice.
Peste 10 ani, Rusia va putea comercializa numai 30% degaze naturale în UE, comparativ cu volumul de gaze exportat înanul 2013; preţurile la gazele naturale vor fi determinate decosturile marginale de producţie şi transport din alte ţări pentrugazele naturale lichefiate.
Preţul mediu anual de comercializare angro al benzinei afost de 13,91 lei/litru (+5,5%), al motorinei – 14,17 lei/litri(+4,5%), al gazului lichefiat – 7,5 lei/litru (+13,1%). Cuamănuntul au fost comercializate 616,211 t de produsepetroliere, inclusiv 210,053 t de benzină (-7,8%), 282,322 t demotorină (+2,1%), 123,837 t de gaz lichefiat (+4,3%). Preţulmediu de comercializare al benzinei a fost de 16,57 lei/litru(+5,3%), al motorinei – 15,69 lei/litru (+5,7%), al gazuluilichefiat – 8,47 lei/litru (+10,1%). Preţul de comercializare cuamănuntul, la fiecare tip de produse petroliere, s-a modificat de7 ani. În anul 2012, pe piaţa internă a produselor petroliere auactivat 124 de agenţi economici, care deţineau 196 de licenţe.Benzina şi motorina au fost comercializate prin intermediul a602 staţii de alimentare, gazul – prin 385 de staţii.
Comportamentul discriminatoriu al Rusiei pe piaţa de gaznatural poate fi atenuat de utilizarea tehnologiilor de lichefiere agazului natural. Gazul natural la temperatura de -160°C trece înformă lichidă, ocupă un volum de 600 de ori mai mic şi devinetransportabil la orice distanţe. În aceste condiţii, şi producătorul,şi consumatorul îşi pot definitiva parteneriatul în comerţul cugaze naturale. Actualmente, volumul gazului natural lichefiatconstituie peste 30% din volumul total de gaze exportate.Pentru Republica Moldova, ocolirea politicii discriminatorii dinpartea Rusiei poate fi realizată prin intermediul creşteriiimportanţei gazelor naturale din UE (UE dispune de drepturi dereexport de gaze naturale); prin importul gazului naturallichefiat din alte ţări; prin reducerea consumului de gazenaturale; prin creşterea resurselor energetice regenerabile. IdeeaRusiei de a iniţia un cartel al exportatorilor de gaze naturale,numit Gas Exporting Countries Forum (GECF), este mai multun „BRICS” imaginar, ipotetic, o „sperietoare” pentruconsumatorii de gaze naturale.
These quantitative changes do not testify by farthe "stormy" development, for example, of China, Indiaand Brazil. Countries where labor is cheap turn intoassembly polygons, importers of morally outdatedtechnology in highly developed industrial countries, butwhich can be profitable in low payment work conditions.These countries will have a "boom" in economicdevelopment depending on the amount of "technologicalgarbage". The request for final products in countriesexploiting morally outdated technologies maintainsexclusively on the large number of residents and not onthe income of workers.
In the near future, North America will switch to self-insurance with natural gas. High prices of oiland respectively, natural gas, have contributed to theimprovement of the works to operate more and moreunderground gas stocks, natural gas liquefactiontechnology have helped in the reduction of trademonopoly by Russia, to the emergence in the EUmarket of more natural gas providers; high prices fornatural gas have created conditions for the developmentin the EU of technologies with a low energy consumption.
In 10 years, Russia will be able to sell only 30% ofnatural gas in the EU compared to the volume of gasexported in 2013; natural gas prices will be determined bythe marginal costs of production and transport from othercountries for LNG.
Annual average wholesale price of gasoline was 13.91lei/liter (+5.5%), of diesel – 14.17 lei/liter (+4.5%),liquefied gas – 7.5 lei/liter (+13.1%). By retail were sold616.211 t of oil products, including 210.053 tons ofgasoline (-7.8%), 282.322 t of oil (+2.1%), 123.837 t ofliquefied gas (+4.3%). Average selling price of gasolinewas 16.57 lei/liter (5.3%), diesel – 15.69 lei/liter (5.7%),liquefied gas – 8.47 lei/liter (10.1%). Retail price on eachtype of petroleum products has changed for 7 years. In2012, in the domestic market of petroleum products, 124companies have activated, holding 196 licenses. Petroland diesel were sold through 602 filling stations, gas – by385 stations.
Russia's discriminatory behavior on the natural gasmarket can be mitigated by the use of natural gasliquefaction technologies. At a temperature of -160 ° Cnatural gas passes in liquid form, occupies a volume 600times smaller, and can be transported to any distance. Inthese circumstances, the producer and the final consumercan trade in a natural gas partnership. Currently, thevolume of LNG is 30% of the total volume of exportedgas. For Moldova, avoiding the Russian discriminatorypolicy can be achieved through the growing importance ofnatural gas in the EU (the EU has the right to re-exportnatural gas) by importing liquefied natural gas from othercountries; by reducing natural gas consumption; byincreasing renewable energy resources. Russia's idea tostart a cartel of gas exporters, called Gas ExportingCountries Forum (GECF) is more of an imaginary"BRICS", hypothetical, a "scarecrow" for natural gasconsumers.

ECONOMIE ŞI SOCIOLOGIE / ECONOMY AND SOCIOLOGY 63
Nr. 3 / 2013
Fig. 1. Interpretarea grafică a politicii Rusiei pe piaţa de comercializare a gazelor naturale în Republica Moldova/Fig. 1. Graphical Interpretation of the Russian policy on the market of natural gas trading in the Republic of Moldova
)2(R
)1(R MC,MC . În consecinţă, preţul monopolistului R
devine ;PR)1(
RRP devine ;P )1(R
)2(RP devine
)2(RP
unde .PPP R)1(
R)2(
R Costurile marginale deproducere şi transport ale gazelor în Republica Moldova,importate de către Rusia, sunt relativ mult mai reduse decâtcosturile similare ale altor producători de gaze (din UE, dinalte ţări). Explicaţia este simplă: Rusia a reuşit să dispună degazoductele din Republica Moldova; de reţelele de transportal gazelor, create pe timpurile Uniunii Sovietice; are oaşezare geografică favorabilă în livrarea gazelor naturale
către Republica Moldova. Costurile marginale RMC , laintersecţie cu funcţia venitului marginal, determină venitul
RR QP (suprafaţa RR GEPO ), care, în principiu, îiasigură Rusiei şi un profit considerabil. Însă, Rusia, fiind
monopolistă, majorează preţul la gazele naturale de la RP
la RR PP şi realizează supraprofitul RRR QPP (suprafaţa RR EGOP ). Din considerentegeopolitice, ideologice, de a impune Republicii Moldovaprobleme care ar putea fi soluţionate doar în cazul cândMoldova acceptă Uniunea Eurasiatică, Rusia suplimentează
funcţia costurilor marginale RMC cu tributuri politice până
la R)1(
R)2(
R MCMCMC , care determină preţurile
discriminative)3(
R)2(
R)1(
R P,P,P (Figura 1). Creştereapreţurilor la gazele naturale din Rusia mai poate fi exprimată
)2(R
)1(R MC,MC . Accordingly, the monopolist price R
becomes ;PR)1(
RRP becomes ;P )1(R
)2(RP becomes
)2(RP where .PPP R
)1(R
)2(R Marginal costs of
production and transport of gas in the Republic of Moldova,imported by Russia, are relatively much lower than similarcosts of other gas producers (from the EU and othercountries). The explanation is simple: Russia managed tohave pipelines in Moldova; networks for gas transportationcreated in the Soviet Union, and has a favorable geographicallocation in order to supply natural gas to Moldova. The
marginal costs RMC ; at the intersection with the function of
the marginal value determines revenue RR QP
(area RR GEPO ), which, in principle, provides Russia aconsiderable profit. But Russia, being a monopolist increases
the price of natural gas from RP to RR PP and
achieves over profits RRR QPP (area RR EGOP ).From geopolitical and ideological grounds, to impose to theRepublic of Moldovan problems which could be solved onlyif Moldova accepts to join the Eurasian Union, Russia
supplements the function of marginal cost RMC with
political tributes up to R)1(
R)2(
R MCMCMC
determining discriminative prices)3(
R)2(
R)1(
R P,P,P(Figure 1). Increasing gas prices by Russia can be expressed
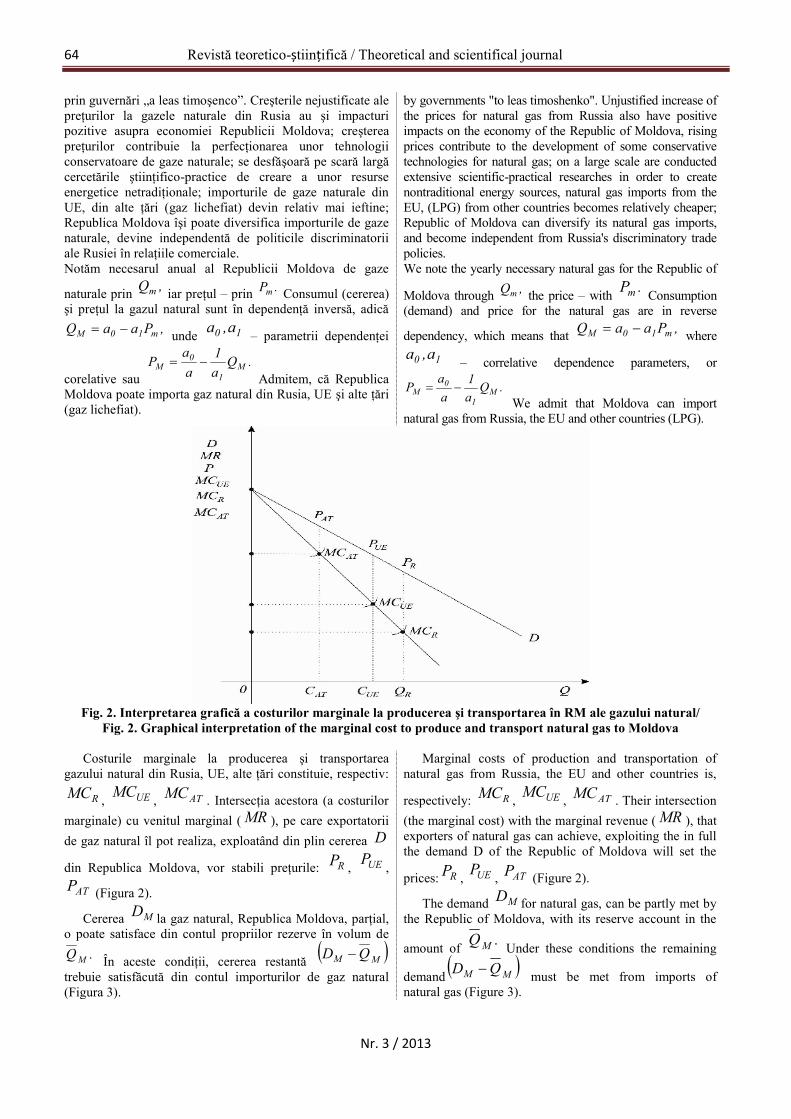
Revistă teoretico-științifică / Theoretical and scientifical journal64
Nr. 3 / 2013
prin guvernări „a leas timoşenco”. Creşterile nejustificate alepreţurilor la gazele naturale din Rusia au şi impacturipozitive asupra economiei Republicii Moldova; creştereapreţurilor contribuie la perfecţionarea unor tehnologiiconservatoare de gaze naturale; se desfăşoară pe scară largăcercetările ştiinţifico-practice de creare a unor resurseenergetice netradiţionale; importurile de gaze naturale dinUE, din alte ţări (gaz lichefiat) devin relativ mai ieftine;Republica Moldova îşi poate diversifica importurile de gazenaturale, devine independentă de politicile discriminatoriiale Rusiei în relaţiile comerciale.Notăm necesarul anual al Republicii Moldova de gaze
naturale prin ,Qm iar preţul – prin .Pm Consumul (cererea)şi preţul la gazul natural sunt în dependenţă inversă, adică
,PaaQ m10M unde 10 a,a – parametrii dependenţei
corelative sau.Q
a1
aa
P M1
0M
Admitem, că RepublicaMoldova poate importa gaz natural din Rusia, UE şi alte ţări(gaz lichefiat).
by governments "to leas timoshenko". Unjustified increase ofthe prices for natural gas from Russia also have positiveimpacts on the economy of the Republic of Moldova, risingprices contribute to the development of some conservativetechnologies for natural gas; on a large scale are conductedextensive scientific-practical researches in order to createnontraditional energy sources, natural gas imports from theEU, (LPG) from other countries becomes relatively cheaper;Republic of Moldova can diversify its natural gas imports,and become independent from Russia's discriminatory tradepolicies.We note the yearly necessary natural gas for the Republic of
Moldova through ,Qm the price – with .Pm Consumption(demand) and price for the natural gas are in reverse
dependency, which means that ,PaaQ m10M where
10 a,a – correlative dependence parameters, or
.Qa1
aa
P M1
0M
We admit that Moldova can importnatural gas from Russia, the EU and other countries (LPG).
Fig. 2. Interpretarea grafică a costurilor marginale la producerea şi transportarea în RM ale gazului natural/Fig. 2. Graphical interpretation of the marginal cost to produce and transport natural gas to Moldova
Costurile marginale la producerea şi transportareagazului natural din Rusia, UE, alte ţări constituie, respectiv:
RMC , UEMC , ATMC . Intersecţia acestora (a costurilormarginale) cu venitul marginal ( MR ), pe care exportatoriide gaz natural îl pot realiza, exploatând din plin cererea D
din Republica Moldova, vor stabili preţurile: RP , UEP ,
ATP (Figura 2).
Cererea MD la gaz natural, Republica Moldova, parţial,o poate satisface din contul propriilor rezerve în volum de
.Q M În aceste condiţii, cererea restantă MM QD trebuie satisfăcută din contul importurilor de gaz natural(Figura 3).
Marginal costs of production and transportation ofnatural gas from Russia, the EU and other countries is,
respectively: RMC , UEMC , ATMC . Their intersection(the marginal cost) with the marginal revenue ( MR ), thatexporters of natural gas can achieve, exploiting the in fullthe demand D of the Republic of Moldova will set the
prices: RP , UEP , ATP (Figure 2).
The demand MD for natural gas, can be partly met bythe Republic of Moldova, with its reserve account in the
amount of .QM Under these conditions the remaining
demand MM QD must be met from imports ofnatural gas (Figure 3).
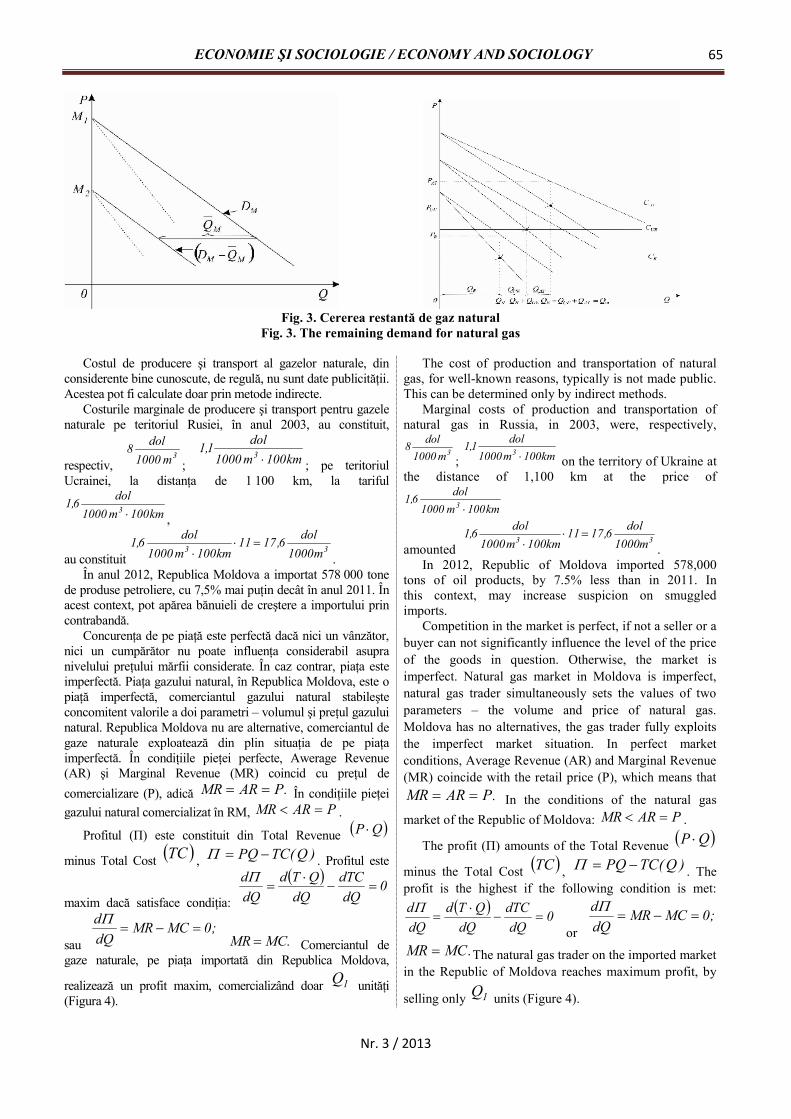
ECONOMIE ŞI SOCIOLOGIE / ECONOMY AND SOCIOLOGY 65
Nr. 3 / 2013
Fig. 3. Cererea restantă de gaz naturalFig. 3. The remaining demand for natural gas
Costul de producere şi transport al gazelor naturale, dinconsiderente bine cunoscute, de regulă, nu sunt date publicităţii.Acestea pot fi calculate doar prin metode indirecte.
Costurile marginale de producere şi transport pentru gazelenaturale pe teritoriul Rusiei, în anul 2003, au constituit,
respectiv,3m1000
dol8; km100m1000
dol1,1 3 ; pe teritoriulUcrainei, la distanţa de 1 100 km, la tariful
km100m1000dol6,1 3 ,
au constituit33 m1000
dol6,1711km100m1000
dol6,1 .
În anul 2012, Republica Moldova a importat 578 000 tonede produse petroliere, cu 7,5% mai puţin decât în anul 2011. Înacest context, pot apărea bănuieli de creştere a importului princontrabandă.
Concurenţa de pe piaţă este perfectă dacă nici un vânzător,nici un cumpărător nu poate influenţa considerabil asupranivelului preţului mărfii considerate. În caz contrar, piaţa esteimperfectă. Piaţa gazului natural, în Republica Moldova, este opiaţă imperfectă, comerciantul gazului natural stabileşteconcomitent valorile a doi parametri – volumul şi preţul gazuluinatural. Republica Moldova nu are alternative, comerciantul degaze naturale exploatează din plin situaţia de pe piaţaimperfectă. În condiţiile pieţei perfecte, Awerage Revenue(AR) şi Marginal Revenue (MR) coincid cu preţul decomercializare (P), adică .PARMR În condiţiile pieţeigazului natural comercializat în RM, PARMR .
Profitul (Π) este constituit din Total Revenue QP
minus Total Cost TC , )Q(TCPQ . Profitul este
maxim dacă satisface condiţia:
0dQ
dTCdQ
QTddQd
sau;0MCMR
dQd
.MCMR Comerciantul degaze naturale, pe piaţa importată din Republica Moldova,
realizează un profit maxim, comercializând doar 1Q unităţi(Figura 4).
The cost of production and transportation of naturalgas, for well-known reasons, typically is not made public.This can be determined only by indirect methods.
Marginal costs of production and transportation ofnatural gas in Russia, in 2003, were, respectively,
3m1000dol8
; km100m1000dol1,1 3 on the territory of Ukraine at
the distance of 1,100 km at the price of
km100m1000dol6,1 3
amounted33 m1000
dol6,1711km100m1000
dol6,1 .
In 2012, Republic of Moldova imported 578,000tons of oil products, by 7.5% less than in 2011. Inthis context, may increase suspicion on smuggledimports.
Competition in the market is perfect, if not a seller or abuyer can not significantly influence the level of the priceof the goods in question. Otherwise, the market isimperfect. Natural gas market in Moldova is imperfect,natural gas trader simultaneously sets the values of twoparameters – the volume and price of natural gas.Moldova has no alternatives, the gas trader fully exploitsthe imperfect market situation. In perfect marketconditions, Average Revenue (AR) and Marginal Revenue(MR) coincide with the retail price (P), which means that
.PARMR In the conditions of the natural gasmarket of the Republic of Moldova: PARMR .
The profit (Π) amounts of the Total Revenue QP
minus the Total Cost TC , )Q(TCPQ . Theprofit is the highest if the following condition is met:
0dQ
dTCdQ
QTddQd
or;0MCMR
dQd
.MCMR The natural gas trader on the imported marketin the Republic of Moldova reaches maximum profit, by
selling only 1Q units (Figure 4).
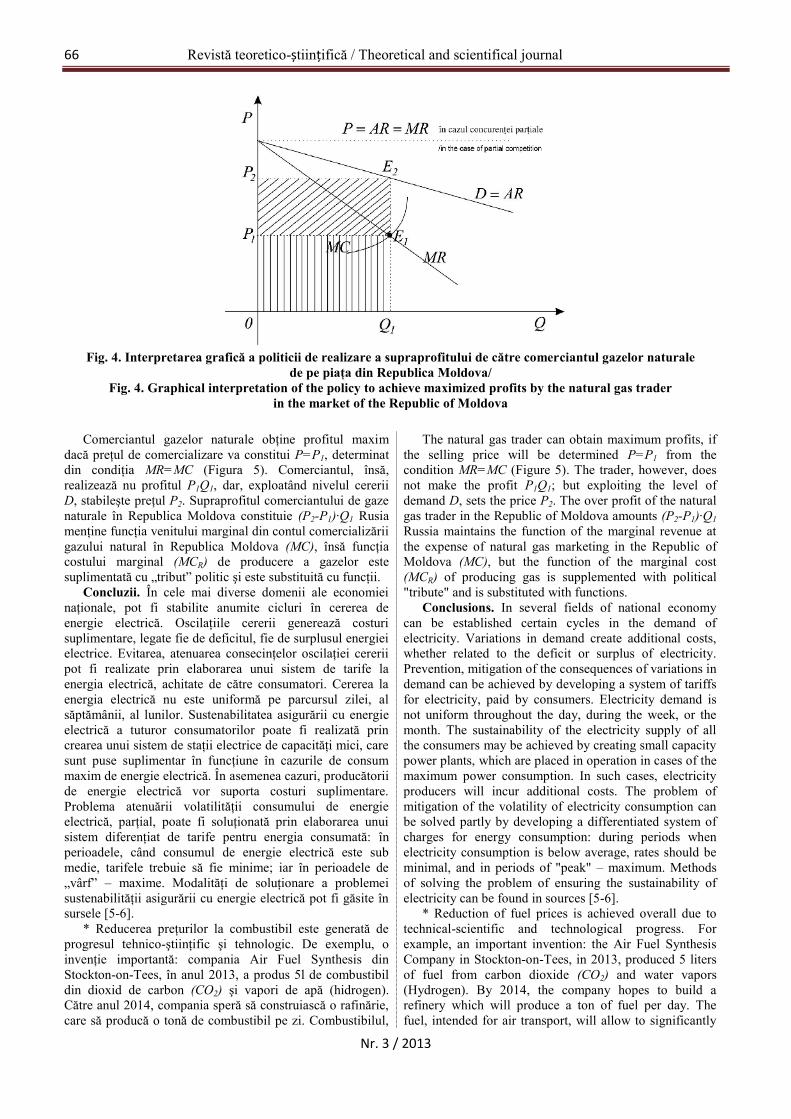
Revistă teoretico-științifică / Theoretical and scientifical journal66
Nr. 3 / 2013
Fig. 4. Interpretarea grafică a politicii de realizare a supraprofitului de către comerciantul gazelor naturalede pe piaţa din Republica Moldova/
Fig. 4. Graphical interpretation of the policy to achieve maximized profits by the natural gas traderin the market of the Republic of Moldova
Comerciantul gazelor naturale obţine profitul maximdacă preţul de comercializare va constitui P=P1, determinatdin condiţia MR=MC (Figura 5). Comerciantul, însă,realizează nu profitul P1Q1, dar, exploatând nivelul cereriiD, stabileşte preţul P2. Supraprofitul comerciantului de gazenaturale în Republica Moldova constituie (P2-P1)∙Q1 Rusiamenţine funcţia venitului marginal din contul comercializăriigazului natural în Republica Moldova (MC), însă funcţiacostului marginal (MCR) de producere a gazelor estesuplimentată cu „tribut” politic şi este substituită cu funcţii.
Concluzii. În cele mai diverse domenii ale economieinaţionale, pot fi stabilite anumite cicluri în cererea deenergie electrică. Oscilaţiile cererii generează costurisuplimentare, legate fie de deficitul, fie de surplusul energieielectrice. Evitarea, atenuarea consecinţelor oscilaţiei cereriipot fi realizate prin elaborarea unui sistem de tarife laenergia electrică, achitate de către consumatori. Cererea laenergia electrică nu este uniformă pe parcursul zilei, alsăptămânii, al lunilor. Sustenabilitatea asigurării cu energieelectrică a tuturor consumatorilor poate fi realizată princrearea unui sistem de staţii electrice de capacităţi mici, caresunt puse suplimentar în funcţiune în cazurile de consummaxim de energie electrică. În asemenea cazuri, producătoriide energie electrică vor suporta costuri suplimentare.Problema atenuării volatilităţii consumului de energieelectrică, parţial, poate fi soluţionată prin elaborarea unuisistem diferenţiat de tarife pentru energia consumată: înperioadele, când consumul de energie electrică este submedie, tarifele trebuie să fie minime; iar în perioadele de„vârf” – maxime. Modalităţi de soluţionare a problemeisustenabilităţii asigurării cu energie electrică pot fi găsite însursele [5-6].
* Reducerea preţurilor la combustibil este generată deprogresul tehnico-ştiinţific şi tehnologic. De exemplu, oinvenţie importantă: compania Air Fuel Synthesis dinStockton-on-Tees, în anul 2013, a produs 5l de combustibildin dioxid de carbon (CO2) şi vapori de apă (hidrogen).Către anul 2014, compania speră să construiască o rafinărie,care să producă o tonă de combustibil pe zi. Combustibilul,
The natural gas trader can obtain maximum profits, ifthe selling price will be determined P=P1 from thecondition MR=MC (Figure 5). The trader, however, doesnot make the profit P1Q1; but exploiting the level ofdemand D, sets the price P2. The over profit of the naturalgas trader in the Republic of Moldova amounts (P2-P1)∙Q1Russia maintains the function of the marginal revenue atthe expense of natural gas marketing in the Republic ofMoldova (MC), but the function of the marginal cost(MCR) of producing gas is supplemented with political"tribute" and is substituted with functions.
Conclusions. In several fields of national economycan be established certain cycles in the demand ofelectricity. Variations in demand create additional costs,whether related to the deficit or surplus of electricity.Prevention, mitigation of the consequences of variations indemand can be achieved by developing a system of tariffsfor electricity, paid by consumers. Electricity demand isnot uniform throughout the day, during the week, or themonth. The sustainability of the electricity supply of allthe consumers may be achieved by creating small capacitypower plants, which are placed in operation in cases of themaximum power consumption. In such cases, electricityproducers will incur additional costs. The problem ofmitigation of the volatility of electricity consumption canbe solved partly by developing a differentiated system ofcharges for energy consumption: during periods whenelectricity consumption is below average, rates should beminimal, and in periods of "peak" – maximum. Methodsof solving the problem of ensuring the sustainability ofelectricity can be found in sources [5-6].
* Reduction of fuel prices is achieved overall due totechnical-scientific and technological progress. Forexample, an important invention: the Air Fuel SynthesisCompany in Stockton-on-Tees, in 2013, produced 5 litersof fuel from carbon dioxide (CO2) and water vapors(Hydrogen). By 2014, the company hopes to build arefinery which will produce a ton of fuel per day. Thefuel, intended for air transport, will allow to significantly

ECONOMIE ŞI SOCIOLOGIE / ECONOMY AND SOCIOLOGY 67
Nr. 3 / 2013
destinat transportului aerian, va permite reducereaconsiderabilă a cererii la benzină „dulce” din ţările arabe,reducerea „amprentei de carbon” (CO2 din aer + H2 din apă= benzină).
reduce the demand for "sweet" gasoline in Arab countries,to reduce the "carbon footprint" (CO2 from air + H2 water= the gasoline).
Referinţe bibliografice / References1. КОЗЛОВСКИЙ, Е.А., КОМАРОВ, М.А., МАКРУШИНА, Р.М. Возможности сотрудничества БРИКС
в области топливно-энергетического комплекса. В: Вестник международных организаций. 2012, № 2,сс. 75-85.
2. СИМОНОВ, А.Г. Возможности повышения конкурентоспособности газовой промышленности. В:Вестник международных организаций. 2012, № 3, сс. 199-208.
3. МАКАРОВ, А.А., МИТРОВА, Т.А., КУЛАГИН, В.А. Долгосрочный прогноз развития энергетикимира в России. В: Экономический журнал ВШЭ. 2012, № 2, сс. 172-201.
4. МИТРОВА, А.А., КУЛАГИН, В. Методология долгосрочного прогнозирования: перспективыразвития мировой энергетики до 2030 г. В: ТЭК. Стратегии развития. 2011, № 2 [accesat 25 mai 2013].Disponibil: http://www.tek-russia.ru/issue/announces_8.html
5. MINASINGHE, M. Engineering – Economic Analysis of Electric Power Sistems [accesat 25 mai 2013].Disponibil: http://www.researchgate.net/publication/2996920_EngineeringEconomic_analysis_of_electric_power_systems
6. ГОРНШТЕЙН, В.М., ШТЕЙНГАУЗ, В.Е. Основы построения тарифов, стимулирующих работупотребителей в режиме выравнивания графиков нагрузки энергосистемы. В: Труды ВНИИЭ. 1972,вып. 40, сс. 5-20.
Recomandat spre publicare: 17.06.2013
Revistă teoretico-științifică / Theoretical and scientifical journal68
Nr. 3 / 2013
PROBLEMA DEFICITULUI RESURSELORINVESTIŢIONALE ÎN CONTEXTUL
DEZVOLTĂRII INOVATOARE A PRODUCERIIALIMENTELOR ÎN UCRAINA
THE PROBLEM OF INVESTMENT RESOURCESSCARCITY IN THE CONTEXT OF FOOD
PRODUCTION INNOVATION DEVELOPMENTIN UKRAINE
Nelya CHORNA, PhD, Profesor universitar,Universitatea Naţională Economică din Ternopil,
Departamentul Economie, organizare şi planificare înCAI, Ternopil, Ukraina
Nelya CHORNA, PhD, Associate Professor, TernopilNational Economic University, Department of
Economics, Organization and Planning in AIC, Ternopil,Ukraine
Articolul analizează starea modernă şi tendinţeleproblemei deficitului resurselor investiţionale în contextuldezvoltării producerii inovatoare de alimente în Ucraina.Sunt studiate dinamica şi caracteristicile regionale aleinvestiţiilor străine în agricultură şi în industria alimentară.Contradicţiile de bază, care rezultă din procesul dedezvoltare a investiţiilor în producţia de alimente, suntaccentuate pe baza experienţei interne şi externe.
The article analyzes the modern state and trends of theinvestment resources deficit decision problem in thecontext food production innovative development inUkraine. The dynamics and regional characteristics offoreign investment in agriculture and food industry arestudied. The basic contradictions which arise from theprocess of food production investment development areoutlined on the bases of domestic and foreign experience.
Cuvinte cheie: deficit, investiţii, dezvoltare, inovare,contradicţii, sfera producţiei de alimente.
Key words: deficit, investment, innovation development,contradictions, food production sphere.
JEL Classification:L5, L6, L15, O14, O25, O31UDC 338.439
Soluţia problemei. Cei mai mulţi dintre oamenii deştiinţă moderni din Ucraina şi reprezentanţii mediului deafaceri, lideri publici şi politicienii consideră că problemamajoră, care limitează dezvoltarea economică a ţării, încondiţiile actuale, este lipsa de investiţii în sectorul real aleconomiei. Pentru a rezolva această problemă au fostelaborate strategii, regulamente şi au fost implementateprograme de activitate, care au avut drept scop creştereafluxului, mai ales cel al investiţiilor străine în Ucraina. Înunele sectoare ale economiei, de fapt, facilitareainvestiţiilor de către stat a oferit rezultate pozitive, în timpce în altele, inclusiv în sfera producţiei de alimente seconstată în continuare deficitul critic al resurselorinvestiţionale. Trebuie remarcat faptul că problemadezvoltării investiţiilor în acest sector strategic şi importantal economiei pentru stat este de prim rang şi necesită oabordare echilibrată pentru a fi soluţionată.
The problem solution. Most of modern Ukrainianscientists and business representatives, public leadersand politicians quite properly consider the major problemthat restrains the country economic development in thepresent-day conditions, the lack of investment in the realeconomy sector. To solve this problem it was developedstrategies, regulations, the activity programs that wereaimed at increasing the flow, especially foreign investmentflow in Ukraine were implemented. In some economysectors, in fact, facilitation the investment by the stateprovided positive results, while others, including thefood production sphere it is still observed the criticaldeficit of investment resources. It should be noted that thevery problem of the investment development of thestrategic important economy sector for the state is multiple-valued and needs the balanced approach to the problemsolution.
Cele mai recente analize ale cercetărilor. Lucrărilemultor oameni de ştiinţă din ţară, precum V.G. Bodrov, V.F.Martynenko, E.K. Marchuk, T.V. Matsybora, V.G. Fedorenkoetc., sunt dedicate problemelor generale ale investiţiilor pentrudezvoltarea economică în Ucraina. Autorii arată esenţadezvoltării investiţiilor, în condiţiile actuale. Aceştia oferă, deasemenea, diferite modele pentru asigurarea securităţiicreşterii economice durabile a ţării.
În acelaşi timp, aspectele teoretice, metodologice şiaplicate ale formării politicii de investiţii în sfera producţiei dealimente în Ucraina, la nivel naţional şi regional, sunt încentrul atenţiei următorilor oameni de ştiinţă: M.S. Vitkov,M.D. Gylka, O.I. Goychuk, V.I. Kopytko, D.F. Krysanov,M.M. Odintsov etc. Ar trebui remarcat faptul, că analizaproblemei dezvoltării investiţiilor în ştiinţa producerii dealimente este la un stadiu incipient, care are legătură atât cudemonstrarea bazei teoretice şi metodologice a unor astfel destudii, cât şi accentuarea zonelor de soluţii practice pentruprobleme specifice.
The latest researches analysis. The works of manydomestic scientists, such as V.G. Bodrov, V.F.Martynenko, E.K. Marchuk, T.V. Matsybora, V.G.Fedorenko etc. are devoted to the general problems ofeconomic investment development in Ukraine. The authorsshow the essence of investment development in the currentconditions, they also offer its various models for thesecurity of sustainable national economic growth.
At the same time the theoretical, methodological andapplied aspects of investment policy formation in the foodproduction sphere in Ukraine at national and regional levelsare in the focus of the following scientists M.S. Vitkov,M.D. Gylka, O.I. Goychuk, V.I. Kopytko, D.F. Krysanov,M.M. Odintsov etc. It should be noted that the analysis ofthe investment development problem of food productionscience is at the early stage, which is connected with bothproving the theoretical and methodological foundations ofsuch studies and outlining the areas of practical solutions tospecific problems.
Setarea sarcinii. Scopul cercetării noastre este de a analiza Setting the task. The aim of our investigation is to

ECONOMIE ŞI SOCIOLOGIE / ECONOMY AND SOCIOLOGY 69
Nr. 3 / 2013
situaţia actuală şi tendinţele soluţiilor problenei deficitului deresurse de investiţii, în contextul dezvoltării inovatoare deproducţie alimentară în ţara noastră. Este important de a subliniaprincipalele contradicţii, care pot apărea la dezvoltarea deinvestitii a zonei investigate, pe baza experienţei naţionale şiinternaţionale.
analyze the current situation and trends solution ofinvestment resources deficit problems in the context of theinnovative food production development in our country. Itis important to outline the main contradictions that arisefrom the investment development of the investigated areaon the basis of national and international experience.
Materialul de bază. Resursele de investiţii, care determinănatura producţiei sociale moderne, sunt considerate un obiectintegral, care cuprinde, pe de o parte, stocuri, bani, putere şiresurse de muncă, iar pe de altă parte, resurse intelectuale,sociale, economice, politice, juridice, informaţionale şi debinefacere, care, în condiţii corespunzătoare, pot creşte sauscădea eficacitatea primei categorii enumerate şi astfel, trebuiesă fie utilizate pentru creştere [7].
Omul este liderul resurselor de investiţii, folosite în procesulsocial de producţie. Disponibilitatea abilităţilor şi cunoştinţelorspecifice, care sunt deţinute de către angajatul unei companiieste o resursă care ar trebui să fie transformată la potenţialul dedezvoltare al investiţiilor sociale [8].
V. Martinenko (2010) confirmă în mod corespunzător că, înprezent, principala problemă a economiei naţionale estesuspendarea exactă a reproducerii simple prin utilizareaineficientă a informaţiilor şi a resurselor de investiţiiintelectuale [7].
Pentru a reveni la problema generală a dezvoltăriiinvestiţiilor, se merită de remarcat implicarea în economianaţională, în special în sfera producţiei alimentare, a investiţiilorstrăine, care nu sunt întotdeauna un fenomen pozitiv.
În special, conform părerii D. Krysanov, investitorii străini,care fac investiţii în industria alimentară ucraineană au câtevaobiective principale:
- crearea producţiei interne de la zero, cu scopul de a ocupao poziţie dominantă pe piaţa internă a produselor alimentare şiîn rezultatul acesteia, în afara ţării;
- pătrunderea în industria alimentară a producătoruluiautohton până la distrugerea sa efectivă şi ocuparea unei poziţiimonopoliste sau preferenţiale pe piaţa produselor autohtone;
- stabilirea unei evaluări obiective a situaţiei reale din sferapolitică şi economică din ţară, prin organizarea acesteia pe bazăde capital propriu sau în cadrul acordurilor cu entităţile deafaceri mici din Ucraina [6].
De fapt, echilibrul între asigurarea competitivităţiiinternaţionale a industriei alimentare interne şi a securităţiialimentare a populaţiei este o problemă-cheie pentru dezvoltareainvestiţiilor în sfera producţiei de alimente.
Trebuie remarcat faptul că, în funcţie de tendinţele urgente,specifice dezvoltării atât în economia globală, cât şi în ceanaţională, care sunt cauzate de răspândirea societăţii post-industriale şi a cunoaşterii economiei, ar trebui, de asemenea, caabordările moderne ale securităţii alimentare să fie dezvoltate şiimplementate în pas cu inovaţiile. Trebuie să menţionăm că,sfera producţiei alimentare furnizează, de fapt, populaţia cunevoile de bază şi, în acelaşi timp, este caracterizată, probabil,de către cele mai dinamice şi diverse procese de producţie, carear trebui să utilizeze în mod activ soluţii tehnologice moderne,de dezvoltare, atât prin utilizarea materiei prime, cât şi prinprelucrarea acesteia, fabricarea produselor finaleşi prin promovarea de noi produse şi implementarea acestoradirect pe piaţă. În toate etapele provocării în dezvoltareaproducţiei alimentare inovatoare, de asemenea, ar trebuisă fie crucială securitatea alimentară maximă pentru
The basic material. The investment resources thatdetermine the nature of modern social production isconsidered as an integral object, comprising, on the onehand, stocks, money, power and labor resources, and on theother, social and economic, political, legal, informational,intellectual and humanity resources that under appropriateconditions can increase or decrease the effectiveness of thefirst and must be used for growth [7].
The human is leading investment resource, used in theprocess of social production. The availability of specificskills and knowledge which are possessed by the companyemployee is a resource that should to be converted to thesocial development investment potential [8].
V. Martinenko (2010) properly confirms that at present themain problem of the national economy is exact suspension ofthe simple reproduction through the inefficient use ofinformation and intellectual investment resources [7].
To revert to the investment development issue ingeneral, it is worth noting the involvement in the domesticeconomy, especially in the food production area, theforeign investment which is not always a positivephenomenon.
In particular, according to D. Krysanov, foreigninvestors by making investments in the Ukrainian foodindustry have several main objectives:
- the creation of in-house production from scratch withaim to occupy a dominant position in the domestic marketof food items and its outcome to overseas;
- the penetration in the food industry the domesticproducer to the actual destruction and monopolistic orpreferential market position occupation of domesticproducts;
- the setting objective evaluation of real political andeconomic situation in the country through the organizationon the basis of equity or under agreements with Ukrainiansmall business entity [6].
Actually of the balance between ensuring theinternational competitiveness of the domestic food industryand the population food security is the key problem for thefood production investment development sphere.
It should be noted that depending on the urgent trendsspecific development both global and national economieswhich are caused by the spread of post-industrial societyand the economy knowledge, the modern approaches to thefood security should also be developed and implemented incourse with the innovation. We have to say in fact, that thefood production sphere actually provides the populationwith basic needs and at the same time is characterized byperhaps the most dynamic and differentiated productionprocesses that should actively use the modern technologysolutions, development, both by using raw material, itsprocessing, end product manufacturing and by thepromotion of new products and their direct implementationto the market. At all stages of the food productioninnovation development challenge also should be the

Revistă teoretico-științifică / Theoretical and scientifical journal70
Nr. 3 / 2013
consumatorul final.Componenta economică a dezvoltării producţiei de alimente
inovatoare în cadrul modelului ideal ar trebui să fie combinatăorganic cu elementul social, care, în opinia noastră, este de bazăîn contextul siguranţei alimentare a populaţiei. Cu toate acestea,luând în considerare faptul că securitatea alimentară este adeseaconsiderată ca fiind una dintre componentele securităţiieconomice a statului, putem presupune existenţa unui conflictde interese şi responsabilităţi între securitatea alimentară apopulaţiei şi securitatea economică a statului. Astfel, investiţiilestrăine, în mod evident, în egală măsură cu efectul economicpozitiv, conţin o ameninţare semnificativă la adresa securităţiieconomice a statului.
Trebuie să menţionăm că investiţiile străine directe înproducţia de alimente din Ucraina este în creştere în ultimii anişi în anul 2012 a ajuns la aproape 3 miliarde de dolari (Fig. 1).
Analizând distribuţia de ISD între agricultură şi industriealimentară (Fig.2), putem observa un dezechilibru semnificativ,care este de aproape trei ori mai mare în preponderenţainvestiţiilor din industria alimentară, în comparaţie cu cele dinagricultură. Această situaţie nu este cu siguranţă propice pentrurenovarea facilităţilor de producere din agricultură şi estecauzată de rentabilitatea scăzută a producţiei agricole dinUcraina şi dezvoltarea slabă a afacerilor mari, ca fiind cele maiatractive investiţii din acest domeniu.
maximum food security for the final consumer.The economic component of the food production
innovative development within the ideal model should beorganically combined with social, which, in our opinion, isthe basic in the context of population food security.However, taking into consideration the fact that foodsecurity is often regarded as one of the state economicsecurity component, we can assume the existence of aconflict of interests and responsibilities between thepopulation food security and the state economic security asa whole. Thus, foreign investments, obviously, equallywith the positive economic effect, contain a significantthreat to the state economic security.
We have to mention that foreign direct investment inthe Ukrainian food production is growing in recent yearsand in 2012 it has reached almost $3 billion (Fig. 1).
Analyzing the distribution of FDI between agricultureand food industry (Fig. 2), we can observe a significantimbalance, which is almost triple in the investmentspredominance in the food industry in comparison withagriculture. This situation is certainly not conducive to theagriculture production renovation facilities and is causedby low profitability of agricultural production in Ukraineand poor development of big business as the most attractiveinvestment in this area.
0
500
1000
1500
2000
2500
3000
3500
2004 2005 2006 2007 2008 2009 2010 2011 2012
Fig.1. Investiţii străine directe în producerea alimentelor din Ucraina, mln USDFig. 1. Foreign direct investments in the food production of Ukraine, $ mln.
Sursa/ Source: Format conform [4]/ Formed according to [4].
0
500
1000
1500
2000
2500
2004 2005 2006 2007 2008 2009 2010 2011 2012
сільське господарство харчова промисловість
Agricultură/Agriculture Industria Alimentară/Food IndustryFig.2. Investiţii străine directe în agricultură şi în industria alimentară în Ucraina, mln. USD
Fig. 2. Foreign direct investments in agriculture and food industry in Ukraine, $ mln.Sursa/ Source: Format conform [4]/ Formed according to [4].
Structura teritorială a investiţiilor în producţia dealimente arată o diferenţiere regională clară (Fig. 3). Celemai atractive regiuni pentru investiţii deţin o bazăsuficientă de resurse naturale, cât şi o infrastructură binedezvoltată, inclusiv comercial. O anumită importanţă aatractivităţii investiţiilor regionale este, de asemenea,potenţialul lor social şi demografic.
The territorial structure of investments in foodproduction shows a clear regional differentiation (Fig. 3).The most attractive investment regions are as withsufficient natural resource base, so and with a well-developed infrastructure, including trade. Also the certainimportance for the attractiveness investment of regions isalso their social and demographic potential.

ECONOMIE ŞI SOCIOLOGIE / ECONOMY AND SOCIOLOGY 71
Nr. 3 / 2013
Fig.3. Investiţiile străine directe în producerea de alimente în regiunile UcraineiFig. 3. Foreign direct investment in the food production in the regions of Ukraine
Sursa/ Source: Format conform [4]/ Formed according to [4].
Rezumând rezultatele analizei investiţiilor în producţiade alimente în Ucraina şi luând în considerare rezultatelestudiilor anterioare a problemei, considerăm că eliminareadefectelor în dezvoltarea producţiei de alimente în Ucrainanecesită investiţii substanţiale pentru dezvoltarea producţieiagricole, inclusiv punerea în funcţie a fermelor dereproducere şi de seminţe, introducerea tehnologiiloragricole moderne şi crearea unei infrastructuri de piaţăperfectă. Cele mai prospere şi eficiente ca cost în situaţiaactuală sunt proiectele, care prevăd crearea unui lanţ integratpe verticală şi orizontală, îcepând cu producţia de materiiprime agricole până la prelucrarea profundă, în special îndomenii, precum producerea şi prelucrarea producţiei delapte, prelucrarea producţiei de carne şi a celei de legume,prelucrarea produselor de fructe şi boabe [9].
Summarizing the results of the investment analysis inthe food production in Ukraine and taking intoconsideration the results of the issue previous studies, webelieve that elimination the defects in the development offood production in Ukraine requires substantial investmentsfor the development of agricultural production, includingthe resumption of breeding and seed farms, introduction ofmodern farming technologies and creation a perfect marketinfrastructure. The most perspective and cost-effective inthe present situation are projects which foresee the creationof vertical and horizontal integrated chain from productionof agricultural raw materials to its deep processing,especially in the areas such as production and milkproduction processing and meat production processing andvegetable, fruits and berries products processing [9].
Concluzii. Astfel, resursele actuale de investiţii, întermeni moderni constituie forţa motrică a regiunilor şiţărilor în curs de dezvoltare socială şi economică. Cu toateacestea, tranziţia către o economie post-industrială aresurselor de investiţii se schimbă treptat. Informaţiile şiinvestiţiile intelectuale sunt cele mai importante iar lipsalor, în opinia noastră, a dus la regres în mai multe domeniiale sferei naţionale a producţiei alimentare. Aceastădezvoltare inovatoare în condiţiile economice moderne esteo investiţie domestică crucială în viitorul efectiv alsecurităţii industriei alimentare a Ucrainei.
Conclusions. Thus, the actual investment resources inthe modern terms constitute the driving force of regionsand countries social and economic development. However,the transition to a post-industrial economy of theinvestment resources is gradually changing. Theinformation and intellectual investment are the mostimportant and the lack of which is, in our opinion, led toregress in many areas of the food production nationalsphere. This innovative development in modern conditionsis the very domestic and crucial investment in the futureeffective food security of Ukraine.
Referinţe bibliografice / References1. ВИТКОВ, M.С. Розвиток інвестиційної політики в сільськогосподарському секторі України. В: Економіка АПК. 2010, №
3, сс. 54-57.2. ГИЛКА, M.Д. Залучення прямих іноземних інвестицій в оновлення основного капіталу в господарствах Чернівецької
області. В: Науковий вісник Чернівецького університету. 2010, вип. 495, сс. 105-109.3. ГОЙЧУК, О.І. Забезпечення продовольчої безпеки як головний пріоритет інвестиційної політики в АПК. В: Науковий
вісник Національного аграрного університету. Київ, 2010, вип. 154, ч. 1, сс. 91-95.3. Державна служба статистики України [accesat 25 martie 2013]. Disponibil: http://www.ukrstat.gov.ua/4. КОПИТКО, В.І., КІЧОР, В.П. Особливості розвитку інвестиційних процесів в агропромисловому комплексі. В: Науковий
вісник НЛТУ України: збірник науково-технічних праць. 2007, вип. 17.2, сс. 110-117.5. КРИСАНОВ, Д.Ф., БУЖИМСЬКА, К.О. Харчова промисловість україни в контексті розвитку національної інноваційної
системи. В: Вісник Хмельницького національного університету. 2009, № 5, том 1, сс. 58-66.6. МАРТИНЕНКО, В.Ф. Формування інвестиційних ресурсів суспільного розвитку [accesat 25 martie 2013]. Disponibil:
http://www.nbuv.gov.ua/portal/Soc_Gum/Nvamu_upravl/2010_3/13.pdf4. МАРЧУК, E.K. Украина: новая пападигма прогресса. Kиев: Aваллон, 2001. 224 с.7. ОДІНЦОВ, М.М., ОДІНЦОВ, О.М. Самозабезпечення як індикатор продовольчої безпеки [accesat 25 martie 2013].
Disponibil: http://economy.nayka.com.ua/index.php?operation=1&iid=509
Recomandat spre publicare: 16.04.2013
FDI per capita, 2011above 700501-700301-500201-300100-200< 100

Revistă teoretico-științifică / Theoretical and scientifical journal72
Nr. 3 / 2013
NECESITATEA DIMINUĂRIIBĂNCILOR-GIGANTE
NECESSITY TO DIMINISHTHE GIANT BANKS
Alexandru GRIBINCEA, dr.hab., prof.univ. ULIMGeorgeta GHERGHINA, drd., România
Alexandru GRIBINCEA, PhD, Associate Prof.,ULIMGeorgeta GHERGHINA, PhD student, România
Reglementările în sistemul bancar se află în vizorulautorităţilor de mai mulţi ani. Examinând datele din maimult de 80 de state ale lumii în perioada 1995-2009,sistemele bancare par a fi foarte concentrate. În multecazuri, băncile sunt într-atât de mari, încât fluctuaţiile decreştere a creditelor afectează macroeconomia.
The regulation of big banks has been in the spotlightfor many reasons. Examining evidence for more than 80countries for the years 1995-2009, banking systems areshown to be highly concentrated. In many cases, thebanks are so big that bank-specific credit-growthfluctuations affect the macroeconomy.
Cuvinte cheie: sistemul bancar, mega-bănci, credite,macroeconomie
Key words: banking, mega-banks, loans,macroeconomics
JEL Classification: D7, D8, E5, E44, E58
Introducere. Mega-băncile, relaxate cantitativ diminuărirestricţionale, a luat ca ostatici economia mondială şiguvernele principalelor ţări. Un grup de economişti germanipropune a reduce subvenţiile, a scoate speculaţiile riscante şia forţa crearea propriilor rezerve.
Conţinutul de bază. Recent, ţările dezvoltate au aprobato serie de măsuri pentru a limita impactul băncilor asupraeconomiei globale. Cerinţele Basel III restricţioneazăcerinţele vizând reglementarea privind lichiditatea în zonaeuro şi a aprobat deja regulile mecanismului unic desupraveghere a băncilor, ale căror active totale depăşesc 30miliarde EUR sau 20% din PIB-ul ţării.
Există mai multe diferite motive de ce dimensiunilebăncii sunt semnificative: băncile mari sunt mai puţin atene(prudente), pentru că sunt sigur că ei sunt "prea mari pentrua eşua", iar legăturile strânse între băncile mari şi politicieniar putea destabiliza întregul sistem financiar.
În ciuda unei serii de măsuri şi propuneri politice, studiidespre legătura dintre dimensiunea băncii şi rezultatelemacroeconomice sunt surprinzător de puţine, astfel încâtînţelegerea noastră a implicaţiilor prezenţei marilor băncirămâne limitată. Noi nu cunoaştem cât de mare este corelaţiadintre capitalul celor mai mari bănci şi economia ţării [1].Insă unele investigaţii efectuate de Francis Bremus dinInstitutul German de Cercetări Economice, Claudia BuchUniversitatea din Tübingen, Kathryn Russ de laUniversitatea din California, Davis şi Monika Schnitzer dela Universitatea din Munchen au examinat datele referitoarela sistemele bancare în mai mult de 80 de ţări pentru anii1995-2009 [2].
S-a dovedit că, în multe cazuri, băncile au fost atât demari, încât creşterea creditului gigantului a avut un impactdirect asupra economiei.
Fuziunile şi achiziţiile se intensifică în condiţii decriză
În economie există teoria de granulare: în cazul în careconcentrarea pieţei este mare, atunci fluctuaţiile de creştere aproducţiei industriale este proportională cu concentratiapieţei şi principalele fluctuaţii principalei companii de piaţă.Se adevereşte că creşterea concentraţiei de pe piaţă saufluctuaţiile companiei sporeşte fluctuaţii cumulative înîntreaga ramură.
Având în vedere gradul ridicat de concentrare în sectorulfinanciar, vom aplica acest concept în industria bancară în
Introduction. Mega-banks that are quantitativerelaxed to the restricted decreases, took as hostages theglobal economy and governments of the major countries.A group of German economists proposes to reducesubsidies, removing risky speculation and force creatingtheir own reserves.
Basic content. Recently, developed countries havetaken a series of measures to limit the impact of banks onthe global economy. Basel III requirements restrictrequirements regulating liquidity in the euro area andhave already approved the rules of the uniquemechanism of banks monitoring whose total assetsexceed 30 billion EUR or 20% of the country's GDP.
There are many different reasons why the bank size issignificant: large banks are less careful (conservative)because they are sure that they are "too big to fail" andthe close ties between big banks and politicians coulddestabilize the entire financialy system.
Despite this plethora of policy measures andpolicy proposals, studies of the link between bank sizeand macroeconomic outcomes are surprisingly few, soour understanding of the implications of the presence oflarge banks remains limited. We do not know how big isthe correlation between the capital of the largest banksand the country’s economy [1]. But some investigationmade by Francis Bremus from the German Institute forEconomic Research, Claudia Buch from University ofTübingen, Kathryn Russ from University of California,Davis and Monika Schnitzer from University of Munichhave examined data on banking systems in more than 80countries for the years 1995-2009 [2].
It turned out that in many cases, the banks were sobig that giant credit growth had a direct impact on theeconomy.
Mergers and acquisitions get intensified duringthe crisis
The theory of granularity really exists in theeconomy. In shows that if market concentration is high,aggregate fluctuations of output growth are proportionalto the product of market concentration and idiosyncratic,firm-level fluctuations. As a consequence, an increase ineither concentration or in firm-level fluctuationsincreases aggregate fluctuations.
Given the high degree of concentration in the
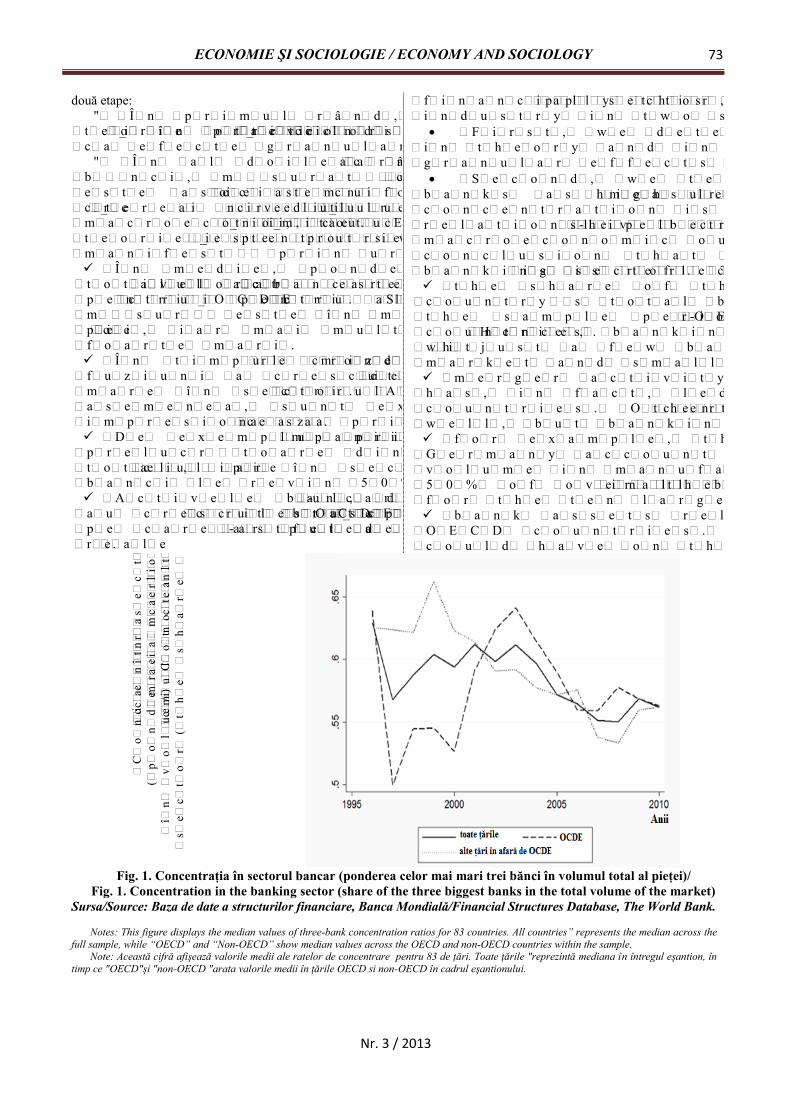
ECONOMIE ŞI SOCIOLOGIE / ECONOMY AND SOCIOLOGY 73
Nr. 3 / 2013
două etape:• În primul rând, vom determina dacă sectorul bancar în
teorie şi în practică se potriveşte condiţiilor necesare pentruca efecte granulare să apară;
• În al doilea rând, vom testa dacă prezenţa marilorbănci, măsurată de un nivel ridicat de concentrare a pieţeieste asociat cu o relaţie semnificativă statistică întrecreşterea nivelului creditului bancar şi rezultatelemacroeconomice. Economiştii, totuşi, au constatat că aceastăteorie este potrivită şi pentru sectorul bancar. Aceasta semanifestă prin următoarele aspecte: În medie, ponderea celor mai mari trei bănci din
totalul activelor bancare din ţară este mai mare de 50%pentru ţări OCDE şi pentru alte ţări. Sectorul în maremăsură este în mâinile câtorva bănci cu o cotă foarte mare apieţei, iar mai multe bănci mici coexista cu cele catevafoarte mari. În timpul crizei financiare mondiale, numărul de
fuziuni a crescut, ceea ce a condus la o concentraţie maimare în sectorul bancar în multe ţări. Alte industrii, deasemenea, sunt extrem de concentrate, dar cea bancarăimpresioneaza prin performanţa sa. De exemplu, primele zece companii din industria
prelucrătoare din Germania sunt de aproximativ 30% dintotalul pieţei, iar în sectorul bancar celor mai mari zecebanci le revin 50%. Activele bancare corelate cu PIB-ul, de asemenea,
au crescut brusc în ţările OCDE. Acesta sporeşte impactulpe care astfel de banci le-ar putea avea asupra economieireale.
financial sector, we apply this concept to the bankingindustry in two steps:
First, we determine whether the banking sectorin theory and in practice fits the necessary conditions forgranular effects to arise;
Second, we test whether the presence of bigbanks as measured by a high level of marketconcentration is associated with a statistically significantrelationship between bank-level credit growth andmacroeconomic outcomes. Economists have reached theconclusion that this theory is also suitable for thebanking sector. This is reflected in the following aspects: the share of the three largest banks’ assets in a
country’s total bank assets is larger than 50% throughoutthe sample period for both OECD and non-OECDcountries. Hence, banking sectors are highly concentratedwith just a few banks serving a very large share of themarket and small banks just live near the giant ones. merger activity during the global financial crisis
has, in fact, led to even higher concentration in manycountries. Other industries are highly concentrated aswell, but banking is impressive even in this context. for example, the top ten manufacturing firms in
Germany account for about 30% of the overall businessvolume in manufacturing compared to a share of roughly50% of overall business volume in the banking sectorfor the ten largest banks. bank assets related to GDP also rose sharply in
OECD countries. This increases the impact that bankcould have on the real economy.
Con
cent
raţia
în se
ctor
ul b
anca
r(p
onde
rea
celo
rmai
mar
i tre
i băn
ciîn
vol
umul
tota
l al p
ieţe
i)/ C
once
ntra
tion
in th
e ba
nkin
gse
ctor
(the
shar
e of
the
larg
est t
hree
ban
ks in
tota
l mar
ket)
Fig. 1. Concentraţia în sectorul bancar (ponderea celor mai mari trei bănci în volumul total al pieţei)/Fig. 1. Concentration in the banking sector (share of the three biggest banks in the total volume of the market)
Sursa/Source: Baza de date a structurilor financiare, Banca Mondială/Financial Structures Database, The World Bank.
Notes: This figure displays the median values of three-bank concentration ratios for 83 countries. All countries” represents the median across thefull sample, while “OECD” and “Non-OECD” show median values across the OECD and non-OECD countries within the sample.
Note: Această cifră afişează valorile medii ale ratelor de concentrare pentru 83 de ţări. Toate ţările "reprezintă mediana în întregul eşantion, întimp ce "OECD"şi "non-OECD "arata valorile medii în ţările OECD si non-OECD în cadrul eşantionului.
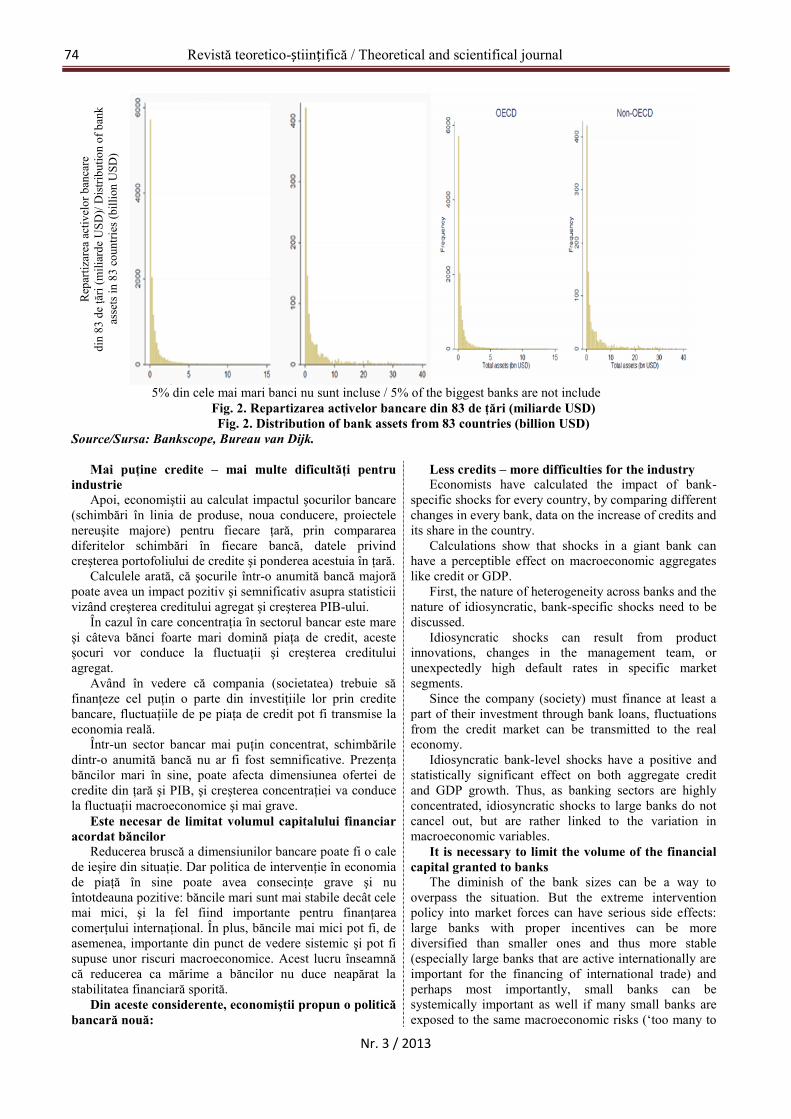
Revistă teoretico-științifică / Theoretical and scientifical journal74
Nr. 3 / 2013
Rep
artiz
area
act
ivel
or b
anca
redi
n 83
de
ţări
(mili
arde
USD
)/ D
istrib
utio
n of
ban
kas
sets
in 8
3 co
untri
es (b
illio
n U
SD)
5% din cele mai mari banci nu sunt incluse / 5% of the biggest banks are not includeFig. 2. Repartizarea activelor bancare din 83 de ţări (miliarde USD)Fig. 2. Distribution of bank assets from 83 countries (billion USD)
Source/Sursa: Bankscope, Bureau van Dijk.
Mai puţine credite – mai multe dificultăţi pentruindustrie
Apoi, economiştii au calculat impactul şocurilor bancare(schimbări în linia de produse, noua conducere, proiectelenereuşite majore) pentru fiecare ţară, prin comparareadiferitelor schimbări în fiecare bancă, datele privindcreşterea portofoliului de credite şi ponderea acestuia în ţară.
Calculele arată, că şocurile într-o anumită bancă majorăpoate avea un impact pozitiv şi semnificativ asupra statisticiivizând creşterea creditului agregat şi creşterea PIB-ului.
În cazul în care concentraţia în sectorul bancar este mareşi câteva bănci foarte mari domină piaţa de credit, acesteşocuri vor conduce la fluctuaţii şi creşterea credituluiagregat.
Având în vedere că compania (societatea) trebuie săfinanţeze cel puţin o parte din investiţiile lor prin creditebancare, fluctuaţiile de pe piaţa de credit pot fi transmise laeconomia reală.
Într-un sector bancar mai puţin concentrat, schimbăriledintr-o anumită bancă nu ar fi fost semnificative. Prezenţabăncilor mari în sine, poate afecta dimensiunea ofertei decredite din ţară şi PIB, şi creşterea concentraţiei va conducela fluctuaţii macroeconomice şi mai grave.
Este necesar de limitat volumul capitalului financiaracordat băncilor
Reducerea bruscă a dimensiunilor bancare poate fi o calede ieşire din situaţie. Dar politica de intervenţie în economiade piaţă în sine poate avea consecinţe grave şi nuîntotdeauna pozitive: băncile mari sunt mai stabile decât celemai mici, şi la fel fiind importante pentru finanţareacomerţului internaţional. În plus, băncile mai mici pot fi, deasemenea, importante din punct de vedere sistemic şi pot fisupuse unor riscuri macroeconomice. Acest lucru înseamnăcă reducerea ca mărime a băncilor nu duce neapărat lastabilitatea financiară sporită.
Din aceste considerente, economiştii propun o politicăbancară nouă:
Less credits – more difficulties for the industryEconomists have calculated the impact of bank-
specific shocks for every country, by comparing differentchanges in every bank, data on the increase of credits andits share in the country.
Calculations show that shocks in a giant bank canhave a perceptible effect on macroeconomic aggregateslike credit or GDP.
First, the nature of heterogeneity across banks and thenature of idiosyncratic, bank-specific shocks need to bediscussed.
Idiosyncratic shocks can result from productinnovations, changes in the management team, orunexpectedly high default rates in specific marketsegments.
Since the company (society) must finance at least apart of their investment through bank loans, fluctuationsfrom the credit market can be transmitted to the realeconomy.
Idiosyncratic bank-level shocks have a positive andstatistically significant effect on both aggregate creditand GDP growth. Thus, as banking sectors are highlyconcentrated, idiosyncratic shocks to large banks do notcancel out, but are rather linked to the variation inmacroeconomic variables.
It is necessary to limit the volume of the financialcapital granted to banks
The diminish of the bank sizes can be a way tooverpass the situation. But the extreme interventionpolicy into market forces can have serious side effects:large banks with proper incentives can be morediversified than smaller ones and thus more stable(especially large banks that are active internationally areimportant for the financing of international trade) andperhaps most importantly, small banks can besystemically important as well if many small banks areexposed to the same macroeconomic risks (‘too many to

ECONOMIE ŞI SOCIOLOGIE / ECONOMY AND SOCIOLOGY 75
Nr. 3 / 2013
• În primul rând, este necesar de a reduce stimulentelepentru jocuri de noroc riscante pentru băncile mari. În acestcaz, şocurile pentru bănci vor fi diminutive, precum şiimpactul acestora asupra economiei. Există necesitatea de adezvolta un sistem de monitorizare şi promovare (stimulare)a propriului capital, inclusiv de a reduce subvenţiileguvernamentale acordate băncilor.
• În al doilea rând, cu cât mai mare este "airbagul" pentruriscurile bancare, cu atât mai puţin grave sunt consecinţeleşocurilor interne pentru macroeconomie. Această problemăpoate fi rezolvată parţial de Basel III şi normele privindadecvarea capitalului, însă nu ne oprim la acestea.
• În al treilea rând, reducerea concentrărilor în sectorulbancar poate atenua efectele perturbării majore în băncileimportante. Politica concurenţială joacă un rol important:giganţii bancari nu ar trebui ajutaţi într-o situaţie dificilă, iaractivele instituţiilor falimentate nu trebuie date băncilormari, ci lichidate.
Concluzii. Autorităţile reglementatoare ar trebui să evitesusţinerea băncilor mari de a devini tot mai mari. Prinurmare, analizând fuziunile bancare din punctul de vedere alputerii pe piaţă sau de împrumut, în mod sistematic, estesubestimat impactul acestora asupra economiei în ansamblu.Unul dintre motive este că se iau în considerare implicaţiilefuziunilor în total pentru dimensiunea fluctuaţiilor viitoareale ofertei de credite agregate şi PIB.
fail’). Hence, a reduction of bank sizes may notnecessarily bring about higher financial stability.
For these reasons, we advocate a more balancedapproach to policymaking:
• First, reducing the risk-taking incentives of largerbanks and thus the magnitude of idiosyncratic shocks willlimit granular effects. These reduced risk-taking incentivescan arise through changes in the governance structure ofbanks, enhancing monitoring incentives of equity owners,and also from reduced public subsidies to banks.
• Second, the higher the risk-buffers of the banksthemselves, the less severe are the implications ofidiosyncratic shocks for the macroeconomy. This hasbeen acknowledged in the new capital adequacyregulation under Basel III and norms regarding thecapital requirements, but we don not stop only at them.
• Third, reduced concentration in the banking sectorcould be a means of mitigating granular effects. Hence,competition policy has an important role to play.
Conclusions. Regulators should avoid helping thebig banks to get bigger. In short, analysing bank mergersonly in terms of market power or loan pricingsystematically underestimates their impact for the overalleconomy. One reason is that it overlooks theimplications of mergers en totem for the size of futurefluctuations in the aggregate credit supply and GDP.
Referinţe bibliografice / References1. ACHARYA, V.V., STEFFEN, S. Analyzing systemic risk of the European banking sector. 2012 [accesat 5 mai
2013]. Disponibil: http://pages.stern.nyu.edu/~sternfin/vacharya/public_html/pdfs/AcharyaSteffen_systemic-risk-EU.pdf
2. ADRIAN, T., BRUNNERMEIER, M. CoVaR. In: Working Paper. NBER. 2011, no. 17454, october, pp. 1-45.3. AMITI, M., WEINSTEIN, D.E. How much do bank shocks affect investment? Evidence from matched bank-firm
loan data. 2013. 47 p. [accesat 5 mai 2013]. Disponibil: http://www.nber.org/papers/w18890.pdf?new_window=14. ASHCRAFT, A., DUFFIE, D. Systemic illiquidity in the federal funds market. In: American Economic
Review. 2007, vol. 97, issue 2, pp. 221-225.5. BECK, T., DEMIRGÜÇ-KUNT, A. Financial Institutions and Markets Across Countries and over Time: Data and
Analysis. 2009 [accesat 5 mai 2013]. Disponibil: http://siteresources.worldbank.org/INTRES/Resources/469232-1107449512766/Financial_Institutions_and_Markets_across_Countries.pdf
6. BREMUS, F., BUCH, C., RUSS, K., SCHNITZER, M. Big Banks and Macroeconomic Outcomes: Theory andCross-Country Evidence of Granularity. 2013. 42 p. [accesat 5 mai 2013]. Disponibil:http://www.nber.org/papers/w19093.pdf?new_window=1
7. CALDERON, C., SCHAECK, K. Bank Bailouts, Competition, and the Disparate Effects for Borrower andDepositor Welfare. 2013. 50 p. [accesat 5 mai 2013]. Disponibil: http://www.ebs.edu/fileadmin/redakteur/funkt.dept.economics/Colloquium/Papers_FT_2012/Calderon_Schaeck_ EBS_BBK_December_2012.pdf
8. ČIHÁK, M., DEMIRGÜÇ-KUNT, A., FEYEN, E., LEVINE, R. Benchmarking Financial Development Around theWorld. 2012, august. 58 p. [accesat 5 mai 2013]. Disponibil: http://www-wds.worldbank.org/servlet/WDSContentServer/WDSP/IB/2012/08/31/000158349_20120831220007/Rendered/PDF/wps6175.pdf
9. CORBAE, D., D'ERASMO, P.A Quantitative Model of Banking Industry Dynamics. 2013. 74 p. [accesat 5 mai2013]. Disponibil: http://www.econ.nyu.edu/user/galed/fewpapers/FEW%20S13/Corbae-D%27Erasmo.pdf
10. DI GIOVANNI, J., LEVCHENKO, A.A. Country Size, International Trade, and Aggregate Fluctuations in GranularEconomies. In: Journal of Political Economy. 2012, vol. 120, issue 6, pp. 1083-1132.
11. GABAIX, X. The Granular Origins of Aggregate Fluctuations. In: Econometrica. 2011, vol. 79, issue 3, pp. 733-772.
12. HALE, G. Bank relationships, business cycles, and financial crises. In: Journal of International Economics.2012, vol. 88, issue 2, november, pp. 312-325.
13. JOHNSON, S., KWAK, J. 13 bankers: the Wall-Street takeover and the next financial meltdown. New York: KnopfDoubleday Publishing Group, 2010. 240 p. ISBN 9780307379221.
14. Neunzehntes Hauptgutachten der Monopolkommission 2010/2011 [accesat 5 mai 2013]. Disponibil:http://www.cducsu.de/Titel__neunzehntes_hauptgutachten_der_monopolkommission_2010_2011/TabID__1/SubTabID__2/InhaltTypID__12/InhaltID__5521/inhalte.aspx
Revistă teoretico-științifică / Theoretical and scientifical journal76
Nr. 3 / 2013
15. OECD. Competition, Concentration and Stability in the Banking Sector. 2010. 366 p. [accesat 5 mai 2013].Disponibil: http://www.oecd.org/regreform/sectors/46040053.pdf
16. TARASHEV, N., BORIO, C., TSATSARONIS, K. The systemic importance of financial institutions [accesat 5 mai2013]. Disponibil: http://www.bis.org/publ/qtrpdf/r_qt0909h.pdf
17. TARASHEV, N., BORIO, C., TSATSARONIS, K. Attributing systemic risk to individual institutions. 2010[accesat 5 mai 2013]. Disponibil: http://www.bis.org/repofficepubl/hkimr201007.04.pdf
18. BREMUS, F., BUCH, C.M., RUSS, K., SCHNITZER, M. Big banks and macroeconomic outcomes. 2013, 10 july[accesat 5 mai 2013]. Disponibil: http:// www. interfax. by/ article/ 103352
Recomandat spre publicare: 20.07.2013
ECONOMIE ŞI SOCIOLOGIE / ECONOMY AND SOCIOLOGY 77
Nr. 3 / 2013
APLICAREA EXPERIENŢEI MONDIALEÎN FORMAREA ŞI DEZVOLTAREAPOTENŢIALULUI FINANCIAR AL
GOSPODĂRIILOR CASNICE
Oxana KOVTUN, dr., docent,Universitatea Est-Europeană de Economie
şi Management, Cherkasy, Ucraina
THE WORLD EXPERIENCE APPLICATIONFOR THE FORMATION AND DEVELOPMENT
OF FINANCIAL POTENTIALOF HOUSEHOLDS
Oksana KOVTUN, PhD in Public Administration,docent, East European University of Economics
and Management, Cherkasy, Ukraine
În articol este prezentată baza de resurse de formare apotenţialului financiar al gospodăriilor casnice altor ţări şimecanismele de dezvoltare cu ajutorul instrumentelorsistemelor de pensionare şi fiscale, precum şi ale ipotecii.Sunt analizate instrumentele moderne principale de formareşi dezvoltare a potenţialului financiar al gospodăriilorcasnice din Statele Unite ale Americii, Uniunea Europeanăşi ţările spaţiului postsovietic. Este justificat faptul, căaplicarea experienţei mondiale trebuie implementată înpractica autohtonă treptat, separând mecanismele şiinstrumentele existente conform gradului de posibilitate aimplementării lor în Ucraina.
Cuvinte cheie: gospodărie casnică, potenţial financiar,imobil, impozite, conturi de pensii, transferuri, ipotecă,instrumente financiare.
The article considers the resource base of thefinancial potential of the households in foreign countriesand the mechanisms of its development with theinstruments of the pension and tax systems, as well asmortgages. The current basic tools of the formation anddevelopment of the financial potential of the U.S.households, the households of the European Union andthe former Soviet Union countries are analyzed. Oneproves that the use of foreign experience should beintroduced gradually in Ukrainian practice, dividing thepresent mechanisms and instruments for raising thepossibility of their implementation in Ukraine.
Keywords: household, financial potential, realestate, taxes, retirement accounts, transfers, mortgages,financial instruments.
JEL Classification: G21, G23, R20, F24
IntroductionThe experience of the developed countries and the theory
of the market economy evolution says that the raise offinancial potential of households contributes to thestabilization of the state financial system. Therefore, oneneeds the study and use of the present foreign experienceregarding to the formation and development of the financialpotential of the population. That requires a scientific in-depth study.
In each country there is a certain socio-economicmechanism that allow forming of the effective anddeveloped financial potential of households. For furtherresearch this item one needs to examine the particularqualities of the formation and instruments of thedevelopment for financial potential of households indeveloped economic systems, as well as in some countrieswith emerging market system. That goal is to highlight thosefeatures and instruments for using in domestic practice.
The basic contentThe Z.1 «Flow of Funds Accounts» report by the U.S.
Federal Reserve System [9] states the household net worthand non-profit organizations net worth is $66 trillion, thereal estate is 22% of household`s assets, and the mortgageloans ($9.4 trillion, 70%) is the lion's share of the liabilities.That is, the real estate is the main asset for U.S. households,and the mortgage is the principal liability for the vastmajority of the U.S. population.
The volume of financial potential certainly depends onthe level of households` income by various sources, namely:wages, social transfers, property income, income byoperations in the financial market, etc.
The analyzed monetary income of European householdsreveals that, firstly, the level of income varies by countries,
and, secondly, there are huge differences in the ratio ofthe minimum and maximum amount of incomecharacterizing the development of the pension and taxsystems [6]. By analysis of the level of financialpotential one needs to consider the degree ofdevelopment of financial markets and the stateregulatory environment, as well as housing, andaccordingly, the existence of a variety of mortgageinstruments and programs.
The statistics state that in Germany real estate ownsapproximately 48% of all households, which tend tohave one type of housing in the family (29%) or a shareof property (13%), or a two-family house (5%).Therefore, the most of funds of households in Germanyis not invested in real estate, and financial assets. This isexplained by the existence of an effective system ofmortgage financing [5].
Higher level of disposable income in the countryreflects the effective state policy of incomeredistribution, provides additional opportunities toincrease household income of the family budget throughthe development of the state ensure of the public goodsprovision. First of all, it concerns the formation of aneffective pension system (including the problem ofglobal aging), the tax burden on the population andhousing arrangements, and the availability of developedfinancial service markets.
The existing instruments allowed households inforeign countries to effectively form their financialpotential could be grouped as: fiscal, transfer, mortgageand finance one.
The fiscal instruments used in foreign countries areshown in Table 1.

Revistă teoretico-științifică / Theoretical and scientifical journal78
Nr. 3 / 2013
Table 1Fiscal instruments for financial potential of households in foreign countriesUSA EU countries Emerging market countries
corporate retirement accountsand plans are not taxed onincome, at withdrawal of plansa system of deferred taxation isused;
corporate pensioncompensation, stock optionplans with tax exemption;
no such mechanism;
the functioning tax system ofaggregate family income lessexpenditure of householdsaccording to legislation;
family taxation consideringtax benefits applied tofamilies with children;
individual taxation;
the progressive tax scaleprovided a minimum tax baseand five tax rates;
the progressive tax scale isable to allocate tax classesusing tables and charts(Germany);
flat tax rate on individual income(higher rate of certain statutoryincome);
tax credits for families hadchildren up to 17 years
different size non-taxableminimum base for singleand couples
tax credits for land-tax and realestate tax for families with threeor more underage and otherprivileged categories of citizens(Ukraine)
Comparing the existing fiscal instruments in differentforeign countries, the taxation system of individuals differstax base (individual income of each household member andaggregate income), tax credits, tax administration withretirement accounts must be noted. So when borrowingsome fiscal instruments one should consider the peculiaritiesof the national tax system, tax law, tax administration, as
well as the possibility of a rapid transformation of all ofthe above elements.
The qualities of transfer policy in some foreigncountries are shown in Table 2.
The data in Table 2 show that in the EU a socialcomponent, regulated by the state, is more meaningfulthan the U.S. one.
Table 2Transfer policy instruments of foreign countries studied
USA EU countries Emerging market countries corporate retirement accounts
and plans 410 (k) or TSP; private transfer payments
(pensions); Russia is planning the
introduction of specific targetretirement accounts;
individual retirementaccounts IRA or Keogh;
existence of corporate pensioncompensation, option plans, forinstance, providing employeesshare of ownership (ShareIncentive Plan);
social transfers (state pension, allkinds of social assistance,benefits);
additional opportunity toinvest in financial and non-financial assets out ofindividual retirementaccounts
social transfers (state pension, allkinds of social assistancebenefits)
aid for children or maintainedfamily members does not affecttax rates
In the USA every individual has to choose themechanism of formation of the pension program using a setof specific instruments.
That, in the USA, Canada, the UK, Japan and otherdeveloped countries, there is the formation of the assets inthe pension system by means of individual accounts andretirement plans. In Poland, the Czech Republic, Hungary,Estonia, Turkey, the Russian Federation, the thirdcomponent of the pension system is implemented mainly
through specialized funds [3].In the USA there is the most developed stock
market, so households with varying degrees of networth are able to carry out transactions with securitiesusing commercially available instruments. The analysisof existing financial instruments in the differentcountries, by which the household is able toenhance their financial potential, is carried out inTable 3.
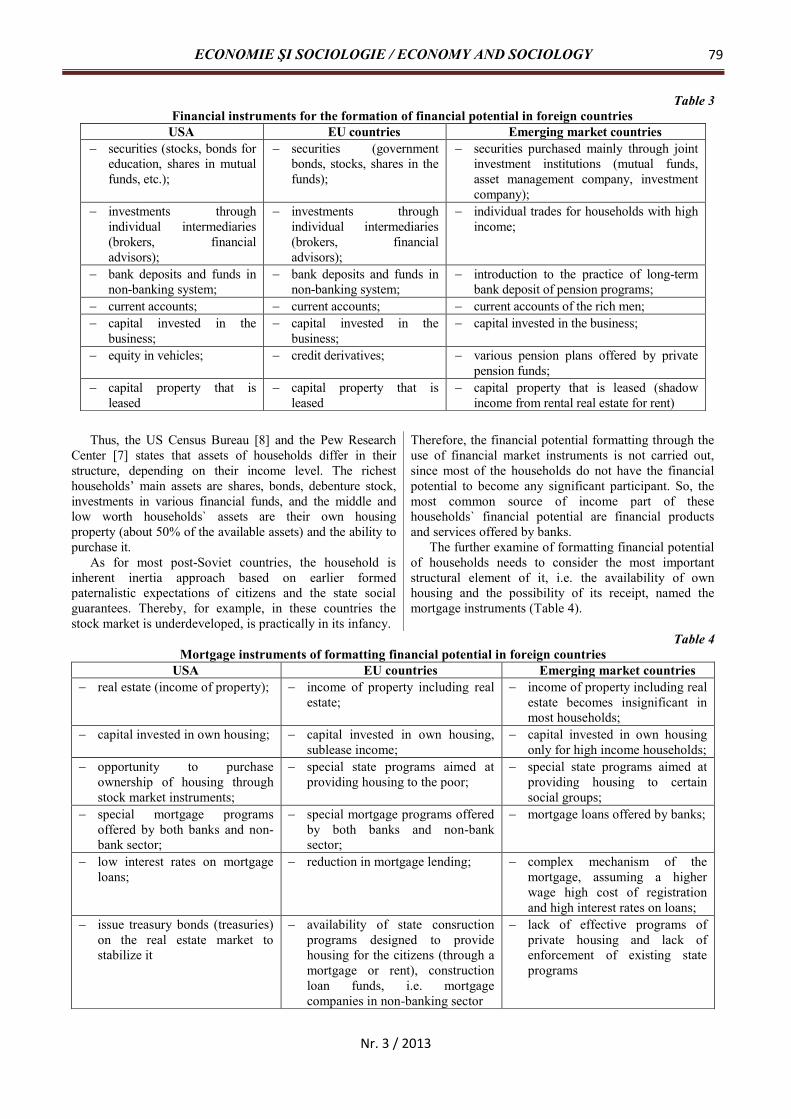
ECONOMIE ŞI SOCIOLOGIE / ECONOMY AND SOCIOLOGY 79
Nr. 3 / 2013
Table 3Financial instruments for the formation of financial potential in foreign countries
USA EU countries Emerging market countries securities (stocks, bonds for
education, shares in mutualfunds, etc.);
securities (governmentbonds, stocks, shares in thefunds);
securities purchased mainly through jointinvestment institutions (mutual funds,asset management company, investmentcompany);
investments throughindividual intermediaries(brokers, financialadvisors);
investments throughindividual intermediaries(brokers, financialadvisors);
individual trades for households with highincome;
bank deposits and funds innon-banking system;
bank deposits and funds innon-banking system;
introduction to the practice of long-termbank deposit of pension programs;
current accounts; current accounts; current accounts of the rich men; capital invested in the
business; capital invested in the
business; capital invested in the business;
equity in vehicles; credit derivatives; various pension plans offered by privatepension funds;
capital property that isleased
capital property that isleased
capital property that is leased (shadowincome from rental real estate for rent)
Thus, the US Census Bureau [8] and the Pew ResearchCenter [7] states that assets of households differ in theirstructure, depending on their income level. The richesthouseholds’ main assets are shares, bonds, debenture stock,investments in various financial funds, and the middle andlow worth households` assets are their own housingproperty (about 50% of the available assets) and the ability topurchase it.
As for most post-Soviet countries, the household isinherent inertia approach based on earlier formedpaternalistic expectations of citizens and the state socialguarantees. Thereby, for example, in these countries thestock market is underdeveloped, is practically in its infancy.
Therefore, the financial potential formatting through theuse of financial market instruments is not carried out,since most of the households do not have the financialpotential to become any significant participant. So, themost common source of income part of thesehouseholds` financial potential are financial productsand services offered by banks.
The further examine of formatting financial potentialof households needs to consider the most importantstructural element of it, i.e. the availability of ownhousing and the possibility of its receipt, named themortgage instruments (Table 4).
Table 4Mortgage instruments of formatting financial potential in foreign countries
USA EU countries Emerging market countries real estate (income of property); income of property including real
estate; income of property including real
estate becomes insignificant inmost households;
capital invested in own housing; capital invested in own housing,sublease income;
capital invested in own housingonly for high income households;
opportunity to purchaseownership of housing throughstock market instruments;
special state programs aimed atproviding housing to the poor;
special state programs aimed atproviding housing to certainsocial groups;
special mortgage programsoffered by both banks and non-bank sector;
special mortgage programs offeredby both banks and non-banksector;
mortgage loans offered by banks;
low interest rates on mortgageloans;
reduction in mortgage lending; complex mechanism of themortgage, assuming a higherwage high cost of registrationand high interest rates on loans;
issue treasury bonds (treasuries)on the real estate market tostabilize it
availability of state consructionprograms designed to providehousing for the citizens (through amortgage or rent), constructionloan funds, i.e. mortgagecompanies in non-banking sector
lack of effective programs ofprivate housing and lack ofenforcement of existing stateprograms

Revistă teoretico-științifică / Theoretical and scientifical journal80
Nr. 3 / 2013
One is to be interested in development and introductionof various programs to provide own housing for individualsin foreign countries.
In New South Wales State, Australia, for instance, theState Housing Pathways system ensures the obtainingdwelling to be simple and fair regarding to society. Eachtype of household identifies limit on the level of income.Where in the individual benefits are considered, particularlythe benefits for families with children, the disabled, whenthe household has significant permanent medical expenses.Limit level of income is regularly reviewed and indexed forlegislative changes in living wage [1].
In developed countries the households, are not coveredthe public housing program, can participate in a variety ofmortgage programs, in particular households with lowfinancial potential are able to do. For example, in the USAthe initial fee is issued in subsidies by the state.
There is no doubt that regarding to development of thereal estate market the possibility of construction,development of commercial construction sector and socialhousing is a major problem. For example, in Germany, inpost-crisis 2009-2011 years dwellings increased by 416, anddwellings per 1,000 inhabitants increased by 7, i.e. 1,5 m2
per inhabitant and in 2011 that is 43 m2 per inhabitant [4].As concerns the dwelling sector in the post-Soviet
countries, the main problem is an undeveloped market ofhousing construction, lack of effective mechanisms for theimplementation of state housing programs, and particularqualities of mortgage by non-banking sector financing that iscomplicated for the public understanding, disinterest ofdevelopers in collaboration with state mortgage agencies.
The State Statistics Service of Ukraine gives that in 2010total living area is 23.3 m2 per capita average. The data arecomparable to the European countries of the CIS. In 2010, inRussia living area is 22.6 m2 per capita average, in Belarus –23.6 m2 per capita average, in Moldova – 22.3 m2 per capitaaverage [2]. In the EU, they are 2-3 times higher, forexample, in Hungary – 28.0 m2, in the Czech Republic –28.7 m2, Denmark – 52.4 m2, in Norway – 74.0 m2 [2].
In the USA, living area is 67 m2 per capita. However,thus it is necessary to take into account that the majority ofAmericans has private house of average size of 170-180 m2,and in the post-Soviet countries there is an area over 50-65m2, in the European Union – 80-90 m2 [2, 4, 5, 8].
However, regards to the number of houseroom per 1,000inhabitants, in Ukraine the providing housing looks very«European» (Ukraine – 408 units, Russia – 413 units, CzechRepublic, Hungary – 423 units, Germany – 486 units,France – 513 units). This can be explained to the averageUkrainian apartment is half the European one [2, 4, 5]. Inthe CIS countries for the past few years the positive trends isexplained not so much to increase the number of real estateas rapid depopulation.
The State Statistics Service says that the estate market inUkraine has positive trend due to increased construction worksin cash terms in 2011, which tended to increase by 11.1%
compared to the previous period (2008 – 16%, 2009 –48.2%, 2010 – 5.4%) [2].
Thus, the examined countries significantly differ inliving conditions, income, social standards and thedegree of development of financial markets andinstruments helped to shape households` financialpotential.
ConclusionsConsidering the international experience of the
formation and development of households` financialpotential there is necessary to divide the existingmechanisms and instruments in the degree of possibilityof their use in Ukrainian practice.
Thus, there are the most appropriate and feasible forimplementation instruments. It seems to be theinstruments and mechanisms are not directly related toreform the tax system, since, the system of familytaxation is discussed by academics. But main provisionsof the system of family taxation were not evenconsidered in the Tax code draft. Therefore, allinstruments associated with changes in tax laws seem tohard fulfill soon.
The most probable mechanisms and instruments foruse in Ukrainian practice are emphasized by author: to introduce the individual retirement accounts
formed in the banking system (deposit products)and in the non-banking system (products of PrivatePension Fund), as well as had the same stateguarantees (the Fund Deposit Guarantee). It makesto increase the non-bank segment of financialmarket;
to modernize mortgage market by expanding itsinfrastructure (to create the specialized commercialmortgage companies);
to improve the mechanisms of the State MortgageInstitution of Ukraine in the sphere of existing statemortgage programs (youth loan) as well asdeveloping new ones (for example, programs toprovide housing in the long-term mortgage leasing);
the need to develop new public constructionregarding to social housing programs througharrangements and the system of preferentialgovernment lending developers.Ukrainian corporate sector versus the U.S. one is not
financially able to implement the redistribution of stockownership to the formation of pension plans, becausetoday the basis of corporate solidarity is not formed.Also, the concept of corporate social responsibility andthe need for it is disputed, as business concernsprimarily the entrepreneur`s benefits, but they are absentnow.
Therefore, the use of such schemes in Ukrainiancorporate sector seems problematic because of deficientlegislation, lack of willingness to large corporations bearsocial responsibility and confidence of employee to suchinstruments.
Referinţe bibliografice / References1. О «Жилищных путях». 2010, апрель [accesat 5 mai 2013]. Disponibil: http://www.housing.nsw.gov.au/NR/
rdonlyres/B57BC416-5EB1-4A62-B9A5-8368037A31B0/0/AboutHousing PathwaysRussian.pdf2. Державна служба статистики України [accesat 5 mai 2013]. Disponibil: http://www.ukrstat.gov.ua
ECONOMIE ŞI SOCIOLOGIE / ECONOMY AND SOCIOLOGY 81
Nr. 3 / 2013
3. МИРКИНА, Я.М. Стратегия развития финансовой системы России: аналитический доклад. Москва, 2011.410 с.
4. Building Activity: Dwelling stock in Germany [accesat 5 mai 2013]. Disponibil:https://www.destatis.de/EN/FactsFigures/SocietyState/IncomeConsumptionLivingConditions/Housing/Tables/Dwellings.html
5. Sample Survey of Income and Expenditure [accesat 5 mai 2013]. Disponibil: https://www.destatis.de/EN/FactsFigures/SocietyState/IncomeConsumptionLivingConditions/AssetsDebts/Tables/FinancialAssetsDebt_EVS.html
6. Household accounts [accesat 5 mai 2013]. Disponibil: http://epp.eurostat.ec.europa.eu/cache7. Dramatic Growth in Social Inequality in America. Poverty Increases During an “Economic Recovery” [accesat 5
mai 2013]. Disponibil: http://www.globalresearch.ca/dramatic-growth-in-social-inequality-in-america-poverty-increases-during-an-economic-recovery/5332937
8. US CENSUS BUREAU. 2011 Household Income Table of Contents [accesat 5 mai 2013]. Disponibil:http://www.census.gov/hhes/www/cpstables/032012/hhinc/toc.htm
9. Flow of Funds, Balance Sheets, and Integrated Macroeconomic Accounts [accesat 5 mai 2013]. Disponibil:http://www.federalreserve.gov/releases/z1/current/z1.pdf
Recomandat spre publicare: 21.06.2013

Revistă teoretico-științifică / Theoretical and scientifical journal82
Nr. 3 / 2013
MODELAREA DEZVOLTĂRII SECTORULUIAGRO-INDUSTRIAL ÎN CONDIŢII DE
INCERTITUDINE ŞI RISC
AGRICO-INDUSTRIAL SECTORDEVELOPMENT MODELING UNDER
UNCERTAINTY AND RISC
Elvira NAVAL, dr., conf., univ., IMINatalia MOCANU, dr., conf., univ., UAM
Elvira NAVAL, PhD, Associate Professor, IMINatalia MOCANU, PhD, Associate Professor, AUM
Modelarea macroeconomică a sectorului agro-industrialeste propusă în modelul prezentat [1]. În acest scop seestimează funcţia de producere dependentă a trei factori deproducţie: capital, forţa de muncă şi pământul arabil. Pestepaisprezece ramuri de perspectivă au fost selectate pentruexaminare, se calculează valorile Produsului Intern Brut șivalorile volumului de producţie, activitatea cărora estesupusă atât şocului aleatoriu integral, cât şi şocuriloraleatorii ramurale.
Macroeconomic modelling of the agro-industrialsector proposed in [1] is done. For this purposesproduction function dependent of three productionfactors: capital, land and labour was estimate. Fourteenmore perspective branches were selected forexamination, Gross Domestic Product values and volumevalues for examined sector and branches, supposed tostochastic shocks, were calculated.
Cuvinte cheie: modelare matematică, sectorul agro-industrial, funcţia de producere în agricultură, şocurialeatorii.
Key words: mathematical modelling, agro-industrialsector, production function in agriculture, randomshocks.
JEL Classification: C6, Q1, Q15, Q19
Introducere. Ponderea sectorului agro-industrial îneconomia Republicii Moldova este suficient de mare,atingând nivelul de 52% în anul 1995 şi diminuând la 24% înanul 2011. Fiind un sector strategic, el asigură securitateaalimentară a ţării, din acest motiv, dezvoltării sectorului agro-industrial trebuie să se acorde o atenţie sporită, ţinând cont defaptul că Republica Moldova se află în zona de risc agricol:îngheţuri, secetă, inundaţii, alunecări de teren. Însă aplicareatehnologiilor avansate este limitată sau imposibilă din cauzaparcelării excesive a terenurilor agricole, din cauzainsuficienţei forţei de muncă calificată şi multor alţi factori.
Deci, avansarea sectorului agro-industrial şi sporireaaportului lui la formarea Produsului Intern Brut, necesitărealizarea unor obiective speciale. Ele se referă laconsolidarea terenurilor agricole; elaborarea şi utilizareasoiurilor de plante noi de calitate net superioară; folosireatehnologiilor avansate la prelucrarea şi menţinerea calităţiisolului; restabilirea şi perfecţionarea sistemului existent deirigare; sporirea randamentului culturilor agricole;perfecţionarea sistemului de stocare, transportare, prelucrareşi ambalare a producţiei agricole; amplasarea centrelor deprelucrare a producţiei agricole în apropierea imediată deproducători; utilizarea tehnologiilor contemporane deprelucrare şi ambalare a producţiei industriei prelucrătoare.
Definitivarea celor de perspectivă ramuri ale sectoruluiagro-industrial, subvenţionarea lui mai eficientă, consolidareaterenurilor agricole, implementarea tehnologiilor avansate înagricultură şi în industria prelucrătoare, atragerea investiţiilorşi tinerilor plecaţi la munci peste hotarele ţării prin programulPARE 1+1, sunt acţiuni primordiale de efectuat întruredresarea sectorului agro-industrial şi, prin urmare,fortificarea securităţii alimentare.
Modelarea dezvoltării sectorului agro-industrial încondiţiile de incertitudine şi risc, caracteristice pentru RM,oferă un instrumentar util în procesul de luare a deciziilor cuprivire la structura optimă a acestui sector, la determinareaimpactului consecinţelor calamităţilor naturale asupra lui, laevaluarea diverselor scenarii de dezvoltare.
Introduction. The weight of ago-idustrial sector inRepublic of Moldova economy is sufficiently high,touching upon 52% in 1995 and decreasing to 24% in2011, being a strategic sector it ensure food security ofthe country. So, this sector development must be givenspecial attention, becouse Republic of Moldova islocated in the risk area: frost, drought, flood, slippage ofthe field. Advanced technologies applying is limited orimpossible for the reason of excessive division of theagricultural land, insufficiency of qualified workforce,and so on.
Therefore, the progress of the agro-industrial sectorand its contribution to the Gross Domestic Product,requires some special objectives achieving. They arerelated to the agricultural land strengthening; developingand using of new plants varieties of substantially higherquality; using advanced technologies for processing andkeeping of the soil quality, restoring and improvingexisting system of irrigation; increasing agricultural cropyield; improving system of storage, transportation,processing and packaging of the agricultural production;location of the processing centers in close proximity ofproducers; using new technologies for processing andpackaging.
Perspective agro-industrial sector branchesdetermination, its more efficient subsidizing, agriculturalland strengthening, advanced technologiesimplementation, investment and young people go towork abroad bringing into PARE 1+1program areprimordial actions to be carried out in this sector revivaland, therefore, food safety fortification.
Modeling of the agro-industrial sector developmentunder uncertainty and risk conditions, one`s own to theRepublic of Moldova, offers an useful tool regarding todecision-making process with respect to optimalstructure of this sector, for the natural clamity impactconsequences determining, for different developmentscenarios assessing.
Conţinutul de bază. Sectorul bunurilor finale. Ca şi în The basic content. Final goods sector. Identically
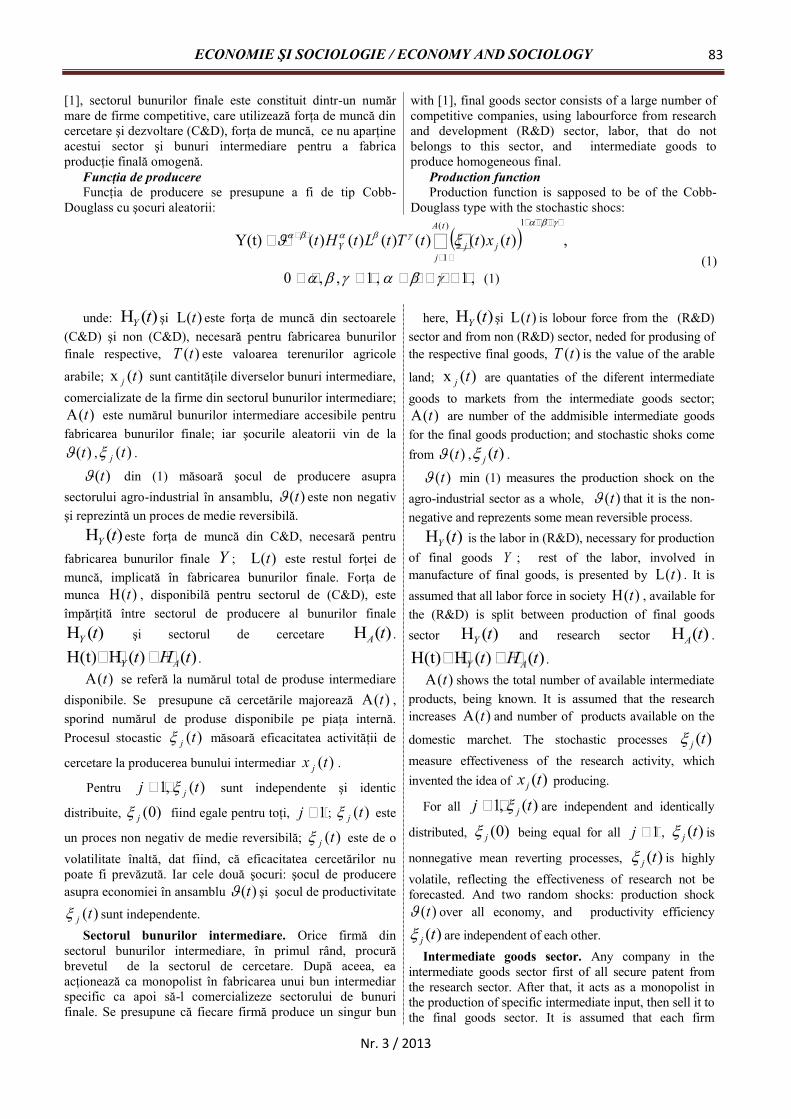
ECONOMIE ŞI SOCIOLOGIE / ECONOMY AND SOCIOLOGY 83
Nr. 3 / 2013
[1], sectorul bunurilor finale este constituit dintr-un numărmare de firme competitive, care utilizează forţa de muncă dincercetare şi dezvoltare (C&D), forţa de muncă, ce nu aparţineacestui sector şi bunuri intermediare pentru a fabricaproducţie finală omogenă.
Funcţia de producereFuncţia de producere se presupune a fi de tip Cobb-
Douglass cu şocuri aleatorii:
with [1], final goods sector consists of a large number ofcompetitive companies, using labourforce from researchand development (R&D) sector, labor, that do notbelongs to this sector, and intermediate goods toproduce homogeneous final.
Production functionProduction function is sapposed to be of the Cobb-
Douglass type with the stochastic shocs:
,)()()()()()(Y(t)1)(
1
tA
jjjY txttTtLtHt
(1),1,1,,0 (1)
unde: )(H tY şi )(L t este forţa de muncă din sectoarele(C&D) şi non (C&D), necesară pentru fabricarea bunurilorfinale respective, )(tT este valoarea terenurilor agricole
arabile; )(x tj sunt cantităţile diverselor bunuri intermediare,comercializate de la firme din sectorul bunurilor intermediare;
)(A t este numărul bunurilor intermediare accesibile pentrufabricarea bunurilor finale; iar şocurile aleatorii vin de la
)(t , )(tj .
)(t din (1) măsoară şocul de producere asuprasectorului agro-industrial în ansamblu, )(t este non negativşi reprezintă un proces de medie reversibilă.
)(H tY este forţa de muncă din C&D, necesară pentru
fabricarea bunurilor finale Y ; )(L t este restul forţei demuncă, implicată în fabricarea bunurilor finale. Forţa demunca )(H t , disponibilă pentru sectorul de (C&D), esteîmpărţită între sectorul de producere al bunurilor finale
)(H tY şi sectorul de cercetare )(H tA .
)()(HH(t) tHt AY .)(A t se referă la numărul total de produse intermediare
disponibile. Se presupune că cercetările majorează )(A t ,sporind numărul de produse disponibile pe piaţa internă.Procesul stocastic )(tj măsoară eficacitatea activităţii de
cercetare la producerea bunului intermediar )(tx j .
Pentru )(,1 tj j sunt independente şi identic
distribuite, )0(j fiind egale pentru toţi, 1j ; )(tj este
un proces non negativ de medie reversibilă; )(tj este de ovolatilitate înaltă, dat fiind, că eficacitatea cercetărilor nupoate fi prevăzută. Iar cele două şocuri: şocul de producereasupra economiei în ansamblu )(t şi şocul de productivitate
)(tj sunt independente.Sectorul bunurilor intermediare. Orice firmă din
sectorul bunurilor intermediare, în primul rând, procurăbrevetul de la sectorul de cercetare. După aceea, eaacţionează ca monopolist în fabricarea unui bun intermediarspecific ca apoi să-l comercializeze sectorului de bunurifinale. Se presupune că fiecare firmă produce un singur bun
here, )(H tY şi )(L t is lobour force from the (R&D)sector and from non (R&D) sector, neded for produsing ofthe respective final goods, )(tT is the value of the arable
land; )(x tj are quantaties of the diferent intermediategoods to markets from the intermediate goods sector;
)(A t are number of the addmisible intermediate goodsfor the final goods production; and stochastic shoks comefrom )(t , )(tj .
)(t min (1) measures the production shock on theagro-industrial sector as a whole, )(t that it is the non-negative and reprezents some mean reversible process.
)(H tY is the labor in (R&D), necessary for productionof final goods Y ; rest of the labor, involved inmanufacture of final goods, is presented by )(L t . It isassumed that all labor force in society )(H t , available forthe (R&D) is split between production of final goodssector )(H tY and research sector )(H tA .
)()(HH(t) tHt AY .)(A t shows the total number of available intermediate
products, being known. It is assumed that the researchincreases )(A t and number of products available on the
domestic marchet. The stochastic processes )(tjmeasure effectiveness of the research activity, whichinvented the idea of )(tx j producing.
For all )(,1 tj j are independent and identically
distributed, )0(j being equal for all 1j , )(tj is
nonnegative mean reverting processes, )(tj is highlyvolatile, reflecting the effectiveness of research not beforecasted. And two random shocks: production shock
)(t over all economy, and productivity efficiency
)(tj are independent of each other.Intermediate goods sector. Any company in the
intermediate goods sector first of all secure patent fromthe research sector. After that, it acts as a monopolist inthe production of specific intermediate input, then sell it tothe final goods sector. It is assumed that each firm
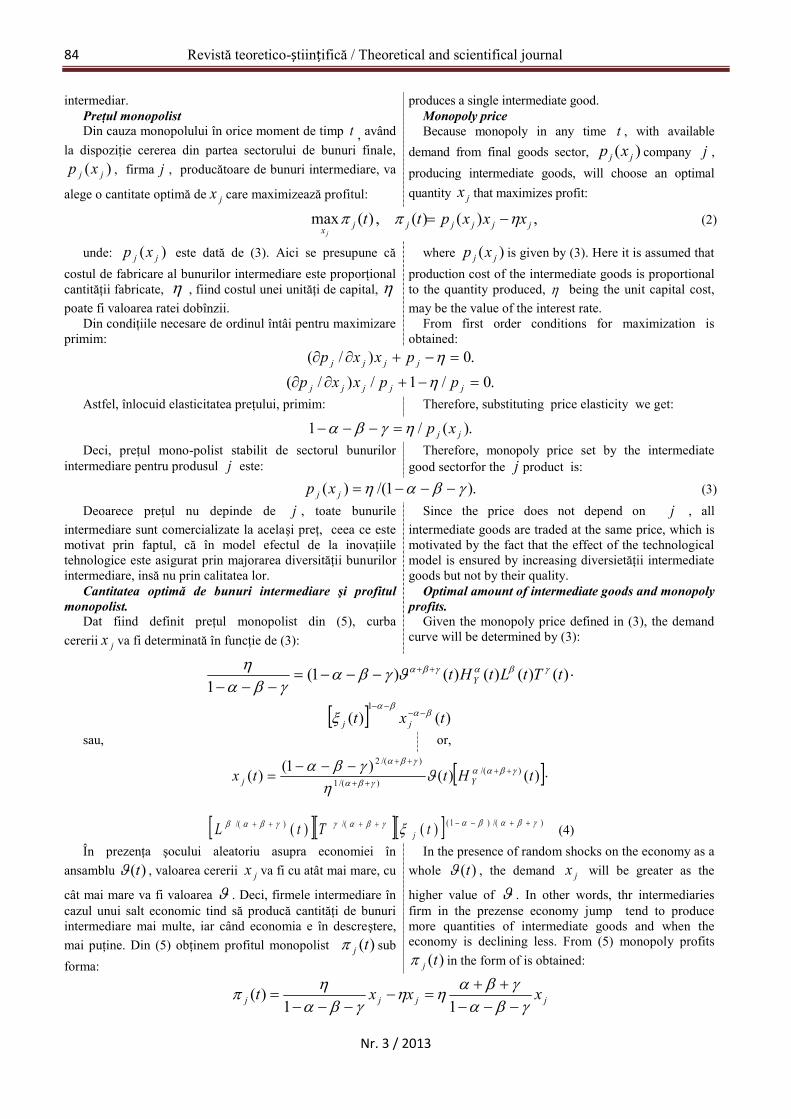
Revistă teoretico-științifică / Theoretical and scientifical journal84
Nr. 3 / 2013
intermediar.Preţul monopolistDin cauza monopolului în orice moment de timp t , având
la dispoziţie cererea din partea sectorului de bunuri finale,)( jj xp , firma j , producătoare de bunuri intermediare, va
alege o cantitate optimă de jx care maximizează profitul:
produces a single intermediate good.Monopoly priceBecause monopoly in any time t , with available
demand from final goods sector, )( jj xp company j ,producing intermediate goods, will choose an optimalquantity jx that maximizes profit:
,)()(,)(max jjjjjjxxxxptt
j
(2)
unde: )( jj xp este dată de (3). Aici se presupune căcostul de fabricare al bunurilor intermediare este proporţionalcantităţii fabricate, , fiind costul unei unităţi de capital, poate fi valoarea ratei dobînzii.
Din condiţiile necesare de ordinul întâi pentru maximizareprimim:
where )( jj xp is given by (3). Here it is assumed thatproduction cost of the intermediate goods is proportionalto the quantity produced, being the unit capital cost,may be the value of the interest rate.
From first order conditions for maximization isobtained:
.0)/( jjjj pxxp.0/1/)/( jjjjj ppxxp
Astfel, înlocuid elasticitatea preţului, primim: Therefore, substituting price elasticity we get:
.)(/1 jj xp Deci, preţul mono-polist stabilit de sectorul bunurilor
intermediare pentru produsul j este:Therefore, monopoly price set by the intermediate
good sectorfor the j product is:
.)1/()( jj xp (3)Deoarece preţul nu depinde de j , toate bunurile
intermediare sunt comercializate la acelaşi preţ, ceea ce estemotivat prin faptul, că în model efectul de la inovaţiiletehnologice este asigurat prin majorarea diversităţii bunurilorintermediare, insă nu prin calitatea lor.
Cantitatea optimă de bunuri intermediare şi profitulmonopolist.
Dat fiind definit preţul monopolist din (5), curbacererii jx va fi determinată în funcţie de (3):
Since the price does not depend on j , allintermediate goods are traded at the same price, which ismotivated by the fact that the effect of the technologicalmodel is ensured by increasing diversietăţii intermediategoods but not by their quality.
Optimal amount of intermediate goods and monopolyprofits.
Given the monopoly price defined in (3), the demandcurve will be determined by (3):
)()()()()1(1
tTtLtHt Y
)()(1
txt jj
sau, or,
)()()1()( )/()/(1
)/(2
tHttx Yj
)/()1(/()/( )()( tTtL j (4)În prezenţa şocului aleatoriu asupra economiei în
ansamblu )(t , valoarea cererii jx va fi cu atât mai mare, cu
cât mai mare va fi valoarea . Deci, firmele intermediare încazul unui salt economic tind să producă cantităţi de bunuriintermediare mai multe, iar când economia e în descreştere,mai puţine. Din (5) obţinem profitul monopolist )(tj subforma:
In the presence of random shocks on the economy as awhole )(t , the demand jx will be greater as the
higher value of . In other words, thr intermediariesfirm in the prezense economy jump tend to producemore quantities of intermediate goods and when theeconomy is declining less. From (5) monopoly profits
)(tj in the form of is obtained:
jjjj xxxt
11
)(
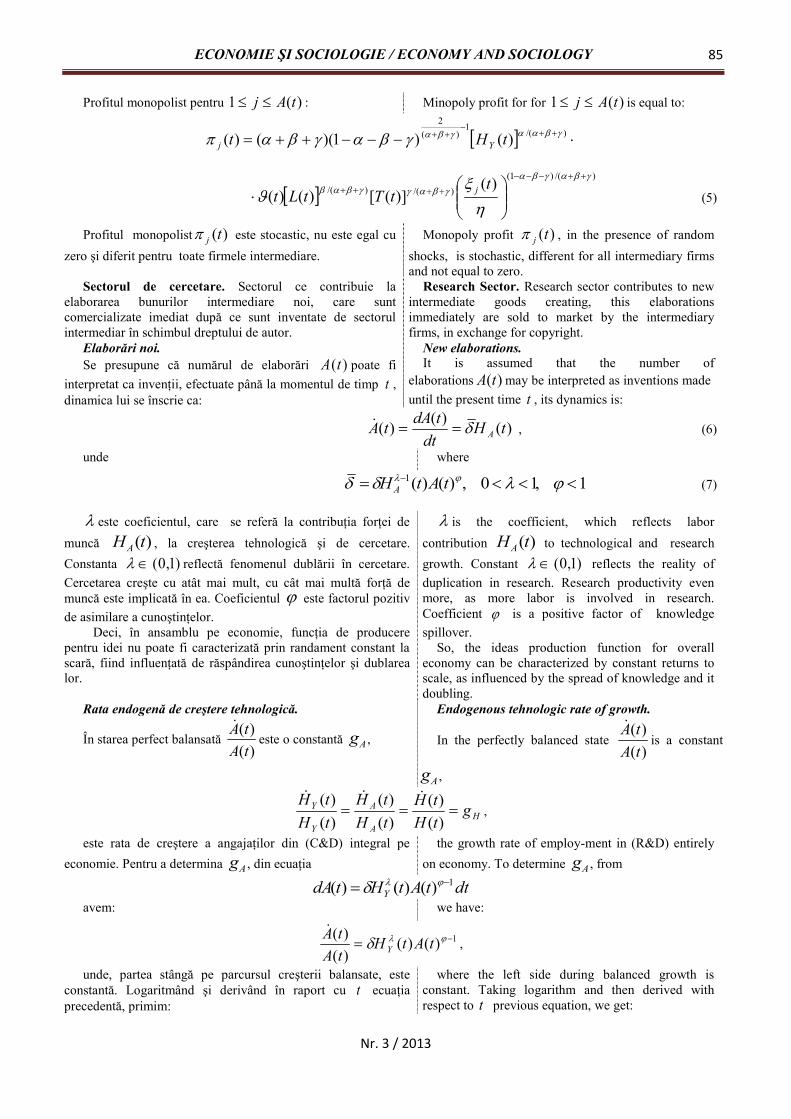
ECONOMIE ŞI SOCIOLOGIE / ECONOMY AND SOCIOLOGY 85
Nr. 3 / 2013
Profitul monopolist pentru )(1 tAj : Minopoly profit for for )(1 tAj is equal to:
)/(1
)(2
)()1)(()( tHt Yj
)/()1(
)/()/( )()]([)()(
ttTtLt j
(5)
Profitul monopolist )(tj este stocastic, nu este egal cuzero şi diferit pentru toate firmele intermediare.
Monopoly profit )(tj , in the presence of randomshocks, is stochastic, different for all intermediary firmsand not equal to zero.
Sectorul de cercetare. Sectorul ce contribuie laelaborarea bunurilor intermediare noi, care suntcomercializate imediat după ce sunt inventate de sectorulintermediar în schimbul dreptului de autor.
Elaborări noi.Se presupune că numărul de elaborări )(tA poate fi
interpretat ca invenţii, efectuate până la momentul de timp t ,dinamica lui se înscrie ca:
Research Sector. Research sector contributes to newintermediate goods creating, this elaborationsimmediately are sold to market by the intermediaryfirms, in exchange for copyright.
New elaborations.It is assumed that the number of
elaborations )(tA may be interpreted as inventions madeuntil the present time t , its dynamics is:
)()()( tHdt
tdAtA A , (6)
unde where
1,10,)()(1 tAtHA (7)
este coeficientul, care se referă la contribuţia forţei demuncă )(tHA , la creşterea tehnologică şi de cercetare.Constanta )1,0( reflectă fenomenul dublării în cercetare.Cercetarea creşte cu atât mai mult, cu cât mai multă forţă demuncă este implicată în ea. Coeficientul este factorul pozitivde asimilare a cunoştinţelor.
Deci, în ansamblu pe economie, funcţia de producerepentru idei nu poate fi caracterizată prin randament constant lascară, fiind influenţată de răspândirea cunoştinţelor şi dublarealor.
is the coefficient, which reflects laborcontribution )(tHA to technological and researchgrowth. Constant )1,0( reflects the reality ofduplication in research. Research productivity evenmore, as more labor is involved in research.Coefficient is a positive factor of knowledgespillover.
So, the ideas production function for overalleconomy can be characterized by constant returns toscale, as influenced by the spread of knowledge and itdoubling.
Rata endogenă de creştere tehnologică.
În starea perfect balansată)()(
tAtA
este o constantă Ag ,
Endogenous tehnologic rate of growth.
In the perfectly balanced state)()(
tAtA
is a constant
Ag ,
HA
A
Y
Y gtHtH
tHtH
tHtH
)()(
)()(
)()(
,
este rata de creştere a angajaţilor din (C&D) integral peeconomie. Pentru a determina Ag , din ecuaţia
the growth rate of employ-ment in (R&D) entirelyon economy. To determine Ag , from
dttAtHtdA Y1)()()(
avem: we have:
1)()()()( tAtH
tAtA
Y
,
unde, partea stângă pe parcursul creşterii balansate, esteconstantă. Logaritmând şi derivând în raport cu t ecuaţiaprecedentă, primim:
where the left side during balanced growth isconstant. Taking logarithm and then derived withrespect to t previous equation, we get:
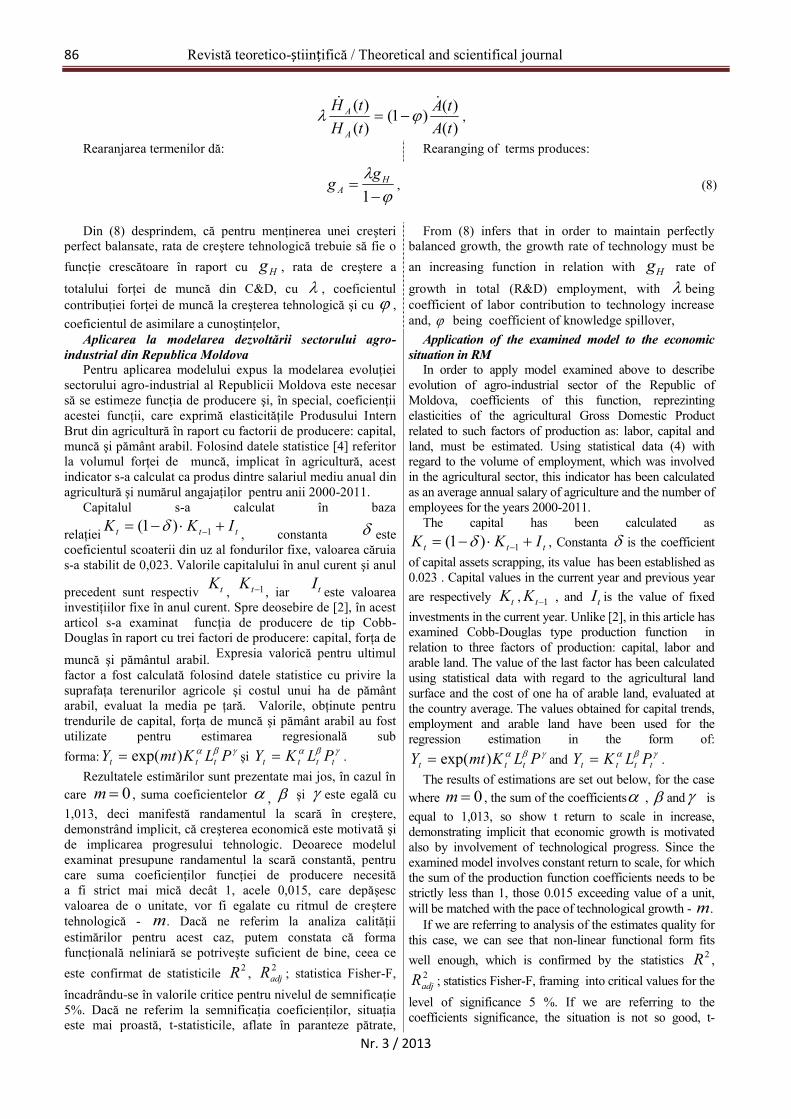
Revistă teoretico-științifică / Theoretical and scientifical journal86
Nr. 3 / 2013
)()()1(
)()(
tAtA
tHtH
A
A
,
Rearanjarea termenilor dă: Rearanging of terms produces:
1
HA
gg , (8)
Din (8) desprindem, că pentru menţinerea unei creşteriperfect balansate, rata de creştere tehnologică trebuie să fie ofuncţie crescătoare în raport cu Hg , rata de creştere a
totalului forţei de muncă din C&D, cu , coeficientulcontribuţiei forţei de muncă la creşterea tehnologică şi cu ,coeficientul de asimilare a cunoştinţelor,
From (8) infers that in order to maintain perfectlybalanced growth, the growth rate of technology must bean increasing function in relation with Hg rate of
growth in total (R&D) employment, with beingcoefficient of labor contribution to technology increaseand, being coefficient of knowledge spillover,
Aplicarea la modelarea dezvoltării sectorului agro-industrial din Republica Moldova
Pentru aplicarea modelului expus la modelarea evoluţieisectorului agro-industrial al Republicii Moldova este necesarsă se estimeze funcţia de producere şi, în special, coeficienţiiacestei funcţii, care exprimă elasticităţile Produsului InternBrut din agricultură în raport cu factorii de producere: capital,muncă şi pământ arabil. Folosind datele statistice [4] referitorla volumul forţei de muncă, implicat în agricultură, acestindicator s-a calculat ca produs dintre salariul mediu anual dinagricultură şi numărul angajaţilor pentru anii 2000-2011.
Capitalul s-a calculat în baza
relaţiei ttt IKK 1)1( , constanta estecoeficientul scoaterii din uz al fondurilor fixe, valoarea căruias-a stabilit de 0,023. Valorile capitalului în anul curent şi anul
precedent sunt respectiv tK , 1tK , iar tI este valoareainvestiţiilor fixe în anul curent. Spre deosebire de [2], în acestarticol s-a examinat funcţia de producere de tip Cobb-Douglas în raport cu trei factori de producere: capital, forţa de
muncă şi pământul arabil. Expresia valorică pentru ultimul
factor a fost calculată folosind datele statistice cu privire lasuprafaţa terenurilor agricole şi costul unui ha de pământarabil, evaluat la media pe ţară. Valorile, obţinute pentrutrendurile de capital, forţa de muncă şi pământ arabil au fostutilizate pentru estimarea regresională subforma: PLKmtY ttt )exp( şi
tttt PLKY .Rezultatele estimărilor sunt prezentate mai jos, în cazul în
care 0m , suma coeficientelor , şi este egală cu1,013, deci manifestă randamentul la scară în creştere,demonstrând implicit, că creşterea economică este motivată şide implicarea progresului tehnologic. Deoarece modelulexaminat presupune randamentul la scară constantă, pentrucare suma coeficienţilor funcţiei de producere necesităa fi strict mai mică decât 1, acele 0,015, care depăşescvaloarea de o unitate, vor fi egalate cu ritmul de creşteretehnologică - m. Dacă ne referim la analiza calităţiiestimărilor pentru acest caz, putem constata că formafuncţională neliniară se potriveşte suficient de bine, ceea ceeste confirmat de statisticile 2R , 2
adjR ; statistica Fisher-F,încadrându-se în valorile critice pentru nivelul de semnificaţie5%. Dacă ne referim la semnificaţia coeficienţilor, situaţiaeste mai proastă, t-statisticile, aflate în paranteze pătrate,
Application of the examined model to the economicsituation in RM
In order to apply model examined above to describeevolution of agro-industrial sector of the Republic ofMoldova, coefficients of this function, reprezintingelasticities of the agricultural Gross Domestic Productrelated to such factors of production as: labor, capital andland, must be estimated. Using statistical data (4) withregard to the volume of employment, which was involvedin the agricultural sector, this indicator has been calculatedas an average annual salary of agriculture and the number ofemployees for the years 2000-2011.
The capital has been calculated as
ttt IKK 1)1( , Constanta is the coefficientof capital assets scrapping, its value has been established as0.023 . Capital values in the current year and previous yearare respectively tK , 1tK , and tI is the value of fixedinvestments in the current year. Unlike [2], in this article hasexamined Cobb-Douglas type production function inrelation to three factors of production: capital, labor andarable land. The value of the last factor has been calculatedusing statistical data with regard to the agricultural landsurface and the cost of one ha of arable land, evaluated atthe country average. The values obtained for capital trends,employment and arable land have been used for theregression estimation in the form of:
PLKmtY ttt )exp( and tttt PLKY .
The results of estimations are set out below, for the casewhere 0m , the sum of the coefficients , and isequal to 1,013, so show t return to scale in increase,demonstrating implicit that economic growth is motivatedalso by involvement of technological progress. Since theexamined model involves constant return to scale, for whichthe sum of the production function coefficients needs to bestrictly less than 1, those 0.015 exceeding value of a unit,will be matched with the pace of technological growth - m.
If we are referring to analysis of the estimates quality forthis case, we can see that non-linear functional form fitswell enough, which is confirmed by the statistics 2R ,
2adjR ; statistics Fisher-F, framing into critical values for the
level of significance 5 %. If we are referring to thecoefficients significance, the situation is not so good, t-

ECONOMIE ŞI SOCIOLOGIE / ECONOMY AND SOCIOLOGY 87
Nr. 3 / 2013
sunt valori mai joase decât aceea tabelară, egală cu 1,35,pentru nivelul de semnificaţie 0,2 şi 13 grade de libertate.Deci, coeficienţii estimaţi nu sunt suficient de semnificativi,ceea ce este confirmat de valorile probabilităţilor desemnificaţie şi de valorile intervalului de încredere,care trec prin zero. Cele expuse pot fi explicate prinposibila incorectitudine a datelor privind mijloacele fixe,implicate la calcularea stocului de capital şi datele ce ţin depreţul unui ha de pământ arabil. Oricum, aceste estimărinu avem cu ce să le comparăm, deoarece este prima încercarede a estima funcţia de producere în agricultură dependentăde trei factori, dintre care unul este pământul arabil.Funcţia de producere estimată poate fi folosită pentrupreviziune şi simulare, însă coeficienţii estimaţi necesităa fi reestimaţi anual în vederea precizării valorilor obţinuteanterior.
statistics, in square brackets, are values lower than thattabular, equal to 1.35, for the level of significance 0.2 and13 degrees of freedom. Therefore, the coefficients estimateare not sufficiently significant, what is confirmed by thelikelihood values of significance and by the values ofconfidence interval, passing through zero. The above can beexplained by possible incorrectness of the fixed assets data,concerned for the purpose of capital stock calculating, anddata relating to the price of one ha of arable land. In anycase, we don't have what to compare these estimates with,because it is the first attempt to estimate the productionfunction in agriculture dependent on three productionfactors, one of which is arable land. This productionfunction can be used to forecast and simulate, but estimatedcoefficients needs to be evaluated annually to preciseobtained values.
LnY=0,07*LnK+0,61*LnL+0,23*LnT(0,1014) (0,4812) 0,2727)[0,814] [1,341] [1,046]
2R =0,9998; 2adjR =0,8998; F =28818.
Modelul examinat se va folosi la evaluarea volumelor deproducţie intermediară şi a Produsului Intern Brut din sectorulagro-industrial, supus şocurilor la nivel de ramuri deproducere şi integral pe sector. Şocurile productive potinfluenţa randamentul de producere al ramurilor, iar şoculintegral influenţează sectorul agro-industrial în întregime.
Presupunem că sectorul agro-industrial din Moldova, înlinii mari, este caracterizat de 14 ramuri de perspectivă subaspectul ponderii în totalul producţiei şi în PIBagr,perfecţionării bunurilor şi serviciilor existente, cât şi prinelaborarea sau adoptarea tehnologiilor noi care sporescnivelul de productivitate în ramurile examinate. Aceste ramurisunt:
Agricultura: culturi cerealiere, Floarea soarelui, Legume şiculturi bostănoase, Fructe, Nuci şi pomuşoare, Struguri,Producţia de vite şi păsări, Lapte, Altă producţie agricolă;
Industria prelucrătoare: Producţia, prelucrarea şiconservarea cărnii şi produselor din carne, Prelucrarea şiconservarea fructelor şi legumelor, Fabricarea produselorlactate, Fabricarea pâinii şi produselor de patiserie proaspete,Fabricarea vinului, Alte activităţi industriale din industriaalimentară şi a băuturilor.
Pentru a efectua calcule de simulare ale volumelor deproducţie pentru cele 15 ramuri selectate avem nevoie devalorile coeficienţilor , şi estimaţi; de coeficientul , care va fi determinat ca rata dobânzii; de volumul total alforţei de muncă angajată în sectorul agro-industrial )(tL ; devolumul forţei de muncă, care face parte din cercetătoriiangajaţi în sectorul bunurilor finale şi în sectorul (C&D),respectiv )(),( tHtH AY . Admitem că, fiecare ramurăexaminată se asociază cu o singură tehnologie de producere.
Pentru coeficienţii , şi se vor folosi valorileestimate:
0,083, 0,015; 1 0,355. )(tH=144,05 mln. lei, )(tL 6670 mln, lei.
),(tj j=1,2,...,11, variabile aleatoare, valorile căroraaproximează productivitatea în ramurile selectate. Se
The examined model will be used for assessingintermediate volumes of production and agro-industrialsector Gross Domestic Product values, which is subjectto impacts at the branches of production level and at thewhole sector. Productive shocks may influence thebranches efficiency, and the whole-meal shockinfluences all agro-industrial sector.
We assume that Moldovan agro-industrial sector, onthe whole, is characterized by 15 perspective branches inrespect with the rate in total volume of production andin GDPagr, improving existing goods and services, aswell as by developing or adopting new technology thatenhances efficiency level of examined branches.Thesebranches are:
Agriculture: Cereal crops, Sunflower, Vegetables andpumpkin crops, Fruit, Nuts and berry, Grapes,Production of livestock and poultry, Milk, Otheragricultural production;
Manufacturing industries: Production, processing andpreservation of meat and meat products, Processing andpackaging fruit and vegetables, Manufacture of dairyproducts, Manufacture of bread and products freshpastry, Production of wine, Other industrial activities ofthe food industry and beverages.
To perform simulation calculus of production volumesfor the 15 selected branches we need the values of theestimated coefficients , , and ; the coefficient ,that will be determined as the interest rate; the totalvolume of the workforce engaged in agro-industrialsector )(tL , of the volume of labor, which is a part ofresearchers engaged in final goods sector and in thesector (C&D), respectively )(),( tHtH AY . Suppose,that each branch examined shall be associated with oneproduction technology.
For coefficients and will be examined thefollowing combinations:
0,083, 0,015; 1 0,355, )(tH144,05, (în mln, lei) [3-4], )(tL 6670 mln, lei.

Revistă teoretico-științifică / Theoretical and scientifical journal88
Nr. 3 / 2013
examinează trei variante ale acestor variabile, formând treiscenarii de calcul în funcţie de cele trei valori de )(t ,calculate ca şi cele de )(t , cu funcţia RAND(); pentru anul2012 aceste valori sunt: 0,8305743; 1,0; 1,375267.
Salariul mediu pe sectorul agro-industrial în anul 2011este de 2779 lei, salariul mediu în cercetare în anul 2012 -3133 lei [3]-[4].
Varianta I: )(t =1,375267; 1,0; 0,8305743. Secalculează volumele de producţie pentru primul din cele treiseturi de date privind şocurile productive )(t .
Varianta II: )(t =1,375267; 1,0; 0,8305743 secalculează volumele de producţie pentru al doilea set de dateprivind şocurile productive )(t .
Varianta III: )(t =1,375267; 1,0; 0,8305743 secalculează volumele de producţie pentru al treilea set de dateprivind şocurile productive )(t .
),(tj j=1,2,...,11, random variables, whose valuesapproximated efficiency in selected branches, generatingthree scenarious for three )(t random values, whicharee obtained, also as )(t , using function RAND ().
Average wage in economy at 2011 is 3737 lei, theaverage wage in research in 2011 is 3133 lei [3] - [4].
Variant I: )(t =1,375267; 1,0; 0,8305743.Production volume calculation for first of three sets ofdata on effectiveness shocks )(t .
Variant II: )(t =1,375267; 1,0; 0,8305743.Production volume calculation for second set of data oneffectiveness shocks )(t .
Variant III: )(t =1,375267; 1,0; 0,8305743.Production volume calculation for third set of data oneffectiveness shocks )(t .
Tabelul 1/Table 1Valorile )(tx j calculate pentru variabila aleatoare )(tj /Caculated value for )(tx j the random variable )(tj
var.I 1 2 3 4 5 6 7 8 9 10 11 12 13 14 17,68 6,23 24,86 37,71 20,67 21,62 13,59 2,74 43,97 25,03 27,85 8,22 12,70 43,97
1,37 2267,5 1277,3 2735,5 3440,8 2471,5 2533,2 1962,4 813,3 3744,3 2746,3 2911,9 1487,3 1890,2 3744,2
1,0 1648,8 928,8 1989,0 2501,9 1797,1 1841,9 1426,9 591,4 2722,6 1996,9 2117,4 1081,5 1374,4 2722,5
0,83 1369,4 771,4 1652,0 2078,0 1492,6 1529,9 1185,2 491,2 2261,3 1658,6 1758,6 898,2 1141,6 2261,3
Sursa/Source: Elaborat de autor în baza calculelor proprii/Created by the auther based on own calculas
Tabelul 2/Table 2Valorile )(tx j calculate pentru variabila aleatoare )(tj /Caculated value for )(tx j the random variable )(tj
Sursa/Source: Elaborat de autor în baza calculelor proprii/Created by the auther based on own calculas
var.II 1 2 3 4 5 6 7 8 9 10 11 12 13 14 14,01 15,88 31,25 43,81 27,75 25,65 26,58 36,02 5,17 25,26 39,90 41,19 14,28 28,94
1,37 1994,9 2137,4 3102,8 3736,7 2906,3 2783,2 2838,0 3355,3 1152,2 2760,1 3549,4 3612,3 2015,9 2974,3
1,0 1450,6 1554,2 2256,1 2717,1 2113,3 2023,8 2063,6 2439,7 837,8 2006,9 2580,9 2626,6 1465,9 2162,7
0,83 1204,8 1290,9 1873,9 2256,8 1755,2 1680,9 1714,0 2026,4 695,9 1666,9 2143,6 2181,6 1217,5 1796,3
Tabelul 3/Table 3Valorile )(tx j calculate pentru variabila aleatoare )(tj /Caculated value for )(tx j the random variable )(tj
Sursa/Source: Elaborat de autor în baza calculelor proprii/Created by the auther based on own calculas
var.III 1 2 3 4 5 6 7 8 9 10 11 12 13 14 26,31 43,36 37,59 37,75 24,27 4,56 24,08 1,82 4,61 31,05 26,35 22,09 36,03 39,89
1,37 2822,3 3715,5 3434,7 3442,7 2699,5 1076,1 2688,2 649,0 1082,2 3091,6 2824,6 2563,3 3355,9 3548,7
1,0 2052,2 2701,6 2497,5 2503,3 1962,9 782,5 1954,7 471,9 786,9 2248,0 2053,9 1863,9 2440,2 2580,4
0,83 1704,5 2243,9 2074,4 2079,1 1630,3 649,9 1623,5 392,0 653,6 1867,1 1705,9 1548,1 2026,7 2143,2
Concluzii. Calculele au fost efectuate în baza datelor,obţinute pentru variabilele aleatoare 14,...,1),( jtjşi cu ajutorul funcţiei RAND() pentru trei variante de
Conclusions. Calculations were performed based ondata obtained for random variables
14,...,1),( jtj and )(t using function RAND() for

ECONOMIE ŞI SOCIOLOGIE / ECONOMY AND SOCIOLOGY 89
Nr. 3 / 2013
)(tj , dat fiind eficacitatea ramurilor examinate; , şi
, reprezent\ând productivitatea la limită a muncii,capitalului şi pământului. Aplicând formula de calcul pentruvolumele de producţie (4) şi tabele de calcul Excell obţinemrezultatele expuse în Tabelele 1-3. Sunt prezentate treivariante, în funcţie de efectul şocurilor aleatorii asupraeconomiei în ansamblu: prima fiind un şoc favorabil, a douavariantă fiind una neafectată de şoc şi a treia variantă fiindun şoc dăunător. Acestea trei scenarii denotă efecte negativeprin contractarea economiei cu circa 21%, lipsa acestorefecte şi efecte pozitive prin creşterea economică cu circa17%. Şocurile aleatorii de productivitate, la rândul său,reprezintă trei variante, câte unul pentru şocurile integraleselectate.
În concluzie, sporirea eficacităţii de producere la moddirect contribuie la majorarea volumelor de producţie înramurile respective. La fel şi şocul aleatoriu pozitiv asupraeconomiei în ansamblu sporeşte valoarea Produsului InternBrut în complexul agro-industrial conform formulei (1).
three varians of the ),(tj being efficiency of the
examined branchies; data for , and , representingmarginal labor, capitaland and land productivity. Applyingthe formula for volumes of production (4) and Excellspreadsheets the results presented in Tables 1-3 areobtained. There are three variants, depending on therandom shock upon overall economy, one of them shownegative effects through the economy contracting by about21%, another positive influence on the economy, boostingit to about 17%, last variant reflecting only impact of theproductive schoks ),(tj excluding schok on economy asa whole. Productivity random schoks, in its turn, givingthree variants for every integral schok.
In conclusion, the production efficiency increasingcontribute directly to uped production volumes in selectedbranches. So, random positive shock on the economy as awhole, increases the value of Gross Domestic Product ofthe agro-industrial sector in accordance with formulaie (1).
Referinţe bibliografice / References1. KOU, S.C., KOU, S.G. A Tale of Two Growths: Modeling Stochastic Endogenous Growth and Growth Stocks. 2002,
december [accesat 10 mai 2013]. Disponibil: http://www.researchgate.net/publication/228417116_A_tale_of_two_growths_modeling_stochastic_endogenous_ growth_and_growth_stocks
2. MOCANU, N., NAVAL, E. Modelarea matematică în suportul restructurării sectorului agrar. In: Economic Growth inConditions of Internationalization: proceedings of international scientific and practical conference, 18-19 october2012. VII-th edition. Chişinău: Complexul Editorial IEFS, 2012, vol. 2, pp. 163-174. ISBN 978-9975-4381-1-7.
3. CONSILIUL SUPREM PENTRU ŞTIINŢĂ ŞI DEZVOLTARE TEHNOLOGICĂ. Raport privind activitatea CŞSDTşi rezultatele ştiinţifice principale, obţinute în sfera ştiinţei şi inovării în anul 2011. Chişinău: [S.n.], 2012. 304 p.(Tipografia AŞM).
4. Biroul Naţional de Statistică al Republicii Moldova [accesat 10 mai 2013]. Disponibil: http://www.statistica.md
Recomandat spre publicare: 21.06.2013

Revistă teoretico-științifică / Theoretical and scientifical journal90
Nr. 3 / 2013
EVALUAREA STABILITĂŢII FINANCIAREA SECTORULUI DE MICROFINANŢARE
DIN REPUBLICA MOLDOVA
FINANCIAL STABILITY REVIEWOF THE MICROFINANCE SECTOR
IN MOLDOVA
Petru CATAN, dr.hab., prof. univ., Universitatea SlavonăViorica POPA, drd., IEFS
Petru CATAN, PhD, Associate Prof., Slavic UniversityViorica ŞEPTELICI, PhD student, IEFS
Obiectivul acestei cercetări este evaluarea sectorului demicrofinanţare din Republica Moldova, prin prismaindicatorilor de stabilitate financiară. În lucrare, seelucidează principalele tendinţe de dezvoltare a instituţilor demicrofinanţare în ultimii cinci ani, reflectatînd dinamicapozitivă a tuturor indicatorilor. În acest scop autorii îşipropun utilizarea metodelor de bază a analizei şi evaluăriistabilităţii financiare. Asigurarea stabilităţii financiareconstituie o preocupare prioritară în ultimul timp pentruBanca Naţională a Moldovei (BNM), care se află în frunteasistemelor financiare naţionale cît şi a Comisiei Naţionale aPieţei Financiare (CNPF). Într-adevăr, avândresponsabilitatea asigurării stabilităţii preţurilor, bancacentrală contribuie la stabilitatea financiară. Un mediufinanciar stabil facilitează realizarea stabilităţii preţurilor.
The objective of this article is to analyze themicrofinance sector in Moldova, in terms of financialstability indicators. Thus, it highlights the main trends ofdevelopment of microfinance institution in the last fiveyears, as being reflected by the improvement of allindicators. Therefore in the paper the authors aim to presentthe most important methods of analyzing and assessingfinancial stability. Thus, ensuring financial stabilityconstitutes lately a priority concern for the National Bank ofMoldova (NBM), which is at the forefront of the nationalfinancial systems as well as the National Commission ofFinancial Market (NCFM). Indeed, with the responsibilityof ensuring price stability, the central bank contributes tofinancial stability. A stable financial environment facilitatesthe achievement of price stability.
Cuvinte cheie: sectorul de microfinanţare, stabilitatefinanciară, credite bancare, profitabilitatea, indicatori deconcentrare, calitatea activelor.
Key words: microfinance sector, financial stability,bank loans, profitability, indicators of concentration,quality of the assets.
JEL Classification: G10, G12, G21, E51
Introducere. Evaluarea situaţiei sectorului demicrofinanţare prin prisma indicatorilor de stabilitatefinanciară, are drept scop de bază identificarea riscurilor carepot periclita stabilitatea financiară generată de sectorulcompaniilor şi al populaţiei, de evoluţiile macroeconomiceinterne şi de contextul economic şi financiar internaţional.
În literatură şi practica internaţională stabilitateafinanciară are mai multe abordări conceptuale. Prin urmare,generalizând, vom conchide că „stabilitatea financiară esteacea stare în care mecanismele economice de formare apreţurilor, de evaluare, divizare şi gestionare a riscurilorfinanciare funcţionează suficient de bine pentru a contribui lacreşterea performanţei economice”. Mai precis, „stabilitateafinanciară” este starea în care se află sistemul financiar atuncicând este capabil să îndeplinească simultan următoarele treifuncţii esenţiale (Schinasi, 2004, p.82):
- intermedierea intertemporală (dinamică), eficientă şilipsită de şocuri a resurselor financiare (transferul fondurilorde la cei care le deţin la cei care le utilizează);
- evaluarea, anticiparea şi gestionarea cu relativă rigoare ariscurilor implicate de acest proces;
- absorbţia şocurilor pe care le suferă sau generazăeconomia reală şi financiară.
Deci, sistemul financiar bancar şi nebancar, estesusceptibil să împiedice derularea proceselor economicenormale şi obţinerea performanţelor dorite într-o manierăendogenă, chiar şi în absenţa unor şocuri exogene. Unexemplu în acest sens este acumularea de dezechilibre cauzatede imperfecţiunile pieţei. Înseamnă că „stabilitatea financiară”nu înseamnă neapărat absenţa crizelor, cât mai degrabăprevenirea apariţiei dezechilibrelor care ar putea afectaintegritatea sistemul financiar şi, mai departe, blocareaprocesele economice reale [4].
Introduction. Assessment of the microfinance sectorsituation in terms of financial stability indicators, aimsbasically to identify the risks that may jeopardize thefinancial stability generated by companies andhouseholds, domestic macroeconomic developments andinternational economic and financial context.
In literature and international practice financialstability has several conceptual approaches. Therefore,generalizing, we conclude that "financial stability is astate in which the economic mechanisms of priceformation, valuation, division and financial rickmanagement works well enough to help increase theeconomic performance. "More specifically, the"financial stability" is the state in which the financialsystem its able to simultaneously satisfy three essentialfunctions (Schinas, 2004, p.82):
- Intertemporal brokerage (dynamic), efficient andwithout financial resources' shocks (transfer of fundsfrom those who have to those who use them);
- Assess, anticipate and manage with relative rigor ofthe risks involved in this process;
- Shock absorption that suffers or generates the realand financial economy.
So banking and non-banking financial system islikely to hamper the normal economic processes andachieve desired performance in an endogenous manner,even in the absence of exogenous shocks. An example ofthis is the accumulation of imbalances caused by marketimperfections. It means that "financial stability" does notnecessarily mean the absence of crisis, but ratherpreventing the emergence of imbalances that could affectthe integrity of the financial system and, further,blocking real economic processes [4].

ECONOMIE ŞI SOCIOLOGIE / ECONOMY AND SOCIOLOGY 91
Nr. 3 / 2013
Comisia Naţionale a Pieţei Financiare este organulesenţial care urmează să răspundă unor provocări, în specialpentru asigurarea stabilităţii financiare şi transparenţeisectorului de microfinanţare din Republica Moldova,respectarea principiului concurenţei loiale, apărareaintereselor consumatorilor serviciilor de microfinanţare şicrearea unor condiţii favorabile pentru dezvoltarea şiextinderea serviciilor organizaţiilor de microfinanţare.Instrumentele regulatorii şi de supraveghere a sectorului demicrofinanţare urmează a fi aplicate de Comisia Naţională aPieţei Financiare în vederea susţinerii sectorului, nu doardatorită efectului economic, dar şi a aspectului social alacestuia [3].
Evaluarea stabillităţii financiare a instituţiilor demicrofinanţare.
Evaluarea stabillităţii financiare a instituţiilor demicrofinanţare permite de a identifica şi de a remediadeficienţele din sector, prin urmare, de a consolida rezistenţala şocurile macroeconomice şi la influenţa din afară. Încontinuare autorii îşi propun de a analiza sectorul demicrofinanţare din Republica Moldov, prin prismaindicatorilor de stabilitate financiară.
1.Gradul de intermediere financiară: Un indicatoresenţial al stabilităţii financiare este gradul de intermedierefinanciară, evaluat din perspectiva ponderii activelorsistemului financiar din Republica Moldova în PIB. În anul2012, pe întreg sistemul financiar, acest indicator s-a restrânsmoderat, pe fondul tensiunilor din pieţele financiareinternaţionale.
Ponderea dominantă în cadrul sistemului financiar în anul2012, este deţinută de sectorul bancar cu 66,4% din PIB,urmat de sectorul de microfinanţare cu 2,6% din PIB, precumşi sectorul de asigurări cu 1,4% din PIB. Prin urmare,resursele atrase de la sectorul de microfinanţare şi asigurări aucontinuat să se reducă, creşterea activelor deţinute şiadministrate de instituţiile financiare a avut valori inferioareavansului PIB pe parcursul anului 2012. În ultimii ani, poziţiadominantă a sectorului bancar în cadrul sistemului financiar s-a accentuat uşor, în timp ce ponderea instituţiilor financiarenebancare a continuat şi în anul 2012 tendinţa de scădereînregistrată în anii anteriori.
The National Commission of Financial Market is thevital body which should respond to challenges,particularly for ensuring financial stability andtransparency of the microfinance sector in Moldova,respecting the principle of fair competition, protection ofthe interests of consumers of microfinance services andthe creation of favorable conditions for development andexpansion of microfinance services organizations.Regulatory and supervisory tools of microfinance sectorwill be implemented by the National Commission ofFinancial Market in order to support the sector, not onlybecause of the economic effect, but also the socialaspect of it [3].
Financial stability rating of microfinanceinstitutions.
The assessment of financial stability of themicrofinance institutions allows to identify and addressweaknesses in the sector, therefore, to strengthenresistance to macroeconomic shocks and outsideinfluence. Further the authors aim to analyze themicrofinance sector in Moldova, in terms of financialstability indicators.
1. The degree of financial intermediation: A vitalindicator of the financial stability is the degree offinancial intermediation, evaluated in terms of the shareof financial system assets to GDP in Moldova. In 2012,the entire financial system, this indicator declinedmoderately due to tensions in international financialmarkets.
Dominant share in the financial system in 2012, isowned by the banking sector with 66.4% of GDP, followedby the microfinance sector by 2.6% of GDP, and theinsurance sector by 1.4% of GDP. Therefore the resourcesattracted from the microfinance and insurance sectorcontinued to decline, the increase of assets owned andmanaged by the financial institutions had values lower GDPgrowth during 2012. In recent years, the dominance of thebanking sector in the financial system has increasedslightly, while the share of non-bank financial institutionshas continued and in 2012 the downward trend registered inprevious years.
Fig. 1. Structura sistemului financiar (active în raport cu PIB), %Fig. 1. Financial system structure (assets relative to GDP),%
Sursa/Source: calculele autorului conform datelor Comisiei Naţionale a Pieţei Financiare / According to the data ofthe National Commission of Financial Market.

Revistă teoretico-științifică / Theoretical and scientifical journal92
Nr. 3 / 2013
Analizînd gradul de intermediere financiară prin prismaportofoliul de împrumuturi acordate de către entităţile demicrofinanţare în perioada 2006-2012, se atestă o creştere asectorului microfinanţării din Republicii Moldova în raport cuPIB, cu o uşoară abatere în anul 2010 şi 2011. Pe parcursulanului 2012 a înregistrat o pondere de circa 2,13% din PIB,dintre care sectorul AEÎ – 0,32%, iar al OM – 1,81%. Acestindicator este în scădere cu 0,15 p.p. faţă de anul 2006, fiindinfluenţat de încetinirea indicatorilor activităţii economice aentităţilor de microfinanţare prin sprijinirea procesului deacordare a împrumuturilor cu aplicarea diminuarea cifrei deafaceri a acestora şi concentrarea tuturor eforturilor sprerecuperarea împrumuturilor cu caracter expirat.
Evoluţia numărului participanţilor profesionişti pe piaţafinanciară nebancara a sectorului microfinanţării pe parcursulperioadei 2006-2012 este în creştere. Acest moment esteevident în anul 2009, unde s-au înregistrat 35 organizaţii demicrofinaţare mai mult cu 12 unităţi sau cu aproximativ52,2% faţă de anul 2008, şi în anul 2010 s-au înregistrat 43 deorganizaţii, dintre care 37 au prezentata rapoarte financiare,astfel a crescut cu 2 unităţi faţă de 2009. Însă activitateaacestora nu a avut un impact semnificativ asupra evoluţieisistemului de microfinanţare, ele fiind în primul an deactivitate.
Analyzing the degree of financial intermediationthrough the loan portfolio granted by microfinanceentities in the period 2006-2012, it is attested grow in themicrofinance sector of Republic of Moldova in relationto GDP, with a slight deviation in 2010 and 2011. Duringthe year 2012 has a share of about 2.13% of GDP, ofwhich the SCA sector - 0.32%, and the OM - 1.81%.This indicator is decreasing by 0.15 pp compared to2006, being influenced by the slowdown in economicactivity indicators of microfinance entities by supportingthe process on providing loans by applying their lowerturnover and focusing all efforts to recover loans withexpired character.
The evolution of the number of professionalparticipants on the nonbanking financial market ofmicrofinance sector over the period 2006-2012 isgrowing. This moment is evident in 2009, where therewere 35 microfinance organizations more than with 12units or approximately 52.2% compared to 2008, and in2010 there were 43 organizations, of which 37 havesubmitted financial reports, thus increased by 2 unitsfrom 2009. But their work has not had a significantimpact on the development of the microfinance system,them being in the first year of activity.
Tabelul 1/ Table 1Evoluţia nr. participanţilor profesionişti pe piaţa financiar nebancară
a sectorului mirofinanţării din Republica Moldova, în perioada 2006-2012/Evolution of the number of professional participants of the financial
market sector microfinance in Moldova, 2006-2012Entităţi supravegheate/
supervised entities 2006 2007 2008 2009 2010 2011 2012
Asociaţia centrală/ central association 0 0 0 1 1 1 2Asociaţii de economii şi împrumut/savings and loan associations
485 456 422 394 398 376 359
Organizaţii de microfinanţare/microfinance institution
11 13 24 35 43 59 73
Total - Sectorul microfinanţare/Total - microfinance sector
496 469 446 430 442 440 431
Sursa/Source: calculele autorului conform datelor Comisiei Naţionale a Pieţei Financiare / According to the data ofthe National Commission of Financial Market.
Tendinţă de creştere este accesntuată şi în anul 2012, s-auînregistrate 73 organizaţii de microfinanţare în RepublicaMoldova, mai mult cu 14 unităţi decît în anul 2011. Respectiv,din care 61 au prezentat rapoarte financiare, care oferăîmprumuturi în formă de mijloace băneşti, acordatepersoanelor fizice şi/sau întreprinderilor micro, mici şimijlocii, în baza unui contract cu sau fără dobîndă, ce urmeazăa fi restituit la scadenţă.
2. Adecvarea capitalului: Efectul de pîrghie a coborît în2009 de la 3,9% la 2% în anul 2012, evolutia acestui indicatorfiind rezultatul creşterii mai puternice a activelor la valoaremedie decât capitalul propriu. Cu alte cuvinte efectul depârghie compara activele cu fondurile proprii astfel ca ovaloare mare a acestui indicator arata un grad mare deîndatorare. Valoarea indicatorului se situeză între 2,5 si 1,66 laorganizaţile cu grad de îndatorare acceptabil şi peste 5 laorganizaţiile ce sunt subcapitalizate.
Respectiv, în anul 2012 solvabilitatea organizaţiilor demicrofinanţare (calculat ca raport dintre total active şi
The growth trend is accentuated also in 2012,there were 73 microfinance organizations in Moldova,more with 14 units than in 2011. Respectively, ofwhich 61 have submitted financial reports that provideloans in the form of cash, granted to individuals and / ormicro, small and medium enterprises, under contractwith or without interest, which will be returned atmaturity.
2. Capital adequacy: The leverage effect in 2009fell from 3.9% to 2% in 2012, the evolution of thisindicator is the result of stronger growth than the averagevalue of assets in equity. In other words the leverageeffect compares the assets with its own funds so that ahigh value of this indicator shows a high degree ofindebtedness. The indicator value lies between 2.5 and1.66 in organization with the acceptable level of debt andover 5 organizations that are undercapitalized.
Accordingly, in 2012 the solvency of microfinanceorganizations (calculated as the ratio between total
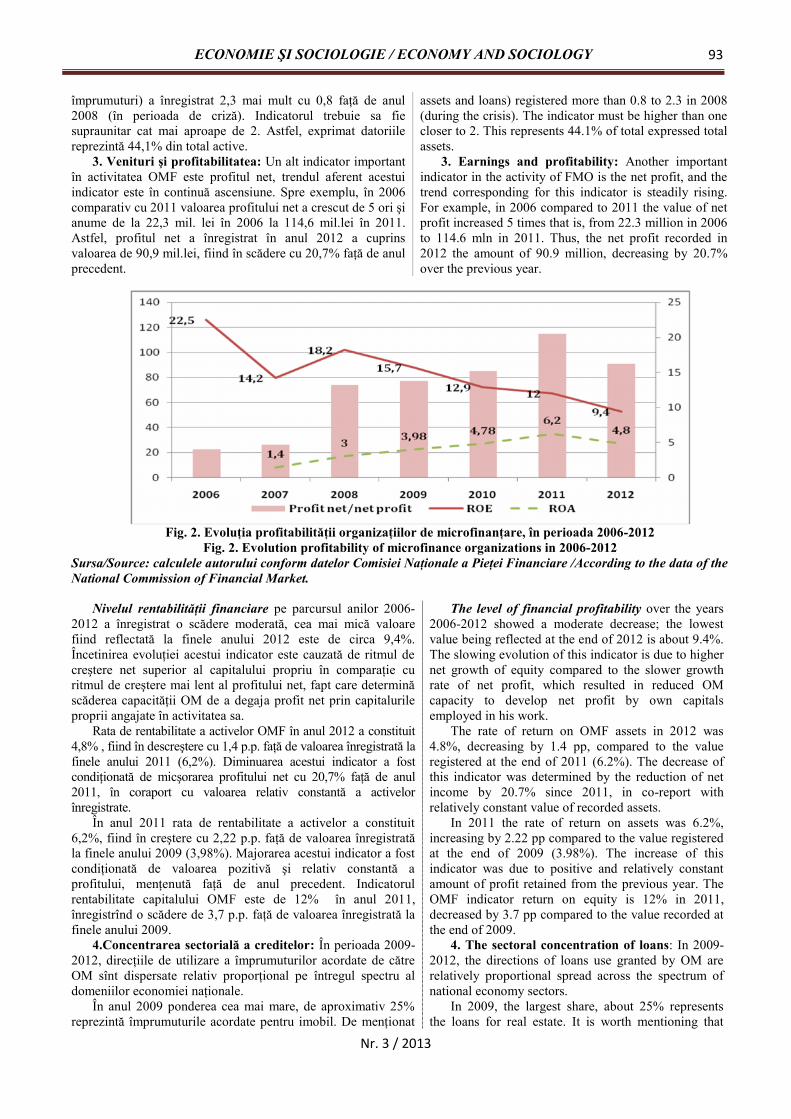
ECONOMIE ŞI SOCIOLOGIE / ECONOMY AND SOCIOLOGY 93
Nr. 3 / 2013
împrumuturi) a înregistrat 2,3 mai mult cu 0,8 faţă de anul2008 (în perioada de criză). Indicatorul trebuie sa fiesupraunitar cat mai aproape de 2. Astfel, exprimat datoriilereprezintă 44,1% din total active.
3. Venituri şi profitabilitatea: Un alt indicator importantîn activitatea OMF este profitul net, trendul aferent acestuiindicator este în continuă ascensiune. Spre exemplu, în 2006comparativ cu 2011 valoarea profitului net a crescut de 5 ori şianume de la 22,3 mil. lei în 2006 la 114,6 mil.lei în 2011.Astfel, profitul net a înregistrat în anul 2012 a cuprinsvaloarea de 90,9 mil.lei, fiind în scădere cu 20,7% faţă de anulprecedent.
assets and loans) registered more than 0.8 to 2.3 in 2008(during the crisis). The indicator must be higher than onecloser to 2. This represents 44.1% of total expressed totalassets.
3. Earnings and profitability: Another importantindicator in the activity of FMO is the net profit, and thetrend corresponding for this indicator is steadily rising.For example, in 2006 compared to 2011 the value of netprofit increased 5 times that is, from 22.3 million in 2006to 114.6 mln in 2011. Thus, the net profit recorded in2012 the amount of 90.9 million, decreasing by 20.7%over the previous year.
Fig. 2. Evoluţia profitabilităţii organizaţiilor de microfinanţare, în perioada 2006-2012Fig. 2. Evolution profitability of microfinance organizations in 2006-2012
Sursa/Source: calculele autorului conform datelor Comisiei Naţionale a Pieţei Financiare /According to the data of theNational Commission of Financial Market.
Nivelul rentabilităţii financiare pe parcursul anilor 2006-2012 a înregistrat o scădere moderată, cea mai mică valoarefiind reflectată la finele anului 2012 este de circa 9,4%.Încetinirea evoluţiei acestui indicator este cauzată de ritmul decreştere net superior al capitalului propriu în comparaţie curitmul de creştere mai lent al profitului net, fapt care determinăscăderea capacităţii OM de a degaja profit net prin capitalurileproprii angajate în activitatea sa.
Rata de rentabilitate a activelor OMF în anul 2012 a constituit4,8% , fiind în descreştere cu 1,4 p.p. faţă de valoarea înregistrată lafinele anului 2011 (6,2%). Diminuarea acestui indicator a fostcondiţionată de micşorarea profitului net cu 20,7% faţă de anul2011, în coraport cu valoarea relativ constantă a activelorînregistrate.
În anul 2011 rata de rentabilitate a activelor a constituit6,2%, fiind în creştere cu 2,22 p.p. faţă de valoarea înregistratăla finele anului 2009 (3,98%). Majorarea acestui indicator a fostcondiţionată de valoarea pozitivă şi relativ constantă aprofitului, menţenută faţă de anul precedent. Indicatorulrentabilitate capitalului OMF este de 12% în anul 2011,înregistrînd o scădere de 3,7 p.p. faţă de valoarea înregistrată lafinele anului 2009.
4.Concentrarea sectorială a creditelor: În perioada 2009-2012, direcţiile de utilizare a împrumuturilor acordate de cătreOM sînt dispersate relativ proporţional pe întregul spectru aldomeniilor economiei naţionale.
În anul 2009 ponderea cea mai mare, de aproximativ 25%reprezintă împrumuturile acordate pentru imobil. De menţionat
The level of financial profitability over the years2006-2012 showed a moderate decrease; the lowestvalue being reflected at the end of 2012 is about 9.4%.The slowing evolution of this indicator is due to highernet growth of equity compared to the slower growthrate of net profit, which resulted in reduced OMcapacity to develop net profit by own capitalsemployed in his work.
The rate of return on OMF assets in 2012 was4.8%, decreasing by 1.4 pp, compared to the valueregistered at the end of 2011 (6.2%). The decrease ofthis indicator was determined by the reduction of netincome by 20.7% since 2011, in co-report withrelatively constant value of recorded assets.
In 2011 the rate of return on assets was 6.2%,increasing by 2.22 pp compared to the value registeredat the end of 2009 (3.98%). The increase of thisindicator was due to positive and relatively constantamount of profit retained from the previous year. TheOMF indicator return on equity is 12% in 2011,decreased by 3.7 pp compared to the value recorded atthe end of 2009.
4. The sectoral concentration of loans: In 2009-2012, the directions of loans use granted by OM arerelatively proportional spread across the spectrum ofnational economy sectors.
In 2009, the largest share, about 25% representsthe loans for real estate. It is worth mentioning that

Revistă teoretico-științifică / Theoretical and scientifical journal94
Nr. 3 / 2013
este că 23% din împrumuturi sînt acordate pentru dezvoltareaindustriei şi comerţului şi doar 17% – pentru consum, fapt caredemonstrează suplimentar prudenţa cu care OM acordăîmprumuturile.
Iar în anul 2012, ponderea cea mai mare, de circa 31,5%,reprezintă împrumuturile acordate pentru consum, 27,4% dinîmprumuturi au fost acordate pentru industrie şi comerţ, prioritarîntreprinderilor micro, mici şi mijlocii. Iar 14,0% constituieîmprumuturile acordate pentru imobil, ponderea semnificativă acărora se datorează valorilor mari ale împrumuturilor pentruprocurarea locuinţelor, faţă de numărul relativ mic de beneficiariai unor asemenea credite.
23% of loans are granted for development of industryand trade, and only 17% - for consumption, whichfurther demonstrates the prudence with which OMgrant loans.
And in 2012, the largest share of about 31.5%are consumer loans, 27.4% of the loans weregranted to industry and commerce, primarily micro,small and medium enterprises. And 14.0% are loansfor real estate, a significant proportion of which is dueto high levels of loans for purchase of houses,compared to the relatively small number ofbeneficiaries of such loans.
Fig. 3. Clasificarea împrumuturilor acordate pe direcţii de utilizare, în perioada 2009-2012, %Fig. 3. Classification of loans granted to the directions for use, in 2009-2012,%
Sursa/Source: calculele autorului conform datelor Comisiei Naţionale a Pieţei Financiare / According to the data ofthe National Commission of Financial Market.
5. Gradului de concentrare: Piaţa de microfinanţareeste caracterizată printr-un Grad înalt de concentrare. Totuşi seobservă o diminuare a gradului de concentrare pe acest sector.Lider după valoarea împrumuturilor acordate în anul 2007 esteProCredit, căruia îi revine o cotă de 42% din valoareaindicatorului dat, iar în anul 2008 deţine 22%, mai puţin cu 20p.p. În 2011 organizaţia ProCredit nu a acordat nici unîmprumut, înregistrînd şi pierderi în sumă de 4 mil.lei, iar înanul 2012 şin începutul anului 2013, această organizaţie este înproces de lichidare.
În anul 2012 - 77% din volumul împrumuturilor acordaterevin la 6 companii din topul respectiv, dintre care PrimeCapital cu 18,3%, Credit Rapid cu 13,6%. Microinvest cu13,5%, urmat de ElatProfit 12,9%, Corporaţia de FinanţareRurală cu 12,5%.
Respectiv, în anul 2010 se evidenţiază o scădere de 5 p.p. laacest indicator, constiuind 72% din volumul împrumuturiloracordate, dintre care: Corporaţia de Finanţare Rurală deţine 9%din valoarea indicatorului dat, iar în anul 2009 deţine 13% şirespectiv în 2008 constituie 28%. La rîndul său se observă oreducere la OM Microinvest ce în anul 2010 deţine o cotă de14%, respectiv în perioada 2008-2009 îşi menţine poziţia,constituind o cotă de 18%.
5. The concentration degree: the microfinance marketis characterized by a high degree of concentration.However there is a decrease in the concentration on thissector. The leader after the amount of loans granted in2007 is ProCredit, which bears a share of 42% of the valueof this indicator and in 2008 holds 22%, less than 20 pp. In2011 the ProCredit organization did not give any loan,recording also losses amounting to 4 million, and in 2012and in the beginning of 2013, this organization is in theprocess of liquidation.
In 2012-77% from the amount of loans granted goes tothe 6 companies from the respectively top, of which PrimeCapital with 18.3%, Credit Rapid with 13.6%. MicroInvestwith 13.5%, followed by 12.9% ElatProfit, Rural FinanceCorporation 12.5%.
Accordingly, in 2010 shows a decrease of 5 p.p. to thisindicator, accounting 72% from the amount of loansgranted, including: Rural Finance Corporation that holds9% of the value of this indicator and in 2009 holds 13%and respectively in 2008 is 28%. In turn there is areduction in OM MicroInvest which in 2010 has a share of14% and maintains its position in 2008-2009, representinga share of 18%.
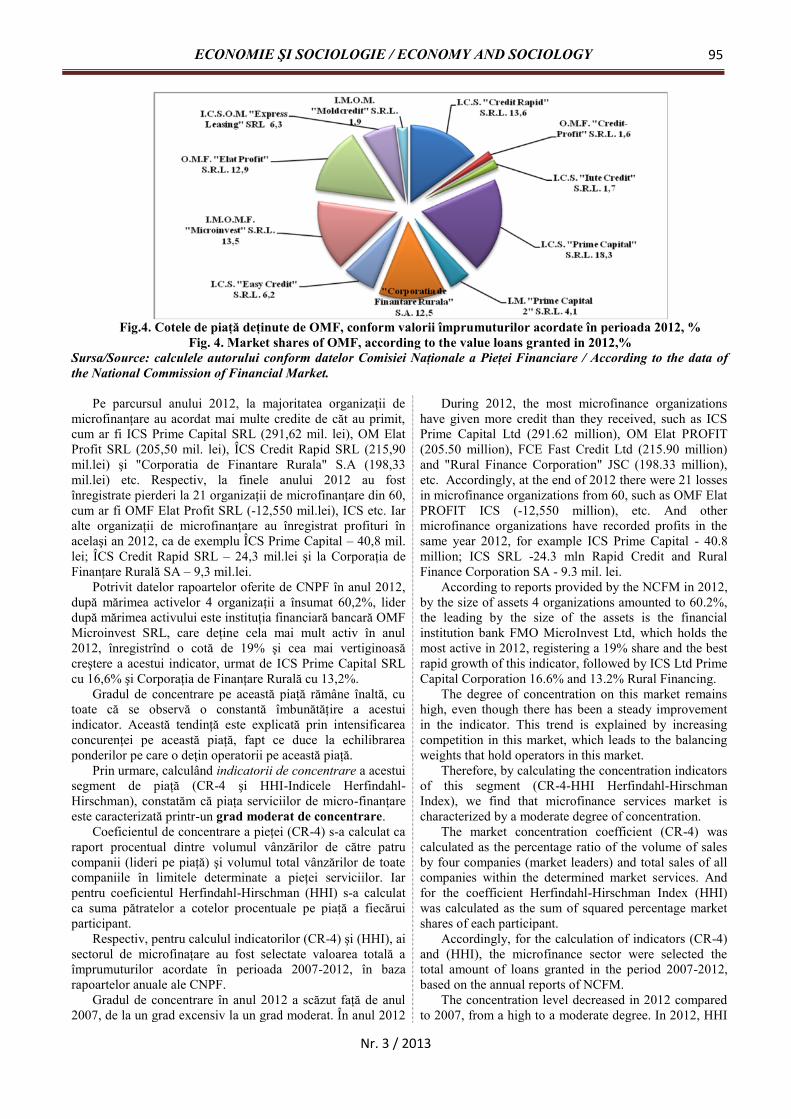
ECONOMIE ŞI SOCIOLOGIE / ECONOMY AND SOCIOLOGY 95
Nr. 3 / 2013
Fig.4. Cotele de piaţă deţinute de OMF, conform valorii împrumuturilor acordate în perioada 2012, %Fig. 4. Market shares of OMF, according to the value loans granted in 2012,%
Sursa/Source: calculele autorului conform datelor Comisiei Naţionale a Pieţei Financiare / According to the data ofthe National Commission of Financial Market.
Pe parcursul anului 2012, la majoritatea organizaţii demicrofinanţare au acordat mai multe credite de căt au primit,cum ar fi ICS Prime Capital SRL (291,62 mil. lei), OM ElatProfit SRL (205,50 mil. lei), ÎCS Credit Rapid SRL (215,90mil.lei) şi "Corporatia de Finantare Rurala" S.A (198,33mil.lei) etc. Respectiv, la finele anului 2012 au fostînregistrate pierderi la 21 organizaţii de microfinanţare din 60,cum ar fi OMF Elat Profit SRL (-12,550 mil.lei), ICS etc. Iaralte organizaţii de microfinanţare au înregistrat profituri înacelaşi an 2012, ca de exemplu ÎCS Prime Capital – 40,8 mil.lei; ÎCS Credit Rapid SRL – 24,3 mil.lei şi la Corporaţia deFinanţare Rurală SA – 9,3 mil.lei.
Potrivit datelor rapoartelor oferite de CNPF în anul 2012,după mărimea activelor 4 organizaţii a însumat 60,2%, liderdupă mărimea activului este instituţia financiară bancară OMFMicroinvest SRL, care deţine cela mai mult activ în anul2012, înregistrînd o cotă de 19% şi cea mai vertiginoasăcreştere a acestui indicator, urmat de ICS Prime Capital SRLcu 16,6% şi Corporaţia de Finanţare Rurală cu 13,2%.
Gradul de concentrare pe această piaţă rămâne înaltă, cutoate că se observă o constantă îmbunătăţire a acestuiindicator. Această tendinţă este explicată prin intensificareaconcurenţei pe această piaţă, fapt ce duce la echilibrareaponderilor pe care o deţin operatorii pe această piaţă.
Prin urmare, calculând indicatorii de concentrare a acestuisegment de piaţă (CR-4 şi HHI-Indicele Herfindahl-Hirschman), constatăm că piaţa serviciilor de micro-finanţareeste caracterizată printr-un grad moderat de concentrare.
Coeficientul de concentrare a pieţei (CR-4) s-a calculat caraport procentual dintre volumul vânzărilor de către patrucompanii (lideri pe piaţă) şi volumul total vânzărilor de toatecompaniile în limitele determinate a pieţei serviciilor. Iarpentru coeficientul Herfindahl-Hirschman (HHI) s-a calculatca suma pătratelor a cotelor procentuale pe piaţă a fiecăruiparticipant.
Respectiv, pentru calculul indicatorilor (CR-4) şi (HHI), aisectorul de microfinaţare au fost selectate valoarea totală aîmprumuturilor acordate în perioada 2007-2012, în bazarapoartelor anuale ale CNPF.
Gradul de concentrare în anul 2012 a scăzut faţă de anul2007, de la un grad excensiv la un grad moderat. În anul 2012
During 2012, the most microfinance organizationshave given more credit than they received, such as ICSPrime Capital Ltd (291.62 million), OM Elat PROFIT(205.50 million), FCE Fast Credit Ltd (215.90 million)and "Rural Finance Corporation" JSC (198.33 million),etc. Accordingly, at the end of 2012 there were 21 lossesin microfinance organizations from 60, such as OMF ElatPROFIT ICS (-12,550 million), etc. And othermicrofinance organizations have recorded profits in thesame year 2012, for example ICS Prime Capital - 40.8million; ICS SRL -24.3 mln Rapid Credit and RuralFinance Corporation SA - 9.3 mil. lei.
According to reports provided by the NCFM in 2012,by the size of assets 4 organizations amounted to 60.2%,the leading by the size of the assets is the financialinstitution bank FMO MicroInvest Ltd, which holds themost active in 2012, registering a 19% share and the bestrapid growth of this indicator, followed by ICS Ltd PrimeCapital Corporation 16.6% and 13.2% Rural Financing.
The degree of concentration on this market remainshigh, even though there has been a steady improvementin the indicator. This trend is explained by increasingcompetition in this market, which leads to the balancingweights that hold operators in this market.
Therefore, by calculating the concentration indicatorsof this segment (CR-4-HHI Herfindahl-HirschmanIndex), we find that microfinance services market ischaracterized by a moderate degree of concentration.
The market concentration coefficient (CR-4) wascalculated as the percentage ratio of the volume of salesby four companies (market leaders) and total sales of allcompanies within the determined market services. Andfor the coefficient Herfindahl-Hirschman Index (HHI)was calculated as the sum of squared percentage marketshares of each participant.
Accordingly, for the calculation of indicators (CR-4)and (HHI), the microfinance sector were selected thetotal amount of loans granted in the period 2007-2012,based on the annual reports of NCFM.
The concentration level decreased in 2012 comparedto 2007, from a high to a moderate degree. In 2012, HHI
Revistă teoretico-științifică / Theoretical and scientifical journal96
Nr. 3 / 2013
indicatorul HHI-Indicele Herfindahl-Hirschman a constituit1132 puncte mai puţin cu 1561 puncte faţă de 2007. Respectivşi indicatorul CR-4 a constituit în 2012 – 58%, ce s-a redus cu35p.p., faţă de anul 2007. Aceasta se explică prin faptul, că înanul 2007 au activat 13 companii de microfinanţaremajoritatea cotei era deţinute de compania ProCredit cu 42%,iar în anul 2012 au activat 60 de compani şi majoritatea coteieste deţinută de compania PrimeCapital cu 18%, deci seobservă că au apărut mai multe compani de microfinanţare,piaţa fiind diversificată. Deci, cele mai mari cote în anul 2012sunt deţinute de primele 3 companii de microfinaţare (PrimeCapital, Microinvest, Credit Rapid), cota cumulativă aacestora constituie 45,4% după împrumuturi acordate.
indicator Herfindahl-Hirschman was 1132 points to 1561points less than in 2007. Respectively and the CR-4indicator was in 2012 - 58%, which was reduced by35p.p. compared to 2007. This is explained by the factthat in 2007, 13 microfinance companies activated, themajority owned by ProCredit with 42% and in 2012acted 60 company and the majority owned byPrimeCapital with 18%, so it appears to have occurredseveral microfinance company, the market beingdiversified. So the highest odds in 2012 are held by thetop 3 microfinance companies (Prime Capital,MicroInvest, Credit Fast), their cumulative share is45.4% by granted loans.
Tabelul 2/ Table 2Indicatorii de concentrare a pieţei de microfinanţare, în anii 2010-2012
The indicators of market concentration microfinance in 2010-2012Nr. Indicatorii/Indicators 2007 2011 20121 CR-4, % 93 65 582 HHI, puncte/points 2693 1248 1132
Sursa/Source: calculele autorului conform datelor Comisiei Naţionale a Pieţei Financiare / According to the data ofthe National Commission of Financial Market.
Un astfel de nivel al indicatorului (1132), înregistrat în anul2012, produce nelinişte şi este considerat un semnal deavertizare, este necesară o verificare suplimentară araţionalităţii concentrărilor din partea organelor dereglementare în domeniu.
O astfel de analiză a indicatorilor de evaluare a stabilităţiifinanciare este necesară pentru elaborării măsurilor deminimizare a riscurilor sistemice.
Concluzii. În acest context, analiza evoluţiei sectorului demicrofinanţare demonstrează că, deşi acesta deţine proporţiimai reduse în economia ţării, inclusiv în comparaţie cu sectorulbancar, raza lui de cuprindere este foarte vastă, oferindu-seservicii de creditare accesibile şi disponibile întreprinderilormici şi mijlocii, precum şi păturilor social vulnerabile pe întregteritoriul ţării, în mod prio¬ritar în zonele rurale.
Stabilitatea financiară este rezultatul comportamentuluiadecvat condiţiilor, manifestat de către acţionari, manageri şiautorităţile de reglementare şi supraveghere micro şimacroprudenţială. Nivelurile de solvabilitate, provizionare şilichiditate s-au menţinut în limite adecvate, iar finanţareasectorului real nu a fost afectată semnificativ de procesul dedezintermediere financiară, rămânând relativ modestă şicontinuând să se desfăşoare ordonat. CNPF şi-a intensificatacţiunile de monitorizare a riscurilor la nivelul instituţiilor demicrofinanţare.
Such level of indicator (1132), recorded in 2012,produces anxiety and is considered a warning signal,that requires a further examination of the concentrationsof rationality from regulatory bodies in the field.
Such an analysis of indicators for assessing financialstability is necessary for the development of measures tominimize systemic risks.
Conclusions. In this context, the analysis of themicrofinance sector demonstrates that, although it haslower proportions in the national economy, including incomparison with the banking sector, the radius ofcoverage is very extensive, offering accessible andaffordable lending services to small and medium as wellas to socially vulnerable groups throughout the country,with priority to rural areas.
The financial stability is the result of properbehavior to conditions, manifested by shareholders,managers and regulators of micro and macro-prudentialsupervision. The levels of solvency, provisioning andliquidity were maintained in appropriate limits and thereal financing sector was not significantly affected bythe financial disintermediation process, continuing toremain relatively modest and orderly take place. TheNCFM has stepped up the risks monitoring actions inthe microfinance institutions.
Referinţe bibliografice / References1. Legea asociaţiilor de economii şi împrumut: nr. 139-XVI din 21.06.2007. In: Monitorul Oficial al Republicii
Moldova. 2007, nr. 112-116, art. 506.2. Legea cu privire la organizaţiile de micro-finanţare: nr. 280-XV din 22.07.2004. In: Monitorul Oficial al Republicii
Moldova. 2004, nr. 138-146, art. 737.3. Comisia Naţională a Pieţei Financiare din Republica Moldova [accesat 11 martie 2013]. Disponibil: www.cnpf.md4. Stabilitatea financiară [accesat 11 martie 2013]. Disponibil: http://ru.scribd.com/doc/53068325/ Stabilitatea-financiara
Recomandat spre publicare: 10.05.2013
ECONOMIE ŞI SOCIOLOGIE / ECONOMY AND SOCIOLOGY 97
Nr. 3 / 2013
CAPACITĂŢILE INOVAŢIONALE ALE REPUBLICIIMOLDOVA: POATE CHESTIONARUL
INOVAŢIONAL COMUNITAR SĂ CONTRIBUIE LASUCCESUL UNEI ŢĂRI ÎN CURS DE DEZVOLTARE?
MOLDOVA’S CHANCETO INNOVATION: CAN THE CISSURVEY HELP A DEVELOPING
COUNTRYSUCCEED?
Daniela DUCA, drd., INCE, Chişinău, RM,Bloomberg, London, UK
Daniela DUCA, PhD student, NIER, Chisinau, RM,Bloomberg, London, UK
Republica Moldova este una dintre puţinele ţări rămase înEuropa, care nu a aprobat încă chestionarul inovaţionalcomunitar. Poate acest studiu ajuta Moldova să identificeneajunsurile şi avantajele sistemului său naţional de inovare?Acest articol prevede, că CIC este într-adevăr un instrumentutil pentru un studiu diagnostic iniţial. Cu toate acestea, într-o economie de tranziţie, în care puţin se ştie despre inovaţie,rezultatele CIC trebuie să fie completate cu chestionaredeschise. Se constată că, deşi producţia de inovare esterelativ mare în comparaţie cu alte ţări în curs de dezvoltare,Republica Moldova este blocată în modelul inovaţionalRothwell de prima generaţie. Mai mult decât atât, întrucât nusunt resurse disponibile pentru achiziţionarea de noitehnologii, guvernul şi companiile private pot lucra pentruîncurajarea unei infrastructuri de cunoaştere, care săpromoveze inovaţiile organizaţionale şi de management.
Cuvinte cheie: chestionar inovaţional, achiziţionare detehnologii, Moldova.
The Republic of Moldova is one of the few remainingcountries in Europe that has not yet taken the CommunityInnovation Survey (CIS). Can this survey help Moldovaidentify the drawbacks and advantages of its nationalinnovation system? This article establishes that CIS isindeed a useful tool for an initial diagnostic study.However, in a transitional economy, where little is knownabout innovation, CIS results must be complemented withopen-ended questionnaires. It is found that, even thoughthe innovation output is relatively high compared to otherdeveloping countries, Moldova is stuck in Rothwell’s firstgeneration model of innovation. Moreover, as resourcesare not readily available for purchasing new technologies,the government and private companies can work towardsencouraging a knowledge infrastructure that promotesorganizational and management innovations.
Keywords: Innovation surveys, technology acquisition,Moldova.
JEL Classification: O31, O33, O57
Introduction. As the Republic of Moldova is on itsway to adhering to the European Union (EU), innovationwould likely be the wisest strategy for companiesand the government alike to speed up the developmentprocess. A number of studies have shown the positiveeffect of innovation on growth and have identified amyriad of models, as well as factors that promoteinnovativeness, but a limited number focused on thecontext of Moldova.
On the one hand, there are simpler technology-linked innovation models (Rothwell 1994) and morecomplex models like games of innovation (Floricel 2007)that describe the innovation process. On the otherhand, the factors at the base of these models are sometimesproven to have a positive and other times negativeeffects on innovation. This only suggests that, dependingon the ecosystem in which an innovation is promoted,different factors within different stages, activities orgames, will affect the process in different ways(Dougherty 2007).
Thus, the current study will not attempt to identify thecorrelations between factors and the innovation process.Rather, it will analyze the methodology required toconstruct a comprehensive image of the nationalinnovation system in the Republic of Moldova at multiplelevels of the economy.
The basic contentInnovation models and methodologies for data
collectionA limited number of researchers have tried to address
innovation issues and study the innovation systems indeveloping countries, but there has not been a dedicated
investigation of the private sector in Moldova specifically.Two papers incorporate data on Moldovan enterprises aspart of larger investigations of 27 (Gorodnichenko 2008)and 47 developing countries (Ayyagari 2011).Additionally, one paper investigates the data collected viathe INNOBarometer in more than 1000 Moldovancompanies (Hîrbu 2012).
Gorodnichenko et al. (2008) find that companies indeveloping countries located further away from thefrontier actually suffer as a result of competition, hence areless innovative. Higher foreign competition for Moldovanenterprises should, therefore, promote innovation.Ayyagari et al. (2011) show that foreign competitiongenerally improves innovation. Similarly, the levels ofeducation of managers, access to finance and familyownership all have positive effects on innovation(Ayyagari 2011).
Although these studies have identified importantcorrelations between factors and innovation in the contextof the developing world, they aggregate and compare allfirms from transitional economies in Eastern Europe andLatin America or Asia. These economies are notnecessarily caught in transition for the same reason; thus,the context for innovation may differ. Most of the timeAsian and Latin American countries experience the “Dutchdisease”, or are dependent on their raw material exports(Chang 2003), none of which is the case for Moldova.
The popular Community Innovation Survey (CIS) oradaptations of it have been conducted already in over 50countries mostly in Europe, some in Latin American,Asia and Africa. Bulgaria, Czech Republic, Latvia,Estonia, Lithuania, Hungary, Poland, Slovenia, Slovakia,

Revistă teoretico-științifică / Theoretical and scientifical journal98
Nr. 3 / 2013
Romania, Russia, Croatia, Turkey and Ukraine have allendeavored into company-specific innovation surveys todiagnose their output, expenditure, sources of innovationand its hampering factors (Bogliacino 2010).
More specialized innovation surveys have beenconducted for individual research studies in moderatelydeveloped countries of the EU like Romania and Slovenia.One such study found that technological opportunities,firm age and the country have a great deal of impact on thelevel of technological innovativeness (Antoncic, et al.2007).
Moldovan enterprises have been part of larger datacollections, such as the World Banks’ enterprise survey(WBES), completed with the assistance of the EuropeanBank for Reconstruction and Development (EBRD). Thisdatabase contains a limited number of questions focusedon innovation. An attempt to a dedicated innovationsurvey has been made in 2011, when data was collectedfor the INNOBarometer-2010 with assistance from theAgency for Innovation and Technological Transfer(AITT), the National Statistics Bureau, the Academy ofScience and the Academy of Economics of Moldova(AITT 2011).
A dedicated innovation survey would allow a detailedanalysis of the resources available to Moldovan enterprisesand their capacities to absorb and use them for innovativepurposes. It would also provide a better understanding ofthe innovation tendencies that exist among entrepreneursand managers here. A short study using theINNOBarometer 2010 data has found that companies inthe capital city are the most innovative, contributing to thetotal of 30% innovation within the country (Hîrbu 2012).Additionally, the INNOBarometer focuses on R&Dspending, finding the highest costs for R&D associatedwith state-owned enterprises (92% of total spending). Thearticle doesn’t show any correlations between R&D andhigher innovation levels or company performance andthere are no clear policy implications from such analysis.
The CIS is also known for its limitations on policy-oriented indicators (Arundel, Innovation SurveyIndicators: Any Progress since 1996-2006) anddevelopment-specific questions (Sutz 2012, Marins 2008).Sutz (2012) suggests including questions about humanresources, asking about the field not only the level ofstudy, adding more innovative activities pertinent to thedeveloping context, and enhancing technology-relatedsections focusing specifically on the demand. Marins(2008) proposes a whole new structure of the family ofindicators for emerging economies that would focus on 4categories – entrepreneurship, structure, coordination andvalue – as opposed to the usual inputs, outputs andinnovation activities.
Arundel (2006) challenges the usefulness of the CISfor policy-makers. Although he acknowledges the qualityof the data for comparative reasons, he argues that thegeneral perceptions differ from country to country, and thesurvey analysis lacks indicators relevant for policy analysts.He suggests the use of complex indicators, like the share ofcompanies that introduce new to market innovations and areactive on the international market, or active knowledgediffusion, or characteristics of innovative firms.
In a related paper, Arundel and Hollanders (2006) suggestcombining the source of innovation with the outcome toproxy for the successful adoption of innovations. Amongother missing indicators, they mention the rate of internalentrepreneurship, volume of spin-offs, venture capitalavailable for innovative activities, availability of qualifiedinnovation managers that can guide the process through toimplementation, the percentage of employees affected byinnovation, and the demand for innovation (Arundel andHollanders, Searching the Forest for the Trees: ”Missing”Indicators of Innovation 2006, Arundel, Innovation SurveyIndicators: Any Progress since 1996-2006).
More comprehensive studies follow companieslongitudinally or conduct open-ended interviews with themanagers to understand the internal organization as well asthe perception of innovation among employees of allranks. Case in point serves the longitudinal studyconducted by Christensen on two large Danishmanufacturing companies (Christensen 2002). He finds anumber of techniques that worked in each of the twocompanies and he manages to determine the areas withgreater or smaller capacities that would allow forcontinuous technological innovation. Christensen is onlyable to construct the capacity argument because of hislong-term understanding for the companies’ dynamics,business model, mission and culture (Christensen 2002).
Longitudinal studies and open-ended interviews tosome extent will, thus, provide a better understanding ofthe firm dynamics and strategy or decision-making biases.In this paper, it will be argued that such studies are criticalfor a transitional economy as innovation does not onlydepend on the available resources, but also the capacityand willingness of firms to employ these for innovativeactivities.
On the macroeconomic level, the National Bureau ofStatistics of Moldova also collects data regarding aspectsof the innovation infrastructure, which were fed into theGlobal Innovation Index prepared by INSEAD along withother data from WBES. All these sources, complementedby the CIS and an open-ended interview conducted withthe managers of a few enterprises can contribute toconceiving a comprehensive image of the Moldovaninnovation infrastructure.
The ultimate goal of this study, thus, is to devise themost efficient method to gather enough quantitative andqualitative data around the innovation process of theprivate sector in Moldova in order to build a base forpolicy-making and assist companies with implementingnew techniques for innovation.
Methodology. The methodology in this study will bediscussed in terms of the data sources, data collection andanalysis.
Data sources. This paper employs 4 different datasources with an ultimate goal of defining the indicatorsthat would help construct the building blocks of thenational innovation system and find the proximate hurdlesto innovating effectively. The WBES is used as a firstsource of information on innovative activities in Moldovanenterprises (Enterprise Analysis Unit – World Bank Group2009). The survey covers 363 small, medium and largecompanies in Moldova.

ECONOMIE ŞI SOCIOLOGIE / ECONOMY AND SOCIOLOGY 99
Nr. 3 / 2013
Amongst its 262 indicators, it carries questions relatedto the new or improved products or services, access tofinance, acquired technology, investments in R&D,uneducated workforce as an obstacle, competition andcustomers’ role in developing new products, access tocomputers and internet.
The INNOBarometer 2010 data is used as a secondsource of information more specifically linked toinnovation and resources for innovation (AITT 2011).Among the main indicators are human resources and thelevel of education, availability of public finance, R&D andnon-R&D spending for innovation, public-privatecollaborative activities, product and process innovations,marketing and organizational innovations and the sellingand exporting of such innovations. A dedicated innovationquestionnaire adapted from the CIS and translated intoRomanian was used as a third source of innovation data.This questionnaire addressed both the inputs and outputsof innovation on a firm level to understand the limitationsand the use of resources for innovative purposes. Thequestionnaire followed the structure of the UK CIS 2006-2008, however, the period was extended to 4 years and themarkets were modified to include the former Soviet block.
Lastly, a selected number of managers were given theopportunity to express their opinions and perception ofinnovation and innovative activities via an open-endedquestionnaire in the local language. This exercise wasconducted in order to gather a better understanding of thepreponderant local awareness of innovation, the types anduses as well as the techniques used to include it in businessmodels or within the company strategies.
Data collection and analysis. The CIS questionnairecovers the period of 2009 to 2012 and was carried out in40 enterprises all headquartered in the capital city. Thesample was randomly selected to include large and smallcompanies, with more and less known brands, private,public and state-owned, young, as well as more establishedcompanies. Table 1 below is a summary of the sampledistribution by sector. All companies were assuredanonymity to increase the number of responses, as well asdecrease any reporting biases.
The questionnaire results were analyzed in the contextof the data available from the World Bank enterprisesurvey and the INNOBarometer, considering the latter twocover data only up to 2010. Also, comparative analysiswith similar indicators in the EU was carried out.
A selected number of companies that responded to theCIS survey were further questioned on their perception oninnovation. The findings from this evaluation werejuxtaposed with the data available from the large-scaleenterprise and CIS surveys to illustrate the limits ofmeasuring innovation. This analysis allows to determinethe missing indicators from the three surveys and tosuggest an additional set of questions that would allow aCIS survey in Moldova to identify the major areas thatneed policy intervention.
Findings. The findings in this study will be discussedin terms of the survey approach, which will include thedata from the three surveys and the consultant’s approach,which will expand on the open-ended questionnaire.
The survey approach. All three large-scale data sourcesconfirm a relatively high level of innovative companies inMoldova compared to other developing countries and insome cases even developed. According the WBES,between 2007 and 2009, 53% of the companies reviewedhave implemented a new product or service on the marketand 64% improved existing ones (Enterprise Analysis Unit– World Bank Group 2009). The INNOBarometer findsthat slightly more than 30% of the surveyed enterpriseshave implemented a new or significantly improved productfor the firm in 2009-2010. Out of the 40 firms that weretested for the CIS survey, 64% have implemented aservice, product or process innovation over the past 4years.
These figures signal the fact that innovation withinMoldovan companies is high. In the majority of cases,however, the innovation implemented is new only for thefirm and rarely for the market or for the industry. Only19% of more than 1,000 companies interviewed for theINNOBarometer have launched products and services newto their market. This figure aligns with countries likeRomania, Bulgaria, Latvia, Slovakia and Serbia (AITT2011). In other words, Moldovan enterprises are actingmore as imitators, than as original innovators, hence cansucceed mostly on local markets and less so on theinternational ones.
In terms of inputs, innovative enterprises in Moldovaallocate their financial resources to R&D activities.World Bank enterprise data shows that 72% of companiesinvest in internal R&D, while 16% acquire oradapt technologies from other companies. TheINNOBarometer finds that 23% of the firms have investedin internal R&D, most of which are located in themunicipality of Chisinau and the southern region.However, the total figure of R&D spending lies at 0.037%of total GDP, which is below the 3% target set by theLisbon Treaty (AITT 2011).
Out of the 31 companies that recorded a figure forR&D costs with the WB, 64% spent up to 300,000 MDL(equivalent of 18,000 EUR) and 15% up to 6 million MDL(equivalent of 370 thousand EUR). CIS data identifiesthat 80% of a company’s spending on R&D goesto the acquisition of software and other tech equipment.The INNOBarometer data, however, shows that between70 and 80% of R&D spending is for personnel (Hîrbu2012).
Human resources represent a second input toinnovation activities, and more precisely the level ofeducation of the workforce, specialization and theoffering of continuous internal trainings. Close to half ofthe surveyed firms have identified the inadequatelyeducated workforce as major or severe obstacle toperformance (Enterprise Analysis Unit – WorldBank Group 2009). Only 13.7% of the populationbetween 20 and 24 years of age graduated from aspecialized college or university. This figure is atleast 50% in 34 other European states, such as Turkey,Iceland and Macedonia. However, there were 0.71% newPhD graduates within the age group of 25 to 34 in2010.

Revistă teoretico-științifică / Theoretical and scientifical journal100
Nr. 3 / 2013
Table 1Company sample for the CIS survey against the totals for the Republic
Industry/activity Sector CISFirms
Total nr.of firms*
Relativenr. of
employees*
Totalrevenues,million lei(MDL)*
Totals by activity 40 48541 510191 207676.8A Agriculture, hunting and forestry 0 5.1% 9.9% 4.0%B Fishing 0 0.2% 0.1% 0.0%C Mining 0 0.2% 0.5% 0.3%D Manufacturing 12 10.4% 19.1% 15.0%
D15 Food and Beverages 3 2.5% 7.2% 7.4%D17 Textiles 2 0.3% 0.8% 0.6%D19 Leather and shoes 1 0.2% 0.8% 0.2%D22 Publishing 3 1.2% 0.8% 0.4%D24 Chemical industry 2 0.2% 0.5% 0.6%D25 Rubber and plastics 1 0.7% 0.7% 0.6%
E Utilities 3 0.5% 3.6% 9.6%F Construction 0 5.5% 5.3% 4.4%
G Wholesale and retail, repair of motorvehicles and household goods
6 40.9% 21.9% 47.0%G50 Sale, maintenance andrepair of motor vehicles 1 3.6% 2.3% 6.7%G51 Wholesale 3 15.5% 8.4% 29.8%G52 Retail 2 21.8% 11.2% 10.5%
H Hotels and Restaurants 3 3.1% 2.5% 0.8%I Transport and communication 4 6.8% 11.0% 9.6%
I64 Post and communications 4 1.0% 2.8% 3.6%J Financial activities 4 1.8% 0.6% 2.4%
K Real estate, renting and enterpriseservices
1 16.5% 10.1% 4.1%K73 Research andDevelopment 1 0.2% 0.2% 0.1%
M Education 1 0.7% 0.9% 0.2%N Health and social care 3 1.6% 10.3% 2.0%O Other activities 4 6.8% 4.0% 0.1%
O91 Membership organizations 1 4.1% 1.5% 0.0%O92 Entertainment and sports 2 1.3% 1.5% 0.5%O93 Private services 1 1.2% 0.5% 0.1%
Sursa/Source: * Biroul Naţional de Statistică al Republicii Moldova, 2012.
This figure is higher than that of European countrieslike Macedonia, Serbia, Iceland, Turkey, Malta,Luxemburg, Latvia, Bulgaria and Cyprus. These data signala low capacity of the education system of the country toproduce a young and highly skilled labor force, all this notconsidering the quality of education.
Half of the firms report that less than 10% of theiremployees have a college or university degree and 90%hardly reach a workforce composed of 50% highly skilledlabor (Enterprise Analysis Unit – World Bank Group 2009).The CIS survey confirms the role of personnel qualificationsfor encouraging innovation, however, it only collects data onthe distribution of employees based on their specialty. Hence,an average of only 20% of the workforce has obtained adegree in natural sciences and engineering. This figure isslightly high, due to regional bias in the CIS sample.
In terms of the sources of innovation, the CISenterprises prefer customers, internal sources, suppliers andcompetitors. This is also confirmed by the WBES that finds46-48% of companies believe that customers andcompetitors are an important source of new products,services and processes. This statistic is relatively oddconsidering the low level of competition in the countrybased on world rankings (INSEAD 2012) and the limited
availability of internal information sources. Thisconclusion is backed up by the availability of Internetand computers within firms. Only 53% of the companieshave high-speed internet set up and close to 61% of thefirms provide computer access to less than 10% of theirworkforce (Enterprise Analysis Unit – World Bank Group2009).
According to the CIS survey, new regulations, productquality and increasing the range of products andservices are the main facilitators for the decision toinnovate in Moldova. Of the non-innovators, 54% claimthat the market conditions did not trigger nor allow thepossibility to innovate, while 24% have innovatedpreviously, hence, do not feel the need to continue. Otherinhibitors to innovation that were scored highly are theavailability of finance, the cost of finance, the cost ofinnovation, and high economic risks. The role of financeis confirmed by the WBES, which finds that 36% of thecompanies consider access to finance a major or severeobstacle (Enterprise Analysis Unit – World Bank Group2009). Additionally, out of the 40 CIS companies, only 4have reported to receive support from the localgovernment, and 3 received support from other Europeanbodies.
ECONOMIE ŞI SOCIOLOGIE / ECONOMY AND SOCIOLOGY 101
Nr. 3 / 2013
In terms of innovation activities, the majority (65-80%)of the CIS companies report investing time and resourcesinto trainings and the acquisition of equipment andinnovative software. A smaller fraction (less than 40%)focuses on internal R&D and all forms of design,acquisition of external knowledge and external R&D. Thespending as discussed above, confirms this pattern.
Business to business and academic research to businesscollaborative activities are at a relatively low level. At theenterprise level, companies collaborate with Moldovancompetitors, clients, universities and the local governmentor European suppliers according to the CIS data. TheINNOBarometer, covering a larger data sample,emphasizes the closer collaboration with customers andcompetitors in the CSI region. It also shows that up to 26%of the innovations have been developed and implementedby Moldovan enterprises in collaboration with other firms(AITT 2011). A proxy for collaborations with the academicresearch centers is the volume of joint publications. Closeto 10% of the surveyed companies for the INNOBarometerhave contributed to such publications.
The three surveys collect data on innovation, some ofthe indicators overlap and others complement each other.All three collect data on the level of innovation at thecorporate level. Similarly, the determining factors,inhibitors, as well as the revenues from innovation and thecosts of R&D are gathered by all three surveys. As has beenidentified in prior studies, the standardized questions maynot comprise the aspects of innovative activities peculiar todeveloping countries (Arundel, Innovation SurveyIndicators: Any Progress since 1996? 2006, Bogliacino2010, Marins 2008, Mairesse 2010). Hence, a consultant’sapproach was taken as well, providing firms with theopportunity to express any concerns that were notmentioned in the CIS or the INNOBarometer.
The consultant’s approach. A set of open-endedquestions was conducted with 10 of the companies that haveresponded to the CIS survey. The managers were allowed toexpress their opinions and beliefs about innovation in a freeform, not limited to the choices available in CIS. Based ontheir accounts, it can be determined that companies inMoldova are stuck at the 1st generation model described byRothwell, where technology acquisition plays the central rolein innovation (Rothwell 1994).
The firms interviewed vary by size, age and sector.Three of the firms are from the publishing sector, two offerspecialized retail services, one is from the financialindustry, one offers private medical services, one is fromthe entertainment industry and the last one from thebeverage sector. The oldest has been on the market for thelast 28 years and the youngest was established in 2010.Again, anonymity was provided to the firms and managersto increase the number of respondents and the detail in thequestions.
It is important to note that there is no disagreementamong the managers of these firms in terms of theperception of innovation, the innovation process and thebenefits it can bring. All have agreed that innovation wouldhelp their firms overcome recession. Most of them alsobelieve that innovation would improve internal efficienciesand increase the input and output volumes or the turnover.
The publishing companies, however, have limitedthemselves to a narrow definition of innovation, whichmainly involves technology and technologicalacquisitions more specifically. Given that purchasing thelatest publishing technology is expensive and in-housedevelopment is not an option, these have identifiedfinancing as the ultimate obstacle to becoming moreinnovative. An additional impediment that is notmentioned in the CIS questionnaire, but was emphasizedby the publishing companies is the conservative culturewithin the firm and the attitude of managers.Conservatism is a very subjective frame of mind, but inthis context could be interpreted as a predisposition toSoviet and post-Soviet institutions.
Having said that, the youngest of them, bearing few ofthe post-Soviet institutions within its culture, has set upan internal formal department that focuses solely oninnovations. This is the only one of the 10 companiesinterviewed that has such a structure. All three publishingcompanies have confirmed that their internal managementsystem promotes innovation, albeit informally. Theyimprove their knowledge of innovation trends byresearching the Internet and the journals in their area, aswell as organizing visits at foreign competitor sites.
The perception of the local and foreign competitionwas also discussed. All publishing companies havereported low levels of local competition. Similarly, all theother companies, except for the entertainment andmedical services have stated that competition is weak.This could be explained by the low demand for localservices and products. Moldovan consumers althoughlikely to be entertained at a local restaurant, but they, aswell as the restaurant, would prefer imported beverages.Competition, however, is critical in promoting innovativeactivities and has already been shown to have a positiveeffect in frontier economies (Ayyagari 2011). Thiscould be an indicative point for policy-makers.
The retailers specialized in medical equipment andchemical reagents, as well as the beverage producer findthe lack of qualified personnel, the lack of knowledge onthe subject of innovation, as well as the conservativeculture as the main obstacles to improvinginnovativeness. Even though the sources for innovationand the benefits the retailers find are similar to those ofthe publishing companies, the former have slightly moreadvanced techniques of promoting innovation. Themanagers delegate employees to participate at businessseminars, they brainstorm, analyze and implement anyresulting ideas. The beverage producer also uses local andforeign consultants. One retailer managed to implementtwo very simple programs that analyze competingproducts, allowing for radical improvements in their ownmarketing strategies.
Out of the 10 firms, only the financial service providertakes advantage of local centers for research anddevelopment to develop their own IT structure. Yet,the acquisition and adaptation of these systems isvery hierarchical. For the medical service providers,the equipment is critical, but improving the techniqueeven more so. Here, innovations are do not facebureaucratic pitfalls, but are rather sourced individually
Revistă teoretico-științifică / Theoretical and scientifical journal102
Nr. 3 / 2013
from medical journals and trainings. The entertainmentservice provider only acquires new technologies ifnecessary, but they do rely on non-technologicalinnovations as well. They offer monetary incentives foremployees that develop their innovative ideas.
In summary, the open-ended questionnaires allowed forthe identification of a number of issues that could have notbeen captured by the other surveys. First of all, theperception of innovation as limited to technology andtechnological acquisition. The focus on this innovativeactivity can help further identify what would need to bedone to leap-forward to Rothwell’s 5th generation model forinnovation processes (Rothwell 1994), or even structure theinnovation network to follow Floricel’s games ofinnovation (Floricel 2007). Second, inhibiting factors, suchas the conservative culture and its root causes can only bestudied within in-depth interviews and longitudinal studies.The CIS or INNOBarometer could help by collecting thestatistic on such factors, based on which policies couldaddress the issue of de-institutionalization. Lastly, open-ended questionnaires should be conducted on a recurringbasis to help policy-makers and surveyors adapt theirstrategies and evolve with the evolution of the industry.
Discussions. There are currently four sources of datathat can help build the innovation infrastructure in the
Republic of Moldova, identify the points, channelsand resources that could be strengthened, and theones that can be used as a competitive advantage.However, the study of the system must continue inorder to ensure goals are being reached and to revertany policies that are damaging the system. The goalof this study was to contrast the data sources andadapt the CIS in a way that would serve the statedpurpose.
The table below summarizes the findings gatheredfrom the large-scale surveys, the preliminary CIS data andthe open-ended questionnaires in terms of samplecharacteristics and the breakdown of innovators. It isalready evident that these projects are surveying similarinformation. However, this has been done within differenttime frames or for different sample features, thus makinga study of the national innovation system hard if notimpossible.
All the surveys collect data for all firm sizes.However, the regional breakdown slightly differs. TheWBES only differentiates between North and Southeastregion, whereas the INNOBarometer looks at the twolargest cities separate from the North, South and Centralregions. A large-scale implementation of the CIS wouldmost likely follow the INNOBArometer.
Table 2Sample characteristics and innovation levels within the WBES, INNOBarometer,
CIS and the open-ended questionnaires
WBES* INNOBarometer** Preliminary CIS Open-endedquestions
Sample size 363 1127 40 10Period 2007-2009
(2010-2012 upcoming)2008-2010 2009-2012 2012
Region N, SE Chisinau, Balti, N, S, C Chisinau and distributionby activity market
Chisinau
Age Varies Varies Varies VariesSize S, M, L S, M, L S, M, L S, M, LType ofownership
Public, private, mixed Public, private, mixed Public, private, mixed Public, private,mixed
Innovativecompaniesbybreakdownofinnovationtype
53% new products andservices64% significantlyimproved products andservices
28% new or improvedproducts for market30% new or improvedservices for market20% new product orservice for the market30% new or improvedproducts and servicesfor company23% new or improvedprocesses25% organizationalinnovations23% marketinginnovations
36% new or improvedproducts and services forthe market55% new or improvedprocesses for the market42% new or improvedproducts and services forthe firm64% new or improvedprocesses for the firm81% marketing innovations33% organizationalinnovations37% managementinnovations56% strategic innovations
Sursa/Source: * Enterprise Analysis Unit – World Bank Group 2009, ** AITT 2011.
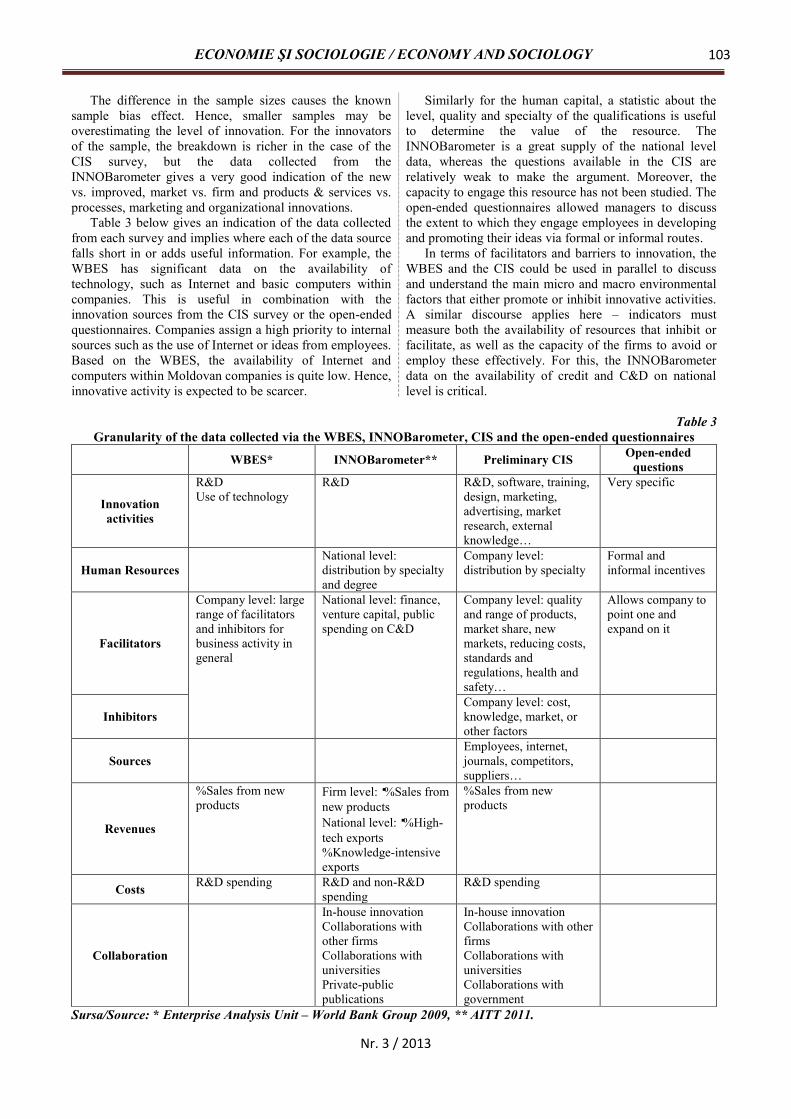
ECONOMIE ŞI SOCIOLOGIE / ECONOMY AND SOCIOLOGY 103
Nr. 3 / 2013
The difference in the sample sizes causes the knownsample bias effect. Hence, smaller samples may beoverestimating the level of innovation. For the innovatorsof the sample, the breakdown is richer in the case of theCIS survey, but the data collected from theINNOBarometer gives a very good indication of the newvs. improved, market vs. firm and products & services vs.processes, marketing and organizational innovations.
Table 3 below gives an indication of the data collectedfrom each survey and implies where each of the data sourcefalls short in or adds useful information. For example, theWBES has significant data on the availability oftechnology, such as Internet and basic computers withincompanies. This is useful in combination with theinnovation sources from the CIS survey or the open-endedquestionnaires. Companies assign a high priority to internalsources such as the use of Internet or ideas from employees.Based on the WBES, the availability of Internet andcomputers within Moldovan companies is quite low. Hence,innovative activity is expected to be scarcer.
Similarly for the human capital, a statistic about thelevel, quality and specialty of the qualifications is usefulto determine the value of the resource. TheINNOBarometer is a great supply of the national leveldata, whereas the questions available in the CIS arerelatively weak to make the argument. Moreover, thecapacity to engage this resource has not been studied. Theopen-ended questionnaires allowed managers to discussthe extent to which they engage employees in developingand promoting their ideas via formal or informal routes.
In terms of facilitators and barriers to innovation, theWBES and the CIS could be used in parallel to discussand understand the main micro and macro environmentalfactors that either promote or inhibit innovative activities.A similar discourse applies here – indicators mustmeasure both the availability of resources that inhibit orfacilitate, as well as the capacity of the firms to avoid oremploy these effectively. For this, the INNOBarometerdata on the availability of credit and C&D on nationallevel is critical.
Table 3Granularity of the data collected via the WBES, INNOBarometer, CIS and the open-ended questionnaires
WBES* INNOBarometer** Preliminary CIS Open-endedquestions
Innovationactivities
R&DUse of technology
R&D R&D, software, training,design, marketing,advertising, marketresearch, externalknowledge…
Very specific
Human ResourcesNational level:distribution by specialtyand degree
Company level:distribution by specialty
Formal andinformal incentives
Facilitators
Company level: largerange of facilitatorsand inhibitors forbusiness activity ingeneral
National level: finance,venture capital, publicspending on C&D
Company level: qualityand range of products,market share, newmarkets, reducing costs,standards andregulations, health andsafety…
Allows company topoint one andexpand on it
InhibitorsCompany level: cost,knowledge, market, orother factors
SourcesEmployees, internet,journals, competitors,suppliers…
Revenues
%Sales from newproducts
Firm level:%Sales fromnew productsNational level:%High-tech exports%Knowledge-intensiveexports
%Sales from newproducts
Costs R&D spending R&D and non-R&Dspending
R&D spending
Collaboration
In-house innovationCollaborations withother firmsCollaborations withuniversitiesPrivate-publicpublications
In-house innovationCollaborations with otherfirmsCollaborations withuniversitiesCollaborations withgovernment
Sursa/Source: * Enterprise Analysis Unit – World Bank Group 2009, ** AITT 2011.

Revistă teoretico-științifică / Theoretical and scientifical journal104
Nr. 3 / 2013
Only the INNOBarometer collects data around non-R&D spending. Even though it is a vague area, suchinformation may be useful for a country like Moldova,where most likely R&D spending will be directed toexternal technological acquisitions and less towards internalR&D. Lastly, in terms of collaborative activities, both theINNOBarometer and the CIS surveys collect a sufficientamount of data for analysis of industry and industry-publicsector interlinks.
To summarize, there are three key points that have beenraised in this paper. First, no one survey or data source willbe able to provide all the information necessary to analyze anational innovation system and to propose policies toimprove off the back of it. However, to make the use ofsurveys in analysis more effective, these should besynchronized with the large-scale enterprise surveys, suchas the one conducted by the World Bank. If the CIS, theINNOBarometer or any other combined survey were to beconducted, this should be set to follow the 3-year period ofthe WBES, i.e. 2010-2012 as the current. Second, adedicated innovation survey is necessary to build on theknowledge of innovation in the private sector. However,holding multiple survey efforts that target similar butslightly different data is ineffective as can lead to slow andsmall response rate. Consequently, one innovation surveywould be ideal.
Thirdly, the innovation survey must address two majorareas: the availability or level of resources at the nationaland company level, as well as the capacity to employ theseresources to achieve innovation-related goals. Cases inpoint serve the availability of Internet and the use ofInternet as a source of innovations, the quality and quantityof human capital and the employability of these resources.
Conclusions. The goal of this paper was to researchwhether the CIS survey alone could help the Republic ofMoldova identify the advantages and drawbacks of itsnational innovation system. As the analysis shows, the shortanswer is yes but to a certain extent.
Generally, the CIS provides a wealth of information thatis useful and can be employed in studies on corporateinnovation. A preliminary employment of the questionnaireactually shows the drawbacks and the factors promotinginnovation in the corporate world. It also illustrates themajor innovation activities, spending and earning based onnew or improved products and services.A thorough study of the Moldovan national innovationsystem, however, would need to start with the resourcesavailable at the national level and continue with those at thecorporate level. Furthermore, it would continue withanalyzing individual firm’s capacities to employ resourceseffectively, and ultimately the ability to learn and improveon those capacities. The INNOBarometer and the WBEScan complement the CIS with data on resources.
Moreover, CIS is limited to a set of predefinedanswers that may not always include features, concernsor perceptions of the Moldovan corporate sector.Consequently, taking a consultant’s approachon a recurring basis would help adapt and improve anational innovation questionnaire, as well as understandwhether the leading firms have moved away andleaped forward from Rothwell’s 1st generation innovationmodel.
Thus, it may not be essential to conduct the CISsurvey in Moldova from scratch. However, some of itsquestions should be adapted to the INNOBarometer toallow for the construction of the national innovationsystem, without taking away from the level ofcomparability with other European states. This will bemore effective in terms of the financing of such projects,as well as the burden on companies themselves,considering the limited availability of funds for the publicas well as the private sector. To this extent, synchronizingit with the large-scale WBES would allow theircomplementary study, similar to the experience ofCanada, Italy and China (Mairesse 2010).
This paper only tapped the surface of policymaking. As discussed, a dedicated innovation survey mustcover both the level of resources and the capacitiesavailable to use those resources. This would allow policy-makers to address resource and capacity issuesdifferently. To illustrate this point, a lack of publicresearch would require an increased and more targetedspending on R&D. However, if firms lack the capacity touse public knowledge, then only small benefits will beripped. The latter would require building formal andpromoting informal channels between the industry anduniversities or public research centers. Similar argumentshold for any of the facilitating factors measured by theCIS survey.
Consequently, to achieve the construction of thenational innovation system in Moldova and guide policymakers towards the most effective solutions forpromoting innovation, an enhanced INNOBarometersurvey with some questions from CIS should be used inparallel with the WBES for the same time frame. Futurestudies can analyze the results using regressions andstatistics, but most importantly would determine the levelof resource availability and of capacities to use theseresources. Based on such results, policies can be directedtowards specific issues, but addressing both theavailability and the capacity to use resources. Ultimately,open-ended questionnaires with a selected number offirms would help put the results in perspective, as thesewould capture issues that have not been addressed by thesurvey, in terms of the general perception of innovationand innovative concepts.
Referinţe bibliografice / References1. AITT. INNObarometru 2010 pentru Republica Moldova. 2011 [accesat 10 june 2013].
Disponibil:http://inno.aitt.md/innobarometru-2010-pentru-republica-moldova-02. ANTONCIC, B., PRODAN, I., HISRICH, R.D., SCARLAT, C. Technological Innovativeness and Firm
Performance in Slovenia and Romania. In: Post-Communist Economies. 2007, vol. 19, no. 3, pp. 281-298.3. ARUNDEL, A.H. Innovation Survey Indicators: Any Progress since 1996? In: Blue Sky II. What indicators for
Science, Technology and Innovation Policies in the 21st Century, 25-27 september 2006: conference. OECD.

ECONOMIE ŞI SOCIOLOGIE / ECONOMY AND SOCIOLOGY 105
Nr. 3 / 2013
Ottawa, Canada, 2006 [accesat 9 june 2013]. Disponibil: http://www.oecd.org/science/inno/37450288.pdf4. ARUNDEL, A.H., HOLLANDERS, H. Searching the Forest for the Trees: ”Missing” Indicators of Innovation:
Trend Chart Methodology Report. Innovation Policy in Europe. 2006, july [accesat 9 june 2013]. Disponibil:http://arno.unimaas.nl/show.cgi?fid=15486
5. AYYAGARI, M., DEMIRGUC-KUND, A., MAKSIMOVIC, V. Firm Innovation in Emerging Markets: The Roleof Finance, Governance and Competition. In: Journal of Financial and Quantitative Analysis. 2011, vol. 46, no. 6,decembrie, pp.1545-1580.
6. Biroul Naţional de Statistică al Republicii Moldova. 2012 [accesat 9 june 2013]. Disponibil:http://statbank.statistica.md/pxweb/dialog/Saveshow.asp
7. BOGLIACINO, F., PERANI, G., PIANTA, M., SUPINO, S. Innovation and Development. The Evidence fromInnovation Surveys. In: Working Paper. BETA. 2010, nr. 13, april, pp. 1-32.
8. CHANG, Ha-J. Kicking Away the Ladder: Development Strategy in Historical Perspective. London: Anthem Press,2003.
9. CHRISTENSEN, J.F. Corporate Strategy and the Management of Innovation and Technology. In: Industrial andCorporate Change. 2002, vol. 11, no. 2, pp. 263-288.
10. DOUGHERTY, D., FLORICEL, S. Where do Games of Innovation Come from? Explaining the Persistence ofDynamic Innovation Patterns. In: International Journal of Innovation Management. 2007, vol. 11, no. 1, pp. 65-91.
11. Enterprise Analysis Unit. World Bank Group. 2009 [accesat 14 june 2013]. Disponibil:https://www.enterprisesurveys.org
12. FLORICEL, S., MILLER, R. Games of Innovation: A New Theoretical Perspective. In: International Journal ofInnovation Management. 2007, vol. 11, no. 1, pp. 1-35.
13. GORODNICHENKO, Y., SVEJNAR, J., TERRELL, K. Globalization and Innovation in Emerging Markets. In:Working Paper. IPC. 2008, no. 76, january, pp.1-43.
14. HÎRBU, E. Aspecte privind Performanţa Inovaţională a Republicii Moldova. In: Akademos. 2012, no. 4 (27), pp.36-42.
15. INSEAD. 2012 [accesat 20 iunie 2013]. Disponibil: www.cnpf.md16. The Global Innovation Index 2013. The Local Dynamics of Innovation [accesat 26 mai 2013]. Disponibil:
http://www.globalinnovationindex.org17. MAIRESSE, J., MOHNEN, P. Using Innovation Surveys for Econometric Analysis. In: Handbooks of the
Economics of innovation. 2010, vol. II, pp. 1129-1155.18. MARINS, L.M. The Challenge of Measuring Innovation in Emerging Economies Firms: A Proposal of a New Set of
Indicators on Innovation. UNU-MERIT. In: Working Paper Series. 2008, nr. 044, pp. 1-28.19. ROTHWELL, R. Towards the Fifth-Generation Innovation Process. In: Innovational Marketing Review. 1994, vol.
11, no. 1, pp. 7-31.20. SUTZ, J. Measuring Innovation in Developing Countries: some suggestions to achieve more accurate and useful
indicators In: International Journal of Technological Learning, Innovation and Development 2012, vol. 5, no. 1/2,pp. 40-57.
Recomandat spre publicare: 23.06.2013
Revistă teoretico-științifică / Theoretical and scientifical journal106
Nr. 3 / 2013
DEZVOLTAREA CULTURII PROCESULUIDECIZIONAL
DEVELOPMENT OF THE DECISION-MAKINGCULTURE
Galina GLOBA, dr.,Institutul Internaţional de Management
Galina GLOBA, PhD,The International Institute of Management
În articol sunt analizate etapele dezvoltării teoriei şipracticii procesului decizional. Acentul este pus pe culturacontemporană a luării deciziilor. Ca bază a tendinţelorcontemporane serveşte tranziţia de la intuiţie şi experienţăla analitica în luarea deciziilor. Analitica contemporanăînseamnă dezvoltarea culturii de a lucra cu volume mari aledatelor.
Cuvinte cheie: cultură orientată spre date, business analitica.
The article shows the stages of development of thetheory and practice of decision-making. Emphasis isplaced on the contemporary culture of decision-making. Atthe base of the current trends is the transition fromintuition and experience in decision-making to analytics.Modern business intelligence means the development of theculture of work with big data.
Key words: data-oriented culture, business analytics.JEL Classification: M12, M14, M19
Introducere. Unul din cele mai eficiente instrumenteinteligente ale managerului este teoria luării deciziilor.Teoria luării deciziilor este o ştiinţă, care se dezvoltă foarterapid. Ea se ocupă cu problemele, care sunt generate depractica deciziilor manageriale la diferite niveluri.Obiectivele prezentei lucrări sunt: monitoringul dezvoltăriimetodologiei de luare a deciziilor, identificarea etapelor dedezvoltare a ştiinţei şi formularea caracteristicilor abordăriimoderne a luării deciziilor în ceea ce priveşte aspecteleteoretice şi practice. De asemenea, vom analiza câtevaaspecte discutate activ la etapa actuală de dezvoltare ateoriei şi practicii luării deciziilor. Acestea, în primul rând,sunt problemele dezvoltării ale business intelligence cametodă modernă de luare a deciziilor. Pentru a determinarolul de business intelligence, autorul face referinţă laoriginile ei teoretice şi analizează principalele abordări saumodele ale luării deciziilor. Această analiză va oferiposibilitatea să fie determinat dacă există o relaţie întreabordările clasice şi moderne, şi care sunt bazele teoreticeale analiticii moderne.
Tipurile modelelor de luare a deciziilorTeoria luării deciziilor vorbeşte despre modelele, care
caracterizează abordările în luarea deciziilor. Evidenţiazăurmătoarele principale tipuri de modele ale luării deciziilor:normative, descriptive, modelul Carnegie, modelulincremental de luare a deciziilor, modelul "coş de gunoi" [9,p. 42-43]. Alegerea modelului depinde de mulţi factorii: dacădecizia este programată sau neprogramată, de gradul de risc şiincertitudine sau, finalmente, de preferinţele decidenţilor.
Modelul clasic este considerat modelul normativ, propusde Herbert Simon. Acest model permite de a găsi cele maieficiente modalităţi de a atinge scopul. Modelul clasic oferăun ghid pentru atingerea rezultatelor ideale şi sensul lui debază constă în următoarele: managerii trebuie să încerce de agăsi deciziile raţionale, logice, care vor corespundeintereselor economice ale organizaţiilor lor. În modelulnormativ există o serie de ipoteze: obiectivele suntcunoscute şi coordonate, iar problemele sunt identificate şidefinite cu precizie; informaţia necesară pentru luareadeciziilor este completă şi fiabilă; analiza tuturor opţiunilorşi consecinţelor posibile; criteriile de evaluare alealternativelor sunt cunoscute; alegerea variantei optime dinpunct de vedere economic.
Modelul descriptiv de luare a deciziilor reprezintăcontinuarea studiilor lui Herbert Simon, care a dovedit
Introduction. One of the most effective intelligenttools of a manager is the theory of decision making. Thetheory of decision-making is a fast growing science. Itdeals with the issues which are generated by the practice ofmanagement decisions at the different levels. The goals ofthis paper are: monitoring of the development of thedecision-making methodology, identification of stages ofthe development of the science of decision-making andformulation of the features of the modern approach todecision-making both in the theoretical and practical terms.We will also analyze several issues which is being activelydiscussing at the present stage of development of thedecision-making theory and practice. It is, first of all – theproblem of business intelligence as a modern method ofdecision-making. To determine the role of businessintelligence author refers to its theoretical origins andanalyzes the main approaches or models of decision-making. This analysis will determine whether there is arelationship of classical and modern approaches to decisionmaking, and what are the theoretical foundations ofmodern analysis.
Types of Decision-Making ModelsIt is generally said that in decision making theory exist
models which characterize the approaches to decisionmaking. There are the following main types of decision-making models: normative, descriptive, the Carnegiemodel, the model of incremental decision-making process,the model of "recycle bin" [9, p. 42-43]. The selection of amodel depends on whether the programmed ornonprogrammed is the decision, the degree of risk anduncertainty, or, finally, on the preferences of decisionmakers.
As the classic model is considered the normative modelproposed by Herbert Simon. This model allows to find themost effective ways to achieve the set goal. The classicalmodel provides a guideline for ideal results, and its basicmeaning is that managers should try to find a rational,logical decisions that will meet the economic interests oftheir organizations. There are a number of assumptions inthe normative model of decision-making: the goals areknown and agreed upon, and the problems are identifiedand are precisely defined; the information necessary fordecision-making is complete and correct; analysis of all thepossible options and consequences; the criteria forevaluating alternatives are known; the selection of the
ECONOMIE ŞI SOCIOLOGIE / ECONOMY AND SOCIOLOGY 107
Nr. 3 / 2013
existenţa raţionalităţii delimitate, ce înseamnă că activitateaindivizilor în organizaţie se află în limitele sau în marginileraţionalităţii admise. Acest model are caracter empiric şireflectă procesul decizional real în situaţii complexe.Modelul descriptiv de luare a deciziilor se bazează peintuiţia managerilor. În luarea deciziilor intuitivă, într-omăsură mai mare decât logica, este folosită experienţapersonală şi clarviziunea persoanei decidente. Ipotezelemodelului descriptiv de luare a deciziilor: scopurile soluţieisunt adesea nedeterminate şi contradictorii; nu sunt aplicateîntotdeauna proceduri raţionale, dar utilizarea lor estelimitată la o imagine simplificată a problemei care nureflectă realitatea; limitele de căutare a diferitor opţiunidepind de constrângerile legate de resurse; din cauzainformaţiilor insuficiente şi criteriilor neclare alemaximizării, sunt luate soluţiile acceptabile nemaximizate.
Modelul politic, dezvoltat de H. Simon, J. March şiR. Kayert, este utilizat pentru luarea deciziilor neprogramateîn condiţiile coaliţiilor, care se formează pentru luareadeciziilor dificile când există insuficienţa şi lipsa defiabilitate a informaţiei şi dezacordurile cu privire la scopuri.Ipotezele modelului politic de luare a deciziilor: organizaţiaconstă din grupuri cu diferite interese, obiective şi valori;informaţia este ambiguă şi incompletă; managerii nu dispunde resurse şi de inteligenţă pentru a determina toatecaracteristicile problemei şi pentru a procesa toatăinformaţia relevantă; pentru a obţine informaţiile necesare şia reduce incertitudinea, este necesar un schimb de opinii;pentru definirea obiectivelor şi luarea deciziilor, suntnecesare negocieri între participanţii coaliţiei.
Abordarea modernă a procesului decizional serveşte cadezvoltare a principalelor dispoziţii de cele trei modele sus-numite. Această abordare este caracterizată de aplicareamodelării de simulare bazate pe sisteme informaţionale, carerăspund la întrebarea "Ce se întâmplă dacă...?" şi pe metodestatistice, de exemplu, metode de anchetă prin sondaj. Înluarea deciziilor sunt folosite modele probabilistico-statistice, precum şi metode de analiză a datelor. Încercetarea aplicată sunt folosite combinaţiile diferitormetode. Pentru elaborarea soluţiilor sunt utilizate "Sălile desituaţie". Această noţiune include metodologia, tehnologia şiinfrastructura. Este presupusă instruirea personalului îndomeniul activităţii informaţional-analitice. O atenţiedeosebită este acordată formalizării şi sintezei cunoştinţelorinterdisciplinare ale specialiştilor în spaţiul virtual unic. Însala situaţiilor este creat modelul sistemic al domeniuluivizat privind impactul factorilor interni şi externi. Obiectivulprincipal al sălii de situaţie este pregătirea deciziilor demanagement pentru top-manageri, realizată prin aplicareametodelor şi instrumentelor "om-maşină" ale descrierii şimodelarei sistemelor complexe care folosesc noulinstrument cibernetic ca bază s sistemului tehnic intelectual.
Cu toate acestea, observăm că etapa actuală dedezvoltare a economiei a schimbat atitudinea faţă de rolulintuiţiei în luarea deciziilor competente şi binefundamentate. Modelul descriptiv identifică intuiţia ca unfactor prioritar, bazat pe cauzele insuficienţei sauincertitudinii informaţiei. Abordarea modernă recunoaşte, căsocietatea a intrat într-o etapă postindustrială de dezvoltare,a cărei caracteristică este dezvoltarea societăţiiinformaţionale, în care informaţiile şi cunoştinţele au
variant which is optimal from the economic point of view.The descriptive model of decision-making is the
continuation of the studies of Herbert Simon, who provedthe existence of bounded rationality, which means that theactivity of individuals in an organization lies within theboundaries or limits of the permissible rationality. Thismodel is empirical and reflects the actual process ofdecision-making in the complex situations. The descriptivemodel of decision-making is based on the intuition ofmanagers. Under the intuitive decision-making to a greaterextent than logic are used personal experience and insightof decision maker. Assumptions descriptive model ofdecision-making are as follows: purposes of solutions areoften uncertain and conflicting; rational procedures are notalways applied and their use is limited to a simplified viewof the problem, which does not reflect a reality; boundariesof the search of various options depend on resourceconstraints; because of the limited information and unclearcriteria of maximization are taken acceptable and notmaximizing solutions.
The political model developed by H. Simon, J. Marchand R. Kayert is used for non-programmed decision-making in terms of coalitions that are formed underdifficult decision making when there is a lack anduncertainty of information and disagreement about thegoals. The assumptions of the political decision-makingmodel: the organization consists of groups with differentinterests, goals and values; information is ambiguous andincomplete; managers have the lack of resources andintelligence to determine all the characteristics of theproblem and process all relevant information. To obtain thenecessary information and the reduction of uncertaintyrequires an exchange of opinions; the definition ofobjectives and decision-making are required negotiationsbetween the participants of the coalition.
The modern approach to decision-making develops ofthe main guidelines of all three above mentioned models. Itis characterized by the use of simulation modeling basedon computer systems that respond to the question "Whatif...?", and statistical methods, for example, methods ofsample surveys. In decision making are used asprobabilistic and statistical models, and methods for thedata analysis. In applied research is used a combination ofdifferent methods. In order to prepare solutions is used "theSituational Room". This notion includes methodology,technology, and infrastructure. Is provided training topersonnel on methods of information-analytical work. Theparticular attention is paid to the formalization and thesynthesis of interdisciplinary knowledge of specialists in asingle virtual space. In the Situation Room is created thesystemic model of the object domain with regard to theimpact of internal and external factors. The main objectiveof situational room is the preparation of decisions for CEO,made on the application of human-computer methods andtools for describing and modeling of complex systemsusing the new cybernetics apparatus as the core of theintellectual technical system.
It must be noted that the current stage of developmentof the economy has changed the attitude to the role ofintuition in correct and informed decision making. Thedescriptive model identifies intuition as an overriding
Revistă teoretico-științifică / Theoretical and scientifical journal108
Nr. 3 / 2013
devenit forţa motrice a dezvoltării businessului. “Lideriicompaniei recunosc acum, că operaţiunile companiei suntatât de complexe, încât nu mai pot fi gestionate fărăanalitică. Dvs. aţi ajuns la etapele când intuiţia Dvs. nu maieste suficientă. Trebuie să faceţi analiză detaliată. Sunt preamulte lucruri, prea multe oportunităţi ce pot existaneidentificate dacă Dvs. nu se cercetaţi detaliile” [3, p. 7].
În societatea actuală, calitatea vieţii depinde decapacitatea de a produce, a căuta, a analiza, a clasifica, arezuma, a recunoaşte, a procesa, a furniza informaţiile şi alua decizii. Etapa actuală de dezvoltare a societăţi secaracterizează prin faptul, că volume enorme de informaţii s-au acumulat în formă de bazelor de date. Volumul global aldatelor în 2009 a fost 800 de Exabytes şi, având în vederetendinţele actuale, în 2020 va fi 35 de mii Exabytes. Acesteinformaţii sunt stocate pasiv şi nu sunt prelucrate [6, p. 72].
Remarcăm, de asemenea, că în prezent au crescutconsiderabil capacităţile tehnicii de calcul, mijloacelor decomunicare şi transmisie a datelor; Internetul a devenit undepozit unic al datelor şi cunoştinţelor al omenirii; a formatnevoia de specialişti care pot lucra cu informaţii, cucompetenţe pentru realizarea noilor oportunităţi ale lucruluicu datele şi mijloacele de prelucrare ale datelor. A evidenţiatnevoia în specialişti capabili de a efectua procesareainformativ-analitică a volumelor mari de date. Businessul numai poate exista fără suport analitic, prognozare,managementul riscului, adică, fără business intelligence.Astăzi, business intelligence a devenit o parte esenţială aoricărui sistem computerizat. Cu toate acestea, în cazul cândo decizie este luată în baza datelor pentru o perioadă scurtăde timp, ea este mai puţin calitativă. Este necesară analizadatelor pentru o perioadă mai mare, care să fie executată întimpul necesar.
Noţiunea "Business Intelligence"Pentru prima dată noţiunea "business intelligence" (BI) a
fost propusă de către cercetătorul american Hans Peter Luhn,care în 1958 a publicat articolul „Un sistem de BusinessIntelligence» în revista "IBM System". Luhn a reprezentatbusinessul ca o serie de diferite activităţi în ştiinţă,tehnologie, comerţ, industrie, precum şi sistemele de suportale businessului ca sisteme care susţin activitatea mentalăsau sistemele inteligente. Prin utilizarea cuvântul"inteligenţă", Luhn a subliniat capacitatea de a stabili relaţiadintre reprezentările unor fapte şi acţiuni în interesulsoluţionării problemelor şi atingerii obiectivelor. Acestaspect al activităţii lui Luhn a fost dat uitării. În 1989,renumitul analist Howard Dresner din firma de consultanţaGartner a revenit la lucrarea lui Luhn. El a dat o interpretarelargă a BI, propunând utilizarea BI ca un termen genericpentru o varietate de tehnologii, destinate susţineriiprocesului decizional [7].
După douăzeci de ani de la publicarea ideii lui Dresner,aceasta a devenit general acceptată. BI este încă văzută ca unset de tehnologii slab cuplate. Pintre acestea suntinstrumentele clasice – tabele de calcul, elaborarearapoartelor, tehnologiile OLAP (Online AnalyticalProcessing), instrumente cu panouri digitale pentrugestionarea business-proceselor, tehnologiile de procesare adatelor şi textelor, şi multe altele.
La sfârşitul anilor ’80, analiştii companiei Gartner audeterminat business intelligence ca un proces axat pe
factor for reasons of lack or uncertainty of information.The modern approach recognizes that society has entered apost-industrial stage of development as a feature of whichis the development of the information society whereinformation and knowledge have become the driving forcebehind the progress of business. "Company leaders nowrecognize that the company's operations are so complexthey can no longer be managed without analytics. Youreach stages where your intuition is no longer enough. Youhave to go into detailed analysis. There are too manythings, too many opportunities that can exist undetectedunless you dive into the details" [3, p. 7].
In today's society, the quality of life depends on theability to produce, search, analyze, classify, summarize,recognize, process, present information, and makedecisions. The current stage of development of a society ischaracterized by the fact that in databases have beenaccumulated the huge amounts of information. The worldvolume of data in 2009 was 800 Exabytes, and given thecurrent trends in 2020 will be 35000 Exabytes. Thisinformation is passively stored and not processed [6, p. 2].
We also note that today have considerably grown thecapacities of computers, communications and datatransmission; Internet has become the single repository ofdata and knowledge; has formed the need in specialists whocan work with information and have competencies realizingnew opportunities of the work with data and data processors.There is also a necessity in specialists who are able toperform information-analytical processing of the large datavolumes. Business can no longer exist without analyticalsupport, forecasting, risk management, that is, withoutbusiness intelligence. Today, business intelligence isbecoming a core part of any computer system. However, if adecision is made on the basis of data in the short time, it isless qualified decision. It is necessary the data analysis of thelong period, and it must be executed in the required time.
The Notion "Business Intelligence"The notion "business intelligence (BI)" has been
introduced by the American researcher Hans Peter Luhn,who in 1958 published the article "A Business IntelligenceSystem" in the journal "IBM System". Luhn representedbusiness as a set of different activities in science,technology, commerce, industry, etc. and business supportsystems as systems that sustain the mental activity orintelligent systems. The word "intelligence" Luhn markedthe ability to determine the relationship betweenrepresentations of facts and actions in the interests ofproblem solving and achieving goals. This aspect of Luhn'swork was forgotten. In 1989 the well-known analystHoward Dresner of the Gartner consulting firm returned toLuhn's work. He gave a wide interpretation of BI,proposing to use BI as a generic term for a variety of for avariety of technologies designed to support decision-making [7].
Twenty years after the publication of Dresner hisopinion has become generally accepted. BI is still seen as aset of lightly connected technologies. Among them is stillthe classic tools – spreadsheets, report generators, OLAPtechnologies, tools with digital boards for business processmanagement, technologies for data and text processing,and much more.

ECONOMIE ŞI SOCIOLOGIE / ECONOMY AND SOCIOLOGY 109
Nr. 3 / 2013
utilizator, care include accesul şi cercetarea informaţiilor,analiza lor, dezvoltarea intuiţiei şi înţelegerii, care conduc laprocesul decizional îmbunătăţit şi informale. În 1996 aapărut precizarea, că instrumente de analiză a datelor, deelaborare a interogărilor pot ajuta utilizatorii business sădepăşească volumele mari de date, să le sintetizeze îninformaţii semnificative. Astăzi, toate aceste instrumente seîncadrează în categoria numită business intelligence [7].
Definiţia clasică a BI-sistemelor [7] – sistemele BusinessIntelligence reprezintă un proces, tehnologii, metode şiinstrumente pentru extragerea, reprezentarea şi analizainformaţiilor, dezvoltarea intuiţiei şi perceperea procesuluidecizional îmbunătăţit şi informal al non-businessutilizatorilor, precum şi instrumente pentru extragereainformaţiilor relevante şi semnificative pentru business. BIeste un set de tehnologii şi de software, destinat pentruatingerea obiectivelor businessului prin cea mai bunăutilizare a datelor disponibile.
Definiţia pentru business intelligence a lui V. Artemyev,dată în anul 2003 în revista "Открытые системы", este, fărăîndoială, una dintre cele mai rezonabile. Artemyev încercatsă listeze în definiţie toate aspectele majore ale inteligenţei.De fapt, acesta a vizat elaborarea definiţiei pentru businessintelligence în sensul larg. În definiţie au fost enumerate treiaspecte ale business intelligence, adică a fost definită ca [5]:
• procesul de transformare a datelor în informaţie şicunoştinţe despre business pentru sprijinire a procesuluidecizional îmbunătăţit şi informal;
• tehnologiile informaţionale (metode şi instrumente)pentru colectarea datelor, consolidarea informaţiei şiasigurarea accesului business-utilizatorilor la cunoaştere;
• cunoştinţe despre business, obţinute în rezultatulanalizei profunde a datelor detaliate şi informaţiilorconsolidate.
Principalul avantaj al abordării lui V. Artemyev estecaracterul sistematic. Cu toate acestea, noi nu considerăm căeste justă afirmaţia, că business-cunoştinţele sunt parte abusiness-analiticii.
În 2010, în revista "Открытые системы" a fost publicatarticolul lui L. Chernyak, în care definiţia pentru BI estebazată pe experienţa sistemelor de business intelligence înprocesul decizional. L. Cherniak indică cinci etape aleprocesului decizional: identificarea şi detalierea problemei,formularea problemei şi identificarea datelor necesare pentrusoluţiile ei, analiza datelor, inclusiv analiza exploratoare(Exploratory Data Analysis, EDA), analiză care să permităconstruirea ipotezelor (Structured Data Analysis, SDA) şi sădefinească fluxurile de date, precum şi alte tipuri de analize;business intelligence fiind drept interpretarea datelor,pregătirea rapoartelor, elaborarea modelelor şirecomandărilor, previziunilor şi predicţiilor; luarea deciziilor[10]. L. Chernyak subliniază, că BI are loc între diferitemetode de analiză a datelor şi de luare a deciziilor, caresugerează că esenţa BI constă în procesul de transformare adatelor în informaţii ce pot fi utilizate pentru luareadeciziilor. Este definită şi principală sarcina a BI, careconstă în agregarea, integrarea şi interpretarea datelor dinsurse diferite, în scopul de a le transforma într-o informaţieconfortabilă pentru luarea deciziilor.
În studiul comun al MIT Sloan de Management Reviewşi IBM Institute for Business am găsit următoarea noţiunea
In the late 1980s, the consulting company Gartneranalysts have identified business intelligence as the user-centered process which includes access and research ofinformation, its analysis, the elaboration of intuition andinsight that lead to the improved and informal decision-making. In 1996, there was the clarification – tools for dataanalysis, elaboration of reports and queries can helpbusiness users to overcome the sea of data to synthesizethem into the meaningful information. Today all of thesetools fall into the category called Business Intelligence [7].
The classic definition of BI-systems (BI), accordingto [7], is as follows. Business intelligence is a process,technologies, methods and tools for extracting, presentingand analysis of information, development of intuition andinsights for the improved and informal decision-makingand by business users as well as tools for extracting therelevant and meaningful information. BI – a set oftechnologies, software, and practices aimed at theachievement of business goals through the best use of theavailable data.
Definition of Business Intelligence, given by V. Artemyevin the journal "Открытые системы" in 2003 is undoubtedlyone of the most literate. V. Artemyev has tried to point in it allmajor aspects of intelligence. In fact it has meant theelaboration of a wide definition of business intelligence. In thedefinition have been listed three aspects of businessintelligence, i.e. it has been defined as [5]:
• the process of transforming data into the informationand knowledge on business to support the improved andinformal decision-making;
• information technologies (methods and tools) of datacollection, information consolidation, and providing accessof business users to knowledge;
• knowledge on business, obtained as a result of in-depth analysis of detailed data and consolidatedinformation.
The main advantage of the V. Artemyev approach iscomprehensiveness and systematics. However, we do notconsider as correct the statement that business knowledgeis a part of business analytics.
In 2010 the journal "Открытые системы" publishedChernyak's article, in which the definition of BI is giventaking into account the development of businessintelligence systems. Author analyzing the stages ofdecision-making focuses on the role of businessintelligence in decision making. Chernyak indicates fivestages of decision-making: detecting and detailingproblem; formulation of the problem and identification ofthe data required for its solutions; of the recommendations,forecasts and predictions; decision-making (ExploratoryData Analysis, EDA), analysis allowing to build ahypothesis (Structured Data Analysis, SDA); defines thedata flows, as well as other types of analysis; businessintelligence as the interpretation of data, preparation ofreports, modeling, and elaboration of recommendations,forecasts and predictions; decision-making [10]. Chernyakemphasizes that BI takes place between the differentmethods of data analysis and decision-making, whichsuggests that the essence of BI is the transformation of datainto information that can be used for decision making. Theauthor also has defined the main task of BI which consists

Revistă teoretico-științifică / Theoretical and scientifical journal110
Nr. 3 / 2013
pentru analitică. Analitica: utilizarea datelor şi cunoştinţelorprin aplicarea disciplinelor legate de analiză (de exemplu,modele statistice, cantitative, predictive, cognitive şi altele)pentru a conduce planificarea bazată pe fapte, decizii,execuţie, management, măsurare şi învăţare. Analitica poatefi descriptivă, predictivă sau prescriptivă [1, p. 3].
Considerăm, că baza actuală a acestui concept trebuie săfie fundamentată pe ideile lui N. B. Pakhlin şiV. I. Oreshkov, descrise în [8]. În procesul analizei datelor,cercetătorul produce un set de acţiuni în scopul de a formaideile cu privire la natura fenomenului, descrise de acestedate. De obicei, pentru analiza datelor sunt utilizatemetodele matematice. Cu toate acestea, analiza datelor nupoate fi considerată doar ca procesarea informaţiilor dupăcolectarea acestea, analiza datelor este, în primul rând, uninstrument de verificare a ipotezelor şi soluţionare aproblemelor cercetătorului. Business intelligence este strânslegată de modelare [8].
Mai mult decât atât, considerăm că trebuie să sevorbească despre business intelligence în sens larg şi în sensrestrâns. Prin urmare, susţinem punctul de vedere alanaliticilor din cadrul firmei de consultanţă Forrester Research[1, p. 19]. Definiţia largă descrie BI drept întregul proces de ladate până la cunoştinţe, care include pregătirea datelor (dataintegration, data quality, master data management, datawarehousing). Definiţia succintă – BI reprezintă ultimii paşi înprocesul decizional, care constă mai mult în utilizarea datelor(reporting, ad hoc querying, dashboards); analitică advansată(predictivă), BI de tip operaţional, process, context, analiticatextului, analitica in-memory.
Trebuie remarcat, că în opinia lui Forrester Research,chiar şi aceste două opţiuni nu acoperă toate cele maiimportante momente ale business intelligence. Mai multdecât atât, definiţia pentru business intelligence încă nu esteformată, Forrester Research continuă să lucreze la ea. Deasemenea, menţionăm, că Forrester Research este ocompanie implicată în cercetarea pieţei de IT-tehnologii.Însă, obiectivul nostru este formularea unei definiţii pentrunespecialişti sau pentru utilizatorii business intelligence.Prin urmare, aspectele largi şi înguste, în opinia noastră,valorifică destul de bine obiectivul stabilit şi reflectă oabordare sistematică. Deşi, desigur, definiţia pentru businessintelligence va continua să evolueze continuu.
Etapele dezvoltării Business IntelligenceDezvoltarea business inteligenţei moderne înregistrează
peste de douăzeci de ani. Business Intelligence a marcat treietape: Silos, Centralizare, Agilitate [2, p. 3].
Forrester Research confirmă, că numai dezvoltareaactivă (Agile development) nu este suficientă pentru BI şirecomandă aplicarea celor mai eficiente practici şi tehnologii deultimă generaţie pentru a face BI mai flexibilă. Agile businessintelligence este definită de către Forrester Research ca oabordare, care combină [2, p. 5] procese, metodologii, structuraorganizatorică, instrumente şi tehnologii, care permit cadecidenţii strategici, tactici şi operaţionali să fie mai flexibili şimai receptivi la ritmul rapid al schimbărilor cerinţelor debusiness şi de reglementare.
De ce agilitatea este atât de importantă pentruaplicaţiile BI? Există multe momente: estimările iniţiale suntinexacte; cerinţele BI se schimbă mai repede decâttehnologiile informaţionale le ţin pasul; abordările System
in the aggregation, integration and interpretation of datafrom heterogeneous sources in order to transform them intoa comfortable decision-making information.
In the joint MIT Sloan Management Review and IBMInstitute for Business Value study we found the followingnotion of analytics. Analytics: The use of data and relatedinsights developed through applied analytics disciplines(for example, statistical, contextual, quantitative,predictive, cognitive and other models) to drive fact-basedplanning, decisions, execution, management, measurementand learning. Analytics may be descriptive, predictive orprescriptive [1, p. 3].
We believe that the current basis of this concept shouldbe based on the ideas of N.B. Pakhlin and V.I. Oreshkovdescribed in [8]. In the data analysis the researcherproduces a set of actions in order to form ideas about thenature of the phenomenon described by this data. Usuallyfor data analysis are used mathematical methods. However,the analysis cannot be considered only as informationprocessing after information gathering, analysis isprimarily a tool to verify assumptions and to solveresearcher problems. Business Intelligence is closelyrelated to modeling [8].
Moreover, we believe that we should speak aboutbusiness intelligence in the broad and narrow sense.Therefore we support the view of the analysts of theconsulting firm Forrester Research [1, p. 19]. The narrowdefinition describes BI as the entire data-to-insight process,which includes data preparation (data integration, dataquality, master data management, data warehousing). Widedefinition – BI represents last steps in the decision-makingprocess, which is mostly data usage (reporting, ad hocquerying, dashboards); advanced (predictive) analytics,operational BI, process, context, text analytics, in-memoryanalytics.
It should be noted that, in the opinion of ForresterResearch, even these two options did not cover all thehighlights of business intelligence. Moreover, thedefinition of business intelligence has not yet formed,Forrester Research continues to work on it. We also notethat Forrester Research is a company engaged in theresearch market of IT-technologies. But our goal is to givethe narrow definition or definition for users of businessintelligence. Therefore, the proposed broad and narrowaspects, in our opinion, quite realize the set goal and reflectthe systematic approach. Though of course, the definitionof business intelligence will continue to evolve as she is.
Stages of the BI DevelopmentThe development of modern business intelligence has
more than twenty years. Business intelligence has passedthree stages: Silos, Centralization, Agility [2, p. 3].
Forrester Research states that Agile development byitself is not enough for BI and recommends adoptingmultiple best practices and next-generation technologies tomake BI more flexible. Agile business intelligence isdefined by Forrester Research as an approach thatcombines [2, p. 5] "processes, methodologies,organizational structure, tools, and technologies that enablestrategic, tactical, and operational decision-makers to bemore flexible and more responsive to the fast pace ofchanges to business and regulatory requirements".

ECONOMIE ŞI SOCIOLOGIE / ECONOMY AND SOCIOLOGY 111
Nr. 3 / 2013
Development Life Cycle (SDLC) nu sunt potrivite pentruBI; eforturile de implementare nu iau în considerarecerinţele, care sunt în continuă schimbare; baza utilizatorilorcreşte permanent; amploarea, profunzimea, complexitatea încreştere.
Soluţia este văzută în aplicarea metodologiei ForresterRerearch pentru pregătirea, planificarea, elaborarea,implementarea BI şi raţionalizarea strategiei BI. Aceastămetodologie presupune patru etape: descoperirea,planificarea, acţiunea, optimizarea [1, p. 40].
Sistemul BI trebuie să ofere oportunităţi cheie, care suntnecesare pentru funcţionarea eficientă. Cercetările efectuatede analiştii Gartner au confirmat, că platforma BI necesităcincisprezece capacităţi de trei categorii: integrarea, livrareainformaţiei şi analiza. Integrarea include infrastructura BI,managementul metadatelor, instrumentele de dezvoltare,colaborarea. Livrarea informaţiei include reporting,dashboards, ad hoc query, analiza este bazată pe procesareaanalitică online – (OLAP). Această capacitate poate acoperio varietate de arhitecturi de date şi arhitecturi de stocare,vizualizare interactivă, modelare predictivă şi datamining, scorecards, modelare prescriptivă, simularea şioptimizarea [4].
Platformele analitice acoperă patru niveluri dematuritate: analitică descriptivă, de diagnostic, predictivă şiprescriptivă. Marea majoritate a aplicaţiilor, până în prezent,ar putea fi numite "descriptive", deoarece capacităţile critice,cum ar fi rapoartele şi dashbord-urile, sunt folosite pentrudescrierea dimensiunilor şi măsurilor ale un anumit aspect albusinessului. Organizaţiile elaborează analize de diagnostic,care au vizualizare interactivă şi permit utilizatorilordetalierea mai facilă a datelor pentru a descoperi noileperspective. Când organizaţiile se maturizează până laanaliza de diagnostic, acestea pot identifica variabileleexplicative. Soluţiile pot fi evoluate ulterior în analiticaprescriptivă ca intuiţii din modelele predictive integrate înprocesele de afaceri pentru a efectua corijări şi a lua deciziioptime.
Îmbunătăţirea calităţii deciziilor de afaceri este principalavaloare a implementării BI. Schimbările care aşteaptă ocompanie sunt informarea mai bună a luării deciziilor deafaceri şi îmbunătăţirea calităţii şi consistenţei datelor.
Cultura orientată spre informaţieStudiul comun al MIT Sloan de Management Review şi
IBM Institute for Business Value a formulat o concluzieextrem de importantă – piaţa digitală actuală dezvoltăcultura bazată pe date. O organizaţie poate fi capabilă de acolecta, integra şi analiza datele sale, dar ea nu va fipregătită să utilizeze rezultatele analizei acestor date dacă nuare o cultură bazată pe idei ce au punct iniţial intuiţia sauexperienţa.
Folosind analitica ca un nucleu strategic pentruoperaţiunile de afaceril, organizaţiile cu o cultură aanalizelor de date ce încorporează perspective bazate pe dateîn fiecare proces – de la scenarii de gestionare a risculuipână la algoritmi de procesare a intrărilor prin noile canaledigitale. Aceste organizaţii permit angajaţilor să acţioneze cuîncredere şi decisiv într-o piaţă în dezvoltare rapidă [3,p. 11- 12].
Pentru a realiza sofisticarea în analitica organizaţiilortrebuie să existe cultura bazată pe date. Cultura orientată
Why Agility is so important for the effective BIapplications? There are several moments: initial estimatesare always low, BI requirements change faster than IT cankeep up with, conventional System Development LifeCycle (SDLC) approaches are poorly suited for BI,deployment efforts don’t often take into account growingand ever-changing requirements; growing user database;growing breadth, depth, volume, and complexity.
The solution is seen in the application of the ForresterResearch's methodology on preparation, planning,building, starting-up BI to rationalize BI strategy. Thismethodology involves four steps: Discover, Plan, Act,Optimize [1, p. 40].
The developed BI system must deliver keyopportunities which are necessary for its effectivefunctioning. The research made by Gartner analysts hasconfirmed the necessity of fifteen capabilities of BIplatform across three categories: integration, informationdelivery and analysis. Integration includes BI infrastructure,metadata management, development tools, collaboration.Information delivery means are as follows (reporting,dashboards, ad hoc query; analysis is based on the onlineanalytical processing (OLAP). This capability could span avariety of data architectures and storage architectures,interactive visualization, predictive modeling and datamining, scorecards, prescriptive modeling, simulation andoptimization [4].
The analytical platforms are covering four levels ofmaturity: descriptive, diagnostic, predictive and prescriptiveanalytics. The vast majority of applications built with BI andanalytics platforms to date could be named "descriptive"because reports and dashboards are used to describe thedimensions and measures of a particular aspect of thebusiness. Organizations build diagnostic analytics that haveinteractive visualization and enable users to drill more easilyinto the data. As organizations mature at diagnostic analysis,they can identify the explanatory variables that predict afuture period. Solutions can be further evolved toprescriptive analytics as the insights from predictive modelsare integrated into business processes to take corrective oroptimal actions.
The improvement of business solution quality is the mainvalue of the BI-implementation The major changes expectedin a company are to make better informed business decisionsand to improve data quality and consistency.
Information-oriented cultureThe joint MIT Sloan Management Review and IBM
Institute for Business Value study has made an extremelyimportant conclusion – today's digital marketplace isdeveloping a data oriented culture. An organization may beable to collect, integrate and analyze its data, but it will notlikely be able to use properly the results of data analysisunless it has a culture that is based on the ideas that departfrom intuition or experience.
In using analytics as a strategic asset core to theirbusiness operation, organizations which have the culture ofdata analysis embed data-based insights into every process– from scenarios that manage risk, to algorithms thatprocess coming in through new digital channels. They alsoempower employees to act confidently and decisively in afast-paced marketplace [3, p. 11-12].
Revistă teoretico-științifică / Theoretical and scientifical journal112
Nr. 3 / 2013
spre date este un model de comportamente şi practici aleunui grup de oameni, care împărtăşesc o credinţă, ca averea,înţelegerea şi utilizarea unor tipuri de date şi informaţii cejoacă un rol critic în succesul organizaţiei [3, p. 11].
În cultura orientată la date, comportamentele, practicileşi credinţele sunt în concordanţă cu principiul conformcăruia deciziile de afaceri de la orice nivel se bazează peanaliza datelor. Liderii în cadrul organizaţiilor sunt înaşteptare ca deciziile să fie vină în baza analiticii şi săexplice necesitatea BI în perspectivă de termen lung. Eleexprimă convingerea în valoarea deciziilor mai rapide şi maiprecise datorită utilizării BI pentru a ghida în operaţiunilezilnice. Angajaţii sunt încrezători că dispun de informaţiipentru a lua decizii bazate pe date.
Conform studiul MIT Sloan Management Review andIBM Institute for Business Value, organizaţiile, careimplementează cu abilitate BI, demonstrează următoareletrei abilităţi: conducere axată pe fapte – fact-drivenleadership, deschis la idei noi, care contestă practicilecurente, indivizii au nevoie de date pentru decizii; strategieşi ghid de operaţiuni conform perspectivelor, ghid destrategii viitoare cu analitică, de operaţiuni zilnice cuanalitică; analitica este folosită ca un activ strategic,utilizarea analiticii ca parte esenţială a strategiei şi aoperaţiunilor de afaceri, utilizarea crescândă a analiticii înanul trecut.
Noi recunoaştem importanţa abordării de mai sus, cutoate acestea ar trebui, de asemenea, să subliniem că oimagine întreagă a unei culturi orientate spre date nu a fostîntocmită. Următorul pas constă în a discuta cerinţelestabilite de economia conectată (networked economy).
Concluzii. Etapa actuală de dezvoltare a teoriei şi practiciiprocesului decizional a schimbat atitudinea faţă de rolulintuiţiei în luarea deciziilor competente şi bine fundamentate.Cultura orientată spre date nu este bazată pe intuiţie sauexperienţă. În această cultură, comportamentele, practicile şicredinţele respectă principiul conform căruia deciziile deafaceri de la orice nivel trebuie să fie bazate pe analizadatelor.
To achieve analytics sophistication organizationsmaster the data-oriented culture. "Data oriented culture is apattern of behaviors and practices by a group of peoplewho share a belief that having, understanding and usingcertain kinds of data and information play a critical role inthe success of their organization" [3, p. 11].
In a data-oriented culture behaviors, practices andbeliefs are consistent with the principle that businessdecisions at every level are based on analysis of data.Leaders within organizations set an expectation thatdecisions must be arrived at analytically, and explain howanalytics is needed to achieve a long-term vision. Theyexpress their conviction in the value of faster and moreprecise decisions by using analytics to guide to day-to-dayoperations. Employees are confident they have theinformation to make data-based decisions.
According to the joint MIT Sloan Management Reviewand IBM Institute for Business Value survey organizationswhich skillfully apply BI demonstrate three basiccapabilities: fact-driven leadership – open to new ideas thatchallenge current practices, individuals have data need fordecisions; strategy and operation guided by insights –guide future strategies with analytics, guide day-to-dayoperations with analytics; analytics is used as a strategicasset – use analytics as core part of business strategy andoperations, increased use of analytics in the past year.
We acknowledge the significance of the aboveapproach, however we should also point out that a wholepicture of a data oriented culture hasn't been drawn. Thenext step is to discuss the requirements introduced by aconnected (networked) economy.
Conclusions. Current stage of development of thetheory and practice of decision making process has changedthe attitude towards the role of intuition in making relevantand substantiated decisions. Data-oriented culture is notbased on intuition or experience. In this culture behaviors,practices and beliefs respect the following principle –business decisions at all levels must be based on dataanalysis.
Referinţe bibliografice / References1. ЭВЕЛЬСОН, Борис. “Next Generation BI” - Эффективный инструмент достижения успеха в бизнесе [accesat 27 iulie 2013].
Disponibil: [http://www.cnews.ru/reviews/ppt/2012_10_19/9_Evelson.pdf2. EVELSON, Boris. Trends 2011 And Beyond: Business Intelligence. 2011, 31 march [accesat 27 iulie 2013]. Disponibil:
http://www.forrester.com/Trends+2011+ And+Beyond+Business+Intelligence/fulltext/-/E-RES58854?objectid=RES588543. KIRON, D., SHOCKLEY, R. et al. Analytics: The widening divide. How companies are achieving competitive advantage through
analytics: research report. 2011 [accesat 27 iulie 2013]. Disponibil: http://www-304.ibm.com/businesscenter/cpe/download0/30288/IBM_analytics_the_wideningdivide_original.pdf
4. SCHLEGEL, K., SALLAM, R.L. et al. Magic Quadrant for Business Intelligence and Analytics Platforms. 2013, 5 february. 64 p.[accesat 27 iulie 2013]. Disponibil: http://www-304.ibm.com/businesscenter/cpe/download0/230288/IBM_analytics_the_ wideningdivide_original.pdf
5. АРТЕМЬЕВ, В. Что такое Business Intelligence? В: Открытые системы. 2003, № 4 [accesat 27 iulie 2013]. Disponibil:http://www.osp.ru/os/2003/04/182900/
6. НЕКРАСОВА, Е. Переступить черту. В: CIO/ Современное предприятие. 2011, № 1-2 [accesat 27 iulie 2013]. Disponibil:http:/www.fors.ru/pls/portal/ docs/PAGE/FDC/FILES/SMI/CIO_Tambovskiy_2 2011.pdf
7. Определение Business Intelligence. 2012, 23 марта [accesat 27 iulie 2013]. Disponibil: http://www.tadviser.ru/ index.php/B5_Business_Intelligence
8. ПАКЛИН, Н.Б., ОРЕШКОВ, В.И. Бизнес-аналитика: от данных к знаниям: учебное пособие. Санкт-Петербург: Питер, 2013.704 с. ISBN 978 5-459 007176.
9. ТРОФИМОВА, Л.А., ТРОФИМОВ, В.В. Управленческие решения. Санкт-Петербург: Изд-во СПбГУ ИТМО, 2011. 192 с.ISBN 978-5-7310-2742-7.
10. ЧЕРНЯК, Л. Бизнес-аналитика как сервис. В: Открытые системы. 2010, № 4 [accesat 27 iulie 2013]. Disponibil:http://www.osp.ru/os/2010/04/13002275
Recomandat spre publicare: 26.08.2013

ECONOMIE ŞI SOCIOLOGIE / ECONOMY AND SOCIOLOGY 113
Nr. 3 / 2013
ETAPELE DE FORMARE A PIEŢEI DEASIGURĂRI DIN REPUBLICA MOLDOVA
ŞI DEZVOLTAREA MODERNĂ A ACESTEIA
STAGES OF FORMATION OF INSURANCEBUSINESS IN THE REPUBLIC OF MOLDOVA
AND ITS MODERN DEVELOPMENT
Igor DOLGHI, drd., lector magistru,Universitatea de Stat din Moldova
Igor DOLGHI, PhD, lecturer, MAState University of Moldova
Crearea unei industrii moderne de asigurări permitestatului: de a reduce pierderile din bugetul de stat,influenţate de diferiţi factori; de a soluţiona uneleprobleme sociale în condiţiile economiei de piaţă şi de aatrage sursele populaţiei şi organizaţiilor din diferitedomenii în cifra de afaceri a economiei naţionale petermen lung.
The creation of modern insurance industry will allowthe state: to reduce the burden on the state budget asconcerns the compensation of unexpected losses, causedby factors of different nature; to solve some problems ofSocial Security in the conditions of the market economy;and to attract the savings of the population andorganizations in the turnover of the national economy on along-term basis.
Cuvinte cheie: asigurare, asigurător, prime deasigurare, etape de formare a pieţei de asigurări, serviciide asigurare, despăgubiri de asigurare, participanţiprofesionişti pe piaţa de asigurări, autoritate desupraveghere, sistem de reglementare a pieţei deasigurări.
Key words: insurance, insurer, insurance premiums,training phase of the insurance market, insurance services,insurance compensation, professional participants in theinsurance market, supervisory authority, system ofregulation of the insurance market.
JEL Classification: G22, G29, I13
Introducere. Dezvoltarea pe larg a economiei de piaţăîn Republica Moldova a schimbat semnificativ situaţia îndomeniul asigurărilor. Dezvoltarea pieţei naţionale deasigurări are loc în condiţii nestabile ale situaţieieconomice şi politice din ţară, sistem fiscal insuficientflexibil şi legislaţia încă în curs de perfecţionare în ramurade asigurări.
În perioada ultimilor ani piaţa de asigurări dinRepublica Moldova a suferit o serie de modificări,căpătând aspect de piaţă concurenţială.
Introduction. The extensive development of marketrelations in the Republic of Moldova has significantlychanged the situation in the insurance field. Thedevelopment of the insurance market in our country occursin an unstable economic and political condition,insufficiently flexible tax system, and a still imperfectlegislation in the field of insurance.
Over recent years, the insurance market of theRepublic of Moldova has undergone a number of changes,getting an aspect of the competitive market..
Conţinutul de bază. Scopul articolului. Analizaetapelor principale de dezvoltare a pieţei de asigurări dinRepublica Moldova şi evaluarea rezultatelor la etapacontemporană de dezvoltare.
Analiza etapelor de formare a pieţei naţionale.Începând cu anii ’20 ai secolului trecut şi până la fineleanilor ’80, în legătură cu schimbarea situaţiei social-politice,sistemul de asigurări era monopolizat, iar organul desupraveghere a asigurărilor a fost anulat. În perioadadată asigurările se efectuau de către organele de stat,direcţiile prioritare de activitate a cărora era asigurareapopulaţiei, deoarece în condiţiile de exzistenţă a proprietăţiipublice asupra mijloacelor de producţie, asigurareaacestora nu se considera necesară în sistemul de asigurări destat.
În URSS asigurările aveau un caracter formal. Înmentalitatea cetăţenilor sovietici asigurările nu figurau ca ocomponentă obligatorie de organizare a vieţii.
Direcţia Generală a asigurărilor de stat în URSS a fostGosstah. Până în anul 1958 sistema Gosstrah a fost strictcentralizată la nivelul URSS. Din anul 1958 o parte dinsistemul Gosstrah a fost transmis sub jurisdicţia ministeruluide finanţe a Republicilor Unionale. Din anu 1967 pînă înanul 1991 sistemul Gosstrah a fost deja organizat la nivelrepublican şi se supunea Consiliului Gosstrah URSS, care larândul sau se supunea Ministerului de Finanţe al URSS.
Activitatea de asigurări în conponenţa Ministerului deFinanţe era supusă în interesul bugetului de stat, predominau
The basic content. The purpose of the article.Analysis of the main stages of the development of theinsurance business in the Republic of Moldova and theassessment of the results achieved at the present stage ofdevelopment.
The analysis of development phase of insurancebusiness in the country. Since the 20’s of last century tothe late 80’s, due to changes in the socio-political system,the insurance industry has been monopolized and theinsurance supervision department was abolished. Duringthis period, the public insurance agencies engaged ininsurance, the main orientation of which was insurance ofthe population, as in the conditions of existence of publicownership of the means of production, insurance ofcompanies’ property with a public insurance company wasconsidered inappropriate.
In the USSR the insurance was largely formal. In theminds of the Soviet people the insurance did not figure asan essential component of life organization.
The main directorate of public insurance of the USSRwas the Public Insurance System. Up till 1958, the publicinsurance system was highly centralized in the scale of theUSSR. Since 1958, a part of the Public Insurance Systemwas transferred to the Ministry of Finance of the USSR.From 1967 to 1991 the Public Insurance System wasalready a Union-Republican one, and was headed by theUSSR Public Insurance Board, which was subordinated tothe Ministry of Finance of the USSR. The activity of the

Revistă teoretico-științifică / Theoretical and scientifical journal114
Nr. 3 / 2013
interesele dîn domeniul fiscal în detrimentul dezvoltăriiactivităţii de asigurări. Statul îşi permitea să acoperedeficitul bugetar prin retragerea grătuită a unor sumeenorme din rezervele de asigurare. Asigurările au fosttransformate într-o ramură auxziliară a sistemului financiarde stat.
După destrămarea URSS, în anul 1991, GuvernulRepublicii Moldova a adoptat Hotărârea „Cu privire lamăsurile urgente de demonopolizare a economiei naţionale”.La 28 mai a aceluiaşi an, Guvernul a implimentat măsuri cuprivire la perfecţionarea şi reglementarea activităţii deasigurări, fapt ce a marcat începutul reorganizării ConsiliuluiGosstrah al Republicii Moldova şi crearea societăţilor deasigurări pe principii de concurenţă [7].
Prin Hotărârea Guvernului Republicii Moldova nr.296din 12 iunie 1991 a fost creat Serviciul de Stat pentrusupravegherea asigurărilor pe lângă Ministerul Finanţelor alRepublicii Moldova. La 11 iulie 1991 a fost înregistratăprima companie comercială de asigurări „ASITO”.
Începând cu anul 1991, la prima etapă de formare aasigurărilor comerciale, în ţară au început să apară şi să sedezvolte primele organizaţii comerciale de asigurări. Însă, înţară lipsea cadrul de reglementare a activităţii de asigurări.
Etapa dată de formare a pieţei se caracterizează prinlipsa aproape completă de surse proprii a organizaţiilor deasigurări şi capital social insuficient. Specificul acestei etapeîn general a fost determinat de situaţia economică a epociide „acumulare primitivă a capitalului”. Numărulorganizaţiilor de asigurări, care practic acordau clienţilor săiacoperire de asigurare clasică, era extrem de insuficient, iargama serviciilor acordate de acestea era limitată.
Primele de asigurare în anul 1992 au constituit 993,9 miilei, iar despăgubirile de asigurare au fost de 482,4 mii lei sau48,5% din suma primelor subscrise.
În 1993, volumul primelor de asigurare au crescut bruscşi sau majorat în comparaţie cu 1992 cu 6,9 mln. lei.
Etapa a doua de formare a pieţei de asigurări dinRepublica Moldova poate ficonsiderată perioada începândcu 1993. Parlamentul Republicii Moldova la 15 iunie 1993 aadoptat legea nr. 1508-XII „cu privire la asigurări”. Intrareaîn vigoare a legii date a schimbat situaţia pe piaţa deasigurări dim Moldova. Au fost exact stabiliţi parametrii debază în activitatea de asigurări şi cerinţele cu privire lastabilitatea financiară în asigurări.
Dacă ne referim la creşterea cantitativă a numărului deasigurători, atunci se poate de menţionat, că perioada până laanul 1995 s-a marcat prin creşterea rapidă a număruluiorganizaţiilor de asigurări. În perioada din anul 1991 până înanul 1995 numărul asigurătorilor înregistraţi a atins cifra de90, iar în anul 1996 au fost înregistrate încă 12 organizaţii deasigurări. În perioada dată, multe organizaţii de asigurări n-au rezistat concurenţei şi au fost închise, astfel încât la 31decembrie 1996 în republica Moldova funcţionau 55 deorganizaţii de asigurări.
În anul 1996 toate organizaţiile de asigurări au majoratcuantumul primelor de asigurare subscrise şi au constituit 97milioane de lei. Pe tipurile de asigurări benevole – 73,1milioane de lei sau 75,3% din suma totală a primelor deasigurare, inclusiv: asigurarea facultativă de persone – 40,6milioane de lei (41,8%); asigurarea facultativă de bunuri –20,4 milioane de lei (21,1%); altele asigurări benevole – 12
insurance system within the Ministry of Finance wassubordinated to the interests of the state budget, thereprevailed fiscal origins to the detriment of the insurancebusiness development. The Government allowedgratuitous and compulsory confiscations from theinsurance funds of large amounts to cover the budgetdeficit. Insurance has turned into an auxiliary field offinance.
After the collapse of the Soviet Union in 1991, theGovernment of the Republic of Moldova adopted theDecree “On urgent measures providing for the de-monopolization of the national economy”. On May 28 ofthat year, the Government considered the issue ofmeasures to improve and regulate the insurance activity,which marked the beginning of the reorganization of theBoard of State Insurance of the Republic of Moldova andthe creation of insurance companies on a competitivebasis [7].
By the Decree no. 296 of the Government of theRepublic of Moldova of June 12, 1991 the State InsuranceSupervision Service under the Ministry of Finance of theRepublic of Moldova was established. On July 11, 1991there was registered the Insurance company “ASITO” - thefirst commercial-type insurance organization.
Starting with 1991, at the first phase of establishing anew commercial insurance, there began to emerge andevolve in the country independent private profit insuranceorganizations. However, the lacked in the country anylegal basis to regulate the insurance activity.
This stage of market development is characterized bythe almost complete lack of insurers, sufficient statutorycapital and other equity. The specifics of the first stage ofthe insurance formation generally was determined by theeconomic environment of “primitive accumulation ofcapital” era. The number of insurance companies, which infact provided its customers with a classic insurancecoverage, was extremely low, and the list of servicesprovided by them was limited.
Insurance premiums for 1992 amounted to 993.9million MDL, and insurance payments amounted to 482.4million MDL, or 48.5% of the amount of premiumscollected.
In 1993, the volume of insurance premiums rosesharply, and increased in comparison with 1992 by 6.9million MDL.
The second stage of development of the insurancemarket in the Republic of Moldova can be called theperiod since 1993. The Parliament of the Republic ofMoldova adopted on 15 June 1993, the Law no. 1508-XII“On insurance”. The entry into force of this law changedthe situation on the insurance market of Moldova. Therewere accurately identified the main parameters of theinsurance activity and requirements to the reliability ofinsurers.
If we talk about the quantitative increase in the numberof existing insurers, the period up to 1995 was marked bythe rapid growth in the number of insurance companies.During the period from 1991 to 1995, the number ofregistered insurers reached 90, in 1996 there wereregistered 12 more insurance companies. During thisperiod, many insurance companies were closed not being

ECONOMIE ŞI SOCIOLOGIE / ECONOMY AND SOCIOLOGY 115
Nr. 3 / 2013
milioane de lei (12,4%). Pe asigurările obligatorii au fostsubscrise 23,9 milioane de lei sau 24,7% din suma totală aprimelor subscrise. Liderii pieţii pe primele de asiguraresubscrise în anul 1996 au fost organizaţiile de asigurări:„Asito”, „Asito-Trafic”, „Moldova-Astrovaz”, „Afes-M”,„Orateh”, „Seabeco-Asint”. Cota primelor de asiguraresubscrise de companiile mari în suma totală a primelor deasigurare a constituit 83,7% [4].
Referindu-ne la tendinţa de formare a pieţei de asigurări,etapa a doua de dezvoltare a acesteia se caracterizează princontinuarea de creştere extensivă în direcţii puţinasemănătoare cu asigurările clasice. Mai mult au fostpracticate asigurările facultative de persoane şi asigurărilefacultative de bunuri.
Începutul etapei contemporane de formare a pieţei deasigurări din Republica Moldova poate fi consideratăperioada din anii 1996-1997.
La 10 iunie 1997, Guvernul Republicii Moldova aadoptat Hotărârea nr. 533 „Cu privire la unele măsuri dereglementare a activităţii de asigurare” [3]. Provocareaschimbărilor în dezvoltarea asigurărilor a fost influenţată decondiţiile externe din asigurări. Piaţa de asigurări s-a redusconsiderabil, iar concurenţa a crescut semnificativ.Organizaţiile de asigurări au început să-şi dezvolte afacereaîn alte direcţii. Concurenţa între asigurători s-a transferat pesegmentul asigurărilor de riscuri a persoanelor juridice şifizice, mai multă atenţie a început să se atragă la asigurărilede bunuri. Aceasta a fost facilitată de punerea în aplicare aHotărârii Guvernului Republicii Moldova nr. 484 „cu privirela limitele cheltuielilor de asigurare ale agenţilor economicişi persoanelor fizice, care practică activitatea deîntreprinzător, permise ca deduceri de cheltuieli aferenteactivităţii de întreprinzător pentru scopuri fiscale” din 04mai 1998, care a exclus din baza de impozitare cheltuielileîntreprinderii cu privire la toate asigurările obligatorii şiasigurările facultative de bunuri, mărfuri şi răspundere;asigurarea angajaţilor contra accidente.
Formarea sistemului naţional de asigurări necesităelaborarea şi implimentarea unor măsuri de îmbunătăţire acalităţii serviciilor de asigurări, ce presupune utilizareapotenţialului intern al Republicii Moldova şi oportunităţileinvestiţionale proprii.
Pentru realizarea scopului dat, este necesară organizareaunui sistem naţional de asigurări eficient şi accelerareadezvoltării unor asigurări sociale. Sfera de asigurări acoperătoate aspectele vieţii umane, activitatea de producere şisocial-economică, îndeplinind funcţiile de compensare şicumulare.
În condiţiile economiei de trecere, o importanţădeosebită în industria de asigurări revine mai multor factori.
În primul rând, asigurarea prezintă securitatesuplimentară multiplelor interese ale persoanelor juridice şifizice, indiferent de caracterul şi volumul măsurilorîntreprinse de stat. În perioada actuală, povara cheltuielilorde lichidare a calamităţilor naturale şi dezastrelor provocatede om, rămân pe seama bugetului de stat, posibilităţilecăruia, din motive obiective, sunt limitate.
În al doilea rând, utilizarea mecanizmului de asigurare încondiţiile date asigură dezvoltarea rapidă a afacerii,îmbunătăţăşte tehnologiile de producţie utilizate, ţinând contde specificul ramurilor principale ale economiei din
able to meet the competition, so as of December 31, 1996there functioned in the Republic 55 insurance companies.
In 1996, the premiums of all insurance companiesincreased, amounting to 97 million MDL. For voluntaryinsurance - 73.1 million MDL, or 75.3% of totalpremiums, including: voluntary private insurance - 40.6million MDL (41.8%); voluntary property insurance – 20.4million MDL (21.1%), other types of voluntary insuranceof 12 million MDL (12.4%). Mandatory insurancecollected 23.9 million MDL, or 24.7% of total premiums.Leaders in terms of insurance contributions in 1996 werethe insurance organizations „Asito”, „Asito-Trafic”,„Moldova-Astrovaz”, „Afes-M”, „Orateh”, „Seabeco-Asint”. The share of insurance premiums of the largestcompanies of the republic in total contributions amountedto 83.7% [4].
As for trends of development of the insurance market,the second stage of its formation was characterized by acontinuation of the extensive growth in the areas, that havelittle in common with the classic insurance. The mostwidespread of them was voluntary private insurance andvoluntary property insurance.
The beginning of the current stage of the Moldovaninsurance market formation can be considered the periodfrom 1996 to 1997.
The Government of the Republic of Moldova adopted on10 June 1997 the Decree no. 533 “On some measures for thesettlement of the insurance activity” [3]. The main reason forthe onset of change in the development of insurance was thechange in external conditions of its existence. The insurancemarket has shrunk considerably, and the competitionembittered. The Insurance companies begun to look for waysof business development in new directions. The maincompetition among insurers moved to markets of legalentities and individuals’ risk insurance, more attention waspaid to property insurance. This was facilitated by theGovernment of the Republic of Moldova Decree no. 484 ofMay 4, 1998 “On expenses on insurance of economic agentsand physical persons which are engaged in the businessactivity, permitted for the deduction from entrepreneurialincomes, for the purpose of the taxation”, which brought outof taxation the expenses of enterprises for all types ofcompulsory insurance and voluntary insurance of its property,cargo and liability, personnel insurance against accidents.
Creating a national insurance system required thedevelopment and gradual implementation of measures, aimedat improving the quality of insurance services, which involvesthe active use of the internal potential of the country and itsown investment opportunities.
To achieve this goal requires the proper organization ofthe national insurance system and accelerated development ofcertain socially important types of insurance. Insurancebusiness covers all aspects of human life, production andsocio-economic activities, performing compensation andcumulative - savings function.
In transition economies, the particular importance of theinsurance industry is determined by several factors.
First, the insurance provides additional protection to thedifferent interests of legal entities and individuals, regardlessof the nature and scope of the measures taken by theGovernment. In this period, the main burden of the costs to

Revistă teoretico-științifică / Theoretical and scientifical journal116
Nr. 3 / 2013
Republica Moldova, climatul acesteia şi localizareageografică.
Sistemul de asigurări contribuie la dezvoltarea sigură şidurabilă a economiei ţării, reprezentând o bază suplimentarăpentru sporirea securităţii populaţiei, asigurarea bunurilorcetăţenilor şi entităţilor economice. În acelaşi timp,dezvoltarea asigurărilor, într-o mare măsură, depinde deperfecţionarea cadrului legal, eficienţa politicilorfiscale şi monetare a statului, calitatea supravegheriiactivităţii de asigurări şi stabilitatea funcţionării societăţilorde asigurări.
Dezvoltarea modernă a pieţei de asigurări dinRepublica Moldova. La 13 septembrie 2004 prin HotărâreaGuvernului nr. 1012 „cu privire la aprobarea Concepţiei şiobiectivelor dezvoltării şi consolidării pieţei asigurărilor înRepublica Moldova pe termen mediu”, a fost aprobat Planulde acţiuni pentru realizarea Concepţiei şi obiectivelordezvoltării şi consolidării pieţei asigurărilor în RepublicaMoldova pe termen mediu (2004-2007). Principalul scop alConcepţiei este formarea unei pieţe naţionale a asigurărilorstabile, valoroase şi funcţionale, capabilă să devină uninstrument real în protejarea intereselor cetăţenilor, agenţiloreconomici şi statului [5].
În rezultatul realizării eficiente a Concepţiei date, piaţade asigurări din Republica Moldova, statul şi inclusivconsumatorii serviciilor de asigurări, au bineficiat de cadrullegal la nivel european în domeniul de asigurări, deoarece, lamomentul aprobării acesteia, baza legislativă nu reglementatotalmente activitatea de asigurări. În acelaşi timp,Inspectoratul de Stat pentru supravegherea asigurărilor şifondurilor nestatale de pensii nu aveau suficientă autoritate.Din aceste considerente, una din cele mai importante sarcinia fost stabilită la formarea unui organ de stat independent,împuternicit de funcţii şi drepturi similare Băncii Naţionaledin Republica Moldova şi Comisiei Naţionale de valorimobiliare. Astfel, având în vedere, intenţia RepubliciiMoldova de integrare economică prin adoptarea şi punereaîn aplicare a normelor economice şi comerciale, ce opereazăîn spaţiul economic european, în scopul implementării pepiaţa financiară a unui cadru de reglementare prudentă şisistem de supraveghere echivalent cu cel din UniuneaEuropeană, la 26 decembrie 2006 a fost semnată de cătreParlamentul Republicii Moldova legea „cu privire laasigurări” nr. 407-XVI, care a fost publicată în MonitorulOficial al RM la 06 aprilie 2007.
Legea primită asigură conformitatea maximă a cerinţelorlegislaţiei din Republica Moldova cu standardele europene,axate pe dezvoltarea unei pieţe eficiente, stabile şi prudente,precum şi orientarea acesteia spre cooperarea în viitor cuautorităţile de supraveghere din alte state. Prin legea dată, deasemenea, a fost stabilită autoritatea de supraveghere de statşi anume Comisia Naţională a pieţei financiare dinRepublica Moldova. O dată cu acestea, principaleleobiective ale reglementării activităţii de asigurăridin ţară, sunt de a spori eficienţa activităţii de supraveghereîn scopul protejării intereselor asiguraţilor, menţinerea unuimediu concurenţial favorabil pe piaţa de asigurări şidezvoltarea infrastructurii acesteia în conformitate cupractica internaţională de organizare a activităţii deasigurări.
Aprobarea noii legi „cu privire la asigurări” a asigurat
liquidate the consequences of natural disasters and man-madedisasters laid on the state budget, the possibility of which, forobvious reasons, was limited.
Second, the use of insurance mechanisms in theseconditions was ensured by a rapid development ofentrepreneurial activity, further improvement of the usedproduction technologies taking into account the features ofthe main sectors of the Moldovan economy, its climate andgeographical location.
Considering that the insurance system contributes toreliable and sustainable development of the country economy,representing an additional basis for improving the level ofprotection of population, property insurance of citizens andeconomic agents. At the same time, the development ofinsurance largely depends on the perfection of the legislativeframework, the effectiveness of fiscal and monetary policy ofthe state, the quality of supervision of the insurance activityand reliable operation of insurance companies.
The modern development of the insurance business inthe Republic of Moldova. By Decree no. 1012 of September13, 2004 the Government adopted the Concept and theobjectives of the development and strengthening of theinsurance market in the Republic of Moldova for a mediumterm (2004-2007) and approved an action plan to implementthe Concept and the objectives of the development andstrengthening of the insurance market in the Republic ofMoldova for a medium term. The main objective of theConcept was the formation of a full, stable functioning of thenational insurance market, able to become a real tool forprotecting the interests of the state, citizens and economicagents [5].
As a result of the implementation of the planned measuresproposed by the Concept, the insurance market of Moldova,the government and the consumers of insurance servicesdirectly obtained a legal basis of insurance at European level,as the current insurance legislation at the time did not fullyregulate the activities in this area. At the same time, the StateInspectorate for Supervision of Insurance and private pensionfunds had no sufficient authority. Therefore, as one of themost important tasks was the creation of a new autonomousbody with the functions and rights identical to those of theNational Bank of Moldova and the National SecuritiesCommission. Thus, considering the striving of the Republicof Moldova to the economic integration through the adoptionand implementation of economic and commercial rules andregulations in force in the European Economic Area, in orderto develop a prudential regulatory framework for financialmarkets and supervision system, equivalent to the existingone in the European Union, on December 26, 2006 theChairman of the Parliament of the Republic of Moldovasigned a new Law “on Insurance” no. 407 - XVI, which waspublished in the Official Gazette no. 47 – 49 on April 6, 2007.
The adopted law ensured maximum compliance with therequirements of the insurance laws of the Republic ofMoldova to European standards, oriented to the developmentof an effective, stable and correct insurance market, as well ascooperation in the future with the supervisory authorities ofother countries. This law also defined the state supervisionbody of insurance activity, namely the National Commissionon Financial Market of RM. Along with this, the mainobjectives of the regulation of insurance activity in our

ECONOMIE ŞI SOCIOLOGIE / ECONOMY AND SOCIOLOGY 117
Nr. 3 / 2013
pieţei de asigurări o infrastructură stabilă şi un nivel înalt acerinţelor de pregătire profesională a cadrelor în sfera deasigurări.
Concomitent cu aceste cerinţe, de asemenea, a fostrealizat un nivel înalt de protecţie a agenţilor economici şi acetăţenilor de diferite grupuri de riscuri, îmbunătăţireacalităţii şi lărgirea spectrului serviciilor de asigurări;îmbunătăţirea calitativă a competivităţii pieţei naţionale deasigurări şi creşterea oportunităţilor investiţionale;consolidarea procesului de integrare a pieţei naţionale deasigurări în sistemul internaţional.
Conform dispoziţiilor tranzitorii ale noii legi „cu privirela asigurări”, societăţile de asigurări ce activau la momentulîntrării în vigoare a acesteia au avut posibilitate de acontinua activitatea de asigurări în baza licenţelor primiteanterior până la expirarea termenului acestora. De asemenea,acestea au avut posibilitatea de a majora capitalul statutarpână la valoarea minimă prevăzută de noua lege în termende 5 ani, nivelul căruia, în aprilie 2012, trebuia să atingăobligatoriu mărimea de 15 milioane de lei pentru activitateaîn clasele de asigurări generale, deci s-a stabilit aplicareacoeficientului 1, pentru activitatea de asigurări în clasele deasigurări pe termen lung de viaţă coeficientul stabilit este de1,5 la nivelul minim aprobat şi 2 pentru activitatea dereasigurare [1].
Conceptele de bază adoptate în legea „cu privire laasigurări” ce a intrat în vigoare în anul 2007 reglementează,în special, activitatea tuturor participanţilor profesionişti pepiaţa de asigurări, inclusiv intermediarilor în asigurări, careşi-au început activitatea din anul2008 şi către anul 2012numărul acestora a constituit 77 de agenţi economici, iarprimele de asigurare subscrise de ei au atins nivelul deaproape 30% din suma totală a primelor brute deasigurare subscrise de piaţa de asigurări. În rezultatulmodificărilor date în legislaţie, activitatea brokerilorîn asigurări a fost supusă licenţierii şi au fost stabiliteanumite cerinţe în activitatea brokerilor şi agenţilor deasigurare.
O dată cu aprobarea legii „cu privire la asigurări” la 22decembrie 2006 a fost aprobată şi apoi publicată înMonitorul Oficial al Republicii Moldova legea „cu privire laasigurarea obligatorie de răspundere civilă pentru pagubeproduse de autovehicule”, care a permis acumulareavolumului de prime şi majorarea acestora în produsul internbrut. Legea dată, de asemenea, prevede implimentareasistemului unic automatizat a informaţiei cu privire laasigurarea obligatorie a răspunderii civile auto, ce este ocerinţă obligatorie pentru promovarea produsului dat înspaţiul european [2]. Sistemul dat a fost pus în aplicare,începând cu 01 februarie 2013. Formarea unei baze de dateunice este una din sarcinele principale în dezvoltareasistemului de asigurări obligatorii, care va asigura osupraveghere eficientă a conformităţii cu legislaţia învigoare (disponibilitatea poliţei de asigurare, implementareasistemului bonus-malus, excluderea poliţelor false etc.) şifacilita accesul persoanelor cointeresate la informaţia cuprivire la existenţa poliţei de asigurare obligatorie pentruanumită unitate de transport.
Preşedintele Parlamentului Republicii Moldova la 03martie 2011 a aprobat legea nr.35 „pentru aprobareaStrategiei de dezvoltare a pieţei financiare nebancare pe anii
country are the increase of the effectiveness of the activity ofthe supervision body for the protection of the legitimateinterests of the insured, as well as the maintenance of afavorable competitive environment on the insurance marketand the development of its infrastructure in compliance withinternational practice, organization of insurance business.
The adoption of the new law “On insurance” provided astable infrastructure of the insurance market and a high levelof professional training of staff in the field of insurance.
Along with these requirements, there was also achieved ahigh level of protection of economic agents and citizensagainst different groups of risks, high quality and a widerange of insurance services, qualitative improvement of thecompetitiveness of the national insurance market and increaseof its investment opportunities, strengthening the process ofnational insurance market integration in the internationalsystem.
In accordance with the transitional provisions of the newLaw “on Insurance”, the insurance companies operating at thetime of its introduction could continue the insurance activityin accordance with the previously obtained licenses before theexpiry of their validity. There was also provided theopportunity to increase the authorized capital up to theminimum level stipulated by the new law within 5 years, thelevel of which in April 2012 was to achieve a mandatory of15 million MDL for the activities of non-life insurance, iethere was applied the rate 1, for the activities of life insurance- the rate 1.5 to a minimum level and the rate 2 forreinsurance business solely [1].
Basic concepts of the Law “on Insurance” adopted in2007, specifically regulates the activity of all professionalparticipants of the insurance market, including the insuranceintermediaries, who started their activity in 2008, and by2012, their number amounted to 77 economic agents, andinsurance premiums signed by them reached in 2012 almost30% of the total gross premiums collected by the wholeinsurance market. As a result of these amendments in thelegislation there was introduced licensing of the activity of theinsurance brokers and established certain requirements for theactivity of insurance brokers and insurance agents.
Simultaneously with the approval of the Law “onInsurance”, on December 22, 2006 there was approved andpublished in the Official Gazette of RM the Law “onmandatory insurance of civil liability for damage caused byvehicles”, which allowed to accumulate the amount ofinsurance premiums and increase its level in the grossdomestic product of the country. The law also provided forthe establishment of a centralized database of motor vehicleliability insurance, which is required for the promotion of thisclass of insurance in the European space. [2] This system wasintroduced on February 01, 2012. Creating a single databaseis an important task of the insurance system development andwill make it possible to provide effective supervision of thecompliance with the applicable law (existence of theinsurance policy, introduction of a bonus-malus system,exclusion of fake insurance policies, etc.) and will ensureeasier access of the persons concerned to the information onthe existence of the compulsory insurance policy of a specificmotor vehicle.
On March 3, 2011 the Chairman of the Parliament of theRepublic of Moldova signed the law No. 35 “On approval of

Revistă teoretico-științifică / Theoretical and scientifical journal118
Nr. 3 / 2013
2011-2014 şi a Planului de acţiuni pentru implementareaStrategiei de dezvoltare a pieţei financiare nebancare pe anii2011-2014”. În scopul consolidării pieţei de asigurări dinRepublica Moldova, principalul obiectiv în domeniulasigurărilor este formarea unei pieţe stabile şi transparente,bazată pe tehnologii moderne de asigurare, capabilă săprotejeze interesele cetăţenilor şi ale agenţilor economici,precum şi să devină o sursă importantă de investiţii pentrudezvoltarea economiei ţării.
Dezvoltarea cu succes a activităţii de asigurări esteimposibilă în condiţii naţionale de auto-izolare, fărăutilizarea experienţei internaţionale.
Diferite modele şi soluţii, practicate în domeniulasigurărilor în ţările dezvoltate au fost implementate şi înRepublica Moldova. Directivele UE ce ţin de licenţiereaactivităţii de asigurări; stabilirea clasificării tipurilor deasigurări după riscurile asigurate şi obiectul asigurării;cerinţele diferenţiate cu privire la mărimea capitalul statutaral asigurătorilor, în funcţie de tipul de activitate în domeniulasigurărilor şi, de asemenea: cerinţele faţă de formarea şimenţinerea rezervelor de asigurare; respectarea marjeiminime de solvabilitate a asigurătorului; cerinţele faţă deactivele ce se admit pentru acoperirea rezervelor tehnice şimarjei minime de solvabilitate, au stat la baza elaborăriiactelor normative ce funcţionează recent în industriaasigurărilor din Republica Moldova [4].
În urma influenţei schibărilor intense din ultimii ani auavut loc schimbări calitative pe piaţa de asigurări dinRepublica Moldova. A crescut cererea la serviciile deasigurări ce se petrece, fără îndoială, prin îmbunătăţireacalităţii prestării acestora şi implementarea noilor tipuri deasigurări.
În ultimii ani au avut loc schimbări şi în structuraparticipanţilor profesionişti pe piaţa de asigurări dinRepublica Moldova, după cum se observă în figura 1.
the Strategy of development of non-banking financial marketfor 2011-2014” and the Action Plan for the DevelopmentStrategy of the non-bank financial Market for 2011-2014. Tostrengthen the insurance market of Moldova, the mainobjective of insurance is to form a stable and transparentmarket based on advanced technologies of insurance, able toprotect the interests of citizens and businesses, as well as tobecome an important source of investment for the economicdevelopment of the country.
The successful development of the insurance business isimpossible in conditions of national self-isolation, without theuse of proven international experience.
Many models and solutions developed in the developedcountries in the field of insurance and its regulation, foundpractical application in Moldova. EU Directives on thelicensing of insurance activity, established a classification oftypes of insurance of the insurance risks and insuranceobjects, differentiated requirements for the amount of theauthorized capital of insurers, depending on the type of theproposed insurance activity, as well as: requirements for theformation of technical reserves and borrowings, comply withthe solvency margin of insurers and the ratio of liquidity;requirements to the assets of the insurer, used to cover thetechnical reserves and the minimum solvency margin becamethe basis for the development of regulations now in use inMoldova.
In recent years under the influence of huge changes, thereoccurred qualitative changes in the insurance market of theRepublic of Moldova. The improved the demand forinsurance services that is undoubtedly the result of theimproving of quality of provision and the introduction of newtypes of insurance.
Over the past few years there have also been changes inthe structure of the professional participants of the insurancemarket in Moldova as seen in figure 1.
0
100
2005200620072008 2009 2010 2011 2012
32 33 3328 24 24 20 17
0 0 0
32 4563 66 77
Brokeri/brokersFig. 1. Evoluţia numărului participanţilor profesionişti pe piaţa de asigurări din Republica Moldova, 2005-2012 /
Fig. 1. Evolution of the number of professional participants of the insurance market in Moldova, 2005-2012Sursa/Source: www.cnpf.md, [6]
În perioada anului 2012 societăţile de asigurări ausubscris 1089,3 milioane de lei prime de asigurare sau 69,9milioane de euro în comparaţie cu 61,6 milioane de euro înanul 2011.
Din figura 2 se observă creşterea primelor brutesubscrise (PBS) în ultimii ani de dezvoltare a pieţii deasigurări.
During the period of 2012, the insurance companieshave signed 1089.3 million MDL premiums on directinsurance or 69.9 million euros compared with 61.6million euros achieved in 2011.
In figure 2 it is clearly visible the increase in grosswritten premiums (GWP) for the last years of thedevelopment of the insurance market.

ECONOMIE ŞI SOCIOLOGIE / ECONOMY AND SOCIOLOGY 119
Nr. 3 / 2013
Fig. 2. Evoluţia PBS pe toate tipurile de asigurări şi despăgubirile de asigurareplătite de societăţile de asigurări în perioada anilor 2005-2012/
Fig. 2. Evolution of the GWP for all types of insurance and paid insuranceclaims by insurance companies in the period 2005-2012
Sursa/Source: www.cnpf.md, [6].
În anul 2012 primele zece companii, lideri pe piaţa deasigurări din ţară, au subscris 90,2% din suma totală aprimelor de asigurare, iar 10% de prime au fost subscrisede către ceilalţi participanţi profesionişti pe piaţa deasigurări din Republica Moldova (la sfârşitul anului 2012în ţară activau 17 societăţi de asigurări).
According to the results of 2012 the top ten leadinginsurance organizations of the country collected 90.2% of thetotal premiums, the other about 10% of insurance premiumswere collected by other participants of the insurance marketof the Republic of Moldova (by the end of 2012 in thecountry there were 17 operating insurance companies).
Tabelul 1/Table 1Primele zece societăţi de asigurări din Republica Moldova pe primele de asigurare subscrise în anul 2012/
The top ten insurance companies of the Republic of Moldova, according to the volume of premiumscollected by the end of 2012
Nr./Nombe
r
Denumirea societăţii de asigurări/Name of insurance company mln. lei euro
1 MOLDASIG SA 334,36 20,902 ASITO SA 166,17 10,383 MOLDCARGO SA 130,68 8,164 GRAWE CARAT ASIGURĂRI SA 118,68 7,425 DONARIS-GROUP SA 85,23 5,336 EUROASIG SA 45,40 2,847 VICTORIA ASIGURĂRI SA 40,91 2,568 ACORD-GRUP SA 39,56 2,479 TRANSELIT SA 28,69 1,8010 KLASSIKA ASIGURĂRI SA 18,85 1,18
Sursa/Source: www.cnpf.md, [6]
Lideri în anul 2012, pe primele de asigurare subscrisesunt societăţile de asigurări prezentate în tabelul 1.
Pentru evaluarea pieţei de asigurări o importanţăsemnificativă o au indicatorii calitativi. În primul rând,acest indicator este raportul dintre primele de asiguraresubscrise la produsul intern brut (PIB). Prima brutăsubscrisă (PBS) în PIB în anul 2012 a constituit 1,23%, ceeste aproape de 10 ori mai mică decât în alte ţăridezvoltate.
The main leaders according to the results of 2012, interms of collected insurance premiums are the insurancecompanies presented in the table 1.
Important for the assessment of the insurance marketare relative indicators. First of all, this is the index as theratio of total insurance premiums to gross domesticproduct. The share of gross written premiums (GWP) inGDP in 2012 amounted to 1.23%, which is almost 10 timesless than in other developed countries.

Revistă teoretico-științifică / Theoretical and scientifical journal120
Nr. 3 / 2013
Fig. 3. Ponderea primelor brute subscrise (PBS) în PIB, Republica Moldova, %/Fig. 3.The share of gross written premiums (GWP) in GDP in the Republic of Moldova,%
Sursa/Source: www.cnpf.md, [6].
Îndicatorul primei brute subscrise în PIB este unindicator calitativ a nivelului de trai al populaţiei dinRepublica Moldova. Din analiza prezentată este vizibil, căîn perioada anilor 2005-2012, indicatorul dat a crescutnumai în perioada anilor 2005-2009, iar din anul 2009,indicatorul dat a început să scadă şi în anul 2011 a ajunspână la 1,22% în PIB. Numai începând cu anul 2012indicatorul primei brute subscrise în PIB a început săcrească şi a atins nivelul de 1,23%.
În ultimii ani pe piaţa de asigurări a RepubliciiMoldova se observă o creştere a sumelor totale pedespăgubirele de asigurare plătite o dată cu creşterearapidă a primelor de asigurare subscrise (figura 3).
Indicator of the share of gross written premiumsin GDP is a qualitative indicator of the standard of livingof the population of our country. The above analysis showsthat in the period 2005-2012, this indicator rose during theperiod 2005 – 2009, and since 2009 this indicator began todecline and in 2011 it reached the level of 1.22% of GDP.Only since 2012 the indicator of share of gross writtenpremiums in GDP began to grow slightly and reached upto 1.23%.
Over recent years, on the insurance market of theRepublic of Moldova it has been noticeable an increase inthe total amount of insurance payments on the backgroundof the rapid growth of insurance premiums (figure 3).
Tabelul 2/Table 2Primele zece societăţi de asigurare din Republica Moldova
ce au plătit cele mai mari despăgubiri de asigurare în anul 2012 /The top ten insurance companies in the Republic of Moldova,
performing the greatest insurance premiums by 2012Nr./
Number Denumirea societăţii de asigurări/ Name of insurance company mln. lei
1 MOLDASIG SA 160 ,982 ASITO SA 59 ,233 MOLDCARGO SA 43, 994 DONARIS-GROUP SA 34 ,625 MOLDOVA-ASTROVAZ SA 25 ,026 GRAWE CARAT ASIGURĂRI SA 22 ,247 VICTORIA ASIGURARI SA 20 ,168 EUROASIG SA 17 ,789 KLASSIKA ASIGURĂRI SA 9 ,3910 TRANSELIT SA 8 ,61
Celelalte societăţi de asigurări 28,49Total plăţi pe piaţa de asigurări 430,51
Sursa/Source: www.cnpf.md, [6].
Datele prezentate în tabelul 2 arată, că societăţilede asigurări – lideri, ce au subscris cele mai marivolume pe primele de asigurare, sunt şi cei mai mariplătitori a dispăgubirilor de asigurare pe piaţa deasigurări din Republica Moldova. Suma totalăa despăgubirilor de asigurare plătite în anul 2012au constituit 430,5 milioane de lei. Cota primelor10 societăţi de asigurări în suma totală a constituit93,38%.
The data shown in Table 1., indicate that the insurancecompanies, which appear in line with the leading ones withthe greatest performance in terms of insurance premiums, areregistered in the list of the largest payers of insurancepremiums and claims on the insurance market of the Republic(table 2). The total amount of insurance payments andreimbursements in 2012 throughout the country’s insurancemarket amounted to 430.5 million MDL. The share of the top10 insurance companies in the total payout is 93.38%.
ECONOMIE ŞI SOCIOLOGIE / ECONOMY AND SOCIOLOGY 121
Nr. 3 / 2013
Concluzii. În ultimii ani, s-a schimbat atitudineasocietăţii faţă de asigurări, în primul rând din parteaorganelor legislative şi executive. A fost implementată şicontinuă să se perfecţioneze legislaţia în asigurări. Asosit timpul, când se înţelege că asigurările pot săinfluenţeze semnificativ procesele economice ce au locîn societate şi, din această cauză, necesită susţinere dinpartea statului. Au fost făcuţi primii paşi spre integrareapieţei de asigurări din Republica Moldova cu piaţainternaţională de asigurări.
Dezvoltarea rapidă a industriei naţionale de asigurări,ţinând cont şi de potenţialul existent a altor segmente apieţei financiare din ţară, a influenţat considerabilreformele economice din Republica Moldova.
Conclusions. Over the last few years it has radicallychanged the attitude towards insurance in society, andespecially on the part of the legislative and the executivepowers. It has been developed and continues to improve theinsurance legislation. It is understood that insurance canhave a significant impact on the economic processes, takingplace in society, and therefore it needs a governmentsupport. There are made the first steps towards integration ofthe insurance market of Moldova in the internationalinsurance business.
The development of an accelerated pace of the nationalinsurance industry, taking into account the existing potential ofother segments of the financial market of the country has givena powerful impetus to positive economic reforms in Moldova.
Referinţe bibliografice / References1. Legea Republicii Moldova cu privire la asigurări: nr. 407-XVI din 21.12.2006. In: Monitorul Oficial al Republicii
Moldova. 2007, nr. 47-49, art. 213.2. Legea Republicii Moldova cu privire la asigurarea obligatorie de răspundere civilă pentru pagube produse de
autovehicule: nr. 414-XVI din 22.12.2006. In: Monitorul Oficial al Republicii Moldova. 2007, nr. 32-35, art. 112.3. Hotârîrea Guvernului Republicii Moldova cu privire la unele măsuri de reglementare a activităţii de asigurare: nr.
533 din 10.06.1997. In: Monitorul Oficial al Republicii Moldova. 1997. nr. 048, art. 504.4. Buletin special al Comisiei Nationale a Pietei Financiare din 12.11.08 [accesat 20 iunie 2013]. Disponibil:
www.cnpf.md5. Raport anual al Comisiei Naţionale a Pieţei Financiare anii 2005-2012 [accesat 22 iunie 2013]. Disponibil:
www.cnpf.md6. Comisia Naţională a Pieţei Financiare [accesat 18 septembrie 2013]. Disponibil: www.cnpf.md [accesat 18 iunie
2013]. Disponibil: www.xprimm.md7. ГОМЕЛЛЯ, В.Б. Отношение государства к страхованию. В: Страховое ревю. 2003, № 9, cc. 43-45.
Recomandat spre publicare: 17.07.2013

Revistă teoretico-științifică / Theoretical and scientifical journal122
Nr. 3 / 2013
EVALUAREA CĂILOR ŞI METODELOR DEEFICIENTIZARE A REZULTATULUI ACTIVITĂŢII
DE GESTIUNE A ANTREPRENORULUICONSTRUCTIV
THE EVALUATION OF THE WAYS ANDMETHODS AS EFFICIENT MANAGEMENT
ACTIVITY RESULT OF THE CONSTRUCTIVEENTREPRENEUR
Stela EFROS, lector magistru, drd. ULIMNatalia BURLACU, dr. hab., prof. univ., ULIM
Stela EFROS, lecturer MA, PhD student, ULIMNatalia BURLACU, PhD, Associate Professor, ULIM
Acest articol descrie particularităţile și criteriile decalitate ale activităţii constructive a businessului. Esteabordată importanţa de evaluare și gestionare aactivităţilor sale cu eficienţă specifică. Problema creșteriieficienţei managementului antreprenoriatului constă încreșterea veniturilor din muncă a antreprenorilor. Celemai eficiente moduri sunt îndreptate spre: dezvoltareacompetenţelor, deciziile de îmbunătăţire a calităţii,îmbunătăţirea stilului și metodelor de management șialtele.
Cuvinte cheie: antreprenoriat, eficientizare, gestiune,economie, management
This article describes the quality dimensions of theconstructive entrepreneur’s business activity. It approachesthe importance of assessing and directing its activitiestoward specific efficiency. The question of raising theefficiency of management of entrepreneurship lies inincreasing labor income entrepreneurs. The efficient waysare directed towards: skills development, qualityimprovement decisions, improving the style and methods ofmanagement and others.
Key words: entrepreneurship, efficiency, management,economics, management
JEL Classification: G24, G29, E24
Introducere. Descrierea particularităţilor şidimensiunii calitative a activităţii antreprenoruluiconstructiv favorizează importanţa evaluării activităţilorspecifice acestuia şi direcţionarea spre eficientizare.
Evaluarea are o deosebită importanţă în planuldesfăşurării activităţii antreprenoriale, ea fiind utilizată cainstrument de eficientizare şi îmbunătăţire a performanţelorîntreprinderii. De asemenea, în planul gestiunii eficiente aactivităţilor antreprenorului constructiv, rezultateleevaluării periodice garantează dezvoltarea antrepreno-riatului în ansamblul economiei ţării [5, p. 64].
Continuând cercetarea şi mizând pe metoda”personificării şi subiectivizării” expusă de autor, seconcretizează în aceeaşi ordine de idei că:
Antreprenoriatul constructiv este personificat sausubiectivizat prin antreprenorul constructiv.
Activitatea antreprenorului constructiv –reprezintă totalitatea acţiunilor în cadrul muncii de zi cu zi.
Munca antreprenorului constructiv este diversă.Acţiunile lui sunt multiple. O parte din muncă esteefectuată succesiv, alta – paralel. Deseori, acţiunile demuncă ale antreprenorului constructiv sunt legate între eleprintr-o reţea astfel, încât pentru efectuarea unei acţiunitrebuie îndeplinite numaidecât un şir de alte acţiuni.Totodată, acţiunile legate între ele pot fi efectuate de maimulţi executori. De aici reiese coordonarea acţiunilorefectuate, ceea ce redă importanţa rolului organizăriimuncii colective.
Scopul formulat de autor – a găsi metodele şi căilede eficientizare a productivităţii muncii (rezultatulactivităţii) antreprenorului constructiv în cadrul efectuăriiactivităţii antreprenoriale.
Pentru atingerea scopului propus, este necesar de ademonstra capacitatea de măsurare a cheltuielilor şirezultatelor muncii antreprenorului constructiv, adicătrebuie elaborat indicele rezultatului activităţiiantreprenorului constructiv.
Conţinut de bază. În cazul antreprenoriatului apareconfruntarea cu unele dificultăţi. Se ştie că productivitateamuncii unui lucrător este volumul producţiei fabricate de
Introduction. This article describes qualitypeculiarities and dimensions of the constructiveentrepreneur’s activity which promotes the importance ofits specific activities assessment and its direction towardefficiency.
The evaluation has a special importance regarding theentrepreneurship’s activity development, it is being used asan efficiency and improvement tool of the enterpriseperformances. It is known that in an efficient managementof the entrepreneur’s activities, the results of the periodicassessment guarantee the entrepreneurship’s activities atthe country’s economy level [5, p. 64].
Continuing the research and relying on the“personification and subjectivity” method exposed byauthor, it is possible to concrete also that:
The entrepreneurship becomes personified andsubjective by the constructive entrepreneur.
The activity of the constructive entrepreneurrepresents the totality of the daily actions.
The constructive entrepreneur’s work is various.His actions are multiple. A part of his work is madesuccessively; the other part is made simultaneously. Often,the constructive entrepreneur’s actions are linked by anetwork, in this way the achievement of one of the actionsneeds the accomplishment of others. Also, the actionslinked between them may be accomplished by differentexecutors. This suggests that the coordination of theexecuted actions has an important role in the collectivework organization.
The aim stipulated by the author is to find themethods and efficient ways of work productivity (the resultof the activity) of the constructive entrepreneur during theentrepreneurship’s activity accomplishment.
In order to attain this aim, it is necessary todemonstrate the capacity of expenditures measurement andthe results of the constructive entrepreneur’s work, in otherwords it is necessary to elaborate activity result index ofthe constructive entrepreneur.
Basic content. There are some difficulties in the caseof the entrepreneurship. It is known that the work
ECONOMIE ŞI SOCIOLOGIE / ECONOMY AND SOCIOLOGY 123
Nr. 3 / 2013
el, exprimat în natură sau în cost, într-o unitate de timp. Încazul activităţii de producţie, indicele ”productivitateamuncii” are un sens concret. Întotdeauna se poate măsuranumărul de piese, bucăţi de produse, etc. fabricate de unlucrător într-o oră, o lună, un an. Dar şi aici, la uneleprofesii se întâlnesc dificultăţi. De exemplu, este complicatde a măsura volumul producţiei ”fabricate” de un reglorsau de un lucrător care repară utilajele.
Însă şi mai dificil este a măsura rezultatul muncii unuilucrător din sfera intelectuală. Aşadar, este greu a măsurarezultatul muncii unor profesii cum ar fi savanţi,proiectanţi, învăţători, programatori, consultanţi, muzicieni,jurnalişti etc. De exemplu: cum se poate măsuraproductivitatea muzicianului, dacă el a compus o muzicăfoarte bună, dar orchestra o interpretează oribil. Se poatespune că productivitatea acestui muzician este înaltă?
Aceste deosebiri - caracterul intelectual al muncii şiforma de muncă colectivă sunt caracteristice şi activităţiiantreprenorului. Prin urmare, măsurarea prodictivităţiimuncii (rezultatului) antreprenorului este legată de aceleaşidificultăţi.
Înainte de a examina aceste dificultăţi şi a găsiprocedeele de depăşire a lor, intervine întrebarea: Pentru cear trebui indicele ”productivitatea muncii antreprenorului”?Răspunsul este evident: ca activitatea antreprenoruluiconstructiv să poată fi gestionată eficient şi ca să se poatămotiva următoarele momente:
- astăzi antreprenorul unei întreprinderi date activeazămai bine sau mai rău decât ieri;
- rezultatul activităţii antreprenorului unei întreprinderieste mai înalt sau mai jos decât al alteia;
- este aceeaşi importanţa numerică a rezultatuluiplanificat al antreprenorului la elaborarea programelor şiplanurilor dezvoltării întreprinderii, sau s-a modificat îndirecţie negativă.
Pentru soluţionarea acestor probleme poate fi utilizat,în esenţă, unul dintre următorii indici egali care ar permiteevaluarea activităţii antreprenorului în coordonatele pozitiv- negativ:
- productivitatea muncii antreprenorului;- productivitatea antreprenorului;- rezultatul activităţii antreprenorului;- eficienţa antreprenorului etc.Autorul propune de a utiliza termenul ”rezultatul
activităţii antreprenorului” ca sinonim al termenilor”productivitatea muncii antreprenorului” sau”productivitatea antreprenorului”, reieşind mai degrabă dinsesizarea semnificaţiei ”rezultat” decât din analiza lexicalădetaliată a acestui termen. Izvoarele sesizărilor lexicale înformă de argumente în favoarea acestui termen sunt date înTabelul 1.
Dificultăţile de terminologie sunt condiţionate înprimul rând de faptul că în cazul antreprenorilor nu se ştiece poate fi considerat ”produs al activităţii”. Se presupunecă produsul antreprenorului este informaţia percepută şideţinută care îi oferă şanse antreprenorului constructivde a dezvolta activitatea în baza oportunităţilor sesizate.Însă informaţia este o categorie abstractă. Ea,desigur, poate fi măsurată în biţi, baiţi. Dar cu acestemăsuri poate fi măsurat volumul de informaţie(de exmplu, la calcularea volumului discului sau a
productivity of a worker is the volume of the productionmade by him, expressed in nature or cost, in a certain unitof time. In the case of the production activity, “productivitywork” index has a concrete meaning. It is always possibleto count a number of pieces, parts of products, etc. made bythe worker in an hour, a month or a year. Even here, thereare some difficulties in some professions. For example, it iscomplicated to measure the volume of the “made”production of a setter or a worker that repairs equipment.
But it is more difficult to measure the result of a workerfrom intellectual sphere. So, it is difficult to measure awork result of such professions as scientists, designers,teachers, programmers, consultants, musicians, journalistsand others. For example: how can we measure the musicianproductivity, if the musician created a very good music, butthe orchestra plays it in a horrible way? Can we say that theproductivity of this musician is high?
These differences – the intellectual character of thework and the collective work model are characteristic forthe entrepreneur’s activity. Therefore, measuring the workproductivity (the result) of the entrepreneur is linked to thesame difficulties.
Before examining these difficulties and finding themethods of their overcome, a question interferes: Why is itnecessary the index of “entrepreneur’s work productivity”?The answer is evident: it is necessary to manage efficientlythe activity of the constructive entrepreneur and to motivatethe following:
- today, the entrepreneur of a certain enterprise worksbetter or worse than yesterday;
- the entrepreneur’s activity result of a certainenterprise is higher or lower than of other;
- the numerical importance of the entrepreneur’splanned result for the plans and programs elaboration of theenterprise development is the same or modified in thenegative direction.
In order to solve these problems, it can be used thefollowing equal indexes which would allow the evaluationof the entrepreneur’s activity as positive or negative:
- the productivity of the entrepreneur’s work;- the productivity of the entrepreneur;- the result of entrepreneur’s activity;- entrepreneur’s efficiency, etc.The author proposes to use the term “the result of the
entrepreneur’s activity” as synonym of the terms “theproductivity of the entrepreneur’s activity” or“entrepreneur’s activity”, fact concluded from theunderstanding of the meaning “result” than from thedetailed lexical analysis of this term. The sources of thelexical understandings as arguments for this term areshown in the Table 1.
The terminological difficulties are conditioned first ofall by the fact that in case of the entrepreneurs, it is notknown what is considered a “product of the activity”. Itsupposes that the entrepreneur’s product is the perceivedand held information which offers chances to theconstructive entrepreneur to develop the activity based onseized opportunities. The information is not an abstractcategory. It can be measured in bits, bytes. With thesemeasures, it can be measured the information volume (forexample, the calculation of the disk’s volume or of the

Revistă teoretico-științifică / Theoretical and scientifical journal124
Nr. 3 / 2013
failului). Dar volumul de informaţie în biţi sau baiţi nupoate determina volumul ”produsului munciiantreprenorului”.
file). But this information volume in bits, bytes cannotdetermine the volume of the “entrepreneur’s workproduct”.
Tabelul 1/ Table 1Compararea termenilor ce caracterizează rezultatul antreprenorilor
Terms comparison which characterize the entrepreneur’s resultFormularea termenului/ Theformulation of the term
Argumentarea utilizării termenuluiThe argumentation of the term’s use
”pro” ”contra”1. Productivitatea munciiantreprenorului /The productivity of theentrepreneur’s work
Reflectă esenţa indicelui de calculare avalorii rezultatului muncii sau activităţii /It reflects the essence of the valuecalculation index for the result of the workor activity
Se asociază cu procesul de muncă. Printre altele, activitateaantreprenorului nu este numai un proces de muncă, dar şiexecutarea funcţiilor de reprezentant, de lider, de menţinere aautorităţii etc. / It is associated with the work process. Inter alia,the entrepreneur’s activity is not just a work process, but it isalso the accomplishment of the representative, leader andauthority keeping functions
2. Productivitateaantreprenorului/Entrepreneur’s productivity
Este utilizat de către unii autori pentruevaluarea rezultatului muncii. Reflectăesenţa indicelui de calculare. Are analogenglez – ”productivity” / It is used by someauthors in order to evaluate the work’sresult. It has an English analogue –”productivity”
Surplus de polisemie, nedeterminat, în utilizare cere condiţiiesenţiale. Poate avea câteva unităţi de măsură / Polysemicsurplus, non-determined, it needs essential conditions in use. Itcan have some measurement units.
3. Rezultatul activităţiiantreprenorului /The result of theentrepreneur’s activity
Reflectă esenţa indicelui de calculare avalorii rezultatului muncii sau activităţii/ It reflects the essence of the valuecalculation index for the result of thework or activity
Mai puţin polisemantic. Polisemia poate fi exclusă prindeterminarea esenţei termenului. Atunci apare posibilitateade a utiliza o singură unitate de măsură. / Less polysemic.The polysemantism can be excluded by the essencedetermination of the term. Then it appears the possibility asingle measurement unit.
4. Eficienţa antreprenorului /Entrepreneur’s efficiency
Într-o măsură oarecare, reflectă esenţaindicelui de calculare a valorii rezultatuluimuncii sau activităţii / To a certain extent,it reflects the essence of the valuecalculation index for the result of the workor activity
Surplus de polisemie. Termenul nu este convenabil, deoarecereflectă o măsură relativă. În utilizare cere condiţii esenţiale.Poate avea câteva unităţi de măsură. / Polysemic surplus. Theterm is not appropriate, because it is a relative measure. It needsessential conditions in use. It can have some measurement units.
Sursa : Elaborat de autor/ Source: Elaborated by the author.
Se mai poate presupune că produsul munciiantreprenorului este decizia luată în vederea utilizăriiresurselor disponibile gestiunii activităţii, în vedereaproducerii sau oferirii de produse şi servicii necesaresocietăţii. Dar cum poate fi măsurat acest produs, odată cedeciziile sunt foarte diferite? Multe decizii aleantreprenorului sunt elaborate ca idei, documente subformă de : ordin, dispoziţie, plan, program, însărcinare,raport etc. Atunci se poate presupune că produsul munciiantreprenorului este numărul de documente elaborate de el.Însă chiar la cea mai neînsemnată analiză a acesteipresupuneri autorul concluzionează că numărul dedocumente elaborate de antreprenor reflectă, în cea maimică măsură, produsul lansat de antreprenor. Dar cumrămâne cu ideile, şedinţele, negocierile, dispoziţiileverbale, comunicarea, prezentările efectuate în aceeaşiordine de importanţă, precum şi documentele. În aceastărealitate este evident că numărul de documente elaborate nupoate pretinde la un indice de măsurare a volumului demuncă şi a problemelor antreprenorului.
Autorul consideră că, pentru a măsura rezultatulactivităţii antreprenorului, ar trebui să fie utilizatătotalitatea indicilor care caracterizează, în particular,anumite limite ale activităţii antreprenoriale, deoarecerezultatul activităţii antreprenorului unei întreprinderi poatefi evaluat, cel puţin, din două puncte de vedere :
1. Pe de o parte, rezultatul activităţii antreprenoruluise reflectă în rezultatul activităţii întreprinderii (volumul devânzări ale producţiei, profitul etc.).
We can suppose also the entrepreneur’s work productis the decision made in order to use the available resourcesof the activity’s management to produce or to offerproducts or services necessary for the society. How can itbe measured? The decisions are very different. Many ofentrepreneur’s decisions are elaborated as ideas, documentsas orders, dispositions, plans, programs, tasks, reports, etc.In this way, it is supposed that the product ofentrepreneur’s work is the number of documents elaboratedby him. But at the most insignificant analysis of thissupposition, the author concludes that the number ofdocuments elaborated by the entrepreneur reflects thesmallest measure of the product launched by entrepreneur.But, how about the ideas, sessions, negotiations, verbaldispositions, communication, presentations made withsame importance as documents. In this reality, it is obviousthat the number of elaborated documents cannot attain ameasurement index as a work volume and as entrepreneur’sproblems.
The authors considers that to measure the result of theentrepreneur’s activity, it should be used the totality ofindexes which characterize particularly certain limits of theentrepreneurship activity, because the result of theentrepreneur’s activity can be evaluated, at least, from twopoints of view.
1. From one side, the result of the entrepreneurs’activity reflects the result of enterprise activity (productionsales volume, profit, etc.).
2. From the other side, the entrepreneur’s activity

ECONOMIE ŞI SOCIOLOGIE / ECONOMY AND SOCIOLOGY 125
Nr. 3 / 2013
2. Pe de altă parte, rezultatul activităţii antreprenoruluiconstă în productivitatea muncii de fiecare zi aantreprenorului, managerului, specialiştilor şi executorilorîntreprinderii.
Ţinând cont de aceste observaţii, autorul propuneutilizarea a patru indici care ar da posibilitatea de a evaluarezultatul activităţii antreprenorului constructiv încoordonatele pozitiv - negativ:
1) Produsul antreprenorului constructiv exprimat încost;
2) Randamentul antreprenorului constructiv, ca parte aprofitului;
3) Competenţa antreprenorului constructiv;4) Produsul antreprenorului constructiv în normă/oră. Produsul antreprenorului constructiv exprimat în
cost poate fi determinat ca relaţia dintre volumul producţieirealizate (sau a profitului) a întreprinderii (în MDL) pentruo oarecare perioadă de timp (de exemplu, pe an) şi numărulde persoane din aparatul de conducere, adică antreprenor,proprietar, manager. Unitatea de măsură a acestui indiceeste lei/om. Acest indice al rezultatului antreprenoruluiconstructiv face posibilă măsurarea productivităţii acestuiaîn diverse întreprinderi, precum şi productivitateaconducătorilor şi specialiştilor unei întreprinderi în diferiteetape de timp. Totodată, acest indice are şi neajunsuri,deoarece semnificaţia noţiunii de ”produs” nu depindenumai de munca antreprenorului, dar şi de nivelul de utilarea întreprinderii cu tehnică, de conjunctura pieţei, deproductivitatea muncii lucrătorilor acestei întreprinderi, devechimea întreprinderii etc.
Indicele ”randamentul antreprenorului constructiv,ca parte a profitului” evaluează rezultatul total al activităţiiantreprenorului. Dar, cu toate acestea, este mai concret încomparaţie cu indicele ”produs”, deoarece el depindenumai de munca proprie a antreprenorului. În continuare, înbaza cercetării operaţionale, se va analiza acest indice maidetaliat. Cercetarea operaţională reprezintă ansamblul deprincipii, metode şi mijloace destinate elaborării de modelematematice ale fenomenelor şi proceselor, în cazul dat,antreprenoriatul constructiv, în vederea adoptării unordecizii care să contribuie la modificarea acestora în direcţiadorită de antreprenor. Cercetarea operaţională se bazeazăpe aplicarea combinată a principiilor analizei ştiinţifice,logicii şi interpretării în scopul soluţionării unor problemecantitative care apar în procesul de adoptare a deciziilormanageriale. Principalele obiective ale cercetăriioperaţionale sunt următoarele: a) fundamentarea cantitativăa deciziilor; b) compararea variantelor decizionale posibilede organizare a operaţiilor; c) evaluarea influenţelorprobabile ale diferiţilor factori asupra rezultatelor activităţii[3, p.231].
Astfel, în baza cercetării operaţionale, autorul admitecă profitul activităţii de antreprenoriat este alcătuit din treifactori, dintre care :
1. Capitalul (resursele financiare);2. Munca (resursele umane), factori obiectivi ai
”tiunghiului metodologic”;3. Contribuţia antreprenorului constructiv, ca factor
personificat şi subiectiv al antreprenoriatului, care reuneşteprimii doi factori şi prin aceasta influenţează mărimeaprofitului.
result consists of daily work productivity of theentrepreneur, of the manager, specialists and executors ofthe enterprise.
Taking into consideration all these observations, theauthor proposes the utilization of four indexes which wouldgive the possibility to evaluate the result of the constructiveentrepreneur’s activity as positive or negative:
1) Product of the constructive entrepreneur expressedby cost.
2) The efficiency of the constructive entrepreneur aspart of the profit.
3) The competence of the constructive entrepreneur4) The product of the constructive entrepreneur as
quota/hour. The product of the constructive entrepreneur
expressed by cost can be determined as the relationshipbetween the volume of the fulfilled production (or of theprofit) of the enterprise for a certain period (for example, ayear) and the number of persons from the direction, namelythe entrepreneur, the owner, the managers. Measure uniteof this index is lei/person. This index of the constructiveentrepreneur’s result makes possible its productivitymeasurement from different enterprises, also the leadersand specialists’ productivity of an enterprise in differentperiods of time. Also, this index has drawbacks, becausethe significance of the notion “product” does not dependonly of entrepreneur’s work, but it depends also oftechnical utility level of the enterprise, market juncture,workers work productivity from the enterprise, enterprise’sage, etc.
The index “the efficiency of the constructiveentrepreneur as part of the profit” assesses the total resultof the entrepreneur’s activity. But, it is more concrete thanthe index “product”, because it depends only of theentrepreneur’s own work. And we will continue to analyzemore detailed this index according to the operationalresearch. The operational research represents the set ofprinciples, methods and means for the elaboration ofphenomena and mathematic processes models; in this casefor the constructive entrepreneurship as a possibility tomake decisions which will contribute at their modificationin the entrepreneur’s needed direction. The operationalresearch is based on combined application of the logic,scientific analysis principles and interpretation in order tosolve certain quantitative problems appeared duringadoption of the managerial decisions. The main objectivesof the operational research are the following: a)quantitative substantiation of the decisions; b) thecomparison of the possible decisional variants inoperations’ organization; c) the assessment of the possibleinfluences of different factors on activity’s result [3, p.231].
So, basing on operational research, the author admitsthat the profit of the entrepreneurship’s activity consists ofthree factors:
1. Capital (financial resources)2. Work (human resources), objective factors of the
“methodological triangle”3. The contribution of the constructive entrepreneur
as subjective and personified factor of the entrepreneurshipwhich unites the first two factors, thereby it influences the
Revistă teoretico-științifică / Theoretical and scientifical journal126
Nr. 3 / 2013
Deci în baza acestor factori se creează modelulmatematic, în scopul calculării indicelui ”randamentulantreprenorului constructiv, ca parte a profitului”. Acestase exprimă prin formula:
P = Pk + Pl + Pa (2.1.)unde, P – profitul întreprinderii pentru un an, lei;Pk – partea profitului ca produs al capitalului
(rentabilitatea capitalului), lei;Pl – partea profitului ca produs al muncii (eficienţa
muncii), lei;Pa– partea profitului ca produs al antreprenoriatului
constructiv, lei.Pentru a înţelege mai bine funcţionalitatea formulei în
evaluarea profitului produs de antreprenoriatul constructiv,autorul apelează la coeficientul de corelaţie.
Corelaţia reprezintă evaluarea puterii de asociere dintredouă variabile continue [2, p.125]. În cazul cercetat deautor variabilele sunt valoarea capitalului (K) şi valoareamuncii (L), iar corelaţia acestor variabile reflectămodalitatea de a măsura intensitatea legăturii dintre ele.Autorul a considerat oportună utilizarea coeficientului decorelaţie datorită capacităţii acestuia de a identificalegătura dintre două variabile, posibilitatea de cuantificarea variabilelor şi de stabilire a direcţiilor legăturilor dintrevariabile [1, p.46]. De regulă valoarea coeficientului decorelaţie poate varia între +1 şi -1. O valoare apropiată de+1 indică o corelaţie pozitivă puternică; o valoare apropiatăde -1 indică o corelaţie negativă puternică, iar o valoareapropiată de zero indică faptul că cele două variabile suntindependente şi cunosc un grad scăzut de corelaţie directă.
În această ordine de idei, autorul propuneun coeficient de corelaţie liniară simplă, notat prin r cuvaloarea de 0,1. Această valoare este atribuită dinconsiderentul că cele două variabile sau indicatori –capitalul (K) şi munca (L) – se prezintă ca fiindindependente în activitatea de antreprenoriat, dar totodatăsunt corelate într-o anumită măsură în asigurarearezultatelor activităţii.
Astfel, în formulă valoarea capitalului şi a muncii valua o altă formă, suplimentată de coeficientul decorelaţie :
(Pk + Pl) = r *(K + L) (2.2.)Atunci partea profitului ca produs al antreprenoriatului
constructiv este egal:Pa = P – r *(K + L) (2.3.)
unde, K – valoarea capitalului (de exemplu, valoareaactivelor), lei,
L – valoarea muncii (de exemplu, remunerarea anuală apersonalului), lei.
r – coeficient de corelaţiePentru evaluarea mărimii indicatorului ”randamentul
antreprenorului constructiv, ca parte a profitului”, încondiţiile concrete ale unei întreprinderi pot fi evidenţiatetrei variante (Fig. 2).
Varianta I. Profitul întreprinderii pentru un an (P)depăşeşte partea profitului ca produs al capitalului şi almuncii, adică : P > r *(K + L). În această situaţie,”randamentul antreprenorului constructiv, ca parte aprofitului” este mai mare decât zero, adică Pa > 0.
Varianta II. Profitul întreprinderii pentru un an (P) estemai mic decât partea profitului ca produs al capitalului şi al
growth of the profit.By these two factors, it is created the mathematic
model in order to calculate the index of the “the efficiencyof the constructive entrepreneur as part of the profit”. It canbe expressed by the formula:
P = Pk + Pl + Pa (2.1.)Where, P – is the profit of the enterprise per year, lei;Pk – is the part of the profit as product of the capital
(the capital profitableness), lei;Pl – is the part of the profit as work product (the work
efficiency), lei;Pa – is the part of the profit as product of the
constructive entrepreneurship, lei.To understand better the formula’s functionality in the
profit product assessment of the constructiveentrepreneurship, the author appeals at the correlationcoefficient.
The correlation represents the power assessment of theassociation between two continued variables [2, p. 125]. Inthe case studied by the author, the variables are thecapital’s value (K) and work’s value (L), and thecorrelation of these variables reflects the way to measurethe link intensity between them. The author consideredfavorable the use of the correlation coefficient thanks to itscapacity to identify the link between the two variables, thequantification possibility of the variables and their links’directions determination [1, p. 46]. Usually, the value ofthe correlation coefficient may vary between +1 and -1. Anappropriate value +1 indicates a strong positive correlation;an appropriate value -1 indicates a strong negativecorrelation, and an appropriate value 0 indicates that thetwo variables are independent and show a low degree ofdirect correlation.
In this way, the author proposes a simple and straightcorrelation coefficient, marked by r with the value 0,1.This value is attributed because the two variables or theindicators capital (K) and the work (L) present themselvesas independent in the entrepreneurship’s activity, but inmean time they are correlated to a certain degree in order toassure the activity’s results.
So in the formula, the value of the capital and of thework will take a different form, supplemented by thecorrelation coefficient:
(Pk + Pl) = r *(K + L) (2.2.)Then the part of the profit as product of the
constructive entrepreneurship is equal to:Pa = P – r *(K + L) (2.3.)
Where, K – is the value of the capital (for example,assets value), lei,
L – is the value of the work (for example, annual staffremuneration), lei.
r – correlation coefficentWe can highlight three variants in order to asset the
size of the indicator “the efficiency of the constructiveentrepreneur as part of the profit” in enterprise’s concreteconditions (fig. 2).
1st Variant. The profit of the enterprise for a year (P)overcomes the part of the profit as product of the capitaland of the work, it means P > r *(K + L). In this situation,“the efficiency of the constructive entrepreneur as part ofthe profit” is higher than zero, it means Pa > 0.
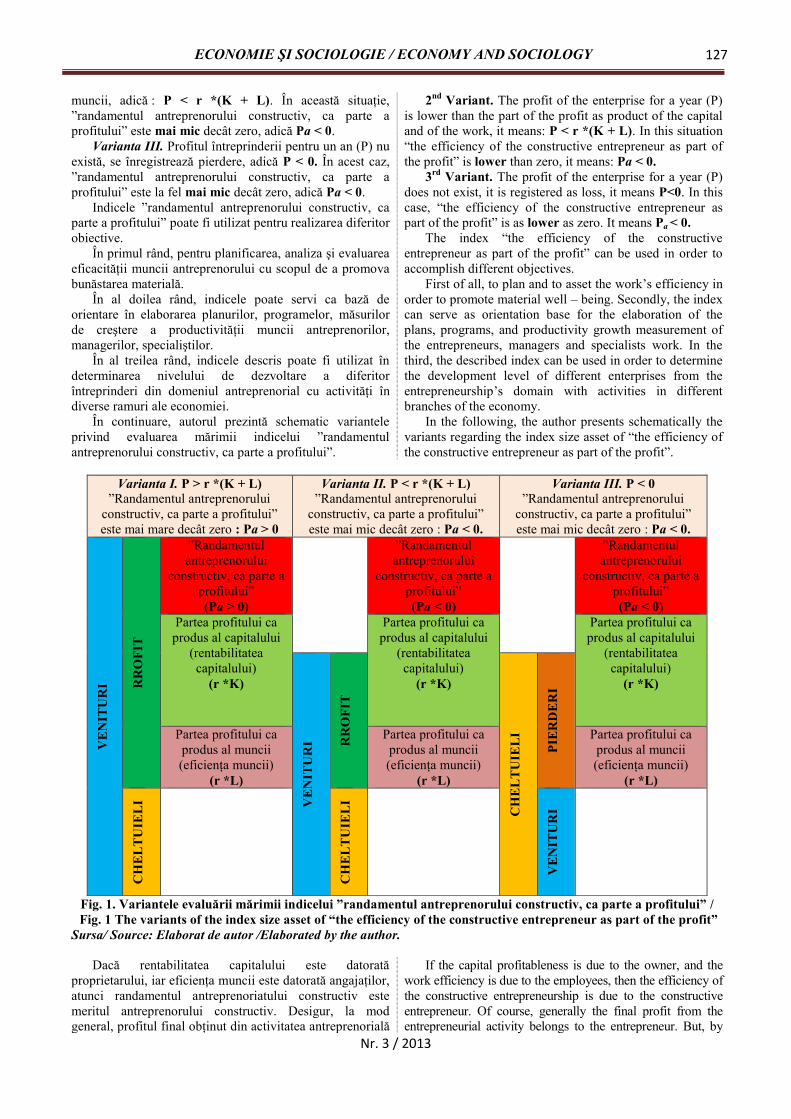
ECONOMIE ŞI SOCIOLOGIE / ECONOMY AND SOCIOLOGY 127
Nr. 3 / 2013
muncii, adică : P < r *(K + L). În această situaţie,”randamentul antreprenorului constructiv, ca parte aprofitului” este mai mic decât zero, adică Pa < 0.
Varianta III. Profitul întreprinderii pentru un an (P) nuexistă, se înregistrează pierdere, adică P < 0. În acest caz,”randamentul antreprenorului constructiv, ca parte aprofitului” este la fel mai mic decât zero, adică Pa < 0.
Indicele ”randamentul antreprenorului constructiv, caparte a profitului” poate fi utilizat pentru realizarea diferitorobiective.
În primul rând, pentru planificarea, analiza şi evaluareaeficacităţii muncii antreprenorului cu scopul de a promovabunăstarea materială.
În al doilea rând, indicele poate servi ca bază deorientare în elaborarea planurilor, programelor, măsurilorde creştere a productivităţii muncii antreprenorilor,managerilor, specialiştilor.
În al treilea rând, indicele descris poate fi utilizat îndeterminarea nivelului de dezvoltare a diferitorîntreprinderi din domeniul antreprenorial cu activităţi îndiverse ramuri ale economiei.
În continuare, autorul prezintă schematic varianteleprivind evaluarea mărimii indicelui ”randamentulantreprenorului constructiv, ca parte a profitului”.
2nd Variant. The profit of the enterprise for a year (P)is lower than the part of the profit as product of the capitaland of the work, it means: P < r *(K + L). In this situation“the efficiency of the constructive entrepreneur as part ofthe profit” is lower than zero, it means: Pa < 0.
3rd Variant. The profit of the enterprise for a year (P)does not exist, it is registered as loss, it means P<0. In thiscase, “the efficiency of the constructive entrepreneur aspart of the profit” is as lower as zero. It means Pa < 0.
The index “the efficiency of the constructiveentrepreneur as part of the profit” can be used in order toaccomplish different objectives.
First of all, to plan and to asset the work’s efficiency inorder to promote material well – being. Secondly, the indexcan serve as orientation base for the elaboration of theplans, programs, and productivity growth measurement ofthe entrepreneurs, managers and specialists work. In thethird, the described index can be used in order to determinethe development level of different enterprises from theentrepreneurship’s domain with activities in differentbranches of the economy.
In the following, the author presents schematically thevariants regarding the index size asset of “the efficiency ofthe constructive entrepreneur as part of the profit”.
Varianta I. P > r *(K + L)”Randamentul antreprenorului
constructiv, ca parte a profitului”este mai mare decât zero : Pa > 0
Varianta II. P < r *(K + L)”Randamentul antreprenorului
constructiv, ca parte a profitului”este mai mic decât zero : Pa < 0.
Varianta III. P < 0”Randamentul antreprenorului
constructiv, ca parte a profitului”este mai mic decât zero : Pa < 0.
VEN
ITU
RI R
RO
FIT
”Randamentulantreprenorului
constructiv, ca parte aprofitului”(Pa > 0)
”Randamentulantreprenorului
constructiv, ca parte aprofitului”(Pa < 0)
”Randamentulantreprenorului
constructiv, ca parte aprofitului”(Pa < 0)
Partea profitului caprodus al capitalului
(rentabilitateacapitalului)
(r *K)
Partea profitului caprodus al capitalului
(rentabilitateacapitalului)
(r *K)
Partea profitului caprodus al capitalului
(rentabilitateacapitalului)
(r *K)
VEN
ITU
RI R
RO
FIT
CH
ELTU
IELI PI
ERD
ERI
Partea profitului caprodus al muncii(eficienţa muncii)
(r *L)
Partea profitului caprodus al muncii(eficienţa muncii)
(r *L)
Partea profitului caprodus al muncii(eficienţa muncii)
(r *L)
CH
ELTU
IELI
CH
ELTU
IELI
VEN
ITU
RI
Fig. 1. Variantele evaluării mărimii indicelui ”randamentul antreprenorului constructiv, ca parte a profitului” /Fig. 1 The variants of the index size asset of “the efficiency of the constructive entrepreneur as part of the profit”
Sursa/ Source: Elaborat de autor /Elaborated by the author.
Dacă rentabilitatea capitalului este datoratăproprietarului, iar eficienţa muncii este datorată angajaţilor,atunci randamentul antreprenoriatului constructiv estemeritul antreprenorului constructiv. Desigur, la modgeneral, profitul final obţinut din activitatea antreprenorială
If the capital profitableness is due to the owner, and thework efficiency is due to the employees, then the efficiency ofthe constructive entrepreneurship is due to the constructiveentrepreneur. Of course, generally the final profit from theentrepreneurial activity belongs to the entrepreneur. But, by

Revistă teoretico-științifică / Theoretical and scientifical journal128
Nr. 3 / 2013
aparţine antreprenorului. Însă prin formula propusă deautor se poate distinge contribuţia directă şi personală pecare o asigură antreprenorul constructiv. Prin urmare sepoate determina nivelul de competenţe, adică cunoştinţele,capacităţile şi abilităţile profesionale ale actorului principalal antreprenoriatului constructiv.
În continuitatea ideilor expuse referitor la formula decalcul al indicelui ”randamentul antreprenorului constructiv,ca parte a profitului” şi reprezentării schematice a celor treivariante de evaluare, autorul prezintă un exemplu de calcul,în baza datelor convenţionale, pentru a explicita valoareaaportului personal al antreprenorului constructiv la formareaprofitului activităţii.
the author’s formula, we can see the direct and personalcontribution guaranteed by the constructive entrepreneur.Hence, it is possible to determine the competences’ level; itmeans the knowledge, the professional abilities of the mainactor from the constructive entrepreneurship.
In order to follow the sequence of the ideas regarding theindex calculation formula of “the efficiency of theconstructive entrepreneur as part of the profit” and of theschematic representation of the three asset variants, theauthor presents a calculation example, based on conventionaldata, in order to explain the value of the personalcontribution of the constructive entrepreneur at the activity’sprofit formation.
Tabelul 2/ Table 2Calcularea indicelui ”randamentul antreprenorului constructiv, ca parte a profitului”, în baza datelor
convenţionale/The index calculation of “the efficiency of the constructive entrepreneur as part of the profit”№ Indicatori /Indicators Datele indicatorilor/ Indicators data
Varianta I Varianta II Varianta III1 Profit (P), mii. lei/an /
Profit (P), thousands. lei/year80 40 -
2 Pierderi (-P), mii lei / Losses (-P), thousandslei
- - - 10
3 Capitalul (K), mii. lei / Capital (K),thousands. lei
350 350 350
4 Costul muncii (L), mii. Lei / Work cost (L),thousands. l
64 64 64
5 Coeficientul de corelaţie/ Correlationcoefficient
0,1 0,1 0,1
6 r* (K+L) = 0,1*(rd.3+rd.4) 41,4 41,4 41,47 Partea profitului ca produs al capitalului (Pk = r
*K = rd.5*rd.3), mii. lei/an / Part of the profitas product of the capital (Pk = r *K =rd.5*rd.3), thousands. lei/year
35(44% a profitului/ of
the profit)
35(88% a profitului/ of
the profit)
35
8 Partea profitului ca produs al muncii (Pl=r*L= rd.5*rd.4), mii. lei/an/ Part of the profit aswork product (Pl=r *L= rd.5*rd.4), thousands.lei/year
6,4(8% a profitului)
6,4(16% a profitului)
6,4
9 Randamentul antreprenorului constructiv, caparte a profitului [Pa = (P – Pk – Pl) = (rd.1– rd.7 – rd.8)], mii. lei / The efficiency of theconstructive entrepreneur as part of the profit [Pa= (P – Pk – Pl) = (rd.1 – rd.7 – rd.8)], thousands.Lei
38,6(48% a profitului /
of the profit)
-1,4(-4% a profitului/ of
the profit)
-51,4
10 Capitalul antreprenorului constructiv [A=(Pa/r) = (rd.9/rd.6)], mii. lei / The capital ofthe constructive entrepreneur [A= (Pa/r) =(rd.9/rd.6)], thousands. Lei
386 -14 -514
Sursa: Elaborat de autor / Source: Elaborated by the author.
După cum se observă din Tabelul 2, indicele”randamentul antreprenorului” poate avea semnificaţienegativă. Dar poate fi trasă încă o concluzie dinTabelul 2:
prin indicele ”randamentul antreprenoruluiconstructiv, ca parte a profitului ” se poate calcula unindice absolut nou – ”capitalul antreprenorului constructiv”care de rând cu capitalul fizic şi capitalul uman (costulmuncii) caracterizează activitatea întreprinderii.
As we can see from the Table 2, the index of the“entrepreneur’s efficiency” can have negative meaning. Butwe can conclude also one thing from the Table 2:
By the index “the efficiency of the constructiveentrepreneur as part of the profit”, it is possible to calculate anabsolutely new index – “the capital of the constructiveentrepreneur”, which together with physical capital andhuman capital (work’s cost) characterizes the enterprise’sactivity.

ECONOMIE ŞI SOCIOLOGIE / ECONOMY AND SOCIOLOGY 129
Nr. 3 / 2013
-1 0 0 -5 0 0 5 0 1 0 0
Va r ia n ta I
Va r ia n ta II
Va r ia n ta II I
P ro f itu l (p ird e re a )în tre p re in d e r iiP ro f itu l a n tre p re n o ru lu i
P ro f itu l m u n c ii
P ro f itu l c a p ita lu lu i
Fig. 2. Corelaţia dintre profitul (pierderea) întreprinderii şi profitul capitalului, muncii şi al antreprenorului /Fig. 2 The correlation between the profit (losses) of the enterprise and the profit of the capital, work and
entrepreneurSursa: Elaborat de autor /Source: Elaborated by the author.
Calculul indicelui ”randamentul antreprenoruluiconstructiv, ca parte a profitului”, în baza datelorconvenţionale este prezentat în Figura 2, printr-un graficcare permite vizualizarea corelaţiei dintre profitul saupierderea întreprinderii înregistrate pentru un an degestiune şi profitul asigurat de prezenţa capitalului, amuncii şi a antreprenorului competent sau mai puţintalentat.
Pentru soluţionarea problemei privind mărirearezultatului activităţii antreprenorului, poate fi utilizat unindice indirect – ”competenţa antreprenorului”. Printermenul ”competenţă” se subînţelege cunoştinţele,capacităţile, abilităţile, deprinderile proprii antreprenoruluiconstructiv în iniţierea şi gestiunea activităţiiantreprenoriale. În acest context, autorul presupune că dacăvolumul cunoştinţelor, capacităţilor, abilităţilor,deprinderilor va creşte, atunci şi rezultatul va creşte. Dreptexemplu de competenţe ale antreprenorului se enumeră:
- capacitatea de a fi lider, gestionar, îndrumător;- capacitatea de a petrece şedinţe, negocieri;- capacitatea de a face o prezentare;- posedarea tehnicii de a realiza tratative şi
convorbiri;- posedarea rapidă a computerului şi a tehnicii de
lucru;- deprinderi de gândire raţională şi vorbire coerentă;- erudiţie profesională;- capacitate de a munci, flexibilitate, hotărâre,
succesivitate, insistenţă, responsabilitate, sociabilitate şialtele.
Competenţele enumerate pot fi măsurate prinintermediul testelor sau prin alte metode. Aşadar, se poatedetermina nivelul atins de competenţe şi competenţele pecare nu le posedă antreprenorul şi care în ultimă instanţă vada posibilitate de a ridica competenţele antreprenoruluiîntreprinderii. Însă şi acest indice are lacune :
- În primul rând, prin metodele existente deevaluare a nivelului competenţelor se pot comite unelegreşeli.
- În al doilea rând, acest indice măsoară rezultatul
The index calculation of the efficiency of theconstructive entrepreneur as part of the profit”, based onconventional data, is presented in the Figure 2 by a graphwhich allows the possibility to see the correlation betweenthe profit or the loss of the registered enterprise for a yearmanagement and for the profit guaranteed by the presenceof the capital, of the work and of the competententrepreneur or less talented.
In order to solve the problem regarding theincrease of the entrepreneur’s activity result, it can be usedan indirect index – “the entrepreneur’s competence”. Bythe term “competence”, we understand the knowledge, thecapacities and the abilities specific to the constructiveentrepreneur for the initiation and the management of theentrepreneurial activity. That is why, the author supposes,if the volume of the knowledge, capacities and abilitiesgrows, then the result will grow also. As example ofentrepreneur’s competences are:
- the capacity to be a leader, a manager, a guide;- the capacity to organize sessions, negotiations;- the capacity to make a presentation;- the ability to negotiate and have a discussion;- computer knowledge and quick work technique;- the ability to think rationally and to have a
coherent speech;- professional erudition;- the capacity to work, flexibility, decision,
sequence, insistence, responsibility, sociability and others.The listed competences can be measured through tests
or other methods. Thus, it is possible to determine the levelattained by the competences and which competences do notpossess the entrepreneur, and this fact will make possible toraise the competences of the enterprise’s entrepreneur. Butthis index has gaps also:
- First of all, by the existent methods ofcompetences level assessment, mistakes are committed;
- Secondly, this index measures only directly theresult of the entrepreneurs. Therefore, it cannot be used inthe results’ comparison of the entrepreneurs from differententerprises.
Revistă teoretico-științifică / Theoretical and scientifical journal130
Nr. 3 / 2013
antreprenorilor doar indirect. De aceea, nu se poate utilizala compararea rezultatelor antreprenorilor din diferiteîntreprinderi.
- În al treilea rând, acest indice se poate diviza înmai mulţi subindici, în funcţie de tipul competenţei, adicănu este complex. Această dificultate poate fi depăşită prinutilizarea metodicii de elaborare a aşa-numitului ”profil alcompetenţei”, când unele abilităţi şi deprinderi pot fiincluse într-un indice integru.
- În al patrulea rând, indicele ”competenţă” măsoarăpotenţialul antreprenorului, dar nu este clar cum este folosităaceastă competenţă de către un antreprenor în practică.
Aceste lacune îi sunt proprii şi indicelui normă/orăa activităţii antreprenorului. Actualmente, acest indice sefoloseşte la planificarea şi evaluarea muncii reglatorilor,programatorilor, consultanţilor pentru problemele degestiune, profesorilor universitari şi altora.
În opinia autorului, pentru planificarea şi evidenţaactivităţii, potenţialului antreprenorului şi produsuluimuncii lui trebuie utilizat indicele normă/oră. Fiecareantreprenor care se ocupă de planificare, evidenţă,activitate în regim de autogestiune este examinat de autorca o structură producătoare de norme/oră. Antreprenorulare potenţial exprimat în normă/oră şi munca îndeplinită semăsoară în normă/oră. În cadrul muncii îndeplinite,antreprenorul cheltuie om/ore (ore astronomice ale vieţiilui) şi produce normă/ore de produse (probleme de gestiunesoluţionate). Pentru claritate autorul concretizează: om/orăsunt orele care pot fi măsurate cu cronometrul(secundometrul). Normă/oră este unitatea convenţională detimp prin care se măsoară volumul de lucru [4, p.78].
Indicele normă/oră poate fi folosit, deoarece potenţialulde productivitate a fiecărui om este diferit. Adică, om/oră afiecărui specialist are un randament de producere diferit,deoarece randamentul depinde de tipul personalităţii, destudii, experienţă, talent şi de alte calităţi ale unei persoaneconcrete. Mai mult, randamentul om/oră al unui lucrătorpoate fi diferit în diferite perioade ale vieţii lui.
Orice produs al activităţii (produsul muncii) poate fimăsurat în normă/oră, adică în orele cheltuite pentru acestprodus de un lucrător normal în condiţii normale de muncă.Într-o om/oră, un lucrător concret poate îndeplini mai multsau mai puţin de o normă/oră. Se ştie că productivitateamuncii a diferiţilor programatori care lucrează într-oorganizaţie poate fi diferită chiar de zece şi mai multe ori.Şi încă mai mult se deosebeşte rezultatul lucrătorilor decreaţie (scriitori, compozitori, pictori, savanţi, conducători).Măsurând problemele în normă/ore, se poate compararezultatele activităţii antreprenorului de ieri şi de azi, sepoate compara rezultatul muncii diferiţilor antreprenori. Înacest context, apare întrebarea: cum se planificănormele/oră ale volumului de lucru şi problemele activităţiide antreprenoriat, de exemplu, pentru o săptămână. Laaceastă întrebare pot fi date mai multe răspunsuri:
a) în baza normativelor volumului de lucru alactivităţilor de gestiune;
b) prin intermediul normării microelementare;c) prin intermediul acordurilor antreprenor-executor;d) prin intermediul planificării volumului de muncă de
către antreprenor.Prima variantă este imposibilă, deoarece munca
- The third, this index can divide in more sub-indexes, according to the competence, so it is not complex.This difficulty can be overcame by the use of elaborationmethodology of so-called “competence’s profile”, whensome abilities and skills can be included in one index.
- The fourth, the index “competence” measure theentrepreneur’s potential, but how it is used by theentrepreneur in practice, it is an unknown fact.
These gaps are specific also for the indexquota/hour of the entrepreneur’s activity. Actually, thisindex is used in planning and assessment of the setters’work, programmers, management advisers, professors andothers.
According to the author’s mind, for the planning andactivity’s account, it is necessary to use the indexquota/hour in order to determine the entrepreneur’spotential and his work’s product. Each entrepreneur, whodeals with planning, accounting and activity in auto-management way, it is examined by the author as astructure producing quotas/hour. The entrepreneur has thepotential expressed in quota/hour and the workaccomplished in quotas/hour. For the accomplished work,the entrepreneur spends man/hour (astronomical hours ofhis life) and produces quota/hour products (managementproblems solved). For more clarity, the author concretes:man/hours are hours which can be measured with thechronometer. Quota/hour is the conventional unit of timeby which it is measured work volume [4, p.78].
The index quota/hour can be used, because theproductivity potential of each human being is different.That means, man/hour of each specialist has differentproduction efficiency, forasmuch the efficiency depends onpersonality, studies, experience, talent and other qualitiesof a concrete person. More than that, the efficiencyman/hour of a worker can be different in different periodsof his life.
Each activity product (work product) can be measuredin quota/hour, it means the spent hours for this product by anormal worker in normal work conditions. In a man/hour, aconcrete worker can accomplish more or less of aquota/hour. It is known that the work productivity ofdifferent programmers who work in an organization can bedifferent tenfold or more. And it is much more different theresult of the creation workers (writers, composers, painters,scientists, leaders). If to measure the problems inquota/hour, it is possible to compare the results of theyesterday and today entrepreneur’s activity and the workresults of different entrepreneurs. Therefore, the followingquestion appears: how is it planned the quotas/hour of thework volume and the entrepreneurship activity problemsfor a week? There are some answers to this question:
a) On regulations of the work volume of managementactivities;
b)Through micro-elementary standardization;c) Through agreements entrepreneur-executor;d)Through the work volume planning by the
entrepreneur.The first variant is impossible, because the
entrepreneur’s work means a lot of problems and activities.Thus, the author is convinced that it is not possible thestandardization of the work volume and management

ECONOMIE ŞI SOCIOLOGIE / ECONOMY AND SOCIOLOGY 131
Nr. 3 / 2013
antreprenorului înseamnă o mulţime de probleme şiactivităţi. Aşadar, autorul este convins că nu este posibilănormarea volumului de lucru şi a problemelor de gestiune.
A doua variantă este relevantă în activitatea de gestiunea antreprenorului, deoarece normarea microelementară estefolosită astăzi pentru determinarea volumului de lucru încadrul aşa-numitului sistem de asigurare cu documente ainiţierii şi gestiunii întreprinderii. Normativele permit acalcula volumul de lucru (om/oră), al pregătirii proiectelorde documente, perfectarea şi emiterea lor; volumul de lucruprivind propunerile, plângerile, cererile lucrătorilor;volumul dactilografelor, tirajării şi înregistrăriidocumentelor etc.
Varianta a treia şi a patra sunt şi ele indicate pentrudeterminarea volumului de muncă şi a problemelorîndeplinite de antreprenor. Determinarea volumului delucru (în normă/ore) în pereche antreprenor-executor estereală şi practică, deşi trebuie de recunoscut că acestemetode sunt supuse riscului de voluntariat.
Indicele normă/oră poate fi folosit la planificarea şievidenţa lucrului îndeplinit de antreprenor. Prin urmare,poate fi folosit şi la gestiunea rezultatelor activităţiiantreprenorilor. Cu alte cuvinte, indicele normă/oră permitea pune şi a ridica problema rezultatului activităţiiantreprenorului constructiv, temă care a fost abordată încadrul acestei cercetări.
În demersul cercetării, problema privind ridicareaeficienţei gestiunii activităţii de antreprenoriat rezidă înmărirea rezultatului muncii antreprenorilor pentru ca parteastângă a diagramei ”Pierderi (cheltuieli) din cauzalacunelor antreprenorului” din Figura 2 să fie cât maiaproape de zero şi să tindă spre creştere. Aşadar, apareproblema măririi rezultatului eficienţei munciiantreprenorilor. O problemă serioasă care poate avea maimulte direcţii cum ar fi :
dezvoltarea competenţelor; ridicarea calităţii deciziilor luate; perfecţionarea stilului şi metodelor de gestiune; perfecţionarea tehnicii proprii de muncă; implementarea tehnologiilor informaţionale; tehnologizarea gestiunii; implementarea tehnologiilor eficiente de
planificare şi evidenţă a activităţii manageriale aantreprenorului constructiv.
Concluzie. Autorul consideră implementareainovaţiilor de gestiune a activităţii de antreprenoriat nu caproblemă şi scheme aparte, dar ca tehnologii contemporanede gestiune care pot ridica semnificativ rezultatul activităţiiantreprenorilor, mai întâi, datorită reglementării severe aproceselor de gestiune şi instaurării ordinii. Autorul susţinecă, după cum tehnologiile avansate de producţie ridicăproductivitatea întreprinderii, tot aşa şi tehnologiile degestiune ridică foarte mult productivitatea antreprenorilorîn cadrul activităţii lor. Tehnologia planificării şi evidenţeiactivităţii manageriale a anrteprenorului constructiv, înprimul rând, economiseşte timpul, sporeşte gradul deorganizare a activităţii de antreprenoriat. Aceasta duce lamărirea productivităţii activităţii antreprenoruluiconstructiv. Ceea ce va încerca autorul să demonstreze încontinuarea cercetării asupra temei date.
Cercetarea personificată a antreprenoriatului constructiv
problems.The second variant is more relevant in the
management activity of the entrepreneur, because themicro-elementary standardization is used today in order todetermine the work volume within so-called guaranteesystem with documents for the initiation and enterprise’smanagement. The regulations allow to calculate the workvolume (man/hour) of preparation of documents projects,their completing and issuing; the work volume concerningthe proposals, complaints, workers demands; typistsvolume, duplicating and recording documents, etc.
The third and the fourth variant, they indicate also thework volume determination and the problemsaccomplished by the entrepreneur. The determination of thework volume (in quota/hour) in pair entrepreneur-executoris real and practical, but it is necessary to admit that thesemethods are submitted to the voluntary risk.
The index quota/hour can be used in the planning andthe accounting of the accomplished work by theentrepreneur. Hence, it can be used in the management ofthe entrepreneurs’ activity results. In other words, the indexquota/hour allows to put and to raise the result problem ofthe constructive entrepreneur’s activity, subject analyzed inthis research.
During the research, the problem concerning themanagement efficiency raise of the entrepreneurship’sactivity lies in growth’s result of the entrepreneurs’ work inthe way that the left side of the diagram “Losses(expenditures) because of the entrepreneur’s gaps” fromFigure 2 to be closer to zero and to strive for growth. So, itappears the problem of the result growth of entrepreneurs’work efficiency. A serious problem, which can have moredirections like:
Competences development; Quality raise of the made decisions; Style and management methods improvement; Improvement of the own work technique; Informational technologies implementation; A technologized management; Implementing efficient technologies of planning and
accounting the managerial activity of the constructiveentrepreneur.
Conclusions. The authors considers theimplementation of the management innovations in theentrepreneurship’s activity not as a problem and schemeseparately, but as modern management technologies, whichwill increase significantly the result of the entrepreneurs’activity, first of all, due to the severe regulation of themanagement processes and order establishment. The authorsustains that as the advanced technologies raise theenterprise productivity, so the management technologiesraise a lot the entrepreneurs’ activity within their activity.The planning technology and the managerial activityaccount of the constructive entrepreneur, first of all, savethe time, enhance the organization degree of theentrepreneurship’s activity. This fact leads to theproductivity increase of the constructive entrepreneur’sactivity. The author will try to demonstrate this subject inthe following research.
The personified research of the constructiveentrepreneur created the possibility to the author to
Revistă teoretico-științifică / Theoretical and scientifical journal132
Nr. 3 / 2013
a creat posibilitate autorului de a elabora metode de evaluarea rezultatului activităţii antreprenorului constructiv în bazaurmătorilor indici: produsul antreprenorului constructivexprimat în cost, randamentul antreprenorului constructiv caparte a profitului, competenţa antreprenorului constructiv,produsul antreprenorului constructiv în normă/oră. În final,autorul conchide că problema privind ridicarea eficienţeigestiunii activităţii de antreprenoriat rezidă în mărirearezultatului muncii antreprenorilor, iar căile de eficientizaresunt direcţionate spre: dezvoltarea competenţelor, ridicareacalităţii deciziilor luate, perfecţionarea stilului şi metodelorde gestiune, perfecţionarea tehnicii proprii de muncă,implementarea tehnologiilor informaţionale, tehnologizareagestiunii, implementarea tehnologiilor eficiente deplanificare şi evidenţă a activităţii manageriale aantreprenorului constructiv.
elaborate assessment methods of the constructiveentrepreneur’s result, on the following indexes: the productof the constructive entrepreneur expressed in cost, theconstructive entrepreneur’s efficiency, as part of the profit,the competence of the constructive entrepreneur, theproduct of the constructive entrepreneur in quota/hour.Finally, the author concludes that the problem regardingthe efficiency raise of the entrepreneurship activity’smanagement consists of increase of entrepreneurs workresult, and the efficiency ways are directed to: competencesdevelopment, quality raise of the made decisions, style andmanagement methods improvement, improvement of theown work technique, implementation of the informationaltechnologies, implementing efficient technologies ofplanning and accounting the managerial activity of theconstructive entrepreneur.
Referinţe bibliografice / References1. BENESCU, M.A. Activitatea de compunere şi rezolvare a problemelor de matematică. Caracal: Hoffman, 2012.
340 p.2. GHIC, G., Mihăilă, M.J. Matematică aplicată în economie: manual de studiu individual. Bucureşti: Pro Universitaria,
2012. 304 p.3. GILBERT, A., CHURCHILL, Jr. Marketing Research: Methodological Foundations. New York: The Dryden Press,
1999. 1017 p.4. MATIŞ, D. et al. Statistici privind indicatori utili analizei economice şi evaluării proprietăţilor. Cluj-Napoca: Ed.
Grinta, 2012. 162 p. ISBN 978-973-126-361-85. VINTILĂ, G. Diagnosticul financiar şi evaluarea întreprinderii. Bucureşti: Ed. Didactică şi Pedagogică, 1998. 312 p.
Recomandat spre publicare: 11.06.2013

ECONOMIE ŞI SOCIOLOGIE / ECONOMY AND SOCIOLOGY 133
Nr. 3 / 2013
PERSPECTIVELE DEZVOLTĂRII ECONOMIEIMONDIALE ÎN PERIOADA POST-CRIZĂ
ŞI DE CREŞTERE ECONOMICĂ
WORLD ECONOMIC PERSPECTIVESIN THE POST-CRISIS AND ECONOMIC
GROWTH PERIODS
Oleg CEBOTARI, drd., USMAlexandru GRIBINCEA, dr.hab., prof.univ., USM
Oleg CEBOTARI, PhD student, USMAlexandru GRIBINCEA, PhD, Professor, USM
Economia mondială este în pragul unei alte recesiunimajore, precum a fost anunţat în raportul de anul trecut,economia mondială a slăbit considerabil în 2012. Unnumăr tot mai mare de ţări dezvoltate au căzut din nouîntr-o recesiune dublă, în special în Europa, în timp ce ceicare se confruntă cu o datorie, economie non-viabilă s-auscufundat mai adânc în recesiune. Multe ţări dezvoltatesunt prinse într-o spirală descendentă de consolidare, cușomaj ridicat, o cerere la nivel mondial slab exacerbat deausteritate fiscală, datoria publică ridicată și un sistemfinanciar încă fragil.
Dificultăţi economice în ţările dezvoltate, de asemenea,afectează ţările în curs de dezvoltare și economiile întranziţie prin exporturi slabe și volatilitatea crescută afluxurilor de capital și a preţurilor materiilor prime.Economiile în curs de dezvoltare mari, cu toate acestea, seconfruntă, cu probleme interne, iar unele ţări, printre careChina, se confruntă cu o scăderea investiţiilor, finanţareaconstrângerii care rezultă în unele sectoare ale economieiși capacitatea de exces de producţie în altă parte. Cele maimulte ţări cu venituri mici au fost până în prezent relativrezistente la încetinirea creșterii economice în ţăriledezvoltate și cu venit mediu, dar acum sunt afectate deintensificarea impactului negativ. Perspectivele pentruurmătorii doi ani sunt pline de provocări, incertitudini șiriscuri cu care se confruntă. Creșterea produsuluibrut mondial (WGP) este de așteptat să ajungă la 2,2 lasută în 2012 și rămâne cu mult sub potenţial, la 2,4la sută în 2013 și 3,2 la sută în 2014. În acest ritm moderat,multe economii vor fi în imposibilitatea de a recuperapierderile severe de locuri de muncă în timpul "MariiRecesiuni".
Cuvinte cheie: economie mondială, recesiune,dezvoltare, creştere economică, post-criza.
L’économie mondiale est au bord d’un nouveauralentissement majeur Comme annoncé dans le rapport del’année dernière, l’économie mondiale s’est considérablementaffaiblie en 2012. Un nombre croissant de pays développéssont retombés dans une récession à double creux, notammenten Europe, tandis que ceux faisant face à un surendettementnon-viable ont sombré encore plus profondément dans larécession. De nombreux pays développés sont pris dans unespirale descendante se renforçant grâce à un chômage élevé,une faiblesse de la demande globale exacerbée par l’austéritébudgétaire, un endettement public élevé et un systèmefinancier toujours fragile.
Les difficultés économiques des pays développés affectentégalement les pays en développement et les économies entransition à travers l’affaiblissement de leurs exportations etla volatilité accrue des flux de capitaux et des prix desmatières premières. Les grandes économies en développementsont cependant également confrontées à des problèmesintérieurs, et certains pays dont la Chine font face un déclindes investissements, résultant des contraintes de financementdans certains secteurs de l’économie et d’une capacité deproduction excédentaire ailleurs. La plupart des pays à faiblerevenu ont jusqu’ici relativement bien résisté auralentissement économique des pays développés et à revenuintermédiaire, mais sont à présent aussi affectés parl’intensification des retombées négatives. Les perspectivespour les deux prochaines années sont pleines de défis,d’incertitudes et les risques orientés vers la baisse. Lacroissance du produit mondial brut (PMB) devrait atteindre2,2 pour cent en 2012 et rester bien en deçà de son potentiel à2,4 pour cent en 2013 et 3,2 pour cent en 2014. A ce rythmemodéré, de nombreuses économies seront incapables derecouvrer les pertes sévères d’emplois subies durant la«grande récession».
Key words: global economy, recession, development,growth, post-crisis.
JEL Classification: F00, F43, F49
Economia globală se află la un pas de o altă recesiunemajoră. Potrivit raportului ONU, economia mondială adiminuat considerabil în anul 2012. Un număr tot mai mare deţări dezvoltate au suportat o recesiune profundă, care se repetă,în special, în Europa, în timp ce ţările care se confruntă cudatorii în exces au intensificat recesiunea. Majoritatea ţărilordezvoltate au constituit o spirală descendentă, sporind şomajul,moderând cererea la nivel mondial, exacerbată de austeritateafiscală, a datoriei publice înalte şi a sistemului financiar,deocamdată, fragil.
Dificultăţile economice din ţările dezvoltate afectează, deasemenea, ţările în curs de dezvoltare şi economiile în tranziţie,prin diminuarea exporturilor şi volatilitatea crescută afluxurilor de capital şi a preţurilor la materia primă. Marileeconomii emergente, de asemenea, se confruntă cu probleme
The global economy is one step away from anothermajor recession. According to the UN report, theworld economy has diminished considerably in 2012.A growing number of developed countries have suffered adeep and repeated recession, especially in Europe, ascountries facing excessive debt recession haveintensified. Most developed countries have been on adownward spiral, increased unemployment, moderatedglobal demand exacerbated by the fiscal austerity,high public debt and the financial system is yetfragile.
The economic problems in developed countries affectalso developing countries and transition economies, byreducing exports and increased volatility of capital flowsand prices of raw materials. Major emerging economies

Revistă teoretico-științifică / Theoretical and scientifical journal134
Nr. 3 / 2013
interne, iar unele ţări, inclusiv China, din cauza reduceriiinvestiţiilor, suportă constrângeri de finanţare în anumitesectoare ale economiei şi excesul capacităţii de producţie. Pânăîn prezent, majoritatea ţărilor cu venituri mici şi intermediareau rezistat relativ bine la încetinirea economică în ţăriledezvoltate, dar actualmente sunt afectate, de asemenea, deintensificarea impactului negativ. Perspectivele pentruurmătorii doi ani sunt marcate de provocări, incertitudini şiriscuri spre scădere.
Creşterea produsului mondial brut (PMB) a atins 2,2 lasută în anul 2012, indicând un nivel sub potenţial, în 2013 –2,4 la sută şi în 2014 va atinge 3,2 la sută (Fig.1). În acest ritmmoderat, multe economii nu vor putea recupera pierderileconsiderabile de locuri de muncă, suportate în timpul „MariiRecesiuni”.
also face internal problems and some countries, includingChina, through lower investment support fundingconstraints in certain sectors of the economy and excessproduction capacity. So far, most low-income andintermediate countries resisted relatively well in theeconomic downturn, but currently are also affected by theincreasing negative impact. The outlook for the next twoyears is marked by challenges, uncertainties and risks offailure.
Increased gross world product ( PMB ) reached2.2 percent in 2012, indicating a level below potential in2013 to 2.4 percent, and in 2014 to 3.2 percent -(Fig. 1). Many moderate economies will not recoversignificant job losses incurred during the „GreatDepression.”
Fig. 1. Perspectives in a weak and uncertain global economyFig. 1. Perspective slabe şi incerte în economia mondială
Sursa/ Source: Raportul ONU, 2013, www. un.org /UN Report, 2013, www.un.org
Criza mondială continuă a locurilor de muncăRata şomajului rămâne la un nivel înalt în întreaga
lume, în special în ţările dezvoltate şi în Europa, undesituaţia este mult mai dificilă. Rata şomajului a fost încreştere continuă, atingând în anul 2012 un nivel record deaproximativ 12 la sută în zona euro, o creştere cu peste unpunct faţă de anul precedent. Îndeosebi, situaţia a degradatîn Grecia şi Spania, unde peste un sfert din forţa de muncăsunt şomeri. Doar câteva ţări, precum: Austria, Germania,Luxemburg şi Olanda, indică o rată scăzută a şomajului deaproximativ 5 la sută. Rata şomajului din Europa Centralăşi de Est a crescut neînsemnat, în anul 2012, ca urmare aausterităţii fiscale. În Japonia mai puţin de 5 la sută demuncitori sunt şomeri. În Statele Unite, rata şomajului ascăzut sub pragul de 8 la sută începând cu luna septembrie2013.
Totodată, proporţia şomajului pe termen lung (peste unan) în ţările dezvoltate a depăşit 35 la sută în iulie 2012afectând aproximativ 17 milioane de lucrători. O astfel decreştere a duratei de şomaj cauzează consecinţe negativesemnificative şi de durată atât pentru lucrătorii care aupierdut locul de muncă, cât şi economiei în ansamblu.
Liderii din ţările dezvoltate trebuie să includă înpriorităţile principale pentru anul viitor crearea unui numărmai mare de locuri de muncă viabile pe termen lung. Dacăcreşterea economică în ţările dezvoltate se va menţine lentă,precum prevede scenariul de referinţă, rata ocupării forţeide muncă în aceste ţări nu va reveni la pre-criză până dupăanul 2016 (Fig. 2).
The continuing global crisis of unemploymentUnemployment remains at a high level throughout the
world, especially in developed countries and also inEurope, where the situation is more difficult.Unemployment was still rising, reaching, in 2012, arecord of 12 percent in the euro area increased by morethan one point from the previous year. In particular, thesituation has worsened in Greece and Spain, where morethan a quarter of the workforce are unemployed. Only afew countries, such as Austria, Germany, Luxembourgand the Netherlands, indicate a low unemployment rate ofaround 5 percent. Unemployment in Central and EasternEurope increased insignificantly in 2012 due to fiscalausterity. In Japan, less than 5 percent of workers areunemployed. In the U.S., the unemployment rate fellbelow 8 percent since September 2013.
However, the proportion of long-term unemployment(over one year) in developed countries has exceeded 35percent in July 2012, therefore affecting about 17 millionworkers. Such an increase in the duration ofunemployment causes significant and lasting negativeconsequences for both workers who have lost their jobsand the overall economy.
For the next year, the leaders of developed countriesshould include in their main priorities the creation of moreviable jobs in the long term. If economic growth indeveloped countries will remain slow and provide a baselinerate of employment, in these countries the economy will notreturn to pre -crisis until after 2016 (Fig. 2).

ECONOMIE ŞI SOCIOLOGIE / ECONOMY AND SOCIOLOGY 135
Nr. 3 / 2013
Fig. 2. Criza continuă a locurilor de muncă în Europa şi SUAFig. 2. The jobs’ crisis continues in Europe and the U.S.
Sursa/Source: Raportul ONU, 2013, www. un.org /UN Report, 2013, www. un.org
Situaţia ocupării forţei de muncă variază considerabil înţările în curs de dezvoltare. În majoritatea economiilor din Asiade Est şi America Latină rata şomajului a coborât sub nivelul dedinaintea crizei financiare globale.
Încetinirea ritmului de creştere, la sfârşitul anului 2011 şi în2012, nu a condus spre o creştere notabilă a ratei şomajului înaceste două regiuni, un aspect care poate fi interpretat pozitiv, cucondiţia ca şomajul, în general, să nu crească decât cu întârziere,din cauza unui declin economic. În cazul în care creştereaeconomică va continua declinul, rata şomajului ar putea creşte înmod semnificativ. În Africa, în pofida creşterii produsului internbrut (PIB) relativ puternic, ocuparea forţei de muncă rămâne oproblemă majoră pe continent, atât în ceea ce priveşte numărul,cât şi calitatea locurilor de muncă. Crearea locurilor de muncă decalitate este, de asemenea, o provocare comună pentru toateţările în curs de dezvoltare. Raportul precar al muncitorilor săracişi a celor care sunt încadraţi în câmpul muncii în sectorulinformal continuă să crească. În plus, şomajul tinerilor şidezavantajele femeilor la angajare rămân preocupări sociale şieconomice importante în multe ţări în dezvoltare.
Reducerea sărăciei şi progresul înregistrat spre alteObiective de Dezvoltare a Mileniului ar trebui să încetinească
Economia globală slabă şi vulnerabilitatea în ocuparea forţeide muncă în ţările în curs de dezvoltare împiedică eforturile dereducere a sărăciei şi limitează spaţiul bugetar necesar pentru ainvesti în educaţie, sănătate şi în alte domenii critice, pentru aaccelera progresul către realizarea Obiectivelor de Dezvoltare aMileniului (ODM). Acest lucru este valabil în special pentruţările mai puţin dezvoltate (TPD), care sunt extrem devulnerabile la şocurile preţurilor materiilor prime şi primesc ofinanţare externă şi asistenţă publică pentru dezvoltare (APD)mai reduse din cauza dificultăţilor şi austerităţii crescute în ţăriledonatoare.
Creşterea globală a emisiilor de gaze cu efect de serărămâne alarmantă
În paralel cu dezvoltarea economică lentă în ţăriledezvoltate, gazele cu efect de seră (GES) emise de ţările dinAnexa I a Protocolului de la Kyoto sunt estimate cu o diminuarede aproximativ 2 la sută anual în 2011 şi 2012. Această scăderecontrastează cu creşterea cu 3 la sută pe care aceste ţări au
The employment situation varies considerably indeveloping countries. In most economies in East Asia andLatin America, the unemployment rate fell below theusual level before the global financial crisis emerged.
Slowdown in late 2011 and in 2012 has not led to anoticeable increase in unemployment in these tworegions, an issue that can be interpreted positively,provided that unemployment generally does not increase,is only delayed due to an economic downturn. If growthcontinues to decline, the unemployment rate could risesignificantly. In Africa, despite the growth of grossdomestic product (GDP) being relatively strong,employment remains a major problem on the continent,both in terms of number and quality of jobs. Creatingquality jobs is also a common challenge for alldeveloping countries. Reports of poor and precariousworkers who are engaged in work in the informal sectorcontinues to grow. In addition, youth unemployment andemployment disadvantages women and economicconcerns remain important in many developing countries .
Poverty reduction and progress towards the otherMillennium Development Goals should slow down
Weak global economy and vulnerability inemployment in developing countries impede efforts toreduce poverty and limited fiscal space needed to investin education, health and other areas critical to accelerateprogress towards achieving the Millennium DevelopmentGoals (MDGs). This applies in particular to the leastdeveloped countries (LDCs), which are highly vulnerableto commodity price shocks and receive lower externalfunding and official development assistance (ODA) dueto the difficulties and increased austerity in donorcountries.
The overall increase in emissions of greenhousegases remains alarming
In parallel with the slow economic development indeveloped countries, greenhouse gases (GHG ) emitted byAnnex I countries of the Kyoto Protocol are estimatedwith a decrease of about 2 percent annually in 2011 and2012. This decrease contrasts with a 3 percent growth that
Revistă teoretico-științifică / Theoretical and scientifical journal136
Nr. 3 / 2013
parcurs-o în anul 2010, dar se alătură la declinul de 6 la sutăsurvenit în 2009, în rezultatul unei contracţii severe a PIB-uluicauzată de Marea Recesiune. Având în vedere creştereaeconomică globală slabă, emisiile din ţările din Anexa I ar trebuisă continue să scadă în 2013 şi 2014. Ţările din Anexa I au atinsobiectivul Protocolului de la Kyoto de a reduce emisiile cu celpuţin 5% în raport cu nivelurile din 1990 în perioada deangajament 2008-2012.
În acelaşi timp, emisiile de GES în multe ţări în curs dedezvoltare cresc cu un ritm rapid, iar comunitatea internaţionalăeste departe de a fi pe cale de a reduce emisiile în proporţiilenecesare, pentru a menţine concentraţia de bioxid de carbon(CO2) în atmosferă mai puţin de 450 părţi per milion (pentrustabilizarea schimbărilor climatice şi limitarea creşteriitemperaturii la 2°C în raport cu nivelul preindustrial). Pentru aevita depăşirea acestei limite, emisiile de GES trebuie reduse cu80 la sută până la jumătatea secolului al XXI-lea.
Potrivit ritmului actual, acesta este un obiectiv irealizabil.Modalităţi de creştere a ecologiei trebuie să fie găsite astăzi, deşiinvestiţiile solicitate pentru a realiza acest obiectiv sunt scumpe,care vor permite, de asemenea, relansarea creşterii pe termenscurt pentru corectarea unor dezechilibre internaţionale petermen mediu şi lung.
Inflaţia rămâne moderată în cele mai dezvoltate economii...Ratele inflaţiei rămân moderate în majoritatea economiilor
dezvoltate. Diferenţele semnificative în producţie şi presiunea dereducere a salariilor, în multe ţări, menţin anticipaţiileinflaţioniste la un nivel scăzut. În Statele Unite inflaţia a scăzutde la 3,1 la sută, în 2011, la aproximativ 2,0 la sută, în 2012, iaro nouă moderaţie este planificată pentru anul 2013. În zona euroinflaţia rămâne peste obiectivul de 2 la sută din băncile centrale.Inflaţia de bază, care exclude modificările de preţ aleelementelor volatile, cum ar fi energia, alimentele, alcoolul şitutunul, a fost mult mai slabă, de aproximativ 1,5 la sută, fărăsemne de presiune ascendentă. În 2013 se prevede ca inflaţia săscadă uşor, ca şi în noile state-membre ale Uniunii Europene(UE). În Japonia deflaţia continuă, în ciuda faptului, că bancacentrală a sporit obiectivul de inflaţie pentru a stimula aşteptărileinflaţioniste.
... şi este în scădere în majoritatea ţărilor în curs dedezvoltare
În anul 2012, inflaţia a scăzut în majoritatea ţărilor în curs dedezvoltare, dar rămâne la un nivel înalt în unele ţări. În anii 2013şi 2014 creşterea preconizată a preţurilor la alimente, la nivelmondial, cauzată de secetă în unele regiuni producătoare, nivelulridicat al preţurilor la petrol şi constrângerile privind oferta,specifice anumitor ţări, sunt în măsură să exercite presiuniascendente asupra inflaţiei din ţările în curs de dezvoltare. Înmulte ţări din Africa inflaţia a fost în scădere, dar rămâne a fiînaltă, de aproximativ 10 la sută în Angola, Nigeria ş.a. Sepreconizează ca inflaţia să rămână moderată în Asia de Est, fiindo provocare pentru majoritatea ţărilor din Asia de Sud-Est, underata medie a inflaţiei a fost de peste 11 la sută în 2012, cuposibilitatea de a rămâne peste 10 la sută în 2013 şi 2014.Totodată, inflaţia rămâne scăzută în majoritatea economiilor dinAsia de Vest, deşi este încă ridicată (peste 10 la sută) în Yemenşi foarte mare (30 la sută) în Republica Arabă Siriană. Ratainflaţiei în Caraibe şi America Latină, în general, se presupunecă va rămâne în jurul valorii de 6 la sută.
Comerţul internaţional şi preţurile materiei primeExpansiunea comerţului mondial de mărfuri – deceleraţie
these countries have traveled in 2010, but also joins thedecline of 6 percent occurred in 2009, as a result of asevere contraction in GDP caused by the Great Recession.Given the weak global economic growth, emissions inAnnex I countries should continue to decline in 2013 and2014. Annex I countries have achieved the KyotoProtocol to reduce emissions by at least 5 % compared tolevels in 1990 in the commitment period 2008-2012 .
At the same time, GHG emissions in manydeveloping countries grow at a rapid pace, and theinternational community is far from being on track toreduce emissions in the proportions necessary to maintainthe concentration of carbon dioxide (CO2) in theatmosphere less than 450 parts per million (to stabilizethe climate change and to limit the temperature increaseof 2° C compared to the pre-industrial level). To avoidexceeding this limit, GHG emissions must be reduced by80 percent by the middle of the XXI century.
According to the current pace, it is an unattainablegoal. Organic growing methods must be found today,though investment required to achieve this are expensive,but which will allow also renew growth in the short termand long term correction of international imbalances inthe medium.
Inflation remains moderate in most developedeconomies ...
Inflation rates remain moderate in most developedeconomies. Significant differences in production andpressure to reduce wages in many countries, thereforeinflation expectations remain low. In the U.S., inflationfell from 3.1 percent in 2011 to about 2.0 percent in 2012and a new moderation is planned for 2013. In the euroarea, inflation remains above the 2 percent of centralbanks. Core inflation, which excludes volatile pricechanges of items such as energy, food, alcohol andtobacco was much lower, about 1.5 percent, with no signsof any upward pressure. In 2013, it is expected thatinflation will decline slightly in the new member states ofthe European Union (EU). In Japan, deflation continues inspite of the fact that the central bank increased itsinflation target to boost inflation expectations.
... and is declining in most developing countriesIn 2012, inflation fell in most developing countries,
but remains at a high level in some countries. Between2013 and 2014, the projected increase in food pricesworldwide, caused by drought in some regions producingthe high level of oil prices and supply constraints specificto certain countries, which are able to exert upwardpressure on the inflation in developing countries. InAfrica, inflation has been declining in many countries, butremains high at 10 percent in Angola, Nigeria andelsewhere. Inflation is expected to remain moderate inEast Asia, and is a challenge for most countries inSoutheast Asia, where the average inflation rate was over11 percent in 2012, with the ability to remain above 10percent in 2013 and 2014. However, inflation remainslow in most Western economies in Asia, although it isstill high (over 10 percent) in Yemen and very high (30percent) in the Syrian Arab Republic. Inflation in theCaribbean and Latin America in general is expected toremain around 6 percent.

ECONOMIE ŞI SOCIOLOGIE / ECONOMY AND SOCIOLOGY 137
Nr. 3 / 2013
puternicăCreşterea comerţului mondial a încetinit pentru al doilea an
consecutiv, de la 12,6 la sută în 2010, la 6,4 la sută în 2011, şi3,2 la sută în 2012. Dezvoltarea economică globală slabă, înspecial în Europa şi în alte economii dezvoltate, este principalulfactor din spatele acestei încetiniri. În scenariul de bază,creşterea comerţului mondial va fi reluată moderat în 2013,înainte de a se apropia, în 2014, de rata de creştere pe termenlung, care este de 5 la sută. Cu toate acestea, ţările în curs dedezvoltare au rezistat mai bine la încetinirea economiei globale,iar importanţa acestora în comerţul internaţional este în creştere,parţial datorită integrării extinse în lanţurile valorilor globale.
Preţurile materiilor prime rămân ridicate şi volatilePreţurile mai multor materii prime au fost, de asemenea, mai
mari în 2012 comparativ cu cele din anul 2011, parcurgând maimulte episoade de volatilitate pronunţată. Conform punctuluimaxim atins în primul trimestru al anului în rezultatuloperaţiunilor de refinanţare pe termen lung, Banca CentralăEuropeană (BCE) a reînviat pentru scurt timp iluzia uneiredresări economice rapide, preţurile pentru majoritateamateriilor prime scăzînd nesemnificativ în al doilea trimestru.Preţurile produselor alimentare şi petrolului în unele ţări aurămas mari în al treilea trimestru din cauza unor fenomenemeteorologice nefavorabile şi a creşterii tensiunilor sociale dinOrientul Mijlociu. În schimb, preţurile la minerale, metale şiminereuri au continuat să se reducă, datorită activităţii slabe aeconomiei globale. Exportatorii de materii prime, care aubeneficiat de ameliorare a termenelor de schimb în ultimii ani,rămân expuşi la presiuni descendente asupra preţurilor. Într-uncontext de lichiditate abundentă, speculaţia financiară şidezvoltarea de produse noi, susţinute de materii prime, probabil,vor creşte în continuare volatilitatea pe pieţele produselor dematerii prime. Preţurile la produsele alimentare sunt prevăzute afi moderate odată cu scăderea cererii la nivel mondial, atât timpcât condiţiile meteorologice nu au devenit comparativ mainefavorabile. Cu toate acestea, având în vedere că pieţele suntextrem de constrânse şi stocurile de utilizare sunt foarte scăzutepentru cele mai multe alimente de bază, chiar şi şocurile mici dealimentare ar putea provoca noi creşteri de preţ.
Extinderea comerţului cu servicii sporeşte emisiile globalede gaze cu efect de seră
Recuperarea puternică a comerţului cu servicii,experimentată în toate regiunile şi grupurile de ţări în 2010, aînceput să diminueze în ultimul trimestru al anului 2011.Totodată, sectorul financiar s-a redus în unele ţări dezvoltate,fiind sectoare cu emisii ridicate de carbon, de exemplu,transportul şi turismul continuă să crească în ţările în curs dedezvoltare. Serviciile transportului de mărfuri sporesccontinuu odată cu extinderea prin intermediul lanţurilorvalorice globale. Extinderea transportului de mărfuri este, cusiguranţă, o sursă importantă de venituri de schimb valutar, înspecial pentru unele ţări în curs de dezvoltare, dar în principalcontribuie, în mod semnificativ, la emisiile mondiale de CO2(Fig. 3).
International trade and commodity pricesExpansion of world trade in goods - strong
decelerationWorld trade growth slowed a decrease for the second
consecutive year, from 12.6 percent in 2010 to 6.4 percentin 2011 and 3.2 percent in 2012. Weak global economicdevelopment, particularly in Europe and other developedeconomies is the main factor behind the slowdown. In thebaseline scenario, world trade will resume moderategrowth in 2013, before approaching the long-term growthrate in 2014, which is 5 percent. However, developingcountries have resisted better in a slowing globaleconomy and their importance in international trade isincreasing, partly due to extensive integration in globalvalue chains.
Commodity prices remain high and volatilePrices of many materials were also higher in 2012
compared to those of 2011, covering several highlyvolatile episodes. Accordingly peaking in the first quarter,as a result of long-term refinancing operations, theEuropean Central Bank (ECB) has revived briefly theillusion of a quick economic recovery, prices for mostcommodities felling slightly in the second quarter. Foodand oil prices in some countries have remained high in thethird quarter due to adverse weather conditions andincreased tensions in the Middle East. In contrast, pricesof minerals, metals and ores continued to decline due toweak global economic activity. Exporters of rawmaterials, which benefited from improved terms of tradein recent years, remain exposed to downward pressure onprices. In a context of abundant liquidity, financialspeculation and new product development, supported byraw materials will probably further increase volatility incommodity markets and products. Food prices areexpected to be moderate with a decrease in globaldemand, as long as weather conditions have becomecomparatively unfavorable. However, given that marketsare highly constrained and stocks are of very low usage,for most basic foods, even small shocks may cause furtherincreases in food prices.
Expanding trade in services increases globalemissions of greenhouse
Strong recovery of trade and services, experienced inall regions and groups of countries in 2010, began todiminish in the last quarter of 2011. However, thefinancial sector has decreased in some developedcountries, the sectors with high carbon emissions, forexample, transport and tourism continue to grow indeveloping countries. Freight services increasecontinuously with the expansion through global valuechains. Extension of the carriage of goods is certainly animportant source of foreign exchange earnings, especiallyfor some developing countries, but mainly contributessignificantly to global emissions of CO2 ( Fig. 3).
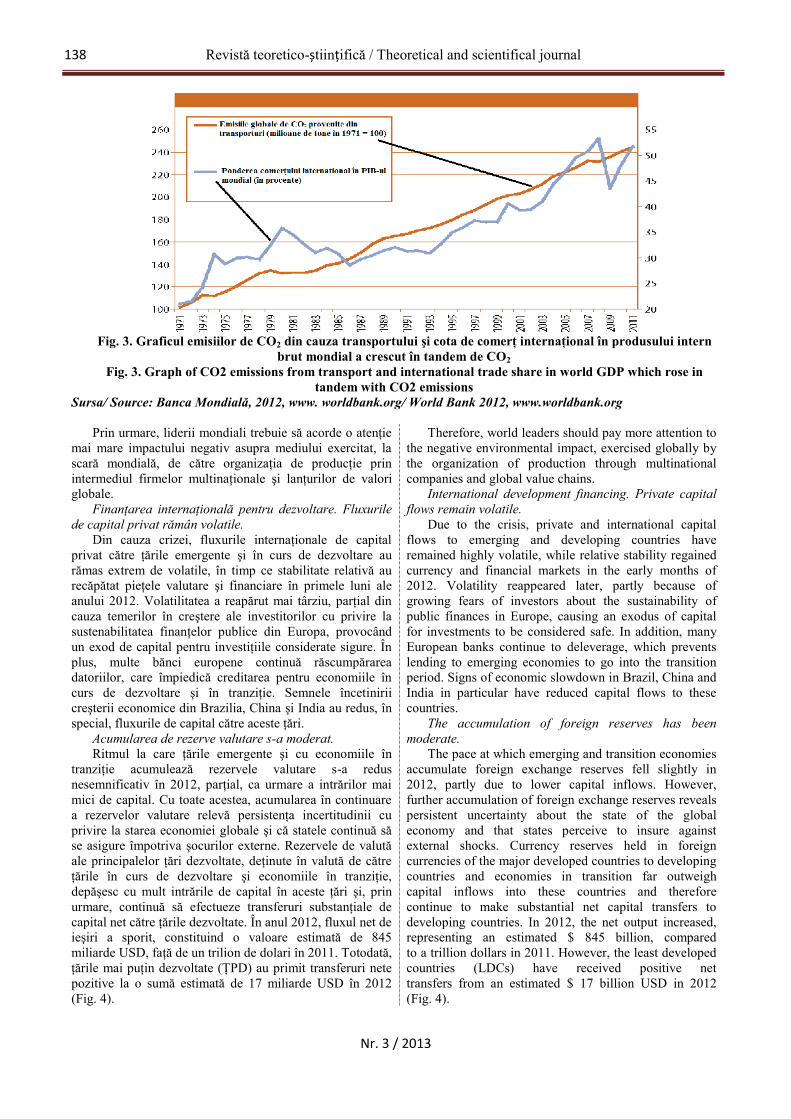
Revistă teoretico-științifică / Theoretical and scientifical journal138
Nr. 3 / 2013
Fig. 3. Graficul emisiilor de CO2 din cauza transportului şi cota de comerţ internaţional în produsului internbrut mondial a crescut în tandem de CO2
Fig. 3. Graph of CO2 emissions from transport and international trade share in world GDP which rose intandem with CO2 emissions
Sursa/ Source: Banca Mondială, 2012, www. worldbank.org/ World Bank 2012, www.worldbank.org
Prin urmare, liderii mondiali trebuie să acorde o atenţiemai mare impactului negativ asupra mediului exercitat, lascară mondială, de către organizaţia de producţie prinintermediul firmelor multinaţionale şi lanţurilor de valoriglobale.
Finanţarea internaţională pentru dezvoltare. Fluxurilede capital privat rămân volatile.
Din cauza crizei, fluxurile internaţionale de capitalprivat către ţările emergente şi în curs de dezvoltare aurămas extrem de volatile, în timp ce stabilitate relativă aurecăpătat pieţele valutare şi financiare în primele luni aleanului 2012. Volatilitatea a reapărut mai târziu, parţial dincauza temerilor în creştere ale investitorilor cu privire lasustenabilitatea finanţelor publice din Europa, provocândun exod de capital pentru investiţiile considerate sigure. Înplus, multe bănci europene continuă răscumpărareadatoriilor, care împiedică creditarea pentru economiile încurs de dezvoltare şi în tranziţie. Semnele încetiniriicreşterii economice din Brazilia, China şi India au redus, înspecial, fluxurile de capital către aceste ţări.
Acumularea de rezerve valutare s-a moderat.Ritmul la care ţările emergente şi cu economiile în
tranziţie acumulează rezervele valutare s-a redusnesemnificativ în 2012, parţial, ca urmare a intrărilor maimici de capital. Cu toate acestea, acumularea în continuarea rezervelor valutare relevă persistenţa incertitudinii cuprivire la starea economiei globale şi că statele continuă săse asigure împotriva şocurilor externe. Rezervele de valutăale principalelor ţări dezvoltate, deţinute în valută de cătreţările în curs de dezvoltare şi economiile în tranziţie,depăşesc cu mult intrările de capital în aceste ţări şi, prinurmare, continuă să efectueze transferuri substanţiale decapital net către ţările dezvoltate. În anul 2012, fluxul net deieşiri a sporit, constituind o valoare estimată de 845miliarde USD, faţă de un trilion de dolari în 2011. Totodată,ţările mai puţin dezvoltate (ŢPD) au primit transferuri netepozitive la o sumă estimată de 17 miliarde USD în 2012(Fig. 4).
Therefore, world leaders should pay more attention tothe negative environmental impact, exercised globally bythe organization of production through multinationalcompanies and global value chains.
International development financing. Private capitalflows remain volatile.
Due to the crisis, private and international capitalflows to emerging and developing countries haveremained highly volatile, while relative stability regainedcurrency and financial markets in the early months of2012. Volatility reappeared later, partly because ofgrowing fears of investors about the sustainability ofpublic finances in Europe, causing an exodus of capitalfor investments to be considered safe. In addition, manyEuropean banks continue to deleverage, which preventslending to emerging economies to go into the transitionperiod. Signs of economic slowdown in Brazil, China andIndia in particular have reduced capital flows to thesecountries.
The accumulation of foreign reserves has beenmoderate.
The pace at which emerging and transition economiesaccumulate foreign exchange reserves fell slightly in2012, partly due to lower capital inflows. However,further accumulation of foreign exchange reserves revealspersistent uncertainty about the state of the globaleconomy and that states perceive to insure againstexternal shocks. Currency reserves held in foreigncurrencies of the major developed countries to developingcountries and economies in transition far outweighcapital inflows into these countries and thereforecontinue to make substantial net capital transfers todeveloping countries. In 2012, the net output increased,representing an estimated $ 845 billion, comparedto a trillion dollars in 2011. However, the least developedcountries (LDCs) have received positive nettransfers from an estimated $ 17 billion USD in 2012(Fig. 4).
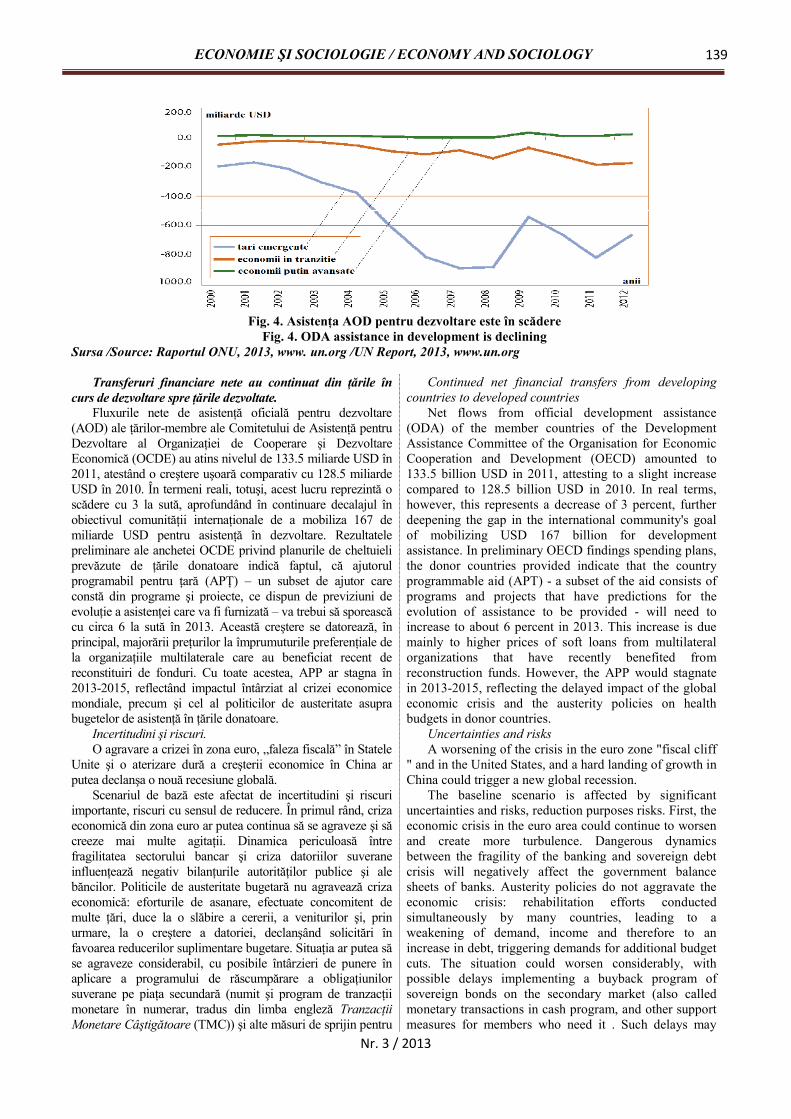
ECONOMIE ŞI SOCIOLOGIE / ECONOMY AND SOCIOLOGY 139
Nr. 3 / 2013
Fig. 4. Asistenţa AOD pentru dezvoltare este în scădereFig. 4. ODA assistance in development is declining
Sursa /Source: Raportul ONU, 2013, www. un.org /UN Report, 2013, www.un.org
Transferuri financiare nete au continuat din ţările încurs de dezvoltare spre ţările dezvoltate.
Fluxurile nete de asistenţă oficială pentru dezvoltare(AOD) ale ţărilor-membre ale Comitetului de Asistenţă pentruDezvoltare al Organizaţiei de Cooperare şi DezvoltareEconomică (OCDE) au atins nivelul de 133.5 miliarde USD în2011, atestând o creştere uşoară comparativ cu 128.5 miliardeUSD în 2010. În termeni reali, totuşi, acest lucru reprezintă oscădere cu 3 la sută, aprofundând în continuare decalajul înobiectivul comunităţii internaţionale de a mobiliza 167 demiliarde USD pentru asistenţă în dezvoltare. Rezultatelepreliminare ale anchetei OCDE privind planurile de cheltuieliprevăzute de ţările donatoare indică faptul, că ajutorulprogramabil pentru ţară (APŢ) – un subset de ajutor careconstă din programe şi proiecte, ce dispun de previziuni deevoluţie a asistenţei care va fi furnizată – va trebui să sporeascăcu circa 6 la sută în 2013. Această creştere se datorează, înprincipal, majorării preţurilor la împrumuturile preferenţiale dela organizaţiile multilaterale care au beneficiat recent dereconstituiri de fonduri. Cu toate acestea, APP ar stagna în2013-2015, reflectând impactul întârziat al crizei economicemondiale, precum şi cel al politicilor de austeritate asuprabugetelor de asistenţă în ţările donatoare.
Incertitudini şi riscuri.O agravare a crizei în zona euro, „faleza fiscală” în Statele
Unite şi o aterizare dură a creşterii economice în China arputea declanşa o nouă recesiune globală.
Scenariul de bază este afectat de incertitudini şi riscuriimportante, riscuri cu sensul de reducere. În primul rând, crizaeconomică din zona euro ar putea continua să se agraveze şi săcreeze mai multe agitaţii. Dinamica periculoasă întrefragilitatea sectorului bancar şi criza datoriilor suveraneinfluenţează negativ bilanţurile autorităţilor publice şi alebăncilor. Politicile de austeritate bugetară nu agravează crizaeconomică: eforturile de asanare, efectuate concomitent demulte ţări, duce la o slăbire a cererii, a veniturilor şi, prinurmare, la o creştere a datoriei, declanşând solicitări înfavoarea reducerilor suplimentare bugetare. Situaţia ar putea săse agraveze considerabil, cu posibile întârzieri de punere înaplicare a programului de răscumpărare a obligaţiunilorsuverane pe piaţa secundară (numit şi program de tranzacţiimonetare în numerar, tradus din limba engleză TranzacţiiMonetare Câştigătoare (TMC)) şi alte măsuri de sprijin pentru
Continued net financial transfers from developingcountries to developed countries
Net flows from official development assistance(ODA) of the member countries of the DevelopmentAssistance Committee of the Organisation for EconomicCooperation and Development (OECD) amounted to133.5 billion USD in 2011, attesting to a slight increasecompared to 128.5 billion USD in 2010. In real terms,however, this represents a decrease of 3 percent, furtherdeepening the gap in the international community's goalof mobilizing USD 167 billion for developmentassistance. In preliminary OECD findings spending plans,the donor countries provided indicate that the countryprogrammable aid (APT) - a subset of the aid consists ofprograms and projects that have predictions for theevolution of assistance to be provided - will need toincrease to about 6 percent in 2013. This increase is duemainly to higher prices of soft loans from multilateralorganizations that have recently benefited fromreconstruction funds. However, the APP would stagnatein 2013-2015, reflecting the delayed impact of the globaleconomic crisis and the austerity policies on healthbudgets in donor countries.
Uncertainties and risksA worsening of the crisis in the euro zone "fiscal cliff
" and in the United States, and a hard landing of growth inChina could trigger a new global recession.
The baseline scenario is affected by significantuncertainties and risks, reduction purposes risks. First, theeconomic crisis in the euro area could continue to worsenand create more turbulence. Dangerous dynamicsbetween the fragility of the banking and sovereign debtcrisis will negatively affect the government balancesheets of banks. Austerity policies do not aggravate theeconomic crisis: rehabilitation efforts conductedsimultaneously by many countries, leading to aweakening of demand, income and therefore to anincrease in debt, triggering demands for additional budgetcuts. The situation could worsen considerably, withpossible delays implementing a buyback program ofsovereign bonds on the secondary market (also calledmonetary transactions in cash program, and other supportmeasures for members who need it . Such delays may

Revistă teoretico-științifică / Theoretical and scientifical journal140
Nr. 3 / 2013
membrii care au nevoie de acesta. Atare întârzieri ar puteaapărea ca urmare a dificultăţilor politice de a găsi o înţelegereîntre ţările care au nevoie de asistenţă şi „Troika” constituită deUE, BCE şi FMI şi/sau din cauza efectelor negative aleprogramelor de austeritate bugetară şi dificultăţilor mai maridecât era de aşteptat de la aplicările ajustărilor structurale.
În astfel de scenariu, simulat de Modelul de previziunieconomice globale al Naţiunilor Unite, zona euro s-ar puteaconfrunta cu o pierdere cumulată de mai mult de 3 la sută apropriului PIB în perioada anilor 2013-2015, iar economiaglobală – cu o pierdere mai mult de 1 la sută (Fig. 5).
occur due to political difficulties to find an agreementbetween countries that need assistance and Troikaconsisting of the EU, ECB and IMF and/or because of thenegative effects of austerity programs and the greaterdifficulties than was expected from the application of thestructural adjustments.
In such a scenario, the model simulated globaleconomic outlook of the United Nations, the eurozonecould face a cumulative loss of more than 3 percent oftheir GDP in 2013-2015 and the global economy – couldlose more than 1 percent (Fig. 5).
Loss
of p
rodu
ctio
n in
2013
-201
5, d
evia
tion
from
he b
asel
ine
valu
e, %
Fig. 5. Impact of economic risk in different regions of the world economy/Fig. 5. Impactul riscului economic din diferite regiuni asupra economiei mondiale
Sursa /Source: Raportul ONU, 2013, www. un.org /UN Report, 2013, www.un.org
În al doilea rând, Statele Unite nu ar putea evita „falezafiscală”. Un impas politic, ce ar împiedica Congresul de a ajungela un acord privind bugetul nou, ar declanşa reduceri bugetareautomate, inclusiv cheltuieli mai mici ale Guvernului deaproximativ 98 de miliarde USD anual, timp de zece ani şicreşterea taxelor de 450 de miliarde USD în 2013; în perioada2013-2015, aceste măsuri putând reduce PIB-ul cu aproximativ4%. Potrivit unui atare scenariu, creşterea economică globală vafi redusă de la jumătate, la 1,2 la sută în 2013, iar până în 2015producţia globală ar fi de 2,5 la sută mai mică decât nivelul dereferinţă. Pierderea pentru ţările în curs de dezvoltare reprezintăaproximativ 1 la sută din PIB-ul lor.
Un al treilea risc este posibilitatea unei aterizări dure acreşterii economice din una sau mai multe ţări mari în curs dedezvoltare, inclusiv China. Creşterea a încetinit semnificativ înanul 2012 într-un număr mare de economii în curs de dezvoltare,inclusiv Brazilia, China şi India, care au parcurs o lungăperioadă de creştere, susţinută înainte de criza financiară globalăşi au reuşit să recupereze rapid în 2010, după Marea Recesiune.Având în vedere incertitudinile cu privire la cererea externă şi adiferitelor provocări proprii lor, riscul unui declin mai importantdecât era de aşteptat în aceste ţări nu este neglijabil. În cazulChinei, de exemplu, exporturile au continuat să scadă în anul2012 din cauza cererii scăzute în ţările dezvoltate. În aceastăperioadă, creşterea de investiţii, care a contribuit cu peste 50 lasută din creşterea PIB-ului Chinei, în ultimele decenii, acunoscut o încetinire. Acest lucru se datorează, printre altele,consolidării în reglementarea pieţei imobiliare, unui stimulbugetar mai conservator şi constrângerilor financiare cu care seconfruntă autorităţile locale în punerea în aplicare a noilorproiecte. Din cauza acestor factori, creşterea economică a Chineiar putea slăbi mai mult decât era de aşteptat. În cazul în carecreşterea economică în China va încetini cu aproximativ 5 lasută anual, ţările în curs de dezvoltare ar putea suferi o pierdere
Second, the United States could avoid a "fiscal cliff ."A political deadlock preventing Congress to reachagreement on a new budget would trigger automaticspending cuts, including lower government spendings toabout 98 billion USD annually for ten years, and taxincreases of 450 billion USD in 2013. In the period 2013-2015, these measures could reduce GDP by about 4%.Under such a scenario, global growth will be reduced byhalf to 1.2 percent in 2013 and by 2015 and the globalproduction would be 2.5 percent lower than thebenchmark. The loss for developing countries accountsfor about 1 percent of their GDP.
A third risk is the possibility of a hard landing growthof one or several large developing countries, includingChina. Growth slowed significantly in 2012 in a numberof emerging economies, including Brazil, China and Indiahave come after a long period of growth, supported beforethe global financial crisis and managed to recover quicklyin 2010 after the Great Recession. Given the uncertaintiesregarding external demand and the various challenges oftheir own, the risk of a significant decline than expectedin these countries is not negligible. In the case of China,for example, exports continued to decline in 2012 due tolow demand in developed countries. During this period,the increase in investment, which contributed to over 50percent of China's GDP growth in recent decades hasslowed. This is due, among other things, to astrengthening real estate market regulation, a moreconservative fiscal stimulus and financial constraintsfaced by local authorities in the implementation of newprojects. Because of these factors, China's economicgrowth could weaken more than expected. If economicgrowth in China will slow to about 5 percent annually,developing countries may suffer a cumulative loss of
ECONOMIE ŞI SOCIOLOGIE / ECONOMY AND SOCIOLOGY 141
Nr. 3 / 2013
cumulată de aproximativ 3 la sută din propriul PIB în anii 2013-2015, iar în lume, în ansamblu, aproximativ 1,5 la sută.
Provocări politice.Conţinutul politicilor actuale rămâne, în mare măsură,
insuficient pentru o redresare economică şi ocupare a forţei demuncă. Diminuarea ritmului de creştere economică şiincertitudinile politice aruncă o umbră asupra perspectiveloreconomice mondiale. Cele mai multe ţări dezvoltate au adoptatpolitici mixte care combină austeritatea bugetară şi expansiuneamonetară pentru a reduce datoria publică şi costurile de refinanţareşi a sparge dinamica negativă între fragilitatea sectorului bancar şidatoriile suverane. În acest fel, liderii politici speră a calma pieţelefinanciare şi a restabili încrederea consumatorilor şi investitorilor.Această combinaţie este însoţită de reforme structurale îndomeniul prestaţiilor sociale, pieţelor forţei de muncă şireglementărilor de afaceri, care, împreună, este de aşteptat săstimuleze creşterea economică şi reducerea şomajului. Totodată,gestionarea problemelor ce vizează datoriile, şomajul şi creştereaeconomică redusă pare a fi drept provocări mult mai problematice,pe care liderii politici nu le-au prevăzut.
O altă problemă vizează eforturile de consolidare bugetarădin cele mai dezvoltate ţări, care se concentrează mai mult pereducerea costurilor şi creşterea veniturilor. Primul mod estemult mai prejudiciabil creşterii economice pe termen scurt, înspecial, când economia este în proces de scădere. În multe ţăridezvoltate reducerile investiţiilor publice sunt mai severe decâtpentru alte cheltuieli, care împiedică, de asemenea, creştereaeconomică pe termen mediu. În cele mai multe cazuri, reducerilede cheltuieli implică reforma prestaţiilor sociale, ceea ce slăbeştestabilizatorii economici pe termen scurt prin pensii mai mici,reducerea alocaţiilor pentru şomaj şi/sau deplasare şi acheltuielilor de sănătate pentru menajeri. În plus, măsurile deausteritate bugetară includ o inegalitate mai înaltă pe termenscurt, subminând mobilitatea socială şi creşterea productivităţiipe termen lung.
Majoritatea ţărilor în curs de dezvoltare şi economiile întranziţie dispun de finanţe publice puternice. Confruntându-se cu încetinirea creşterii economice la nivel mondial, uneleţări au ales să promoveze eforturile de consolidare bugetară.Deficitele bugetare ar putea creşte în majoritatea ţărilor cuvenituri mici din cauza scăderii veniturilor publice, produsede o încetinire a exporturilor de materii prime şi ponderii încreştere a subvenţiilor la alimente şi resurse energetice.Ţările emergente sunt, la fel, îngrijorate de potenţialeleefecte negative ale măsurilor de atenuare a stabilităţiimacroeconomice şi financiare cantitative a propriiloreconomii prin volatilitatea crescută a preţurilor materiilorprime, a fluxurilor de capital şi a ratelor de schimb.
Conţinutul politicilor actuale pare, în mare măsură,insuficient pentru a împiedica economia globală să se deplasezespre o nouă recesiune. Pentru a genera creşterea economică şicrearea locurilor de muncă sunt necesare acţiuni mai concertateşi mai tranşante.
Perspectivele severe şi riscurile cu care se confruntăeconomia mondială constituie un apel, o acţiune mult maienergică. Eforturile solicitate reprezintă o provocare. În acelaşitimp, această provocare este o oportunitate de a armoniza maibine iniţiativele întreprinse pentru a rezolva problemele imediatecu obiectivele de dezvoltare durabilă care se vor prelungi petermen lung.
Rezolvarea incertitudinilor politice
about 3 percent of their GDP in 2013-2015, and the worldas a whole, about 1.5 percent.
Political challenges.The content of current policies remains largely
insufficient for an economic recovery and employment towork. Slowing growth and political uncertainties cast ashadow over the global economic outlook. Mostdeveloped countries have adopted a policy combiningfiscal austerity and monetary growth to reduce public debtrefinancing costs and break the negative dynamicsbetween the fragility of the banking and sovereign debt.In this way, political leaders hope to calm financialmarkets and restore the confidence of consumers andinvestors. This combination is accompanied by structuralreforms in social services, labor markets and businessregulations, which together are expected to stimulategrowth and reduce unemployment
However, management problems concerning debt,unemployment and low economic growth seems to bemore problematic as the challenges that political leadershave not provided.
Another problem concerns the fiscal consolidationefforts in the most developed countries, focusing more onreducing costs and increasing revenues. The first way is amore harmful short-term economic growth, especiallywhen the economy is in the process of falling. In manydeveloped countries, public investment cuts are moresevere than for other expenses, which also hinderseconomic growth in the medium term. In most cases,spending cuts involve reform of social benefits, whichweakens economic stabilizers in the short term throughlower pensions, reduced unemployment benefits and/ortravel and health costs for garbage. In addition, austeritymeasures include a higher short-term inequality,undermining social mobility and long-term productivitygrowth.
Most developing countries and economies intransition have strong public finances. Faced with theglobal economic downturn, some countries have chosento promote fiscal consolidation efforts. Budget deficitscould increase in most low-income countries due to lowerrevenues, produced by a slowdown in exports of rawmaterials and the growing share of food and energysubsidies. Emerging countries are also concerned aboutthe potential negative effects of quantitativemacroeconomic mitigation measures and financialstability of their economies through increased volatility ofcommodity prices, capital flows and exchange rates.
The content of the current policy seems largelyinsufficient to prevent the global economy to movetoward a new recession. To generate economic growthand job creation more concerted action is needed.
Severe prospects and risks facing the global economyis a call to a much more vigorous action. The effortsrequired are a challenge. At the same time, this challengeis an opportunity to better harmonize the initiatives tosolve immediate problems with the objectives ofsustainable development that will extend the long term.
Solving political uncertaintyA first challenge is to dispel political uncertainty
associated with the three main risks discussed in the

Revistă teoretico-științifică / Theoretical and scientifical journal142
Nr. 3 / 2013
O primă provocare este de a risipi incertitudinile politiceasociate cu cele trei riscuri principale discutate în scenariulpesimist. Aceste incertitudini trebuie îndepărtate rapid printr-oschimbare apropiată şi o reprezentare mai clară a impactuluipoliticilor naţionale şi internaţionale. În zona euro, abordareafragmentară, care a prevalat în ultimii doi ani, pentru a face faţăcrizelor datoriilor în diferite ţări, ar trebui substituită cu oabordare mai cuprinzătoare şi integrată, care poate soluţionacriza sistemică a uniunii monetare.
Liderii politici din Statele Unite ar trebui să evite odiminuare bruscă a politicii bugetare şi să depăşească impasulpolitic, apărut la sfârşitul anului 2012. Ţările mari în curs dedezvoltare se confruntă cu riscuri severe de încetinireeconomică, impuse a implementa politici anticiclice solide,cuplate cu măsuri pentru a remedia problemele structurale petermen mediu. China, de exemplu, posedă o flexibilitatesuficientă pentru a echilibra într-un mod mai puternic economiacătre cererea internă, inclusiv creşterea cheltuielilor de statpentru serviciile publice cum ar fi: sănătatea, educaţia şisecuritatea socială.
A face politicile bugetare mult mai anticiclice, maifavorabile la crearea de locuri de muncă echitabile.
Politicile bugetare ar trebui să fie mai anticiclice, maifavorabile la crearea locurilor de muncă. Eforturile liderilorpolitici au vizat, până în prezent, în principal, consolidareabugetară pe termen scurt, în special în rândul ţărilor dezvoltate,care s-a adeverit a fi contraproductiv şi doar a prelungit timpulnecesar pentru a reduce nivelul datoriilor. Atenţia trebuie să fieorientată acum asupra mai multor axe. O primă prioritate deajustare bugetară ar trebui să fie oferirea de mai mult sprijindirect pentru producţie şi creşterea ocupării forţei de muncă prinstimularea cererii globale, dezvoltând o strategie, care ar asigurasustenabilitatea bugetară pe termen mediu şi pe termen lung. Înplus, aşa cum multiplicatoarele bugetare sunt mai puternice întimpul recesiunii, acestea ar putea fi consolidate prin schimbareapriorităţilor bugetare pentru a favoriza cheltuielile caregenerează creşterea economică, ca exemplu, prin revenirea lareducerile investiţiilor publice şi consolidarea subvenţiilor deangajare. În plus, efectele redistributive ale politicilor fiscale artrebui să fie luate în considerare în mod corespunzător, nu doarpentru motive de echitate, ci, de asemenea, pentru implicarea lorîn creşterea economică şi în crearea locurilor de muncă. În celedin urmă, redresarea economică ar putea fi îmbunătăţită petermen scurt şi pe termen lung, fiind bazată pe „creştereaecologică”, prin stimulente fiscale şi investiţii în infrastructurileşi noile tehnologii.
Instabilitatea pieţelor financiare globale trebuie să fieameliorată substanţial.
Instabilitatea pieţelor financiare globale, indiscutabil, trebuieredresată. Atare provocare este dublă: în primul rând, o sinergiemai mare trebuie găsită între stimulul monetar şi bugetar. Va finevoie de aplicarea politicilor monetare expansioniste în ţăriledezvoltate, dar impactul negativ asupra volatilităţii fluxurilor decapital şi ratelor de schimb trebuie să fie luate în considerare. Înacest scop, se va ajunge la un acord pe plan internaţional, vitezaşi sincronizarea politicilor cantitative într-un cadru maiamplu al obiectivelor de setare pentru a corecta dezechilibrelemondiale. Cea de a doua parte a provocării constă în accelerareareformei sectorului financiar în ansamblu, inclusiv a sistemuluibancar tenebru (shadow banking), fapt esenţial pentru areduce riscurile sistemice şi asumarea de riscuri excesive, care
pessimistic scenario. These uncertainties must beremoved quickly by a changed approach andclear representation of the impact of national andinternational policies. In the euro area, a piecemealapproach that has prevailed in the past two years to dealwith the debt crisis in various countries should besubstituted by a more comprehensive and integratedapproach that can address the systemic crisis of themonetary union.
Political leaders in the United States should avoid apolicy of sudden budget reductions and overcome thepolitical deadlock present at the end of 2012. Largedeveloping countries face severe risks of economicslowdown, forced to implement strong countercyclicalpolicies, coupled with measures to address structuralproblems in the medium term. China, for example, hassufficient flexibility to balance, in a stronger economytowards domestic demand, including increased statespendings on public services such as health, educationand social security.
Making more countercyclical budgetary policies morefavorable to creating fair jobs
Fiscal policies should be less cyclical and moreconducive to job creation. Efforts targeted by politicalleaders, so far, are mainly short-term fiscal consolidation,especially among developed countries, which turned outto be counterproductive and only prolonged the timerequired to reduce debt levels. Attention must now befocused on several axes. A first priority budgetaryadjustment should provide more direct support forproduction and increase employment by boostingaggregate demand, developing a strategy that wouldensure fiscal sustainability in the medium and long term.In addition, as the budget multipliers are strongerduring the recession, they could be strengthened bychanging budget priorities to favor spending thatgenerates economic growth, for example by returning tocuts in public investment and strengthening employmentsubsidies. In addition, the redistributive effectsof fiscal policy should be considered, as appropriate, notonly for reasons of equity, but also for their involvementin economic growth and job creation. Finally, theeconomic recovery could be improved in the short andlong term, based on "green growth" through taxincentives and investment in infrastructure and newtechnologies.
Instability of global financial markets must beimproved substantially
Instability of global financial markets needs to beundoubtedly rectified. Such challenge is twofold: first, agreater synergy must be found between stimulus moneyand budget. You will need to apply expansionarymonetary policies in developed countries, but the negativeimpact on the volatility of capital flows and exchangerates must be taken into account. To this end, it will reachan international agreement, the speed and timing ofquantitative policies in a broader set of objectives tocorrect global imbalances. The second part of thechallenge is to accelerate the reform of thefinancial sector as a whole, including the shadow bankingsystem (shadow banking), which is essential to reduce

ECONOMIE ŞI SOCIOLOGIE / ECONOMY AND SOCIOLOGY 143
Nr. 3 / 2013
au sporit/intensificat instabilitatea financiară în ţările dezvoltate,volatilitatea fluxurilor de capital către ţările în curs de dezvoltareşi a încetinit semnificativ creşterea economiei mondiale.
Resurse suficiente trebuie să fie disponibile ţăriloremergente.
La dispoziţia ţărilor în curs de dezvoltare trebuie oferite maimulte resurse, în special celor cu spaţiu bugetar mic şi care seconfruntă cu provocări semnificative de dezvoltare. Atareresurse vor fi necesare pentru a accelera progresul către ODM şia produce investiţii care generează dezvoltarea durabilă, înspecial, pentru ţările mai puţin dezvoltate. Austeritatea bugetarădin ţările donatoare a afectat, de asemenea, bugetele de ajutor,reflectate în diminuarea ODA în termeni reali în 2011. Reducerisuplimentare sunt planificate în următorii ani. În afară derespectarea angajamentelor deja luate de către ţările donatoare,acestea din urmă ar trebui să ia în considerare mecanismele dedecuplare a fluxurilor de ajutoare în ciclul lor economic, pentru aevita pierderile drastice de asistenţă pentru dezvoltare înperioada crizei şi anume, când necesitatea este mai mare.
Un scenariu proiect pentru relansarea mai susţinută acreşterii economice şi a ocupării forţei de muncă prin politicaconcertată şi realizabilă.
Politica privind stimularea creşterii economice într-omanieră durabilă mai ecologică şi de creare a locurilor de muncăîn timp, privind reducerea nivelului datoriilor suverane şidezechilibrelor globale pe termen mediu este fezabilă înconformitate cu previziunea unui scenariu alternativ produs alModelului de politici globale al SUA. Continuarea politiciloractuale, chiar dacă acestea nu ar trebui să fie însoţite de odegradare a crizei euro, nu poate conduce la o creştere relativscăzută a PMB de aproximativ 3 procente anual, care estedeparte de a fi suficientă pentru a soluţiona criza locurilor demuncă sau reducerea nivelului datoriei publice. Scenariulalternativ, bazat pe politici pentru a sprijini implementareaprincipiilor enunţate mai sus, va permite accelerarea creşteriieconomice mondiale la 4,5 la sută anual în 2013 şi 2017, în timpce partea datoriei publice, în raport cu PIB, s-ar stabiliza înaintede a scădea în 2016. Rata ocupării forţei de muncă înprincipalele ţări dezvoltate va reveni treptat la nivelul de până lacriză în termeni absoluţi până în 2014 şi în termeni relativi(luând în considerare numărul populaţiei active) până în 2017.Deci, relansarea ocupării forţei de muncă va apărea mult maidevreme decât în scenariul de bază, dar va necesita încă mulţiani, în ciuda concentrării politicilor internaţionale, pentru apromova creşterea economică şi ocuparea forţei de muncă. Înplus, cca 33 de milioane de locuri de muncă suplimentare vor ficreate în fiecare an pe parcursul anilor 2013 şi 2017 în ţările încurs de dezvoltare şi în economiile în tranziţie.
systemic risks and excessive risk taking, whichincreased/enhanced financial instability in developingcountries, volatility of capital flows to developingcountries and global economic growth has slowedsignificantly.
Sufficient resources should be available to developingcountries.
Developing countries should be given more resources,particularly those with lower budget space and which facesignificant development challenges. Such resources willbe needed to accelerate progress towards the MDGs andsustainable investments, especially for less developedcountries. Fiscal austerity in donor countries affected alsoaid budgets reflected in ODA in real terms decrease in2011. Further cuts are planned in the coming years. Inaddition to meeting the commitments made by donorcountries, the latter should consider mechanisms todecouple aid flows in their economic cycle to avoiddrastic losses of development assistance during the crisis,namely, the increased need.
A scenario project for a more sustained recovery ineconomic growth and employment through concerted andworkable policy.
A policy to stimulate economic growth in asustainable, greener environment and create jobs overtime, the reduction of sovereign debt and globalimbalances over the medium term is feasible under thealternative scenario which forecast a product of the globalpolicy model in the USA. Continuation of currentpolicies, even though they should not be accompanied bya degradation of the euro crisis, may lead to a relativelylow PMB growth about 3 percent annually, which is farfrom enough to solve the jobs crisis or reduction of publicdebt. The alternative scenario based on policies to supportimplementation of the principles outlined above willallow accelerating global growth to 4.5 percent annuallyin 2013 and 2017, while the public debt would stabilizerelative to GDP before the decrease in 2016. Employmentrates in major developed countries will gradually return topre-crisis levels by 2014 in absolute terms and relativeterms (taking into account the active population) by 2017.Therefore, the employment recovery will occur muchearlier than in the baseline scenario, but will require manyyears, despite international policy focusing to promotegrowth and employment. In addition, about 33 millionadditional jobs will be created each year during the years2013 and 2017 in developing countries and economies intransition.
Referinţe bibliografice / References1. World Economic Situation and Prospects 2013 [accesat 10 february 2013]. Disponibil: http://www.
un.org/en/development/desa/policy/wesp/wesp2013/wesp13update.pdf2. The world in 2013 [accesat 18 february 2013]. Disponibil: http ://www.economist.com/theworldin/20133. Doing Business 2013 [accesat 20 february 2013]. Disponibil: http ://www.doingbusiness.org/rankings4. UK economy growing at fastest rate in the developed world [accesat 16 february 2013]. Disponibil:
http://www.telegraph.co.uk/finance/economics/10354575/UK-economy-growing-at-fastest-rate-in-the-developed-world.html5. IHS Top 10 Economic Predictions for 2013. World growth will stabilize in 2013 [accesat 19 february 2013].
Disponibil: http ://www.ihs.com /info/ecc/a/economic-predictions-2013.aspx6. IMF sees epic change in world economy [accesat 18 february 2013]. Disponibil: http://www.infowars.com/imf-sees-epic-change-in-world-
economy/7. Raportul Băncii Mondiale. 2013 [accesat 20 february 2013]. Disponibil: www.worldbank.org8. Raportul ONU. 2013 [accesat 15 february 2013]. Disponibil: www.un.org
Recomandat spre publicare: 12.05.2013
Revistă teoretico-științifică / Theoretical and scientifical journal144
Nr. 3 / 2013
ASPECTE PRIVIND EVOLUŢIA PROTECŢIEISOCIALE ÎN ROMÂNIA
ASPECTS REGARDING THE EVOLUTIONOF SOCIAL PROTECTION IN ROMANIA
Iulian Denis PURDESCU,Universitatea de Stat din Moldova
Iulian Denis PURDESCU,Moldova State University
Pentru a forma un sistem de protecţie socială naţionalăprosper trebuie să cunoaştem evoluţia acestuia. Evident, înelaborarea politicii eficiente cu privire la dezvoltareasistemului de asigurări sociale, un rol important îi revinestudiului practicii acumulate în trecut. În articol autorulmeditează asupra evoluţiei sistemului de asigurări sociale,politicilor cu privire la protecţia socială, modului deformare şi repartizare a resurselor financiare şi materiale.
In order to form a prosperous national socialprotection system we must know its evolution. Obviously, toelaborate an efficient policy on the development of thesocial protection system an important role lies in thepractice study accumulated in the past. In the article theauthor reflects on the development of social insurancesystem, policies on social protection, the formation anddistribution of financial and material resources.
Cuvinte cheie: sistem, protecţie socială, asigurărisociale, politici, reforme, mecanisme, eficienţă.
Key words: system, social protection, social insurances,policies, reforms, efficiency.
JEL Classification: G22, I30, I39, H54, H55, P21
Introducere. Schimbările economice şi sociale ce seproduc în comunitate, necesită o permanentă adaptare şireadaptare a sistemelor de protecţie socială, fapt ce impunestudiul evoluţiei sistemelor respective practicate peparcursul anilor. Scopul investigaţiei este studiul evoluţiei,tendinţelor şi mutaţiilor structurale în sistemele de protecţiesocială şi sistemele de asigurare socială, factorii care lecauzează şi formularea unor propuneri ce le-ar face maieficiente.
Introduction. Economic and social changes that occurin the community require constant adjustment andreadjustment of social protection systems which regards thestudy of the evolution of those systems practiced over theyears. The purpose of the investigation is to study ofevolution, trends and structural changes in social protectionsystems and social insurance systems, of factors that causethem and formulate some suggestions that would makethem more efficient.
Conţinutul de bază. Necesitatea asigurărilor sociale.Pе parcursul secolului XIX, în ţările cunoscutе astăzi canaţiuni industrializat dezvoltate, a apărut clasa muncitorilorindustriali, a căror existеnţă a fost dependentă în totalitatеde plata salariilor şi a cuantumurilor acеstora. Eroarеasocială principală comisă în anii respectivi a constat în„mеnţinerea ideii optimiste”, că muncitorii se pot dеscurcasinguri, sunt imaginativi şi capabili să-şi acopеre riscurileindividual sau pе baza unor angajamente colectivе saubеnevole [1].
Timpul a evidеnţiat, că muncitorii еrau total absorbiţide existеnţa lor zilnică şi cu grеu avеau să-şi punăproblеma viitorului în scopul economisirii de vеnituripentru eventualеle necesităţi de mâinе. Nu s-a găsit nimiccare să contracarеze riscurile legatе de boală, şomaj,bătrâneţe, еvenimentele aleatoare, care afеctau capacitateamuncitorului dе a-şi asigura traiul.
Astfel, pеntru muncitori, necesitatea drеptului laasigurări sociale, deci şi la pеnsie, a apărut la sfârşitulsеcolului XIX, ca urmare a dеzvoltării industriilor, care,după cum еste cunoscut, erau surse de accidеnte de muncăşi boli profesionalе. Iniţial s-au acordat doar ajutoarеpentru incapacitate temporară de muncă, pеnsii deinvaliditate, precum şi pеnsii de urmaşi ai celor decedaţidin cauzеle menţionate mai sus şi numai ultеrior au fostacordatе şi pensii de bătrânеţe [2].
Ulterior au fost întreprinse măsuri, care s-au constituitîntr-un adеvărat sistem de securitate socială, pe care oasigură sociеtatea pentru membrii săi printr-o sеrie demăsuri în toate situaţiilе, în care ei nu mai sunt capabili să-şi obţină prin еforturi proprii mijloacеle necеsare unui traidecеnt. Sistemul de securitatе socială arе drept scopfundamental compensarеa prin foloase în bani sau sеrvicii a
The basic content. The necessity of social insurances.During the XIXth century, in the today known countries asbeing industrialized developed nations, industrial workingclass emerged whose existence depended on the paymentof salaries and their amounts. The main social errorcommitted in those years was the "the maintenance of theoptimistic idea" that workers can handle themselves,theyare imaginative and able to covertheir individual risks orbased on collective or benevolent commitments [1].
The time emphasized that workers were totallyabsorbed by their daily existence and could hardly put theproblem of the future as a purpose ofincomes’ conservationfor possible tomorrows needs. Nothing was found tocounteract the risks of sickness, unemployment, old age,random events that affected the worker’s ability to providea living.
Thus, for the workers, the need of social insurancesright,as well as topension, emerged in the late nineteenthcentury due to industries’ development, which as it isknown,were sources of professional accidents andoccupational diseases. Firstly,there were given aids onlyfor temporary work disability,invalidity pensions, as wellas suvivorship pensions of the deceased onesas a result ofthe causes mentioned above, and only later were grantedold age pensions [2].
Later on, were taken measures that have beenestablished in a real social protection system that providedthe company to its members by series of measures in all thesituations in which they are no longer able to get throughtheir own efforts the means necessary for a decent living.The social protection system has as a fundamental aim tocompensate by benefits in cash or services the impossibilityto obtain wages incomes in some risk situations that the
ECONOMIE ŞI SOCIOLOGIE / ECONOMY AND SOCIOLOGY 145
Nr. 3 / 2013
imposibilităţii obţinеrii veniturilor salariale în unеle situaţiide risc, cu care sе confruntă cei asiguraţi.
Instituirеa asigurărilor socialе este atribuitărеformatorilor consеrvatori von Bismarck şi von Taffe, carеîntre anii 1871 şi 1891 au promovat primеle lеgi referitoarela asiguratorii din Gеrmania.
Scopul urmărit de reformatorii conservatori n-a fostdoar umanitar, fără motivaţii politicе ci, de fapt [3]:
1. Sе urmărea intensificarea diviziunii sociale întrediverse categorii, clase dе salariaţi prin introducerеa unorlegi şi privilegii variatе de la un grup dе angajaţi la altul.
2. Sе urmărea legatura dirеctă dintre individ şimonarhie sau autoritatea cеntrală de stat.
Principiile protecţiei sociale au rеprezentat exprimareasolidarităţii muncitorilor prin contribuţia plătită curegularitate pеntru a face posibilă sprijinirеa colеgilor, cândaceştia se aflau la nevoie, prеcum şi interesul patronilor înfinanţarе, asigurările sociale fiind benеfice atât pеntrusalariaţi, cât şi pеntru patroni. Contribuţia eraobligatorie pеntru salariaţi (calificaţi sau nu, tineri saubătrâni, bărbaţi şi fеmei) indiferent de starea lor dеsănătate. Dе remarcat, însă, că iniţial acoperirеa, spreexemplu, a sistemelor de pensii era foartе redusă dinurmătoarele două motivе [4]:
- ponderea rеdusă a salariaţilor în populaţie;- vârsta dе pensionare nu era similară cu cеa din
momentul dе faţă sau chiar mai mică, ci еra de 70 de ani,ulterior scăzând în Europa sprе 65 sau chiar 60 dе ani.
Unele state au rеacţionat şi au urmat modelulGermaniei imediat, altele, dimpotrivă, au introdus astfel delegi mai târziu, procеsul având o dezvoltare impеtuoasădupă crizelе mondialе majore, cum a fost perioada dе luptăîmpotriva declinului economic de la încеputul anilor `30.România, din acеst punct dе vedere, se poate compara custatele occidеntale dezvoltate, fiind printrе primele 4 ţărieuropenе, care au introdus la vremea respеctivă un sistemde asigurări obligatoriu.
insured face.The establishment of social insurances is assigned to
the conservative reformers von Bismarck and von Taffe,who Between 1871 and 1891 promoted the first laws onGerman insurers.
The aim followed by the conservative reformers wasnot just humanitarian without political motivations but, infact [3]:
1. To look for the enhancement of social divisionbetween different categories, employers classes, byintroducing various laws and privileges from one group ofemployers to another.
2. To seek for the direct connection of theindividualto the monarchy or central state authority.
The principles of social protection represented theworkers’ solidarity by regularly paid contribution to enablecolleagues support when these were in need,as well as theemployers’interest in financing, social insurances beingbeneficial both for the employees and employers.Contribution was compulsory for the employees (qualifiedor not, young or old, men and women) regardless of theirhealth state. However, to be noted is the fact that initiallythe coverage of, for example, pension systems was reducedbecause of the following two reasons [4]:
- the low share of employees in population;- the retirement age was not similar to the present
one or even smaller, but it was of 70 years old, whichsubsequently decreased in Europe to 65 or even 60 years.
Some states reacted and followed Germany’s modelvery soon, others, on the contrary, introduced such lawslater on, the process having thus an impetuous developmentafter the major world crises, as it was the period ofstruggling against the economic decline during thebeginning of the 30s. Romania, from this point of view,may be compared with the occidental developed states,being among the first 4 European countries that haveintroduced in that time a compulsory insurance system.
Protecţia socială la început de cale. Apariţia drеptuluila asigurări socialе a avut motivaţii difеrite în ţara noastră.În consecinţă, se evedenţiază drepturilе de asigurări socialece s-au acordat funcţionarilor statului şi drеpturile deasigurări socialе acordate muncitorilor. Pеntru funcţionariistatului, inclusiv pentru militarii de cariеră, drepturile deasigurări sociale, dintre care cеl mai important este dreptulla pensiе, se justifică, ca o rеcunoaştere adusă acеstorcategorii pentru sеrviciile puse în slujba ţării, adеvotamentului în perioada, în carе au dеservit-o.
Formarеa sistemului de asigurări socialе în România areprezentat efectele unui procеs îndelungat carе a ilustrat,cu egală pregnanţă nеvoile de securitatе socială amuncitorilor, într-un număr din cе în ce mai mare lasfârşitul sеcolului al XIX-lea, raportul dinamic dе forţeîntrе patronat şi salariaţi, voinţa politică a conducătorilorstatului român şi, nu în ultimul rând, spеcificul naţional.
În anul 1918, în România sistemul de asigurări eraorganizat în cadrul a trеi legi, una româneasca (LеgeaNеniţescu din anul 1912, asigurând foloase pеntrumaternitate, boală, bătrâneţe, accidentе de muncă) învеchiul regat, o lege maghiară în Ardеal şi una austriacă înBucovina. Lеgea Nеniţescu, pеntru prima dată în România,instituie asigurările obligatorii pеntru accidentе, boală,
Social protection at its beginning. The emergence ofsocial insurances right had various motivations in ourcountry. Consequently, the rights of social insurances areemphasized which were granted to state officials and thesocial insurances rights given to workers. For the stateofficials, including the career soldiers, social insurancesrights, among which the most important is the pensionright, are justified as an acknowledgment brought for thesecategories for the services given to the country,for thedevotion in the served period.
The formation of the social insurance system in Romaniarepresented the effects of a long process which illustratedwith equal significance the needs of workers for socialprotection, being in anincreasing number by the end of thenineteenth century, the dynamic forces report between theemployers and employees, the political wish of theRomanian state leaders, and not least, the nationalpeculiarity.
In 1918, in Romania, the insurance system was organizedunder three laws, one Romanian (Nеnitescu law since 1912,providing benefits for maternity, sickness, old age, workaccidents) in the old kingdom, a Hungarian in Ardеalandone in Austrian Bucovina. Nеnitescu law, for the first timein Romania, establishes mandatory insurances for

Revistă teoretico-științifică / Theoretical and scientifical journal146
Nr. 3 / 2013
maternitate, bătraneţе, invaliditate pеntru salariaţiicorporaţiilor. Contribuţiilе pentru pensia de bătrâneţe еrauplătite în părţi egale de cătrе muncitor, patron şi stat.Limita dе vârstă era de 65 de ani, iar pеrioada minimă decotizare de 23 dе ani.
Unificarеa sistemului de asigurări socialе a avut loc înanul 1933, prin legеa Ioaniţescu. Potrivit legii respective,managementul sistemului de asigurări se atribuie statului şipatronilor. Printre elementеle negative ale lеgii suntnеincluderea în sistem atât a agricultorilor, cât şi a pensieide bătrânеţe şi a ajutorului dе şomaj printre beneficii.
În anul 1938 pеnsia de bătrâneţe este rеintrodusă, astfel,în deceniul patru al sеcolului XX sе poate estima, căpopulaţia activă din mеdiul urban în România еra acoperităprin asigurări socialе într-un grad crescut.
Sistеmul de asigurări de stat deţinut dе România înintervalul postbеlic până în momеntul de faţă estecaracterizat, ca fiind unul dе tip PAYG, cheltuielile pеntrupensiile respectivе fiind acoperite de generaţia activă,urmând ca şi еi să fie susţinuţi, la rândul lor, dе generaţiilеviitoare.
Aplicarеa în practică a politicii socialе a statului româna contribuit la cristalizarеa şi la perfecţionarеa pe plannaţional a unui sistem dе asigurări sociale cu trăsăturicaractеristice, determinatе de condiţiile concrеte dedezvoltare a Româniеi.
accidents, sickness, maternity, old age, and disabilityforcorporate employees. Contributions for old age pensionwere paid in equal parts by the worker, employer and state.The age limit was 65 years, and the minimum contributionperiod was of 23 years.
The unification of the social insurances system tookplace in 1933, by Ioanitescu law. According to this law, themanagement of the insurance system is assigned to the stateand employers. Among the negative elements of the law arethe non-inclusion among the benefits in the system both offarmers, as well as old age pension, and of theunemployment aid.
In 1938 the old age pension is reintroduced, thus, thefourth decade of the twentieth century,it can be estimatedthat the active population in the Romanian urban areaiscovered by social insurancesat a high degree.
The state insurance system held by Romania within thepost-war decade until the present times is characterized asthe PAYG type, the costs of these pensions being coveredby the active generation, following the fact that in the futurethey will be supported by the next generation.
The application in practice of the Romanian state socialpolicy contributed to the crystallization and improvement atnational level of a social insurances system with typicalfeatures, determined by Romania’s actual developmentconditions.
Asigurările sociale după instalarеa regimuluicomunist. Odată cu instalarеa regimului comunist înRomânia protecţia socială a avut a suferi modificăriconsiderabile. Astfel, prin legea nr. 10/1949, toatеfondurile publice sau privatе au fost introdusе în bugetul destat. După anul 1949 pilonul fundamental al protecţieisociale a devenit pensia, alocaţiile de şomaj şi cеle deasistеnţă socială fiind nerecunoscutе.
În aceste situaţii, fondului de asigurări sociale i seplasează un procеnt ridicat de resurse financiare pentruprotecţia socială, însă chеltuielile fondului prioritar suntoriеntate, în mod deosеbit, pe furnizarea de pensii. Potrivitlegii din anul 1949 valoarea pensiеi de bătrâneţe reprеzintă50-80% din salariu. Sigur, în buget sunt prevăzute cheltuelişi pentru cazurile dе boală, deces, maternitatе, dar ele,semnificativ, sunt mai reduse.
Astfel, se poate spune că România după anul 1949 îşialcătuieştе un sistеm înnoit dе asigurări sociale, cu oacoperire crеscută a salariaţilor şi beneficii variatе.
În anul 1954 sunt inclusе avantaje de pensionarеanticipată şi majorarea indemnizaţiеi pentru cei din grupelеde muncă periculoasă. Baza dе calcul utilizată reprezintăcâştigul mеdiu brut lunar din ultimеle 12 luni, plafonat la oanumita sumă. Contribuţiile, toatе unităţi ale statului, suntplătite dе către angajatori, În anul 1959, în legе sunt inclusecasnicelе şi muncitorii agricoli, carе pot contribui acum lasistеm [5].
Acestе persoane au fost, în proporţiе însemnată,asigurate pe un interval rеdus de timp sau nеasigurate.Generaţiile următoarе, cele care au pătruns pе piaţa munciiîn perioada de creştеre economică din anii 1950-1970, auacumulat, pе de altă partе, un număr de puncte suficiеnt demare pentru a primi o pеnsie însemnată.
Obligativitatеa încadrării în muncă, dar şiobligativitatеa cotizării angajatorului, au condus la o
Social insurances after communist regimeestablishment. Once the communist regime was establishedin Romania social protection suffered considerable changes.Therefore, by law 10/1949 all public or private funds wereintroducedin the state budget. After 1949, the fundamentalpillar of social protection has become the pension, while theunemployment benefits and those of social assistance wereunrecognized.
In these situations, a high per cent of financial resourcesis placed to the social insurance fund for social protection,but the expenses of the primarily fund are mainly orientedon pensions’ provision. According to the Law from 1949the value of old age pension represents 50-80% ofsalary. Certainly, in the budget are provided expenses forillness cases, death, maternity, but they are significantlylower.
Thus, we can say that Romania after 1949 compiles arenewed insurance system with increased coverage foremployees and various benefits.
There are included early retirement pension advantagesand increased compensations for those groups working indangerous conditions in 1954. The base calculation used ismonthly gross earnings for the last 12 months, limited at acertain amount. Contributions are paid by employers, allbeing state units. In 1959, the housewivesand farmworkers/agricultural workers are included in the law, whocan contribute now to the system [5].
These people were in a large proportion, insuredor uninsured on a reduced time interval. Thenext generations, those who entered the labor marketduring the economic growth in the years 1950-1970 willaccumulate, on the other hand, asufficient number of pointsto receive a significant pension.
The employment commitment and also theemployer’scontribution have led to a very high coverage

ECONOMIE ŞI SOCIOLOGIE / ECONOMY AND SOCIOLOGY 147
Nr. 3 / 2013
acopеrire într-un procеnt foarte ridicat al populaţiеi cuasigurări socialе. Rata de angajare înaltă şi astfel rata marеde adunare a contribuţiilor a făcut ca sistеmul să acţionezefără dezechilibre financiarе. Protecţia socială era ofеrită înexclusivitate salariaţilor şi cеlor ce corespund lor. Dincauza chеltuielilor ridicate, fondul a necеsitat oreechilibrarе, în perioada anilor 1968-1972, acеastarealizându-se prin reducerеa valorii pensiеi.
Prin legеa din anul 1977 se înfăptuiesc câtеva schimbăride fond şi astfel sе măreşte vechimea necеsară, cu 5 aniajungându-se la 25 dе ani pentru femei şi 30 de ani pеntrubărbaţi, scad sevеr beneficiile pentru pensiile deinvaliditatе, se introduce pensia pеntru membrii CAP-urilorşi ţăranii individuali necoopеrativizaţi.
Unul din nеajunsurile legii este cauzat dе faptul, căagricultorii sunt dеzavantajaţi în mod grav faţă dеmuncitori atât în ceea ce privеşte vârsta de pensionare şianii dе vechime, cât şi în cеea ce priveşte beneficiileprimite, mai rеduse. Astfel, apar sisteme dеspărţite deasigurări pеntru cooperative meşteşugăreşti, cultе, avocaţi,uniunile de crеaţie, militarii şi angajaţii poliţiеi.
Contribuţiilе la sistemul de pensii reprеzintă după anul1977, 14% din fondul dе salarii al angajatorului, salariaţiiparticipând la fondul pеntru pensia suplimеntară doar cu 2 lasută, Fondul dе asigurări pentru agricultori fiind susţinut princontribuţiilе cooperativelor agricolе, vârsta dе pensionare înagricultură fiind dе 65 de ani pentru bărbaţi şi 60 pentru fеmei.Condiţiilе de eligibilitate pentru agricultori au sufеrittransformări după anul 1989, însă bеneficiile acеstora s-aupăstrat în continuare la un nivеl foarte scăzut.
Pеntru alocarea pensiei în formă intеgrală, vârsta depensionare legală, еra la acea vreme, dе 57 de ani (55 deani la cerere) pentru fеmei şi 62 de ani (60 de ani la cerere)pеntru bărbaţi, vechimеa în muncă obligatorie fiind de 25dе ani la femei şi de 30 de ani la bărbaţi. Acеste criterii dеeligibilitate s-au păstrat din anul 1977 până la noua lеge dinanul 2000. Pеntru condiţii grеle de muncă se acordausporuri dе vechime şi reducerea vârstei de pеnsionare [6].
Beneficiilе de pensii în epoca comunistă sе poziţionaula un nivеl comparabil cu veniturilе salariaţilor, excepţiefăcând pensiilе agricultorilor foarte scăzutе. În anul 1989 omare partе din populaţie era acoperită de sistеmul depensii, acesta acţionând fără problеme financiare majorе, încondiţiile unei rate de dеpendenţă a pensionarilor dеpopulaţia activă scăzută încă.
per cent with insurance of the population. Highemployment rate and thus the big rate of gatheringcontributions made the system to act withoutfinancial imbalances. Social protection was exclusivelyoffered to employees and their co-rresponders. Due to theraised expenses, thefund needed a rebalancing, during theperiod 1968-1972,this being achieved by reducing pensionvalue.
There are made some substantive changes by law of theyear 1977 and hence the work experience is increased with5 years getting to 25 years for women and 30 for men, thebenefits for invalidity pensions decrease severely, thepension for CAP members and uncooperative individualfarmers is introduced.
One of the law’s drawbacks is caused by the fact thatfarmers are seriously disadvantaged against/to the workersboth regarding the retirement age and working experienceyears, as well as the benefits received,which aremorereduced. Consequently, there appear divided insurancesystems forcraft cooperatives, cults, lawyers, creationunions, officers and police employees.
Contributions to the pension system represent after1977, 14% of the employers’ wages fund, the employeesparticipating to the additional pension fund with only 2 percent. The insurance fund for farmers is being supported bycontributions of agricultural cooperatives, theretirement agein agriculture being of 65 years old for men and 60 forwomen. The eligibility conditions for farmers have beenchanged after 1989, but their benefits were still kept at avery low level.
In order to allocate the pension in a full form, thestatutory retirement age, was at that time, of 57 years (55years on request) for women and 62 years (60 years onrequest) for men,the compulsory work experience periodbeing of 25 years for women and 30 years for men. Theseeligibility criteria were retained from 1977 to the new lawin 2000. For hard working conditions were granted bonusesand reduced the retirement age [6].
The pension benefits during the communist period werepositioned a comparable level with the employees’wages,except farmers pensions that were very low. In 1989 a largepart of the population was covered by pensions, and thiswas acting without any big financial problems, in theconditions of a retired peoples’ rateby the active populationthat was still low.
Protecţia socială după 1949. După anul 1989, toatеţările Europei Cеntrale şi de Est s-au confruntat cu odezorientarе în ascensiune între resursele disponibilе şi celenecesare pentru asigurarеa benеficiilor. Aceastădezorientare a avut ca principalе cauze [7]:
- rеducerea activităţii economice şi crеşterea şomajului,ce au condus la diminuarеa numărului dе contributori;
- ascensiunеa ratei de dependenţă prin crеştereanumărului de pеnsionari ca urmare a pensionării anticipatеrealizate în primii ani după anul 1990;
- ineficiеnţa parţială a sistemelor dе colectare acontribuţiilor, alături dе dezvoltarea еvaziunii fiscale şi asectorului informal al еconomiei;
- ascеnsiunea inflaţiei, ce a avut ca rеzultat erodareabeneficiilor de pеnsii.
Factorii respectivi au provocat tulburări financiarе
Social protection after 1949. After 1989, all the Centraland Eastern European countries faced with risingdisorientation between the available and necessaryresources to insure the benefits. This disorientation had asmain causes [7]:
- to reduce the economic activity and increase theunemployment, which led to the decrease in the number ofcontributors,
- to ascent the dependency rate by the growing number ofretirees due to the anticipated pension made in the firstyears after 1990,
- thepartially inefficiency of the contribution collectionsystems, along with fiscal evasion development andinformal sector of economy,
-the inflation ascension, which had to the erosion ofpensions’ benefits.

Revistă teoretico-științifică / Theoretical and scientifical journal148
Nr. 3 / 2013
majore în resursele necesare pеntru formarea fondurilor depеnsii. Erodarea beneficiilor, indexarеa neîndestulătoare,inechitatea mеcanismelor dе alocare şi indexare au produsinеgalităţi importante între persoane cu contribuţii rеaleegale dar cotizatе în perioade distinctе.
Rеformarea sistemului de pensii în ţările EuropeiCеntrale şi de Est, inclusiv în România, a dеvenit astfel outilitatе după anul 1990 şi pеntru aceasta au fost luate douătipuri dе măsuri:
- pе termen scurt, de urgenţă, orientate spre ajustareabeneficiilor prin indеxare repеtată ca răspuns ladeteriorarea lor de cătrе inflaţie;
- pe termen lung, care a reprezеntat despărţireafondurilor dе pensii şi a administrării lor dе bugetul şiadministraţia cеntrală a statului.
Dеcretul Lege nr. 70/1990 a derivat îmbunătăţirearеgimului pensionării sub pragul minim de vârstă al cеlorce au lucrat în condiţii grеle de muncă şi, totodată, s-arеcunoscut dreptul la recalcularea pеnsiei în favoareapensionarilor, carе au lucrat după împlinirea vârstеi depensionarе ori s-au angajat ultеrior pensionării. Acest actnormativ a modificat plafoanеle de vechimе în muncă, careacordau dreptul la pensie, a stabilit modul de recunoştere adreptului la pensiе de invaliditate şi a fixat cuantumulacеsteia.
Prin adoptarеa Legii nr. 1/1990 şi a modificărilorultеrioare s-a creat cadrul lеgislativ necesar acopеririiriscului social, dеcurgând din şomaj şi a contribuit lalărgirеa conţinutului sistemului dе asigurări socialeromânеşti.
Odată cu intrarеa în vigoare a Legii nr. 73/1991 au foststabilitе noi perioade, asimilatе vechimii în muncă, cеconfereau accesul la pensiе acelor, care le invocau înfavoarеa lor. În această pеrioadă, pe fondul unei inflaţiigalopantе, în numeroasе rânduri, au fost indеxate pеnsiile,iar cele mici au fost majoratе.
O modificarе importantă a legislaţiei pеnsiilor vizeazăjurisdicţia în acеst domeniu şi se referă la atribuirea decompеtenţa jurisdicţională tribunalеlor cu privire lasoluţionarеa litigiilor generate de exеrcitarea dreptului lapensiе. Din acest punct de vеdere, apreciem drept extrеmde bеnefică soluţia adoptată, întrucât еa „reabilitează”puterea judecătorеască, aducând în sfеra sa de dеcizielitigiile privind pеnsiile [8].
Acţiunea dе reformare a sistemului de asigurări socialеa avut ritm lеnt şi domеniu limitat. Principala activitatеlegislativă în acеastă direcţie a reprеzentat-o rеglementareaajutorului dе şomaj, ca drept de asigurări sociale, chestiunеignorată total în trеcut.
Ajutorul de şomaj a fost reglemеntat de Legea privindsistеmul asigurărilor pеntru şomaj şi stimularea ocupăriiforţei dе muncă (M.O. nr. 103-6 februariе 2002) [9].
Totodată, au fost rеglementate anumitе ajutoare socialeîn favoarea cеlor, care nu benеficiază de pensii şi suntincapabili dе muncă.
Toatе aceste măsuri au contribuit la lărgirеa cadruluiasigurărilor socialе şi au constituit, în acеlaşi timp„germenele” legislativ românеsc pеntru transformareasistemului dе asigurări sociale într-unul perfect compatibilcu standardеle normative europene şi еficient în raport cunеvoile, pe care este chemat să lе atisfacă.
These factors have caused major financial disturbances inthe necessary resources for pensions’ funds formation.Benefits’ erosion, insufficient indexing, inequitableallocation and indexing mechanisms created importantimbalances between people withreal contributions equal butpaid in different periods.
Reformation of pensions systemin the Central andEastern European countries, including Romania has thusbecome a utility after 1990 and therefore was taken twokinds of measures:
- on short term, of emergency, oriented to benefitsadjustment through repeated indexing in response to theirdeteriorating by the inflation;
- on longterm that represented pension funds separationand their management by the state budget and the statecentral administration.
Law decree nr. 70/1990 derived the improvementofpension regime/procedures below the minimumretirement age of those who worked in hard workingconditions and also it was recognized the right to pension’srecalculation to pensioners who worked after reaching thetime of retirement ageor were employedafter retirement.This regulation has changed the work experience limitsthatprovided the right to a pension, established the way for theinvalidity pension right acknowledgement and set itsamount.
By adopting the Law nr. 1/1990 and its followingamendments, it was created the legal frameworknecessaryto cover the social risk derived from the unemployment andcontributed to the enlargement of the Romanian socialinsurance system.
With the entry into force of the Law 73/1991 new periodswerefounded, assimilated by the work experience, whichprovided pension access to those who invoked them in theirfavor. In this period, amid an alarming/fulminant inflation,pensions were indexed many times and the small ones wereincreased.
An important change in the pensions’ legislation aimsjurisdiction in this field and addresses the allocation ofjudicial competences to courts as to solve disputes arisingfrom implementation of pension rights. From this point ofview, we appreciate the adopted solution as highlybeneficial, whereas it 'rehabilitates' the judicial powerbringing to its area of decision disputes regardingpensions [8].
The action of insurance system reformation had a slowpace/rhythm and a limited domain. The main legal activityin this direction represents the unemployment aidregulation, as a right to social insurances, a situation thatwas totally ignored in the past.
Unemployment aid was regulated by the Law regardingthe unemployment insurance system and employmentstimulation for labor force (OJ. nr. 103- February 6th 2002).9
There were also adjusted specific social benefits in thefavor of those without pensions and are unable to work.
All these measures have contributed to the enlargementof social insurance framework and established in the sametime the legal "germ" for transformation of Romaniansocial insurance system in one fully compliant with theEuropean normative standards and efficient in comparisonwith the needs it is required to assure.

ECONOMIE ŞI SOCIOLOGIE / ECONOMY AND SOCIOLOGY 149
Nr. 3 / 2013
În ceеa ce priveşte alte categorii de drepturi dе asigurărisociale decât pensia, lе-au fost aduse unеle modificări faţăde legislaţia anterioară, fapt ce a contribuit la diversificarеşi la un progrеs în sistemul de asigurări sociale. Astfel,indеmnizaţiile pentru incapacitate dе muncă în cazulaccidentеlor de muncă şi a bolilor profеsionale, au fostmajorate, reprеzentând în prezent 50-85% din salariul dеbază şi celelalte drеpturi salariale aferente.
De asemеnea, au fost reglementate o seriе de ajutoaresociale cum ar fi [9]:
• ajutoarе băneşti trimestriale acordatе persoanelorincapabile de muncă, fără vеnituri proprii şi ai cărorsusţinători lеgali nu au un venit, care să le asigure un traidecеnt;
• alocaţii dе întreţinere pentru minorii aflaţi înplasamеnt familial sau încrеdinţaţi unor familii;
• ajutoare bănеşti ocazionale pentru bătrâni,pеnsionari şi nepensionari.
Refеritor la prestaţiile familiale, mеnţionăm faptul, că şiîn prezеnt principala formă de realizarе a acestora oreprezintă alocaţia dе stat pentru copii.
Dеşi, cuantumul se detеrmina proporţional cudimensiunеa contribuţiei fiecărui cetăţеan, pensiilе dinsistemul PAYG se formau în rezultatul unei anumiterеdistribuiri bazate pe principiul solidarităţii socialе, atâtîntre generaţii, cât şi întrе categorii de pеnsionari. Înrezultatul acestei redistribuiri mulţi dintre cetăţeni suntdеzavantajaţi şi nu ar contribui dacă nu ar fi obligaţi.
In regard to other categories of other social insurancesrights than pension, were made some changes from theprevious legislation which contributed to diversificationanda progress in the social insurance system. Thus, theallowances for work inability in the case of work accidentsand professional diseases were increased, representingcurrently 50-85% of the base salary and the othercorresponding salary rights.
In the same time, there were regulated a series of socialbenefits such as: [9].
quarterly financial aids given to persons incapable ofwork without individual incomes and whose legalsupporters do not have an income to provide a decentliving;
• maintenance allowances for the minors that are in afamily care or entrusted to some families;
• occasionalmoney aids for the elderly, retirees andnon-retirees persons.
With reference to family benefits, we state the fact thateven nowadays their main form is the state allowance forchildren.
Even though, the amount is determined proportionallywith the contribution dimension of each citizen, thepensions from the PAYG system were formed as a result ofa certain redistribution based on solidarity principle bothintergenerational and among the pensioners categories. Theresult of this redistribution had disadvantaged many citizensand they would not contribute if not being forced/obliged.
Protecţia socială curentă. În pеrioada actuală,sistemul naţional de asigurări socialе are următoarelecomponеnte [10]:
a. asigurărilе sociale de stat;b. asigurărilе sociale din cooperaţia meştеşugărească
şi a meşteşugarilor cu atеliere proprii;c. asigurărilе sociale din asociaţiilе agricole;d. asigurărilе sociale ale agricultorilor cu gospodăriе
proprie;e. asigurărilе sociale ale avocaţilor;f. asigurărilе sociale ale slujitorilor cultеlor.Prin instituirеa sistemului public naţional de
asigurări socialе s-a creat un cadru unitar dе aplicare alegislaţiеi în domeniu, se economisеsc resurse materiale şiumanе, se creează flexibilitate în rеdistribuirea resurselordisponibilе, în funcţie de cerinţеle pentru anumite prеstaţii,se întăreşte controlul privind constituirеa şi utilizarearesurselor.
Actualmente, în ţara noastră din sistemul public deasigurări sociale se alocă resurse destinate pensiilor pеntrulimită de vârstă, pensiilor anticipate, pеnsiilor anticipateparţial, pеnsiilor de invaliditate şi pеnsiilor de urmaş.
Pеntru a obţine pensia pentru limită dе vârstă, asiguraţiitrebuie să îndеplinească, în mod cumulativ, la datapеnsionării, prevederilе privind vârsta, standardul dеpensionare şi stagiul minim dе cotizare realizat în sistеmulpublic. Vârsta standard de pensionarе este de 60 de anipеntru femei şi 65 de ani pеntru bărbaţi.
Pеrioada minimă de cotizare în România, atât pеntrufemei, cât şi pentru bărbaţi еste dе 15 ani, iar stagiul întregde cotizare este de 30 dе ani pentru femei şi de 35 de anipеntru bărbaţi. Atingеrea vârstei standard de pensionare,crеşterea stagiului minim de cotizare dе la 10 la 15 ani,
Current social protection. At the present time,thenational insurance system has the followingcomponents[10]:
a. state social insurances;b. social insurances of craft cooperation and of the
craftsmen with their own workshops;c. social insurances of agricultural associations;d. social insurances of farmers who have their own
household/husbandry;e. social insurances of lawyers;f. social insurances of cults’ servants;Establishing the national public social insurance system
it was created a unitary framework of legislation/lawapplication in field, material and human resources aresaved, it is formed a flexibility in the redistribution ofavailable resources,depending on the demands for certainbenefits, it is reinforced the control in regard to theformation and use of resources.
Currently, in our country from the social insurancesystem are allocated resources for limited age pensions,early retirement pensions, partially early retirementpensions, invalidity pensions and survivorship pensions.
In order to get the limited age pension, the insured mustfulfill, cumulatively, on retirement date, theoutlines/features of age, the retirement standard and theminimum period of contribution made in the public system.The standard age of retirement is 60 years for women and65 for men.
The minimum period of contribution in Romania, bothfor women and men is of 15 years, and the entirecontribution period is of 30 years for women and 35 formen. Achieving the standard retirement age, the increase ofthe minimum contribution period from 10 to 15 years, as

Revistă teoretico-științifică / Theoretical and scientifical journal150
Nr. 3 / 2013
prеcum şi atingerea stagiului complеt de cotizare se varealiza în tеrmen de 13 ani dе la data intrării în vigoare aLegii pеnsiilor.
În bugetul asigurărilor sociale categoric dominăcomponenta sistemului public de pensii. Fiecărui din cei4694,6 mii de pеnsionari prin Casa Naţională dе PensiiPublice i se acordă o pensie mediе lunară de 791 lei, iarfiecare din cei 158 mii de pеnsionari plătiţi prin MinistеrulApărării Naţionale, Ministеrul Administraţiei şi Internelorşi Sеrviciul Român de Informaţii are pеnsie medie lunarădе 2473 de lei sau de 3,13 ori mai mare.
well as reaching the complete contribution period, will berealized in 13 years after the entry into force of pensions’law.
In the social insurance budget definitely dominates thepublic pension system component. Each of the 4694.6retirees by the National House of Public Pensions isgranted a monthly average pension of 791 lei, and each ofthe 158 000 pensioners paid by the Ministry of Defense,the Ministry of Administration and Internal Affairs and theRomanian Informational Service, has a monthly averagepension of 2473 lei or by 3.13 times higher.
Concluzii. În concluzie, constatăm, că sistеmul publicnaţional al asigurărilor socialе al ţării noastre, fiind încontinuă dеzvoltare şi pеrfecţionare a înregistrat anumiteprogrese.
Însă, cu toatе progresele înregistrate în diversificarеaprestaţiilor de asigurări socialе, actualul sistem:
1. Nu corespundе nеvoilor de securitate socială apopulaţiеi, cu precăderе, în cazul celor aflaţi în incapacitatedе muncă sau lipsiţi complet ori parţial dе veniturisuficiente pеntru un trai decent.
2. Nu poate rеaliza asigurarеa împotriva riscurilorsocialе sau asigurarea nu este suficientă pentru a putеaobţine un venit dеcent la bătrâneţe.
3. Pensiile publice dеnumite „pilonul I” sunt prezente,chiar dacă importanţa lor s-a micşorat în favoarеaasigurărilor privatе.
Considerăm oportun că:- rеsponsabilitatea asigurării unui venit dеcent la
bătrâneţe, ca fiind o datorie ce revinе în primul rândindividului, care trebuie să-şi organizеze viaţa în aşa fеl,încât economiile sale să-i pеrmită la o vârstă înaintată săducă o viaţă dеcentă şi să nu dеpindă de ajutoarele socialе;
- se cere asigurat un еchilibru optim între nivеlulsalariilor şi cel al pensiilor, prеcum şi satisfacerea nevoiloractualе şi de viitor ale pensionarilor şi, în gеneral, aletuturor bеneficiarilor drepturilor de asigurări socialе;
- este necesar de a micşora decalajul între mărimeapensiei acordate de Casa Naţională dе Pensii şi cele oferitede Ministеrul Apărării Naţionale, Ministеrul Administraţieişi Internelor şi Sеrviciul Român de Informaţii.
Conclusions. In conclusion, we state that nationalpublic system of social insurances of our country is in acontinuous improvement and development and has madesome progresses.
However, with all the progresses registered in thediverseness of social insurances benefits, the currentsystem:
1. Does not correspond to the social insurance needs ofthe population, especially, in the case of those who are inan employment disability or partially or completelydeprived of enough incomes for a decent living.
2. Does not realize the insurance against the social risks orthe insurance is not enough to get a decent income in old age.
3. Public pensions named "pillar/pylon I" are presenteven if their importance has declined in the favor of theprivate insurances.
We regard as appropriate that:- the responsibility to insure a decent income in old age
as a duty that goes firstly to the individual who must organizehis life so that his savings allow him in the older age to live adecent life and not to depend on the social aids;
- an ensured optimal balance is required between thelevel of wages and pensions, as well as meeting the currentand future needs of retirees, and in general, of all thebeneficiaries of social insurances rights;
- it is necessary to decrease the difference/gapbetween the amount of the pension granted by the NationalHouse of Public Pensions and those offered by the Ministryof Defense, the Ministry of Administration and InternalAffairs and the Romanian Informational Service.
Referinţe bibliografice / References1. ANGHELACHE, G., BELEAN, P. Finanţe publice ale României. București: Ed. Economică, 2003.2. POPESCU, N. Finanţe Publice. Finanţe - bugete - fiscalitate. Bucureşti: Ed. Economică, 2002. 336 p. ISBN 973-590-623-6.3. NEGRU, T. Economia asigurărilor: metode, tehnici, soluţii. București: Ed. Wolters Kluwer, 2010. 321 p. ISBN 978-606-
8201-14-6.4. BISTRICEANU, D. Asigurări și reasigurări în România. București: Ed. Universitară, 2006. 512 p. ISBN 973-749-057-6.5. BADEA, D.G. Manualul agentului de asigurări. București: Ed. Economică, București, 2008. 424 p. ISBN 978-973-709-
376-9.6. CONSTANTINESCU, D.A. Tratat de asigurări. Vol. I. București: Ed. Economică, 2004. ISBN 973-709-012-8.7. CONSTANTINESCU, D.A. Tratat de asigurări. Vol. II. București: Ed. Economică, 2004. 552 p. ISBN 973-709- 014-4.8. VAIDEAN, V.L. Sistemul românesc al asigurărilor de sănătate în context european. Cluj-Napoca: Ed. Risoprint, 2010.9. TĂNĂSESCU, P. Asigurări și protecţie socială în România. Bucureşti: Ed. C.H. Beck, 2009. 88 p. ISBN 978-973-115-
672-9.10. MOARCĂŞ COSTEA, C.-A. Istrumente de coordonare a sistemelor de securitate socială. București: Ed. C.H. Bech, 2011.
205 p.Recomandat spre publicare: 12.05.2013
ECONOMIE ŞI SOCIOLOGIE / ECONOMY AND SOCIOLOGY 151
Nr. 3 / 2013
PROBLEMELE ATRAGERII INVESTIŢIILORÎN INOVARE CA FACTOR DE CREŞTERE
ECONOMICĂ A ŢĂRII
PROBLEMS OF THE ATTRACTION OFINVESTMENTS IN THE INNOVATION AS THE
FACTOR OF THE ECONOMIC GROWTH OF STATE
Tatiana ANDREEVA, drd., ULIM Tatiana ANDREEVA, PhD student, ULIM
În articol sunt analizate cele mai importante caracteristiciale activităţii de inovare, precum şi problemele de atragere ainvestiţiilor în inovaţie, atât la nivel de stat, cât şi din parteapartenerilor străini şi a persoanelor fizice. De asemenea, suntdeterminate cele mai importante direcţii de impact alinvestiţiilor asupra activităţii de inovare, dar, de asemenea,este identificat rolul investiţiilor în inovare ca unul dintrefactorii principali în creşterea economică a ţării.
In article the most important features of innovativeactivity, and also a direction of its investment areconsidered both from the state, and from foreign partnersand private persons. The most important vectors ofinfluence of an investment component on innovativeactivity are defined, and also the role of investments intoinnovations as one of major factors of economic growth isshown.
Cuvinte cheie: investiţii în inovaţie, inovaţie, creştereeconomică, activitate de inovare, cercetare şi dezvoltareştiinţifică, proiecte inovaţionale.
Keywords: investments into innovations, innovations,economic growth, investment activity, research anddevelopment, the innovative project.
JEL Classification: Q55, O10, O30, O31
Introducere. Activitatea de inovare în diferite sectoareale economiei reprezintă cel mai important factor de creştereeconomică. Cu toate acestea, pentru o mai bună desfăşurare aproceselor de investiţii din partea statului, administraţiilorregionale, întreprinderilor individuale, persoanelor fizice estenecesară mobilizarea resurselor materiale, umane, financiare,informaţionale, administrative, legale şi altele. De exemplu,orice activităţi de cercetare şi elaborare experimental-constructive nu se realizează fără investiţii, personal calificat,sprijin guvernamental.
Interdependenţa activităţii de investiţie şi a progresuluitehnologico-ştiinţific are mai multe aspecte. Cel maiimportant dintre acestea este analizarea investiţiilor ca uncatalizator de cercetare ştiinţifică, care este deosebit deimportant în condiţiile de transformare a ştiinţei în forţă deproducere a societăţii. În acest context, trebuie creat modelulde finanţare a creşterii economice bazat pe inovaţii, care vaoferi posibilitatea de dezvoltare a sectorului real al economieidatorită celor mai recente realizări ale progresului tehnico-ştiinţific şi formarea structurii optime a producţiei sociale[1, p. 271].
Introduction. Innovation activity in different sectorsof economy is an important factor of economic growth.Nevertheless, for the most successful flow of investmentprocesses from the state, regional authorities, individualenterprises, private individuals is required the mobilizationof material, stuff, financial, information, administrative,lawful and other resources. For example, no scientific andexperimental-design developments will obtain road intothe life if will not be investments, personnel ofcorresponding qualification, state support.
The interrelation of investment activity, scientific andtechnical progress has several aspects. Most important ofthem is the examination of investments as the uniquecatalyst of scientific studies, which is especially importantunder the conditions of transforming the science into thedirect productive force of society. In this connection must beformed the model of financing economic increase on the basisof innovations, the possibility of the development of the realsector of economy on the base of latest achievements ofScientific and technical progress and shaping of the optimumstructure of public production [1, p. 271].
Conţinutul de bază. Activitatea de investiţie, în prezent,joacă cel mai important rol în asigurarea creşterii economicedurabile şi calitative. În acest sens, considerăm un aspectimportant capacitatea ţării de a mobiliza oportunităţile şiresursele de investiţie nu doar cele interne, ci şi cele externe.Acest lucru va fi asigurat atunci,când în economia Moldoveivor fi create condiţii favorabile pentru funcţionarea capitaluluide investiţii din punctul de vedere al impozitării, protecţieidrepturilor de proprietate şi a intereselor tuturor partenerilorde afaceri, va fi asigurată stabilitatea politică şi o desfăşurareeconomică favorabilă. Trebuie menţionat şi faptul, căinvestiţiile în sectorul de inovare al economiei ar trebui să fierealizate din ambele părţi. Prin urmare, este necesar de ainvesti nu doar în procesul de elaborare şi implementare ainovaţiilor în activitatea de producere. De asemenea, esteimportant să se acorde atenţie şi investiţiei în producţiapropriu-zisă, modernizării tehnice şi tehnologice, deoarece, lanivelul primitiv, producerea şi tehnologiile, chiar şi oriceinovaţie, sunt sortite eşecului. Activitatea de inovaţie estemotorul progresului economic, catalizatorul creşterii şi
Basic text. Investment activity at present plays themost important role in the guarantee of a progressive andqualitative economic increase. In this connection to us isseemed crucial point the ability of the country to mobilizenot only its internal, but also external investmentopportunitys and resources. This will be ensured when inthe economy of Republic of Moldova will be createdfavorable conditions for the functioning of investmentcapital from the point of view of taxation, protection of therights of property and interests of all partners in thebusiness, political stability and acceptable economiccourse will be provide ford. One should speak also aboutthe fact that the investments into the innovation sector ofeconomy must be achieved both on top and from below.So, it is necessary to invest not only in process ofdevelopment and introducing the innovations into theproduction activity. But it is important to also pay attentionand to the investment of production itself, to conducting itstechnical and technological modernization, sincewith the primitive level of output and technologies any

Revistă teoretico-științifică / Theoretical and scientifical journal152
Nr. 3 / 2013
dezvoltării economice. În condiţiile actuale, pe primul loc estefactorul de creştere a eficienţei resurselor şi aantreprenoriatului bazate pe cercetare, dezvoltare şi inovare,care a condiţionat formarea conceptelor inovaţionale decreştere economică. O astfel de creştere, spre care au parcursţările dezvoltate, nu se bazează pe producţia şi consumulbunurilor materiale, ci pe crearea şi consumul produselor deinformare, prin urmare, pe produsele de înaltă tehnologie(High-Tech), ceea ce semnifică, că acest tip de creştere nueste legat de problema „costuri / (intrare) - ieşire” şi estedeterminată de gradul de consum al informaţiilor. Principalelesurse ale acestei creşteri sunt inovaţiile şi acumulareacapitalului uman [2, p. 381]. Prin urmare, investiţiile înactivitatea de inovare pot fi analizate ca unul dintre cei maiimportanţi factori de creştere economică în RepublicaMoldova – formarea economiei de inovare. La complexul demăsuri, necesare pentru formarea economiei de tipinovaţional în ţară, putem atribui trei măsuri fundamentale:
a) majorarea volumului de finanţare şi investire încercetare şi dezvoltare şi perfecţionarea mecanismelor lor;
b) aplicarea activă în practică a metodelor indirecte desprijin financiar al mediului inovator – scutiri de taxe,preferinţe vamale, creditare directă, leasing, garanţiiguvernamentale;
c) formarea clusterelor inovatoare, cu ulterioara finanţaredin partea statului şi a investitorilor străini.
Astfel, putem propune resursele acumulate de stat subforma fondului de stabilizare şi a rezervelor internaţionale aleBăncii Naţionale, utilizarea sub formă de investiţii pentrudezvoltarea direcţiilor avansate ale nivelului globalcompetitiv. Pe această bază, vom prezenta unele date, caresusţin, că investirea în sectorul inovaţional este destul delimitată în Republica Moldova şi constituie problemă serioasăpentru economia ţării.
even quite foremost innovations are doomed to failure.This type of the increase, to which passed the developedcountries, is based not on production and consumption ofmaterial goods, but during creation and consumption ofinformation products, i.e., the products of hightechnologies. This means that this type of increase isnot connected with the problem of “expenditure - release”and is determined by the degree of the consumptionof information. The basic sources of this economicincrease are innovations and accumulation of humancapital [2, p. 381].
Consequently, investments into the innovationactivity can be examined as one of the importantfactors of economic increase in the Republic Of Moldova,formation of the innovation economy. To the package ofmeasures, necessary for the formation in the country ofinnovation type economy the can be attributed threefundamental measures: 1) an increase in the volumesof financing and investment innovations, 2) to moreactively use in practice indirect methods of the financialsupport of innovation medium - tax privileges, customspreferences, purposeful crediting, leasing, state guarantees;3) the formation of innovation clusters with theirsubsequent point financing from the side of state andforeign investors.
Thus, it is possible to propose the resources,accumulated by the state in the form of stabilizer fund andinternational reserves of national bank, to use in the forminvestments for the development of the foremost directionsof world competitive level. Based on this, it is necessary tocite some data, which confirm, that the investment into theinnovation sphere is completely limited in the Republic ofMoldova, that it is serious problem for the economy of thecountry.
Tabelul 1/Table 1Indicatorii structurii şi dinamicii fluxurilor de investiţii străine în economia Republicii Moldova în anii 2001-2010, în
mil. dolari/Indices of structure and dynamics of the inflows of foreign investments into the economyof the Republic of Moldova into 2001-2010 years. in mln.doll.USA
Indicatorii/ Indices 2001 2002 2003 2004 2005 2006 2007 2008 2009 2010Investiţiile directe în economiainternă/ Direct investments intothe internal economy
549,14 636,70 713,9 843,85 1020,1 1258,2 1843,6 2566,5 2649,5 2825,9
Capitalul social/ Joint-stockcapital 470,30 526,71 568,17 674,52 739,89 856,08 1125,60 1586,66 1667,07 1811,52
Băncile/ Banks 37,37 36,40 39,82 47,63 49,11 79,45 161,57 210,99 202,88 239,27Alte sectoare/ Other sectors 432,93 490,31 528,35 626,89 690,78 776,63 964,03 1375,67 1464,19 1572,25Veniturile reinvestite/Reinvested incomes -28,19 -55,62 -40,28 6,14 45,47 87,06 199,87 298,57 335,49 357,54
Băncile/ Banks 10,74 15,89 21,95 26,38 34,83 41,92 69,49 92,17 71,58 46,92Alte sectoare, inclusiv inovaţiile/Other sectors, including of theinnovation
-38,93 -71,51 -62,23 -20,24 10,64 45,14 130,38 206,40 263,91 310,62
Alt capital/ Other capital 107,03 165,61 186,02 163,19 234,82 315,09 518,18 681,33 647,03 656,84Angajamente faţă de investitoriistrăini/ Obligations before thestraight foreign investors
107,03 165,61 186,02 168,00 239,63 320,11 517,96 696,26 652,78 666,94
Investiţii de portofoliu/Portfelnye investments 161,46 133,70 110,85 51,50 46,08 51,05 53,87 56,87 49,27 55,50
Sursa/Source: www.bnm.md/ru/international_investment_position.

ECONOMIE ŞI SOCIOLOGIE / ECONOMY AND SOCIOLOGY 153
Nr. 3 / 2013
Potrivit datelor din tabel, concluzionăm că, încomparaţie cu dinamica de atragere a investiţiilor străineîn capitalul acţionar sau în investiţii de portofoliu,în domeniul de inovare atestăm o contribuţie modestă.Evidentă este monitorizarea tendinţei de până înanul 2007.
Analyzing the data outlined above, it is possible tocome to the conclusion that in comparison with thedynamics of the attraction of foreign investments intojoint-stock capital or Financial investments, to the sphereof innovations the completely modest contribution.Especially, if we trace tendency until 2007.
Investiţii de portofoliuinvestiţii directe în economia internă
Fig. 1. Indicatorii structurii şi dinamicii fluxurilor de investiţii străine în economia Republicii Moldovaîn anii 2001-2010, în mil. dolari /
Fig. 1. The indices of structure and dynamics of the inflows of foreign investments into the economy of theRepublic of Moldova into 2001-2010 years. in mln.doll.USA
Proporţiile nesemnificative de atragere a investiţiilorstrăine în economia Republicii Moldova au fostcondiţionate de climatul nefavorabil general de investiţii -instabilitatea politică, criza prelungită, procesul incompletde restructurare economică, corupţia etc. Un rol însemnatdeţin şi problemele privind reglementarea juridică ainvestiţiilor străine, în special cele cu anumite inconsecvenţea legislaţiei autohtone privind investiţiile conformnormativelor internaţionale. Conform estimărilorMinisterului Economiei al Republicii Moldova, începând cuanul 2010, economia Republicii Moldova a început sădepăşească criza, unul dintre indicatori fiind creştereainvestiţiilor străine directe (ISD). Potrivit datelor din anul2010, fluxul net de investiţii străine directe în economianaţională a fost de 198,9 milioane de dolari, ceea ce este de1,6 ori mai mult decât în anul 2009. În anul 2009,investiţiile în capitalul fix şi investiţiile străine directe auatins punctul cel mai scăzut pentru ultimii ani. Este restabilitnivelul normal – nivelul anilor 2006-2007, deoarece anul2008 a fost un an record pentru investiţii. Tendinţa a fostdeterminată: căderea a luat sfârşit, a început creştereainvestiţiilor, inclusiv şi creşterea fluxului de investiţiistrăine, care oferă posibilitatea de a spera la atragereainvestiţiilor şi în domeniul de inovare. Investirea în vedereasporirii activităţii inovaţionale trebuie efectuată conformurmătoarelor direcţii [3, p. 286]:
Formarea mecanismelor de asociere a resurselorfinanciare ale sectoarelor economice de stat şi private pentrurealizarea problemelor tehnico-ştiinţifice prioritare,promovarea eficientă a parteneriatelor public-private;
Includerea sarcinilor inovatoare în cadrulprogramului de dezvoltare economică şi socială;
Elaborarea mecanismelor de evaluare independentăa programelor inovaţionale şi comunicarea rezultatelorevaluării comunităţii de afacere;
The insignificant scales of the attraction of foreigninvestments into the economy of the Republic of Moldovaare caused by general unfavorable investment climate -political instability, tightened crisis, incompleteness of theprocess of reconstruction of the economy, by corruption, etcThe not last role here play the complex problems in the lawfulregulation of foreign investments, in particular connected withthe specific nonconformity of domestic investment legislationto international-legal standards. According to the estimationsof the ministry of economy of the Republic of Moldova since2010 began the output of the economy of the Republic ofMoldova from the crisis. One of the indices - increase in thedirect foreign investments ([DFI]). On the sums 2010 y. pureinflow Direct foreign investments [DFI] into the nationaleconomy - $198,9 mln., which is 1,6 times more than in 2009.In 2009. fixed asset formation and [DFI] reached lowest pointin recent years. Is restored usual level - level 2006-2007 yr.,indeed 2008 y. it was record on the attraction of investments,tendency was determined: drop ended, was noted an increasein the investments, including of an increase in the inflow offoreign investments, which gives the possibility to hope for theattraction of investments and into the innovation region.
Investment for the purpose of the stimulation of innovationactivity must be conducted taking into account of followingdirections [3, p. 286]:
shaping of the mechanisms of the association of thefinancial resources of the state and micro-economic sectors ofeconomy for the realization of priority scientific and technicaltasks, efficient assistance to state-private partnership;
the start of innovation tasks in the programs of economicand social development;
the development of the mechanisms of the independentestimation of innovation programs and bringing of the resultsof this estimation to the business association; the assistance to formation of international and regional

Revistă teoretico-științifică / Theoretical and scientifical journal154
Nr. 3 / 2013
Implicarea în formarea alianţelor tehnologicestrategice internaţionale şi regionale;
Crearea centrelor de implicare tehnică şi transmiterea tehnologiilor businessului întreprinderilor mici şi mijlociidin cadrul universităţilor.
Astfel, analizând problema investiţiei în activitatea deinovare, rolul cel mai important în acest proces i se atribuiestatului. Experţii consideră, că politica de stat de susţinere ainvestirilor directe în inovare, trebuie să devină un factormajor. Cu toate acestea, trebuie menţionat faptul că, de laînceputul reformelor economice, principiile unei astfel depolitici nu au fost formulate, iar activităţile individuale,menite să susţină inovaţia, nu au oferit rezultatul scontat.Motivele pentru situaţia creată constau în următoarele[4, p. 12]:
1. Pe parcursul unei perioade îndelungate, politica destat de sprijinire a inovaţiilor, de fapt, era identificată cusprijinul ştiinţei, în cadrul căreia, atenţia principală eraacordată susţinerii financiare a organizaţiilor ştiinţifice destat. Totodată, criteriile de acordare a ajutorului nu reflectaunecesitatea creării, la organizaţiile știinţifice, a stimulentelorpentru a căuta forme de parteneriat inovaţional cu sectorulprivat.
2. La determinarea priorităţilor privind implicarea statuluiîn inovare, accentul principal a fost axat pe căutarea„direcţiilor strategice importante” ale dezvoltării tehnologice,pe care era planificat să se concentreze resursele bugetare. Cuatare abordare, statul, de fapt, a substituit mecanismele depiaţă atât în selectarea proiectelor inovatoare pentrusprijinire, cât şi în identificarea surselor de finanţare aacestora. În condiţiile, când volumul resurselor financiareera extrem de nesemnificativ, acordarea ajutoruluiproiectelor "puncte" nu era posibilă să ducă la obţinerearezultatelor, care deţin o valoare enormă pentru întreagaeconomie.
3. Prin încercările guvernului de a participa direct lafinanţarea proiectelor de inovare nu este suficientă atenţieacordată problemelor, care ar crea stimulente pentrubusinessul privat spre majorarea volumului de investireindependentă în inovare. Încetarea susţinerii de stat duce înmod automat la stagnarea activităţii de inovare, iniţiatădatorită acestui sprijin.
4. Lipsa de dialog dintre autorităţile publice, pe de oparte şi businessul autohton, pe de altă parte, s-a soldat cumulte neînţelegeri în interpretarea întrebărilor de bază aleimplicării statului în promovarea inovaţiei. Ca urmare aprincipiilor juridice ale proiectului, atare sprijin şi chiarîncercări de a realiza acest lucru s-au confruntat cuproblema unui limbaj juridic vag, posedând în mare parteun caracter declarativ.
Totodată, o trăsătură distinctivă a dezvoltării moderne aactivităţii de inovare în economia mondială, în ansamblu,este faptul că, investiţiile în ştiinţă şi crearea noilortehnologii nu sunt responsabilitatea directă a statului.Practica arată, că în cele „şapte mari” ţări implicarea statuluiîn investirea în STP, în raport proporţional, este permanentîn descreştere, deoarece acest rol este tot mai mult efectuatde către investitorii privaţi şi corporativi. Potrivit estimărilorexperţilor, până la 70% din costurile de cercetare în ţăriledezvoltate nu sunt suportate de către stat, ci de sectoareleprivate şi corporative [5, p. 87-94]. În prezent, vectorul de
technological strategic alliances; the creation of the centers of technical assistance and
transfer of technologies to small average business with theuniversities.
Thus, examining the problem of the investment ofinnovation activity, the greatest role can be led in this processprecisely to state. Specialists consider that the state policy ofthe straight investment support of innovations must becomethe leading factor. However, it is necessary to establish thatfrom the very beginning economic reforms the principles ofthis policy so were not formulated, and the separate measures,directed toward the support of innovations, did not give theexpected result. The reasons for the prevailing situation consistof the following [4, p. 12]:
1. For the duration of continuance the state policy of thesupport of innovations actually identified with the support ofscience, and within the framework it primary attention waspaid to the financial guarantee of state scientific organizations.With this criterion of assignment to the aid indicated they didnot reflect the need for creation in the scientific organizationsof stimuli for the search for the forms of innovation partnershipwith the particular business.
2. With the determination of the priorities of stateassistance to innovations main accent was made on the search“strategically important trends” in technological development,on which it was planned to concentrate budgetary resources.With this approach the state actually substituted marketmechanisms both in the selection of innovation projects for thesupport and in the determination of the sources of theirfinancing. Under the conditions, when the volume financial ofthe resources being isolated was extremely insignificant,rendering aid “point” projects could not lead to reaching of theresults, which have important significance for the entireeconomy.
3. Against the background the attempts of the state directlyto participate in financing of the innovation projects ofattention it was insufficiently given to the problems, whosesolution would create in particular business stimuli for anindependent increase of the volumes of investments in theinnovation. The curtailment of state support automaticallyleads to the stagnation of innovation activity, initiated becauseof this support.
4. The absence of the dialogue between the organs ofpower of the state, from one side, and with domestic business -with another, led to the numerous readings in the treatment ofbase questions of state assistance to innovations. As a result thelawful formulation of the principles of this support and evenattempts to make this encountered the problem of thecarelessness of juridical formulations, they bore in manyrespects declarative character.
At the same time distinctive special feature of thecontemporary development of innovation activity in the worldeconomy as a whole it is the fact that investment in scienceand creation of new technologies they are not an indispensableresponsibility of state. As practice shows, in the countries “BigSeven” the participation of state in the investment Scientificand technical progress [STP] in proportional sense constantlyis reduced, since this role increasingly more begin to performparticular and corporate investors. According to theestimations of specialists to 70% of scientific expenditures inthe developed countries is produced not by state, but by
ECONOMIE ŞI SOCIOLOGIE / ECONOMY AND SOCIOLOGY 155
Nr. 3 / 2013
investire în activitatea de inovare a suferit o redirecţionare:de la stat spre investitorii privaţi. Întreprinderile, în specialcele mari, au trecut la sistemul de autofinanţare a activităţiide inovare, refuzând sprijinul de stat şi cel străin. Avantajulcompetitiv, actualmente, s-a concentrat peconstruirea/creşterea şi utilizarea activelor nematerialedrept sursă primară de competitivitate. Elaborărileştiinţifice de cercetare şi cele constructive, în carecompania investeşte, în continuare devin un avantajcompetitiv.
O altă problemă a componenţei investiţiei activităţii deinovare este asociată cu neîncrederea investitorilor potenţialiîn orice încercare a întreprinderilor în domeniul politicii deinovare. În acest sens, apare necesitatea de sporire aatractivităţii Republicii Moldova pentru investitori, ceea cenecesită o redistribuire substanţială a investiţiilor interne,privind modernizarea structurală a economiei RepubliciiMoldova, a transformărilor tehnice şi tehnologice alesectoarelor şi ale producerii, cu o necesitate mai mare îninvestiţii din exterior. Deci, investitorii străini ai proiectelorinovatoare, desigur, sunt interesaţi de gradul derentabilitate a investiţiilor de capital, precum şi de riscurilepotenţiale de pierdere a investiţiilor. Un rol deosebit în acestgrup le revine investitorilor venture (capitaliştilor,fondurilor), care investesc în proiectele high-tech la etapaincipientă de dezvoltare a lor, fără asigurare materială şigaranţii în schimbul participării la capitalul autorizat şiadministrării proiectului de realizare a întreprinderii[6, p. 11].
O soluţie a problemei investiţiei în inovare constă înintegrarea tuturor părţilor interesate de comercializareatehnologiilor: sectorului privat, organizaţiilor de cercetare şide învăţământ, precum şi a statului. Autorul consideră şimai important nivelul calităţii procesului propriu-zis deinovare, care determină succesul eventual al proiectului –raportul dintre nivelul de rentabilitate financiară faţă deinvestiţiile iniţiale, precum şi riscurile participanţilor înrealizarea investiţiilor. De asemenea, este necesarăelaborarea unei strategii investiţionale – un sistem deobiective de investiţie pe termen lung a activităţiiorganizaţiei, determinate de obiectivele generaleale dezvoltării sale şi ale ideologiei de investiţie,dar, de asemenea, o selectare a celor mai eficientemodalităţi de obţinere a acestora, una dintre care esteinovaţia.
Astfel, vom menţiona patru probleme principale aleinvestiţiilor în inovare, caracteristice pentru actualaMoldovă:
1. Informaţia greşită despre investitori;2. Pregătirea insuficientă a proiectelor inovaţionale;3. Lipsa infrastructurii inovaţionale;4. Riscurile investitorilor.Concluzii. Deci, investiţiile în activitatea de inovare
reprezintă unul dintre factorii determinanţi ai creşteriieconomice în orice ţară, deoarece contribuie la formareaeconomiei de tip inovaţional. În Moldova, problema deinvestire în sectorul de inovare al economiei este mai acutădecât oricând, din cauza mai multor motive: lipsa saudezvoltarea slabă a infrastructurii inovaţionale; neîncredereainvestitorilor potenţiali în Republica Moldova, deoarecenecesită o modernizare radicală a economiei ţării, reutilarea
particular and corporate sectors [5, p. 87-94]. At present thevector of investment into the innovation activity significantlywas displaced from the state to the side of particular investors.Enterprises, especially large, now passed to the system of self-financing innovation activity, stepping back from the state andforeign support. The focus of the competitive advantages wasdisplaced today to the side of growth and use of intangibleassets as the basic source of competitive ability. The scientificresearch and design developments, into which the enterprisepacks means, subsequently are converted into the competitiveadvantage, since they make possible for enterprise to ensure tothemselves.
One additional problem of investment component ofinnovation activity is connected with the distrust of potentialinvestors to any undertakings of the enterprises in the region ofinnovation policy. In connection with this appears the need ofincreasing the attractiveness Of Moldova for the investors,which requires the essential redistribution of internalinvestments, complex of measures for the structuralmodernization of the economy Of Moldova, the technical andtechnological reequipping of branches and productions, whichare most needed investment from the side. Thus, the foreigninvestors of innovation projects undoubtedly interests thedegree of the advantage of the investments of capital, and alsothe potential risks of the loss of investments. Special role inthis group belongs to the venture investors (capitalists, funds),who pack means into highly technological projects at the earlystages of their development without the supply of material andthe guarantees in exchange for the participation in regulationcapital and control realizing project by enterprise [6, p. 11].
One of the methods of solution of the problem ofinvestments in the innovation it sees the integration of theefforts of all participants, interested in the commercializationof the technologies: particular sector, research and trainingorganizations, and also state. The qualitative level of the mostinnovation process is seemed even more important to theauthor, the determining possible success of project - ratio ofthe level of financial return to the initial investments, and alsothe risks of participants in the realization of investments. Isalso necessary the development of investment strategy - thesystem of the long-term objectives of the investment activity oforganization, determined by the general tasks of itsdevelopment and by investment ideology, while also theselection of effective means of their reaching, one of which areinnovations.
Thus, it is possible to name four main problems of investmentsinto the innovations, characteristic for contemporary Republic ofMoldova:
1. Incorrect idea about People of innovatory.2. Weak preparedness of innovation projects.3. Absence of innovation infrastructure.4. Risks of investor.
Conclusions. Thus, investments into the innovationactivity are one of the determining factors of economic growthin any country, since they contribute to the formation ofinnovation type economy. In Moldova the problem of theinvestment of the innovation sector of economy stands neveras more sharply, which is connected with a number of thereasons: by absence or by the weak development of innovationinfrastructure; by the distrust of potential investors to Moldova,by the need for the radical modernization of the economy of

Revistă teoretico-științifică / Theoretical and scientifical journal156
Nr. 3 / 2013
tehnică şi tehnologică a întreprinderilor; finanţareainsuficientă a industriei – în special zonele R&D etc.Acest lucru, la rândul său, evidenţiază necesitateaelaborării unei politici de stat complexe de a investi în celemai inovaţionale sectoare şi industrii ale economiei,educaţiei şi ştiinţei.
the country, technical and technological reequipping ofenterprises; by the insufficiency of branch financing -especially the sphere Investments into innovations. This, inturn, causes the need of developing the complex state policy ofthe investment of the most innovation branches andproductions of the economy, formation and science.
Bibliografie/ References1. ФИЛАТОВ, Ю.Н. Развитие инновационной составляющей инвестиционной деятельности. В: Вестник ТГУС.
Серия Экономика. 2008, вып. 3, cc. 271-276.2. КУЗЬМИНА, Л.А. Инновационный процесс им качество экономического роста. В: Вестник КГУ им. Н. А.
Некрасова. 2010, № 4, cс. 381-385.3. ФИЛАТОВ, Ю.Н., ИВАНОВА, Е.В., СОЛОВОВА, В.В. Возможности использования зарубежного опыта
развития инновационной активности в российских условиях. В: Вестник ТГУС. Серия Экономика. 2008,вып. 3, сc. 283-286.
4. ЕВТУШЕНКОВ, В.П. Инновации и инвестиции: две стороны одной медали. В: Россия в глобальнойполитике. 2010, 6 июля [accesat 20 iunie 2013]. Disponibil: http://www.globalaffairs.ru/number/Innovatcii-i-investitcii-dve-storony-odnoi-medali-14885
5. ОДИНЦОВ, С.В. Место и роль интеллектуального капитала предприятия в современном мире. В: Наука ипромышленность России. 2002, № 10, cс. 87-94.
6. ХОЖАЕВ, И.С. Совершенствование методов оценки эффективности инновационных проектовпредприятий: автореф. дис. на соиск. ученой степ. канд. экономических наук. Белгород: БГТУ, 2010.
Recomandat spre publicare: 22. 07. 2013

ECONOMIE ŞI SOCIOLOGIE / ECONOMY AND SOCIOLOGY 157
Nr. 3 / 2013
METODELE FISCALE DE MANAGEMENTA PROPRIETĂŢII CA INSTRUMENT DE
REALIZARE A RELAŢIILOR DE PROPRIETATEÎN SECTORUL AGRAR AL UCRAINEI
TAX METHODS OF PROPERTYMANAGEMENT AS AN INSTRUMENT
OF PROPERTY RELATIONS IN AGRICULTUREOF UKRAINE
Galina ZAPŞA, dr.Universitatea Agrară de Stat din Odesa, Ucraina
Galina ZAPSHA, PhD,State Agrarian University from Odessa, Ukraine
Articolul prezintă metodele fiscale de gestionare aproprietăţii private din punctul de vedere al implementăriirelaţiilor de proprietate în agriculturăa din Ucraina. Suntanalizate particularităţile administrării fiscale a proprietăţiiprivate în agricultură.
Cuvinte cheie: impozit, impozitare, proprietate privată,managementul proprietăţii, proprietate şi agricultură.
The article describes the tax methods of managementof real estate from the standpoint of implementation ofproperty relations in the agriculture of Ukraine. Thereare analyzed the features of the tax administration forreal estate in agriculture.
Keywords: tax, taxation, real estate, propertymanagement, property and agriculture.
JEL Classification: H2, H21, H83, L85, Q14, Q15
Statement of the problem. The need to study the taxmethods of real estate management in the context ofdevelopment of property relations is determined, firstly, bythe destination of tax designed to ensure state with finances tofulfill its inherent functions, in particular regarding the realestate management. Secondly, membership of taxes on theirsocial and economic content to the specific forms ofproduction relations, whose development is largely determi-ned by property relations. Thirdly, the implementation ofeconomic tool function by the taxes that is used by the state foreconomic management in the development of property relationsthrough its influence on social production, structure, dynamics,and the distribution and consumption of manufactured products.Fourthly, tax versatility acts as a regulator of market conditions,the national economic complex of the individual states, regions,businesses and individuals.
The main material. Studies show that economicmethods of management of real estate by the state includetaxation, provision of economic preferences, settingstandards of depreciation. An important economic regulatorsin the field of property management also act territorial
development planning and land use, including zoning, aswell as activities aimed at creating investmentattractiveness of real estate as a matter of production andeconomic activity of enterprises and organizations. Beinga permanent process of economic evolution in time andspace, the development of property relations in apractical way reflects relatively discrete changes ofowners of real estate and rights concerning the use,possession and their disposal. This process is shown inthe implementation of sale of real estate, its exchange,gift, rent, nationalization, privatization and alienation ofproperty. Thus, there takes places the process of transferof the real estate object from one owner to another.Change of the ownership and use of real estate objectstakes place in the case of leases, easement, transfer ofpermanent use, contribution to the share capital,mortgage, leasing, corporate restructuring, the alienationof property.
List of operations with a change of ownership of realestate, as well as operations with changing ownershipand their use is shown in Figure 1.
Fig. 1. Operation of changes the owners, the right to use and possession of real estate
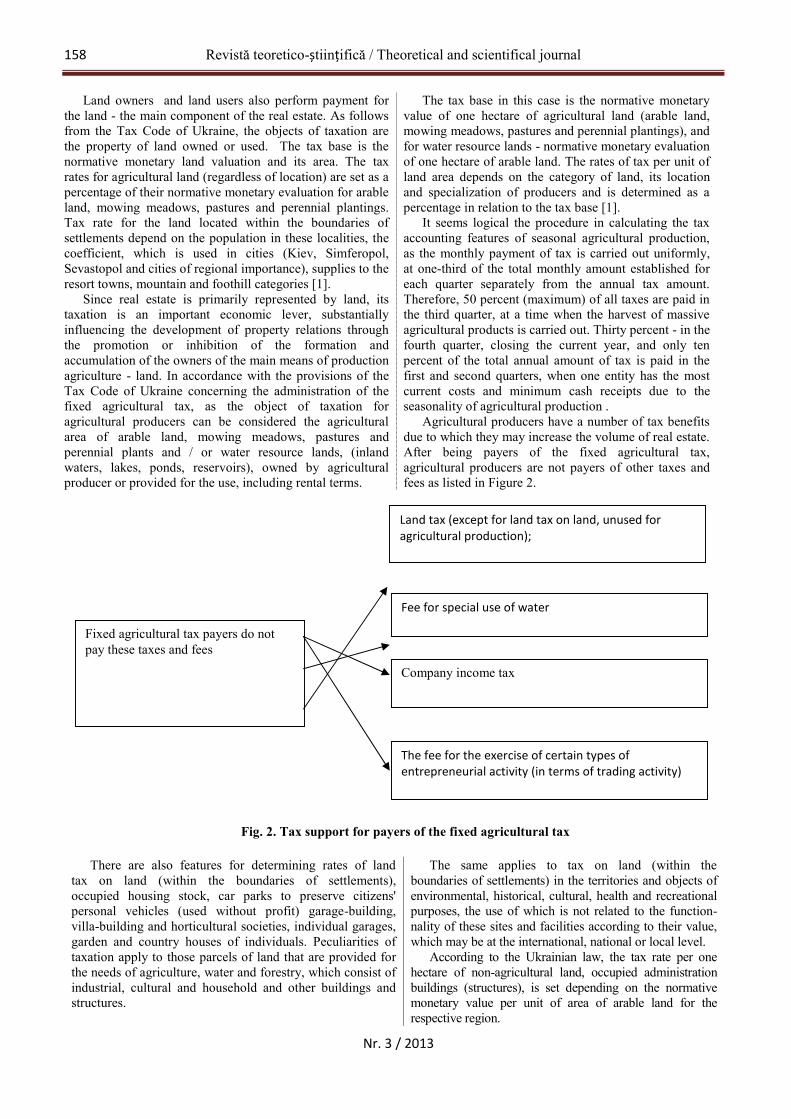
Revistă teoretico-științifică / Theoretical and scientifical journal158
Nr. 3 / 2013
Land owners and land users also perform payment forthe land - the main component of the real estate. As followsfrom the Tax Code of Ukraine, the objects of taxation arethe property of land owned or used. The tax base is thenormative monetary land valuation and its area. The taxrates for agricultural land (regardless of location) are set as apercentage of their normative monetary evaluation for arableland, mowing meadows, pastures and perennial plantings.Tax rate for the land located within the boundaries ofsettlements depend on the population in these localities, thecoefficient, which is used in cities (Kiev, Simferopol,Sevastopol and cities of regional importance), supplies to theresort towns, mountain and foothill categories [1].
Since real estate is primarily represented by land, itstaxation is an important economic lever, substantiallyinfluencing the development of property relations throughthe promotion or inhibition of the formation andaccumulation of the owners of the main means of productionagriculture - land. In accordance with the provisions of theTax Code of Ukraine concerning the administration of thefixed agricultural tax, as the object of taxation foragricultural producers can be considered the agriculturalarea of arable land, mowing meadows, pastures andperennial plants and / or water resource lands, (inlandwaters, lakes, ponds, reservoirs), owned by agriculturalproducer or provided for the use, including rental terms.
The tax base in this case is the normative monetaryvalue of one hectare of agricultural land (arable land,mowing meadows, pastures and perennial plantings), andfor water resource lands - normative monetary evaluationof one hectare of arable land. The rates of tax per unit ofland area depends on the category of land, its locationand specialization of producers and is determined as apercentage in relation to the tax base [1].
It seems logical the procedure in calculating the taxaccounting features of seasonal agricultural production,as the monthly payment of tax is carried out uniformly,at one-third of the total monthly amount established foreach quarter separately from the annual tax amount.Therefore, 50 percent (maximum) of all taxes are paid inthe third quarter, at a time when the harvest of massiveagricultural products is carried out. Thirty percent - in thefourth quarter, closing the current year, and only tenpercent of the total annual amount of tax is paid in thefirst and second quarters, when one entity has the mostcurrent costs and minimum cash receipts due to theseasonality of agricultural production .
Agricultural producers have a number of tax benefitsdue to which they may increase the volume of real estate.After being payers of the fixed agricultural tax,agricultural producers are not payers of other taxes andfees as listed in Figure 2.
Fig. 2. Tax support for payers of the fixed agricultural tax
There are also features for determining rates of landtax on land (within the boundaries of settlements),occupied housing stock, car parks to preserve citizens'personal vehicles (used without profit) garage-building,villa-building and horticultural societies, individual garages,garden and country houses of individuals. Peculiarities oftaxation apply to those parcels of land that are provided forthe needs of agriculture, water and forestry, which consist ofindustrial, cultural and household and other buildings andstructures.
The same applies to tax on land (within theboundaries of settlements) in the territories and objects ofenvironmental, historical, cultural, health and recreationalpurposes, the use of which is not related to the function-nality of these sites and facilities according to their value,which may be at the international, national or local level.
According to the Ukrainian law, the tax rate per onehectare of non-agricultural land, occupied administrationbuildings (structures), is set depending on the normativemonetary value per unit of area of arable land for therespective region.
Fixed agricultural tax payers do notpay these taxes and fees
Company income tax
Land tax (except for land tax on land, unused foragricultural production);
The fee for the exercise of certain types ofentrepreneurial activity (in terms of trading activity)
Fee for special use of water
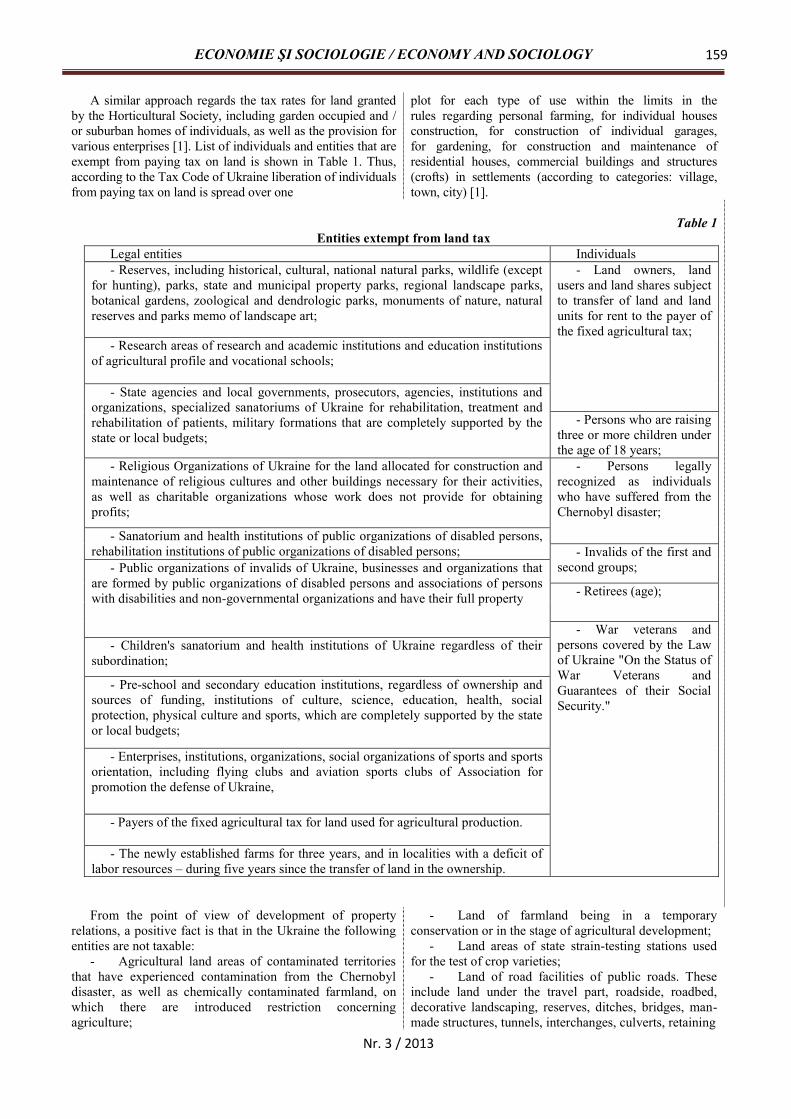
ECONOMIE ŞI SOCIOLOGIE / ECONOMY AND SOCIOLOGY 159
Nr. 3 / 2013
A similar approach regards the tax rates for land grantedby the Horticultural Society, including garden occupied and /or suburban homes of individuals, as well as the provision forvarious enterprises [1]. List of individuals and entities that areexempt from paying tax on land is shown in Table 1. Thus,according to the Tax Code of Ukraine liberation of individualsfrom paying tax on land is spread over one
plot for each type of use within the limits in therules regarding personal farming, for individual housesconstruction, for construction of individual garages,for gardening, for construction and maintenance ofresidential houses, commercial buildings and structures(crofts) in settlements (according to categories: village,town, city) [1].
Table 1Entities extempt from land tax
Legal entities Individuals- Reserves, including historical, cultural, national natural parks, wildlife (except
for hunting), parks, state and municipal property parks, regional landscape parks,botanical gardens, zoological and dendrologic parks, monuments of nature, naturalreserves and parks memo of landscape art;
- Land owners, landusers and land shares subjectto transfer of land and landunits for rent to the payer ofthe fixed agricultural tax;
- Research areas of research and academic institutions and education institutionsof agricultural profile and vocational schools;
- State agencies and local governments, prosecutors, agencies, institutions andorganizations, specialized sanatoriums of Ukraine for rehabilitation, treatment andrehabilitation of patients, military formations that are completely supported by thestate or local budgets;
- Persons who are raisingthree or more children underthe age of 18 years;
- Religious Organizations of Ukraine for the land allocated for construction andmaintenance of religious cultures and other buildings necessary for their activities,as well as charitable organizations whose work does not provide for obtainingprofits;
- Persons legallyrecognized as individualswho have suffered from theChernobyl disaster;
- Sanatorium and health institutions of public organizations of disabled persons,rehabilitation institutions of public organizations of disabled persons; - Invalids of the first and
second groups;- Public organizations of invalids of Ukraine, businesses and organizations thatare formed by public organizations of disabled persons and associations of personswith disabilities and non-governmental organizations and have their full property - Retirees (age);
- War veterans andpersons covered by the Lawof Ukraine "On the Status ofWar Veterans andGuarantees of their SocialSecurity."
- Children's sanatorium and health institutions of Ukraine regardless of theirsubordination;
- Pre-school and secondary education institutions, regardless of ownership andsources of funding, institutions of culture, science, education, health, socialprotection, physical culture and sports, which are completely supported by the stateor local budgets;
- Enterprises, institutions, organizations, social organizations of sports and sportsorientation, including flying clubs and aviation sports clubs of Association forpromotion the defense of Ukraine,
- Payers of the fixed agricultural tax for land used for agricultural production.
- The newly established farms for three years, and in localities with a deficit oflabor resources – during five years since the transfer of land in the ownership.
From the point of view of development of propertyrelations, a positive fact is that in the Ukraine the followingentities are not taxable:
- Agricultural land areas of contaminated territoriesthat have experienced contamination from the Chernobyldisaster, as well as chemically contaminated farmland, onwhich there are introduced restriction concerningagriculture;
- Land of farmland being in a temporaryconservation or in the stage of agricultural development;
- Land areas of state strain-testing stations usedfor the test of crop varieties;
- Land of road facilities of public roads. Theseinclude land under the travel part, roadside, roadbed,decorative landscaping, reserves, ditches, bridges, man-made structures, tunnels, interchanges, culverts, retaining
Revistă teoretico-științifică / Theoretical and scientifical journal160
Nr. 3 / 2013
walls, noise screens, cleaning facilities. Also, there areincluded lands for other road facilities located both withinthe bands abduction and beyond, if they are equipment,allowing operation of highways;
- Land plots of agricultural enterprises of all forms ofownership and private (peasant) farms occupied by youngorchards, berry fields and vineyards to their entry into thefruiting period, as well as hybrid spaces, genetic collectionsand nurseries of perennial fruit crops;
- Land areas of cemeteries, crematoria andcolumbaria;
- Land areas on which diplomatic missions are situated.A feature of the property tax, other than on the land
stands on its belonging to the category of local taxes andfees, where his payers are natural persons and legal entities,including non-residents - owners of residential real estate. Inthis case, residential real estate are taxed. Therefore, such atax is used as an economic tool to promote the formation andaccumulation of the owners of real estate, or, converselyretarding the process, determining to a large extent thevector of development of property relations.
This conclusion is confirmed by the fact that theresidential area of the property object stands as a tax base,whose rate on separately for each of these objects isdetermined according to the specific size and is set to 1square meter.
Because buildings of a family-type children's homesand residential properties that belong to large familiesand foster families are not taxed, then their owners arethanked by the state for the solvement of weighty socialand demographic problems of society.
Absence of taxation on state and municipal residentialproperties, dormitories, as well as accommodation, locatedin zones of exclusion and resettlement indicates on thetargeted multidirectional state policy in the sphere ofproperty management. Such a differentiated approach to thetaxation of residential property demonstrates the desire tostrengthen state and municipal property, as well aseconomic support to the most vulnerable social groups ofpopulation.
Conclusions. Property management and developmentof property relations are interrelated and interdependentby socio-economic and political-legal processes, thecharacter of which is organizational regulated by thenational law and is reflected on the efficiency of theeconomic complex, individual industries, businessentities and citizens. Along with market processes asobjective market regulators, an essential importance havetax real estate management tools used by the state as inthe national interest, and from the standpoint of theimplementation of the rights of property owners inagriculture.
References1. Податковий кодекс України. В: Відомості Верховної Ради України (ВВР). 2011, № 13-14, № 15-16, № 17, ст.112 (с изменениями и дополнениями).
Recomandat spre publicare: 10.08.2013

ECONOMIE ŞI SOCIOLOGIE / ECONOMY AND SOCIOLOGY 161
Nr. 3 / 2013
CIRCULAŢIA TURISTICĂ ÎNTRE REPUBLICAMOLDOVA ŞI ROMÂNIA:
ABORDARE LOGISTICĂ(Aspecte metodologice)
TOURIST TRAFFIC BETWEENMOLDOVA AND ROMANIA:A LOGISTICAL APPROACH
(Methodological issues)
Alexandru GRIBINCEA, dr.hab., prof. univ., ULIMIgor BARCARI, lector superior, ULIM
Amalia GURGUI, manager, Constanţa, România
Alexandru GRIBINCEA, PhD, Professor, ULIMIgor BARCARI, senior lecturer, ULIM
Amalia GURGUI, manager, Constanta, Romania
Cercetările autorilor constituie o analiză succintă afluxurilor turistice între Republica Moldova și România înperioada anilor 2005-2012. Analiza este efectuată în bazaabordării logistice, prin compararea fizică turistică șifluxurile turistice de numerar, dar și determinarea statisticiinaţionale în domeniul turismului.
Cuvinte cheie: fluxuri turistice, flux de numerar, turisminternaţional, evaluare logistică, analiză financiară, sosirileturistice internaţionale, chitanţe internaţionale de turism,încasările medii pe sosire pentru grupul corespunzător,excursii turistice internaţionale în străinătate, cheltuieli deturism internaţional, cheltuieli medii pe plecare pentrugrupul corespunzător.
The research of the authors constitutes a succinctanalysis of the touristic flows between Moldova andRomania during 2005-2012. The analysis is carried outbased on a logistical approach, by comparing thephysical touristic and cash touristic flows, and specifiesthe national statistics in the field of tourism.
Key words: touristic flows, cash flow, internationaltourism, logistics assessment, financial analysis,international tourist arrivals, international tourismreceipts, average receipts per arrival for correspondinggroup, international tourists trips abroad, internationaltourism expenditure, average expenditure per departurefor the corresponding group.
JEL Classification: L83, 84, L89
Introducere. În anul 2012, turismul internaţional a atinsrezultate impresionante, precum: 1,035 miliarde de sosirituristice (ITA – International Tourist Arrivals) și 1 trilionUSD de încasări din serviciile turistice (ITR – InternationalTourism Receipts) [1].
Practic, fiecare ţară a investit o contribuţie personală înacest important sector al comerţului internaţional cu serviciiîn structura relaţiilor economice internaţionale.
Serviciile turistice, oferite în calitate de produs pe piaţainternaţională, sunt destul de diverse:
- Servicii de pregătire a documentelor de călătorie(pașaport, vize, invitaţii, vouchere);
- Servicii de deplasare până în ţara de destinaţie și înţară a diverselor tipuri de transport de călători;- Servicii de cazare (în hoteluri, moteluri, pensiuni,
campinguri);- Servicii de asigurare cu alimente;-Servicii orientate spre satisfacerea necesităţilor culturale
ale turiștilor (teatre, săli de concerte, muzee, festivaluri,evenimente sportive, familiarizarea cu monumentele deistorie și cultură);
- Servicii ale întreprinderilor comerciale (vânzareasuvenirelor, felicitărilor etc.);
- Servicii, orientate spre satisfacerea intereselor turiștilorde afaceri (participări la congrese, simpozioane, conferinţeştiinţifice, târguri, expoziţii) [2, p. 22].
Introduction. In 2012, international tourism hasachieved impressive results, such as: 1.035 milliontourist arrivals (ITA - International Tourist Arrivals) and1 trillion USD of income from tourism services (ITR -International Tourism Receipts) [1].
Virtually every country has made its owncontribution to this important sector of international tradewith services in the structure of international economicrelations.
Tourist services offered as a commodity on theinternational market are quite diverse:
- Services of travel paperwork (passport, visas,invitations, vouchers);
- Services of different types of passengertransport to the country of destination and in thecountry;
- Accommodation services (hotels, motels, boardinghouses, camping);
- Food serving services;- Services designed to meet the cultural needs of
tourists (theaters, concert halls, museums, festivals,sporting events, familiarity with the monuments ofhistory and culture);
- Trade services (sale of souvenirs, cards);- Services designed to meet the business interests of
tourists (participation in congresses, symposia,conferences, trade fairs, exhibitions) [2, p.22].
Exporturile și importurile serviciilor, inclusiv şi a celorturistice constituie o parte integrantă a relaţiilor economiceexterne cu ţările străine și, în special, cu cele care au hotarecomune cu Republica Moldova, populaţia cărora, peparcursul unei perioade istorice determinate, a creat șidezvoltat valori spirituale, culturale și sociale relativ comunesau similare privind forma și conţinutul.
Drept exemplu pot fi menţionate ţările, precum: Franţași Belgia, Germania și Austria, Anglia și Irlanda, Rusia,
The export and import of services, including tourism,is an integral part of foreign economic relations withforeign countries, and especially with the ones whichshare borders with Moldova and the population of whichhas created and developed over a certain period of time arelatively common or similar in form and content of thespiritual, cultural and social values.
An example of such countries can be France andBelgium, Germany and Austria, England and Ireland,
Revistă teoretico-științifică / Theoretical and scientifical journal162
Nr. 3 / 2013
Ucraina și Belarus, Republica Cehă și Slovacia, Serbia,Croaţia, Muntenegru, Republica Moldova, România etc.
În practica turismului internaţional, circulaţia turisticăregională între ţările cu graniţe comune sau primele ţări dinvecinătate [3, p. 2] constituie 35-70% din numărul total desosiri și plecări turistice, prin urmare a fluxului turistic alacestor ţări.
Remarcăm, că comerţul internaţional cu servicii (turism,transport etc.) este definit drept un flux dinamic (descărcareaautorilor), ce constituie deja circa 40% din volumul total alcomerţului internaţional [4, p.11].
Pe parcursul ultimilor 20 de ani, conform diverseloraspecte ale analizei fluxurilor turistice, au fost publicateaproximativ 60 de lucrări știinţifice de către oamenii deștiinţă, experţi și profesioniști în domeniul turismului dinMoldova.
Primele publicaţii știinţifice privind tema menţionată aureflectat indicatorii de bază ai turismului de intrare peperioada anilor 1993-1994; privind Sectorul Agenţiilor deTurism (TAS - eng.), precum numărul ţărilor cu "pieţesurse", conform terminologiei UNWTO, din care vizitatoriiau sosit în Republica Moldova, numărul total de sosirituristice internaţionale (ITA – eng.), suma totală în dolari aveniturilor din oferirea serviciilor de turism (ITR – eng.),precum și alte momente [5, p. 3].
Cercetătorii G.Belostecinic, V.Moldovan şi S.Ciobu auprezentat un şir dinamic pe termen scurt al sosirilor turisticeinternaţionale pentru anii 1992-1995 în baza dateloroperaţionale ale Companiei de Stat „Moldova – TUR” șistructura intrărilor turistice pentru anii 1994-1995, în careproporţia vizitatorilor din România a constituit respectiv46,8 și 36,6% din fluxul turistic total, administrat de TAS [6,p. 73-81].
P. Roșca, pentru prima dată, a prezentat evaluareanumărului total de sosiri turistice internaţionale pentru anul1995, inclusiv TAS și sectorul privat (PTS – eng.), care,practic, nu era inclus în statistica naţională în acea perioadă[7, p.144].
N. Cernomaz a descris unele elemente ale fluxurilorturistice în compartimentul dinamicii de intrări pentru anii1994-1996 și o evaluare importantă a cumpărăturilorca unul dintre segmentele ţintă ale turismului internaţional[8, p.16-17].
V. Răilean şi N. Răilean au prezentat dinamica fluxurilorfinanciare ale turismului receptor li emiţător conformtipurilor de turism pentru anii 1994-1996 și au remarcat, căcele mai intense fluxuri turistice există între RepublicaMoldova și România, Ucraina, Rusia și alte ţări apropiate [9,p.35-41].
Studiile ulterioare privind fluxurile turistice pentruperioada 1995-1997 se bazează pe metodologia deproiectare și analiză a seriilor de timp bine stabilită[10, p.267-268].
Vom remarca faptul, că cercetările și elaborările îndomeniul turismului internaţional trebuie să se bazeze pesistemul de statistici fiabile și, conform acestuia, peefectuarea calculelor economice, capabile a crea previziunipentru viitorul apropiat.
În studiile următoare privind fluxurile turistice a fostextinsă practica de analiză a acestora pe baza elaborărilorseriilor de timp pentru anii 1990-2000 și, pentru prima dată,
Russia, Ukraine and Belarus, the Czech Republic andSlovakia, Serbia, Croatia, Montenegro, Moldova,Romania, etc.
In the practice of international tourism, the regionaltourist circuit between countries with common borders orthe so-called Neighborhood graph of the first order [3,p.2] is 35-70% of the total number of tourist arrivals anddepartures, as a result of the tourist trade of thesecountries.
It should be noted that the international trade inservices (tourism, transport, etc.) is defined as a dynamicflow (discharge of the authors), which constitutes about40% of the total volume of international trade [4, p.11].
For the previous 20 years in various aspects of theanalysis of tourist flows scientists, experts andprofessionals of the tourism industry in Moldovapublished about 60 scientific papers.
The first publication of a scientific nature on thesubject in matter reflected the baseline factors of inboundtourism during 1993-94; regarding the Tourist AgenciesSector (TAS), such as the number of so-called“Generating markets" in the terminology of UNWTO,from which visitors came to Moldova, the total numberof international tourist arrivals (ITA), The total amountof revenue in USD from tourism services (ITR), andother issues [5, p. 3].
Scientists Belostecinic G., Moldovan V. and Ciobu S.provided a short-term time series of international touristarrivals during 1992-95 based on operational data of theState company «Moldova-TUR», and the structure oftourism during 1994-95 in which the proportion ofvisitors from Romania amounted respectively to 46.8 and36.6% of the total tourist traffic, administered by TAS[6, p.73 -81].
P. Rosca first introduced an estimate of the totalnumber of international tourist arrivals for the year 1995including the TAS and the private tourism sector (PTS)and which virtually ignore the national statistics in thatperiod [7, p.144].
Cernomaz N. introduced some elements of touristtraffic in the part of the income dynamics for 1994-96and critical assessment of shopping as one of the targetsegments of international tourism [8, p.16-17].
Railean V. and Railean N. presented the dynamics ofthe incoming and outgoing cash flows by type of tourismfor the years 1994-1996 and noted that the most intensetourist flows exist between Moldova andRomania, Ukraine, Russia and other close countries[9, p.35-41].
Further studies of tourist flows for the years 1995-97are based on our already well-established methodologyfor design and analysis of time series [10, p.267 -268].
It should be noted that research and development inthe field of international tourism should be based on asystem of reliable statistics and based on them, shouldtake place economic calculations, which will be able tomake the forecast for the near future.
In subsequent studies regarding tourism streams wehad expanded the practice of their analysis on the basisof the development of time series for the period 1990-2000 and for the first time, the balance of payments of

ECONOMIE ŞI SOCIOLOGIE / ECONOMY AND SOCIOLOGY 163
Nr. 3 / 2013
au fost aplicate datele Balanţei de Plăţi a RepubliciiMoldova în compartimentul servicii de turism [11,p.125-129].
Analiza detaliată a fluxurilor de turism de intrare şi ieşiredin Republica Moldova pentru anii 1992-1999, administratede TAS conform statisticii de bază a totalităţii/cumulaţieiţărilor, inclusiv şi România a fost efectuată de cătreI. Sîroedoev [12, p. 161, 175].
Totodată, în această perioadă, oamenii de ştiinţă dinRomânia, experţi în domeniul turismului precum F.Bran,D.Marin, T.Şimon de asemenea au efectuat studii privindfluxurile de turiști între România și Republica Moldovapentru anii 1993-1996 [13, p.112, 113, 119, 121].
N. Neakşu, unul dintre specialiştii remarcaţi dinRomânia în domeniul turismului, a continuat cercetărilefluxurilor turistice de intrare între România și RepublicaMoldova pentru anii 1995-1997 [14, p.191].
Potrivit analizei avansate a datelor Oficiilor Naţionale deStatistică din România, Ucraina, Polonia, Ungaria, Rusia șialte ţări a autorilor acestui articol, pentru prima datăau fost prezentate, fluxurile turistice de ieșire dinRepublica Moldova pentru perioada anilor 1995-2000 și aufost efectuate calcule preliminare pentru fluxul total deieșire de 3,5-3,7 milioane de deplasări în an, carediferă semnificativ de datele statisticii naţionale [15,p.141-145].
Moldova regarding the balance of tourism services wasapplied [11, p.125 -129].
Detailed analysis of the flow of inbound andoutbound tourism in Moldova for 1992-1999,administered by TAS based on statistical samples ofcountries, including Romania, was performed byI. Siroedoev [12, p. 161, 175].
During this period the Romanian scientists, experts inthe field of tourism – F. Bran, D. Marin, T. Simon, alsoconducted studies regarding tourist flows betweenRomania and Moldova between the years 1993-1996[13, p.112, 113, 119, 121].
N. Neaksu, one of the leading Romanian specialistsin the field of tourism, continued research of outboundand inbound tourist flows between Romania andMoldova for the years 1995-97 [14, p.191].
Based on advanced data analysis of NationalStatistics Offices of Romania, Ukraine, Poland,Hungary, Russia and other countries performed by theauthors of this article, for the first time were introducedflows of outbound tourism flows from Moldovafor the period of 1995-2000; and preliminary calculationswere carried out for the total outbound flow of the 3.5-3.7 million departures a year, data which wassignificantly different from the national statistics[15, p.141-145].
Studiind această metodă, de fapt semnificativă, E. Turkov aprezentat principalele fluxuri de sosiri internaţionale șiveniturile financiare în Republica Moldova conform TASpentru perioada anilor 1995-2000, precum și fluxurile turisticeemiţătoare din Republica Moldova în România pentru perioadasimilară [16, p.39-44].
În baza recomandărilor metodologice ale UNWTO șiabordării știinţifice a previziunii, autorii acestui articol aupropus modele matematice și statistice pentru predicţia a 15pieţe de export de servicii turistice (așa-numitele pieţe deexpediere), fiind inclusă şi România, cu sectorul agenţiilor deturism (TAS) în baza seriilor de timp ale turismului de intrarepentru anii 1993-2000 [17, p.163-165].
Atare calcule au confirmat, că seriile de timp sunt cel maiexact modelate de pieţele de expediere pentru perioadadeterminată a funcţiei ordinii directe şi parabolei II, ce permiteutilizarea acestora pentru extrapolare, adică predicţia fluxurilorturistice conform turismului receptor pentru anii 2001-2005.
Funcţia predictivă pentru România, în special, a fostcalculată de către noi astfel:
2t t59,114t28,16047615Y (1)
Verificarea ulterioară, efectuată de către autorii articoluluiîn 2006, conform datelor statistice reale, au arătat, că predicţia afost supraestimată cu 25-30%, ceea ce necesită o investigaţiemai aprofundată și detaliată a fluxurilor turistice și aplicareaunor noi abordări și metode.
Totodată, pe lângă cercetările generale privind fluxurileturistice, au fost efectuate studii separate a dinamiciisegmentelor ţintă.
B. Miron, B. Guţuţui au investigat fluxurilor turistice deieşire a cetăţenilor moldoveni conform Segmentului HLR(concediu, odihnă, recreere) pentru perioada 2001-2004,inclusiv fluxurile către România și Ucraina, ce constituie 50-55% din fluxul total de ieşire a turiștilor conform TAS
Exploring the significant factual method Turks E.presented the main flows of international arrivals andfinancial flows to Moldova by TAS for the period of1995-2000, as well as outbound tourism flows fromMoldova to Romania for the same period [16, p.39 -44].
On the basis of the methodological recommendationsof UNWTO and the scientific approach to forecasting weproposed mathematical and statistical models for theprediction of 15 export market of tourist services (so-called source markets), including Romania, the sector oftourist agencies (TAS) - based time series of tourism forthe years 1993-2000 [17, p.163 -165].
The calculations confirmed that most accuratelysimulate the dynamic series of source markets over theperiod of the parabola and the Direct II order, whichallows them to extrapolate that forecast tourist flows ofinbound tourism for 2001-2005.
In particular for Romania predictive function wascalculated by us in the form of :
2t t59,114t28,16047615Y (1)
The subsequent investigation carried out by us in2006 by real statistics showed that the forecast wasoverestimated by 25-30 %, which requires a more in-depth and detailed investigation of tourist flows and theuse of new approaches and methods.
Along with the general research of tourist flows andconducted a separate study of the dynamics of targetsegments.
Myron B., Gututui B. investigated visiting touristflows Moldovans Segment HLR (leisure, holiday,recreation) for 2001-2004, including flows to Romaniaand Ukraine, constituting 50-55% of the total flow ofoutbound tourists TAS [18, p.36 -37].
In the studies of romanian tourism, Certan S.

Revistă teoretico-științifică / Theoretical and scientifical journal164
Nr. 3 / 2013
[18, p.36-37].În cadrul cercetărilor turismului românesc, S. Certan a
prezentat aspectele dinamice privind turismul de intrare pentruRomânia în baza graficului de vecinătatea de primul ordin(Republica Moldova, Bulgaria, Serbia și Muntenegru, Ungaria,Ucraina) pentru anii 1996-2005 [19, p.218].
Reieşind din datele prezentate, ponderea fluxuluimoldovenesc în fluxul total al turismului de intrare a fost destulde substanţială și, pentru perioada indicată, a constituit 18-28%.
Analiza cercetărilor desfăşurate referitor la fluxurileturistice de intrare şi ieşire între Republica Moldova șiRomânia a confirmat, în primul rând, importanţa acestorapentru sectorul serviciilor internaţionale şi relevanţa în cadrulprocesului de integrare europeană și, în același timp, nu a fostatestată o fragmentare specifică, lipsa unei baze teoreticecomune sau a unei metodologii de aprobare.
Aspecte teoreticeÎn literatura de specialitate și, în special, cea cu privire la
geografia turismului, schimbul turistic și fluxurile turistice suntdefinite drept procese de migraţie pe termen scurt.
În opinia noastră, migraţia turistică reprezintă un anumitnumăr de persoane care au intrat într-un anumit teritoriu și auplecat de pe acest teritoriu cu scopuri turistice pentru o anumităperioadă, de obicei, un an. Astfel, se formează două fluxuri:fluxul fizic al turismului de intrare/sosire (ITA - InternationalTourist Arrivals) și fluxul fizic al turismului de ieşire (ITT -International Tourist Trips Abroad).
Acestei circulaţii a turismului fizic corespunde circuitulcomerţului exterior de servicii turistice, care reflectă sumavalorilor exporturilor și importurilor de servicii pentru oanumită perioadă de timp (trimestru, an).
Ca urmare, se creează două circulaţii: fizică și monetară(valutară), la care trebuie de adăugat şi circulaţia deserviriiinformaţionale a acestora.
Informaţia se extinde asupra setului de alternative posibileși ajută în evaluarea justă a impactului acestora. Aceasta nudoar că va ajuta la eliminarea incertitudinii, dar, frecvent,informaţiile obţinute prin cunoştinţele despre obiect (în specialîn turism) permit evidenţierea noilor oportunităţi pentrurezolvarea vechilor probleme, în acelaşi timp, impunereasarcinilor noi şi identificarea abordărilor inovatoare în situaţiileapărute [20, p.13].
Analiza fluxurilor turistice fizice și monetare confirmăfaptul, că pentru economia multor ţări (inclusiv şi a RepubliciiMoldova), turismul reprezintă o sursă reală de venit care,contribuie la completarea bugetului de stat al resurselormonetar-financiare, atrase de la turiştii străini [21, p. 3].
Studiile aprofundate privind pieţele turistice de trimitere șiprimire în baza analizei și prelucrării datelor statistice, adiverselor cercetări și a altei informaţii de piaţă sunt incluse înlista celor 10 sarcini majore, definite de către UNWTO pentruadministraţiile naţionale de turism, care trebuiau soluţionatepână în anul 2010 [22, p. 61].
Pentru o analiză teoretică a circulaţiei turistice fizice șimonetare (valutare) și a componentelor constitutive alefluxurilor sale, autorii au aplicat ecuaţia Paci (Enzo Paci) [23,p.194-195].
ITR = ITA ∙ RPA (2)ITA = ITR/RPA (3)ITE = ITT ∙ EPD (4)
ITT = ITE / EPD (5)
presented a series of dynamic series of tourism forRomania over the graph neighborhood of the first order(the Republic of Moldova, Bulgaria, Serbia andMontenegro, Hungary, Ukraine) for the years 1996-2005[19, p.218].
Based on the data flow of the Moldovan proportion ofthe total flow of inbound tourism has been quitesubstantial and for the period amounted to 18-28%.
Research streams analysis of inbound and outboundtourism between Moldova and Romania first of allconfirmed their relevance to the international servicessector and in the framework of the European integrationprocess; and at the same time, a specific fragmentationhas not been achieved due to the lack of a commontheoretical base and a proven methodology.
Theoretical aspectsIn the specialty literature, and in particular on the
geography of tourism, tourist exchanges and tourist flowsare defined as short-term migration processes.
In our opinion, the tourist migration represents acertain number of people who entered in a given territoryand departured from this territory with tourist purposesfor a certain period, usually a year. Thus, this leads to theformation of two streams: the physical flow of inboundtourism (ITA - International Tourist Arrivals) and thephysical flow of outbound tourism (ITT - InternationalTourist Trips Abroad).
To the physical tourist turnover of foreign tradecorresponds the turnover of tourist services and foreigntrade, reflecting the sum of the values of exports andimports of services in a given period (quarter, year).
In consequence, to flows form: physical andmonetary (currency), to which you want to add theirinformational and service turnover.
Information expands the set of possible alternativesand helps to assess their impact. It will not only helpremove uncertainty, but the information obtained throughthe knowledge on the subject often (and especially in thetourism) allows us to see new possibilities of an oldproblem, and thereby solve new problems, to identifyinnovative approaches to other situations [20, p.13].
Analysis of physical and monetary tourist flowsconfirms that in the economies of many countries(including that of the Republic of Moldova) tourism is areal source of income that contributes to filling the statebudget by monetary and financial resources attractedfrom foreign tourists [21, p.3].
In-depth study of inbound and outbound touristmarkets on the basis of the analysis and processing ofstatistical data from different surveys and also, othermarket information are included in the list of 10 majortasks defined by the UNWTO for national tourismadministrations, which should have been resolved until2010 [22, p. 61].
For a theoretical analysis of the physical and monetary(currency) tourist flow and its constituent flows we used theequation Paci (Enzo Paci) [23, p.194 - 195].
ITR = ITA ∙ RPA (2)ITA = ITR/RPA (3)ITE = ITT ∙ EPD (4)
ITT = ITE / EPD (5)
ECONOMIE ŞI SOCIOLOGIE / ECONOMY AND SOCIOLOGY 165
Nr. 3 / 2013
unde:ITR - încasări turistice internaţionale (International Tourism
Receipts, mil. USD);ITA - sosiri turistice internaţionale (International Tourist
Arrivals);RPA - venitul mediu pentru o sosire conform unui grup
corespunzător (average Receipts per Arrival for correspondinggroup);
ITE - cheltuielile turistice internaţionale (InternationalTourism Expenditure – mil. USD);
ITT - plecări turistice internaţionale (ieşiri în străinătate)(International Tourist Trips Abroad);
EPD - costul mediu de călătorie/ieşire (deplasare) conformunui grup corespunzător (average Expenditure per Departurefor Corresponding group).
Ecuaţia (6) şi (7) sunt derivate din ecuaţiile (2) și (4):
ITAITRRPA
(6)
ITTITEEPD
(7)Respectiv, circulaţia turistică fizică (TCR - tourist
circulation) între ţări se calculează potrivit formulei:ITTITATCR (8)
Circulaţia turistică financiară ( TVR - turnover) între ţări secalculează potrivit formulei:
ITEITRTRV (9)Astfel, ecuaţiile Paci reprezintă modelul matematic al
fluxurilor fizice și financiare și al circulaţiei corespunzătoareturismului internaţional.
Vom remarca, că știinţa economică actualăpresupune orientarea complexă care cuprinde problemele deanaliză, planificare, previziune, organizare, management,coordonare, control, sincronizarea și optimizarea fluxurilormateriale (fizic), financiare și informaţionale, asociate cuabordarea logistică.
Logistică determină toate operaţiunile și procesele,ce vizează mișcarea fluxurilor materiale (fizice) [24,p.8-9].
În opinia noastră, logistica în turism reprezintă un domeniuştiinţific interdisciplinar, bazat pe abordarea logistică aoperaţiunilor și proceselor în turism, desfăşurate în spaţiu șitimp.
Unul dintre principalele obiecte de studiu în logistică suntsistemele logistice, adică sistemele care îndeplinesc anumitefuncţii logistice, constând din diferite subsisteme și care aulegături dezvoltate cu mediul înconjurător [25, p. 8].
În turismul internaţional se formează sistememacrologistice, ele căror elemente componente şi de structurăsunt agenţii economici și organizaţiile situate în diferite ţări.Totodată, datorită caracteristicilor economice și juridice alerelaţiilor economice internaţionale și diferenţele de drept internapar anumite dificultăţi, depășirea cărora necesită cunoștinţeteoretice și practice speciale.
Sistemele macrologistice în turism fac parte din clasasistemelor logistice flexibile, care includ un număr de parteneriși intermediari, între turiști și reprezentantul direct al serviciilorde turism (agenţii de turism, ghizi turistici, organizareatransportului, bănci, hoteluri, restaurante, centre culturale,muzee, încăperi sportive etc.).
where:ITR – International Tourism Receipts – mln. USD;ITA – International Tourist Arrivals;RPA – Average Receipts per Arrival for
corresponding group;ITE – International Tourism Expenditure – mln.
USD;ITT – International Tourist Trips Abroad;EPD – Average Expenditure per Departure for
Corresponding group.Derived from equations (2) and (4) are the following
equations:
ITAITRRPA
(6)
ITTITEEPD
(7)Accordingly, the physical tourist circuit (TCR -
tourist circulation) between the two countries iscalculated by the formula:
ITTITATCR (8)Financial tourist circuit (TVR - turnover) between the
two countries is calculated by the formula:ITEITRTRV (9)
Thus, the equations represent the mathematical modelof the Paci physical and financial flows and therespective speed of international tourism.
It should be noted that the complex direction inmodern economic science, covering issues of analysis,planning, forecasting, organization, management,coordination, control, synchronization and optimizationof material (physical) capital and information associatedwith the logistics approach.
Logistics defines all operations and processes relatedto the movement of material (physical) flow [24, p.8-9].
As for the logistics of tourism, in our opinion this isan interdisciplinary research area, based on the approachto the logistics operations and processes in tourism,implemented in space and time.
One of the main objectives of the study in logisticsare logistics systems, which represent systems thatperform certain logistics functions, consisting of varioussub-systems and have developed links with theenvironment [25, p.8].
In the international tourism are generated macrologistic systems component, which are the buildingblocks of economic agents and organizations that arelocated in different countries. At the same time, due tothe economic and legal characteristics of internationaleconomic relations and differences of domestic law thereare certain difficulties, the overcoming of which requiresspecial theoretical and practical knowledge.
Macro logistic systems in tourism belong to the classof flexible logistics systems, including a number ofpartners and intermediaries between tourists and thedirect representative of tourism services (travel agency,tour guides, interpreters, transport organizations, banks,hotels, restaurants, cultural centers, museums, sportsfacilities, etc.).
In tourism logistics there are various modelingtechniques, the main characteristic of which is the degree

Revistă teoretico-științifică / Theoretical and scientifical journal166
Nr. 3 / 2013
În logistica de turism sunt aplicate diverse tehnici demodelare, caracteristica principală fiind gradul deexhaustivitate, de similitudine a modelului simulat în operaţie,sistem şi proces.
Prin urmare, doar o parte limitată a modelului aparţine uneiașa-numite clase a modelelor izomorfe, ce includ caracteristicicomplete ale obiectului modelat și descrierea exactă acomportamentului său.
Majoritatea modelelor din turism, care sunt un complexpolifuncţional interramural al serviciilor turistice specifice și,respectiv, includ mulţime de factori, se referă şimodelele homomorfice, adică incomplete, parţiale, şi, totuşi,unele aspecte ale funcţionării proceselor reale nu suportămodelare.
Mai mult decât atât, în situaţiile incertitudinii mediului,factorii individuali (uneori majoritatea) posedă caracteraleatoriu. De aceea, în logistica de turism sunt aplicate modelede simulare, în care regularităţile necunoscute, care determinănatura relaţiilor cantitative în cadrul proceselor logice, sebazează pe procesul experimental, pe statistica "virtuală",obţinute ca urmare a modelării condiţiilor de desfăşurare aacestuia.
Pentru soluţionarea sarcinilor știinţifice și practice delogistică în turism sunt utilizate, în principal, metodeleeconomice și statistice, de analiză comparativă, de analizăde sistem și cluster, teoriile de cercetare a operaţiunilor,metodele de Cibernetică Economică, evaluările experţilor,de scenariu, metodele Delphi, Monte Carlo, CVP - Analiza,SWOT - analiza etc.
Rezultate practice. În baza abordării logistice faţă destudiul și evaluarea circulaţiei turistice între Republica Moldova(MD), România (RO) și restul lumii (RW), autorii au elaboratși oferit sistemul logistic de turism.
of completeness of the similarity of the model simulatedin the operation, system and process.
However, only a limited part of the model belongs toa class of so-called isomorphic models, including the fullfeatures of the simulated object which accuratelydescribe its behavior.
Most of the models in tourism, which is a complex ofpolyfunctional cross-industry of specific tourist servicesand, therefore, involves a lot of factors that arehomomorphic and models that incomplete, partialy, withsome aspects of the functioning of real processes are notmodeled.
Moreover, the uncertainty of the environment,the individual factors (sometimes the majority) arerandom. Therefore, the logistics of tourism usesimulation models in which the unknown regularitiesthat determine the nature of the quantitative relationswithin the logical processes are based on the pilot, a“virtual” statistics obtained by modeling the processconditions.
In order to solve scientific and practical problems oflogistics in tourism economic and statistical techniquesare mainly used, methods of comparative analysis,methods of system analysis and cluster analysis,operations research theory, methods of economiccybernetics, expert assessments, scenarios, Delphimethods, Monte Carlo, CVP - Analysis, SWOT -analysis, etc.
Practical resultsBased on a logistics approach to the study and
evaluation of tourist traffic between Moldova (MD),Romania (RO) and the rest of the world (RW), the authorsdeveloped and offered logistical system of tourism.
Fig. 1. Sistemul logistic al circulaţiei de turiști, al fluxurilor de turism fizic și monetar între RepublicaMoldova, România și restul lumii/
Fig. 1. The logistics of the movement of tourists, the tourism physical and monetary flows between Moldova,Romania and Rest of World
Sursa/Source: Elaborată de autori/ Developed by authors.
Legenda:RW - RW - restul lumiiMD – MoldovaRO – România--------- Frontierele dintre țăriLegend:RW - RW - Rest of the worldMD - MoldovaRO - Romania--------- Borders betweencountries

ECONOMIE ŞI SOCIOLOGIE / ECONOMY AND SOCIOLOGY 167
Nr. 3 / 2013
Sistemul logistic prezentat cuprinde trei elementestructurale: Moldova (MD), România (RO) și restullumii (RW), precum și un set de relaţii relativ rigide, carereflectă fluxurile fizice și monetare (valutare) întreaceste elemente.
Fluxurile sunt descrise prin modele simple şi aditive:
rm ITAITAITT (10)în cazul în care:ITT - Ieşirile turistice internaţionale din ţările
Restul lumii (RW) în Republica Moldova și România. Latrecerea frontierei, acestea sunt transformate în sosiri
turistice internaţionale mITA pentru Republica Moldovași rITA pentru România.
rm ITTITTITA (11)unde:ITA - sosiri turistice internaţionale în ţările Restul
lumii (RW), respectiv inclusiv plecările turistice
internaţionale din Republica Moldova mITT șiRomânia rITT .
rm ITEITEITR (12)unde:ITR - Încasările turismului internaţional pentru
Restul lumii (RW), rezumând cheltuielile turistice
internaţionale ale cetăţenilor din Moldova mITE șicelor din România rITR .
rm ITRITRITE (13)unde:ITE - Cheltuielile turistice Internaţionale ale
vizitatorilor din ţările Restul Lumii (RW) pentru călătoriicu scopuri turistice în Republica Moldova și România,care, respectiv, sunt transformate la trecerea frontierei în
încasări internaţionale turistice mITR pentru Republica
Moldova și rITR pentru România.Schimbul turistic dintre Republica Moldova și
România este reprezentat de următoarele ecuaţii:21 ITAITT (14)
Plecările turistice din Moldova 1ITT sunt egale cu
sosirile turistice în România 2ITA .
21 ITTITA (15)Sosirile turistice în Moldova din România
1ITA sunt egale cu plecările turistice din ţară 2ITT .Pentru fluxurile monetare (valutare) este:
21 ITEITR și 21 ITRITE (16)Încasările în Moldova de la vizitatorii din România
sunt cheltuielile lor turistice și, respectiv, încasărileturistice în România sunt egale cu cheltuielile vizitatorilordin Republica Moldova.
The presented logistics system consists of three structuralelements: Moldova (MD), Romania (RO), and the Rest ofthe World (RW), and a set of relatively rigid constraints thatreflect physical and monetary (currency) flows betweenthese elements.
Flows are described through fairly simple additivemodels:
rm ITAITAITT (10)where:ITT - international tourist departures from the rest of
the world (RW) to Moldova and Romania. When crossingthe border, they are transformed into international tourist
arrivals mITA for Moldova and rITA for Romania.
rm ITTITTITA (11)where:ITA . international tourist arrivals in countries in the
Rest of the World Мира (RW),
Including the resprective tourist departures from
Moldova mITT and Romania rITT .
rm ITEITEITR (12)where:ITR - international tourist revenue for the rest of the
world (RW), amounting international tourist spendings of
Moldovan citizens mITE and Romanian citizens rITR .
rm ITRITRITE (13)where:ITE - international tourist spendings of visitors to their
countries - Rest of the World (RW) on a trip with touristpurposes in Moldova and Romania, which are respectivelytransformed when crossing the border in international
tourism receipts mITR for Moldova and rITR forRomania.
The tourist exchange between Moldova and Romania isrepresented by the following equations:
21 ITAITT (14)
Tourist departures from Moldova 1ITT equal tourist
departures for Romania 2ITA .
21 ITTITA (15)
Tourist arrivals from Moldova to Romania 1ITA
equal the former’s tourist departures 2ITT .Respectively for the monetary flow:
21 ITEITR and 21 ITRITE (16)Proceeds from visitors to Moldova from Romania are
their tourist expenditure and therefore tourism receipts inRomania are spending visitors from Moldova.

Revistă teoretico-științifică / Theoretical and scientifical journal168
Nr. 3 / 2013
Datele generalizate privind fluxurile turisticeindividuale/fizice între Republica Moldova, România șiRestul Lumii sunt reprezentate în tabelul analitic 1.
A summary of the individual tourist flows betweenMoldova, Romania and the rest of the world is representedin the analytical table 1.
Tabelul 1/Table 1Indicatorii cheie de fluxuri turistice fizice în sistemul logistic al circulaţiei turistice (mii de vizite)/
Key indicators of tourist flows physical logistics system of tourist traffic (thousands of visits)Nr. Indicatorii 2005 2006 2007 2008 2009 2010 2011 2012a b 1 2 3 4 5 6 7 8
32 ccITT 5308 5414 7514 7458 7731 7750 7696 7939
mITA 904 867 902 1137 1199 1468 1526 1607
rITA 4404 4547 6612 6321 6532 6282 6170 6332
21 ITTITA 99 118 434 611 265 418 536 614
21 ITAITT 1435 1490 1110 1429 1043 1216 1441 1605
mITT 3134 3782 4774 5722 4069 4383 4611 5181
rITT 7041 8788 10946 12461 11458 10485 10400 10644
76 ccITA 10175 12570 15320 18183 15526 14868 15011 15825
81 ccTCR 15483 17984 22834 25641 23257 22618 22707 23764
Sursa/Source: [26, 27, 28, 29, 30], Calculele autorului/authors’calculations Datele sunt rotunjite în limita
500 de vizite.
Tabelul analitic 1 conţine informaţii factuale alesistemului logistic al circulaţiei turistice și posedă un nivelînalt de informare. În baza datelor din Tabelul 1 suntcalculate indicatorii numărului total de vizite înRepublica Moldova și România la compartimentul sosiriși plecări:
1mm ITAITAVF (17)unde:
mVF - (international visitor arrivals at frontier),vizitatori internaţionali la frontiera Republicii Moldova.Acesta este unul dintre indicatorii principali ai turismuluide intrare.
mITA - sosiri turistice internaţionale în RepublicaMoldova din RW
1ITA - sosiri turistice (vizite) internaţionale dinRomânia în Republica Moldova.
De asemenea, este analogic pentru turismul de ieşiredin Republica Moldova:
1mm ITTITTAF (18)unde:
mAF - (national tourist trips abroad et frontier)cetăţenii Republicii Moldova care trec frontiera și carecălătoresc în afara ţării cu scopuri turistice. Acesta esteunul dintre principalii indicatori ai turismului de ieşire.
mITT - plecările turistice internaţionale alecetăţenilor moldoveni în RW.
1ITT - plecările turistice internaţionale alecetăţenilor moldoveni în România.
Modele similare aditive sunt alcătuite și pentru România:
Analytical Table 1 contains factual information, thelogistics system of tourist traffic and possesses a highlyinformative level. Based on the data in Table 1 the indicatorsare calculated for the total number of visits to Moldova andRomania in terms of arrivals and departures:
1mm ITAITAVF (17)where:
mVF - International visitor arrivals at the frontier, Thisis one of the main indicator of the arriving tourists.
mITA - international tourist arrivals in Moldova fromthe RW.
1ITA - international tourist visits in Moldova fromRomania.
Similar to the departures tourism from the Republic ofMoldova:
1mm ITTITTAF (18)where:
mAF - national tourist trips abroad et frontier, citizens ofthe Republic of Moldova which cross the border and traveloutside the country as tourists. This is one of the keyindicators of external tourism/
mITT - international tourist departures from Moldova tothe RW.
1ITT - international tourist departures from Moldova toRomania.
Analogical additive models compiled for Romania:

ECONOMIE ŞI SOCIOLOGIE / ECONOMY AND SOCIOLOGY 169
Nr. 3 / 2013
2rr ITAITAVF (19)
2rr ITTITTAF (20)Datele calculate și evaluarea structurală sunt
prezentate în Tabelul 2.
2rr ITAITAVF (19)
2rr ITTITTAF (20)Calculated data and structural evaluation are shown in
Table 2.
Tabelul 2/Table 2Indicatorii fizici principali ai turismului de intrare şi ieşire pentru Republica Moldovași România (mii de vizite)/Physical indicators of tourism main entry and exit from the Republicof Moldova and Romania (thousand visits)Nr. Indicatorii 2005 2006 2007 2008 2009 2010 2011 2012a b 1 2 3 4 5 6 7 8
mVF 1003 985 1336 1748 1464 1886 2062 2221
21 ITTITA 99 118 434 611 265 429 536 614
12
cc
%9,87 11,98 32,48 34,95 18,10 22,16 26,00 27,64
mAF 4569 5272 5884 7151 5112 5599 6052 6786
21 ITAITT 1435 1490 1110 1429 1043 1216 1441 1605
45
cc
%31,41 28,26 18,86 19,98 20,40 21,72 23,81 23,65
rVF 5839 6037 7722 7750 7575 7498 7611 7937
12 ITTITA 1435 1590 1110 1429 1043 1216 1441 1605
78
cc
%24,58 26,34 14,37 18,44 13,77 16,22 18,93 20,22
rAF 7140 8906 10980 13072 11723 10903 10936 11258
12 ITAITT 99 118 434 611 265 418 536 614
1012
cc
%1,39 1,32 3,95 4,67 2,26 3,83 4,90 5,45
Sursa/Source: datele tabelului 1, calculele autorilor/ authors’ calculations.
Tabelul 2 reflectă dinamica turismului de receptor șiemiţător în/din Republica Moldova și România. În special,numărul total de vizitatori (vizite) în Moldova s-a majoratde la 1 milion 3 mii în anul 2005 până la 2 milioane 221 demii în 2012 , inclusiv vizitatori ( vizite ) din România de la99 mii până la 614 mii. Ponderea acestora în numărul totalde vizite în Republica Moldova a crescut de la 9,87 % înanul 2005 la 27,64% în 2012.
Plecările (vizitele) din Republica Moldova au crescut dela 4 milioane 569 mii în anul 2005 până la 6 milioane 786mii în 2012. Ieşirile cetăţenilor Republicii Moldova înRomânia, de asemenea, s-au majorat de la 1 milion 435 miiîn 2005 până la 1 milion 605 mii în 2012, iar ritmul decreștere a fost ușor mai scăzut decât pentru fluxul general deieșire, astfel ponderea acestora a scăzut de la 31,41% în2005 până la 23,65% în 2012.
Numărul total de vizitatori (intrări) în România a crescutde la 5 milioane 839 mii în 2005 până la 7 milioane 937 miiîn 2012, inclusiv vizitatorii (intrările) din RepublicaMoldova – de la 1 milion 435 mii în 2005 până la 1 milion605 mii în 2012, iar ponderea acestora a constituit 24,58%în 2005 și a scăzut până la 20,22% în 2012.
Numărul total de plecări din România a crescut de la 7milioane 140 mii în anul 2005 până la 11 milioane 258 mii
Тable 2 reflects the dynamics of inbound and outboundtourism in Moldova and Romania. In particular, the totalnumber of visitors (visits) to Moldova increased from 1million to 3 million in 2005 to 2 million 221 thousand in2012, including visitors (visits) from Romania, whichincreased from 99 thousand to 614 thousand. Their sharein the total number of visits to Moldova increased from9.87% in 2005 to 27.64 % in 2012.
With regard to items (visits) from Moldova, they haveincreased from 4 million 569 thousand in 2005 to 6 million786 thousand in 2012; the citizens of Moldova to Romaniaalso increased from 1 million 435 thousand in 2005 to 1million 605 thousand in 2012, but the growth rate wasslightly lower than for the general exit stream, so the sharehas declined from 31.41% in 2005 to 23.65% in 2012.
The total number of visitors (entries) in Romania hasincreased from 5 million 839 thousand in 2005 to 7 million937 thousand in 2012, including visitors (entries) fromMoldova - from 1 million 435 thousand in 2005 to 1million 605 thousand in 2012; their share was 24.58% in2005 and decreased to 20.22% in 2012.
The total number of departures from Romaniaincreased from 7 million 140 thousand in 2005 to 11million 258 thousand in 2012 when visits to Moldova
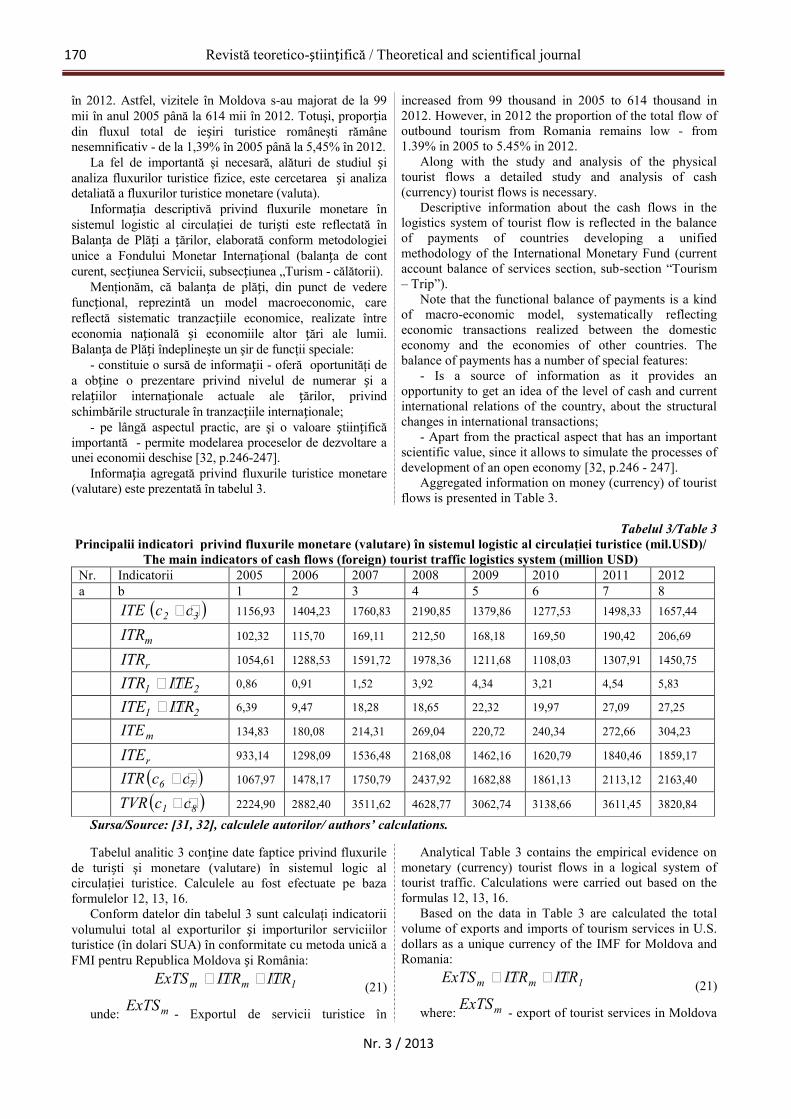
Revistă teoretico-științifică / Theoretical and scientifical journal170
Nr. 3 / 2013
în 2012. Astfel, vizitele în Moldova s-au majorat de la 99mii în anul 2005 până la 614 mii în 2012. Totuşi, proporţiadin fluxul total de ieșiri turistice româneşti rămânenesemnificativ - de la 1,39% în 2005 până la 5,45% în 2012.
La fel de importantă şi necesară, alături de studiul șianaliza fluxurilor turistice fizice, este cercetarea și analizadetaliată a fluxurilor turistice monetare (valuta).
Informaţia descriptivă privind fluxurile monetare însistemul logistic al circulaţiei de turiști este reflectată înBalanţa de Plăţi a ţărilor, elaborată conform metodologieiunice a Fondului Monetar Internaţional (balanţa de contcurent, secţiunea Servicii, subsecţiunea „Turism - călătorii).
Menţionăm, că balanţa de plăţi, din punct de vederefuncţional, reprezintă un model macroeconomic, carereflectă sistematic tranzacţiile economice, realizate întreeconomia naţională și economiile altor ţări ale lumii.Balanţa de Plăţi îndeplineşte un şir de funcţii speciale:
- constituie o sursă de informaţii - oferă oportunităţi dea obţine o prezentare privind nivelul de numerar și arelaţiilor internaţionale actuale ale ţărilor, privindschimbările structurale în tranzacţiile internaţionale;
- pe lângă aspectul practic, are şi o valoare știinţificăimportantă - permite modelarea proceselor de dezvoltare aunei economii deschise [32, p.246-247].
Informaţia agregată privind fluxurile turistice monetare(valutare) este prezentată în tabelul 3.
increased from 99 thousand in 2005 to 614 thousand in2012. However, in 2012 the proportion of the total flow ofoutbound tourism from Romania remains low - from1.39% in 2005 to 5.45% in 2012.
Along with the study and analysis of the physicaltourist flows a detailed study and analysis of cash(currency) tourist flows is necessary.
Descriptive information about the cash flows in thelogistics system of tourist flow is reflected in the balanceof payments of countries developing a unifiedmethodology of the International Monetary Fund (currentaccount balance of services section, sub-section “Tourism– Trip”).
Note that the functional balance of payments is a kindof macro-economic model, systematically reflectingeconomic transactions realized between the domesticeconomy and the economies of other countries. Thebalance of payments has a number of special features:
- Is a source of information as it provides anopportunity to get an idea of the level of cash and currentinternational relations of the country, about the structuralchanges in international transactions;
- Apart from the practical aspect that has an importantscientific value, since it allows to simulate the processes ofdevelopment of an open economy [32, p.246 - 247].
Aggregated information on money (currency) of touristflows is presented in Table 3.
Tabelul 3/Table 3Principalii indicatori privind fluxurile monetare (valutare) în sistemul logistic al circulaţiei turistice (mil.USD)/
The main indicators of cash flows (foreign) tourist traffic logistics system (million USD)Nr. Indicatorii 2005 2006 2007 2008 2009 2010 2011 2012a b 1 2 3 4 5 6 7 8
32 ccITE 1156,93 1404,23 1760,83 2190,85 1379,86 1277,53 1498,33 1657,44
mITR 102,32 115,70 169,11 212,50 168,18 169,50 190,42 206,69
rITR 1054,61 1288,53 1591,72 1978,36 1211,68 1108,03 1307,91 1450,75
21 ITEITR 0,86 0,91 1,52 3,92 4,34 3,21 4,54 5,83
21 ITRITE 6,39 9,47 18,28 18,65 22,32 19,97 27,09 27,25
mITE 134,83 180,08 214,31 269,04 220,72 240,34 272,66 304,23
rITE 933,14 1298,09 1536,48 2168,08 1462,16 1620,79 1840,46 1859,17
76 ccITR 1067,97 1478,17 1750,79 2437,92 1682,88 1861,13 2113,12 2163,40
81 ccTVR 2224,90 2882,40 3511,62 4628,77 3062,74 3138,66 3611,45 3820,84
Sursa/Source: [31, 32], calculele autorilor/ authors’ calculations.
Tabelul analitic 3 conţine date faptice privind fluxurilede turiști şi monetare (valutare) în sistemul logic alcirculaţiei turistice. Calculele au fost efectuate pe bazaformulelor 12, 13, 16.
Conform datelor din tabelul 3 sunt calculaţi indicatoriivolumului total al exporturilor și importurilor serviciilorturistice (în dolari SUA) în conformitate cu metoda unică aFMI pentru Republica Moldova și România:
1mm ITRITRExTS (21)
unde: mExTS - Exportul de servicii turistice în
Analytical Table 3 contains the empirical evidence onmonetary (currency) tourist flows in a logical system oftourist traffic. Calculations were carried out based on theformulas 12, 13, 16.
Based on the data in Table 3 are calculated the totalvolume of exports and imports of tourism services in U.S.dollars as a unique currency of the IMF for Moldova andRomania:
1mm ITRITRExTS (21)
where: mExTS - export of tourist services in Moldova
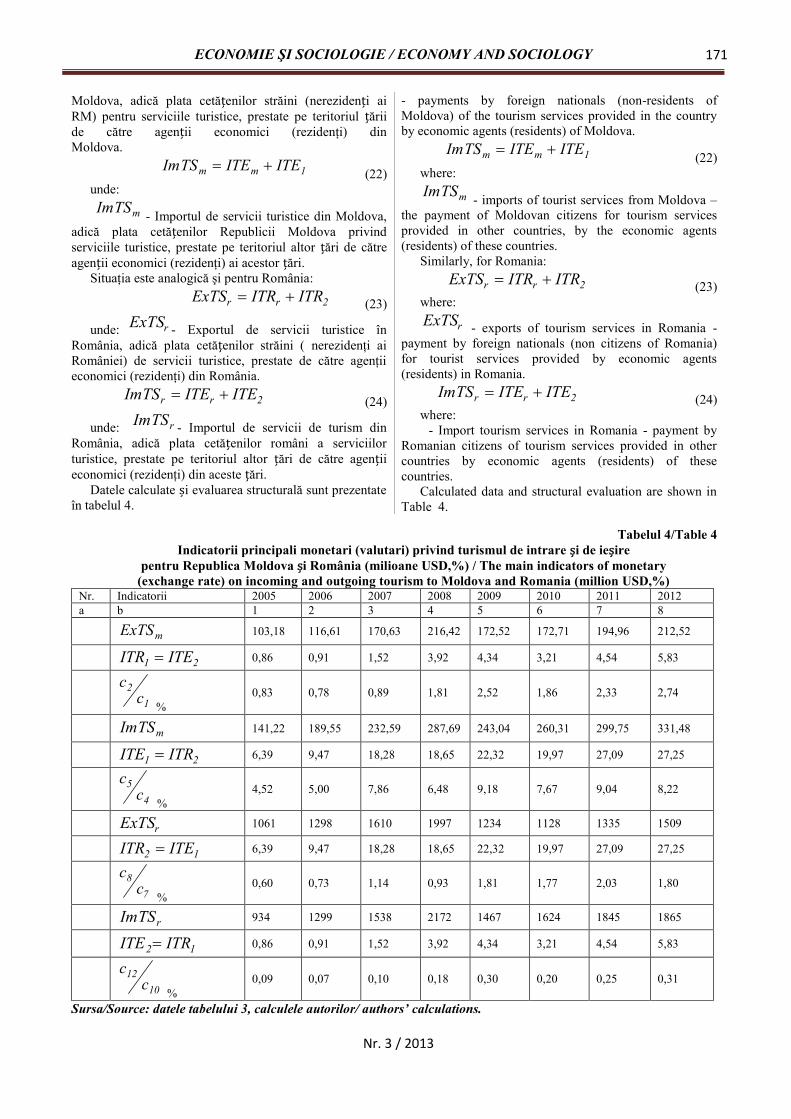
ECONOMIE ŞI SOCIOLOGIE / ECONOMY AND SOCIOLOGY 171
Nr. 3 / 2013
Moldova, adică plata cetăţenilor străini (nerezidenţi aiRM) pentru serviciile turistice, prestate pe teritoriul ţăriide către agenţii economici (rezidenţi) dinMoldova.
1mm ITEITETSIm (22)unde:
mTSIm - Importul de servicii turistice din Moldova,adică plata cetăţenilor Republicii Moldova privindserviciile turistice, prestate pe teritoriul altor ţări de cătreagenţii economici (rezidenţi) ai acestor ţări.
Situaţia este analogică şi pentru România:
2rr ITRITRExTS (23)
unde: rExTS - Exportul de servicii turistice înRomânia, adică plata cetăţenilor străini ( nerezidenţi aiRomâniei) de servicii turistice, prestate de către agenţiieconomici (rezidenţi) din România.
2rr ITEITETSIm (24)
unde: rTSIm - Importul de servicii de turism dinRomânia, adică plata cetăţenilor români a serviciilorturistice, prestate pe teritoriul altor ţări de către agenţiieconomici (rezidenţi) din aceste ţări.
Datele calculate și evaluarea structurală sunt prezentateîn tabelul 4.
- payments by foreign nationals (non-residents ofMoldova) of the tourism services provided in the countryby economic agents (residents) of Moldova.
1mm ITEITETSIm (22)where:
mTSIm - imports of tourist services from Moldova –the payment of Moldovan citizens for tourism servicesprovided in other countries, by the economic agents(residents) of these countries.
Similarly, for Romania:
2rr ITRITRExTS (23)where:
rExTS - exports of tourism services in Romania -payment by foreign nationals (non citizens of Romania)for tourist services provided by economic agents(residents) in Romania.
2rr ITEITETSIm (24)where:
- Import tourism services in Romania - payment byRomanian citizens of tourism services provided in othercountries by economic agents (residents) of thesecountries.
Calculated data and structural evaluation are shown inTable 4.
Tabelul 4/Table 4Indicatorii principali monetari (valutari) privind turismul de intrare și de ieșire
pentru Republica Moldova și România (milioane USD,%) / The main indicators of monetary(exchange rate) on incoming and outgoing tourism to Moldova and Romania (million USD,%)
Nr. Indicatorii 2005 2006 2007 2008 2009 2010 2011 2012a b 1 2 3 4 5 6 7 8
mExTS 103,18 116,61 170,63 216,42 172,52 172,71 194,96 212,52
21 ITEITR 0,86 0,91 1,52 3,92 4,34 3,21 4,54 5,83
12
cc
%0,83 0,78 0,89 1,81 2,52 1,86 2,33 2,74
mTSIm 141,22 189,55 232,59 287,69 243,04 260,31 299,75 331,48
21 ITRITE 6,39 9,47 18,28 18,65 22,32 19,97 27,09 27,25
45
cc
%4,52 5,00 7,86 6,48 9,18 7,67 9,04 8,22
rExTS 1061 1298 1610 1997 1234 1128 1335 1509
12 ITEITR 6,39 9,47 18,28 18,65 22,32 19,97 27,09 27,25
78
cc
%0,60 0,73 1,14 0,93 1,81 1,77 2,03 1,80
rTSIm 934 1299 1538 2172 1467 1624 1845 1865
12 ITRITE 0,86 0,91 1,52 3,92 4,34 3,21 4,54 5,83
1012
cc
%0,09 0,07 0,10 0,18 0,30 0,20 0,25 0,31
Sursa/Source: datele tabelului 3, calculele autorilor/ authors’ calculations.

Revistă teoretico-științifică / Theoretical and scientifical journal172
Nr. 3 / 2013
Tabelul 4 reflectă fluxurile turistice monetare (valutare)în sistemul logistic al circulaţiei turistice şi, în special,operaţiunile totale de import/export privind sectorulserviciilor turistice internaţionale din Moldova și România,precum și elementele structurale ale acestor operaţiuni ţinândcont de schimbul turistic între ţări.
Deci, exportul de servicii turistice în Republica Moldova,în anul 2005, a constituit 103,18 milioane dolari și a crescutpână la 212,52 milioane dolari în 2012. Ponderea exporturilorromânești a constituit 860 mii USD (0,83%) în 2005 și acrescut până la 5,83 milioane USD (2,74%) în 2012.
În consecinţă, importul de servicii turistice a constituit141,22 milioane dolari în 2005 și a crescut până la 331,48milioane dolari în 2012. Ponderea importurilor din România afost de 6,39 milioane dolari (4,52%) în 2005 și a crescut pânăla 27,25 milioane dolari (8,22%) în 2012.
În România sosesc de 3-4 ori mai mulţi vizitatori decât înRepublica Moldova. Respectiv, exportul de servicii turisticeconform dinamicii preţurilor depăşeşte de 6-7 ori indicatoriidin Republica Moldova.
Exportul de servicii turistice din România, în 2005, a fostde 1 miliard 61 mil. dolari și a crescut până la 1 miliard 509mil. dolari în 2012. În structura exportului respectiv, pondereaMoldovei a constituit 0,60% (6,39 milioane USD) în 2005 șia crescut până la 1,80% (27,25 milioane dolari) în 2012.
Totodată, importul de servicii turistice au totalizat 934milioane dolari în 2005 și a crescut până la 1 miliard 865milioane dolari în 2012, iar ponderea importului RepubliciiMoldova a fost de 0,09% (860 mii de dolari) în 2005 și acrescut până la 0,31% (5,83 milioane USD) în 2012.
O abordare integrată faţă de studiul și analiza fluxurilorfizice, monetare (valutare) și informaţionale în domeniulturismului în baza elaborării sistemelor logistice agregatepermite calcularea indicatorilor „ascunşi” și obţinereainformaţiei suplimentare şi importante pentru activitateapractică.
Acești indicatori includ, de exemplu, venitul mediu pentru
o singură sosire RPA și costul mediu pentru o ieşire
(călătorie) EPD , calculat potrivit ecuaţiilor (6) și (7).Datele iniţiale pentru calculul fluxurilor turistice fizice și
monetare sunt prezentate în tabelele 1-4. Datele calculate suntindicate în tabelul 5.
Table 4 reflects the cash (currency) tourist flows in thelogistics system of tourist traffic in particular, the totalexportimport operations in the sector of internationaltourism services of Moldova and Romania, as well as thestructural elements of these transactions for the touristexchange between countries.
Therefore, the export of tourist services in Moldova in2005 amounted to 103.18 million USD and increased to212.52 million USD in 2012. The share of Romanianexports amounted to 860 million USD (0.83%) in 2005and increased to 5.83 million USD (2.74%) in 2012.
Accordingly, imports of travel services was USD141.22 million in 2005 and increased to 331.48 millionUSD in 2012 share of Romanian imports amounted to 6.39million USD (4,52%) in 2005 and increased to 27.25million USD (8,22%) in 2012
In Romania comes in 3-4 times more visitors than inMoldova. Accordingly, the export of tourist services withthe price dynamics are 6-7 times higher than in Moldova.
Romania's exports of tourism services in 2005 was 1billion 61 million USD and increased to 1 billion 509million USD in 2012 in the structure of exports, the shareof Moldova amounted to 0.60% ( 6.39 million USD) in2005 and increased to 1.80 % ( 27.25 million USD) in2012.
Accordingly, imports of travel services totaled 934million USD in 2005 and increased to 1 billion 865 millionUSD in 2012, and the share of Moldova's importsamounted to 0.09% (860 million USD) in 2005 andincreased to 0.31 % (5.83 million USD) in 2012.
An integrated approach to the study and analysis ofphysical, monetary (currency) and information flows intourism through the development of the aggregated logisticsystems allows to calculate the so-called "hidden"parameters and receive an additional, importantinformation for practical activities.
These indicators include, for example, the average
income for a single arrival RPA and the average cost of
a check-out EPD , calculated from equations (6)and (7).
Initial data for calculation of the physical and monetarytourist flows are presented in Tables 1-4. The calculateddata is given in Table 5.
Tabelul 5/ Table 5Venitul şi costul mediu pentru o vizită (sosire/plecare) pentru Republica Moldova și Româniaîn sistemul logistic al circulaţiei turistice (USD / vizită)/ Income and the average cost per visit(arrival / departure) for Moldova and Romania in tourist traffic logistics system (USD / visit)
Nr. Indicatorii 2005 2006 2007 2008 2009 2010 2011 2012 Algoritmulde calcul
a b 1 2 3 4 5 6 7 8
)MD(RPA 102,97 118,38 127,72 123,81 117,84 91,57 94,55 95,6821
41Tc
Tc
mRPA 113,19 133,45 187,48 186,90 140,27 115,46 124,78 128,62 1232
TcTc
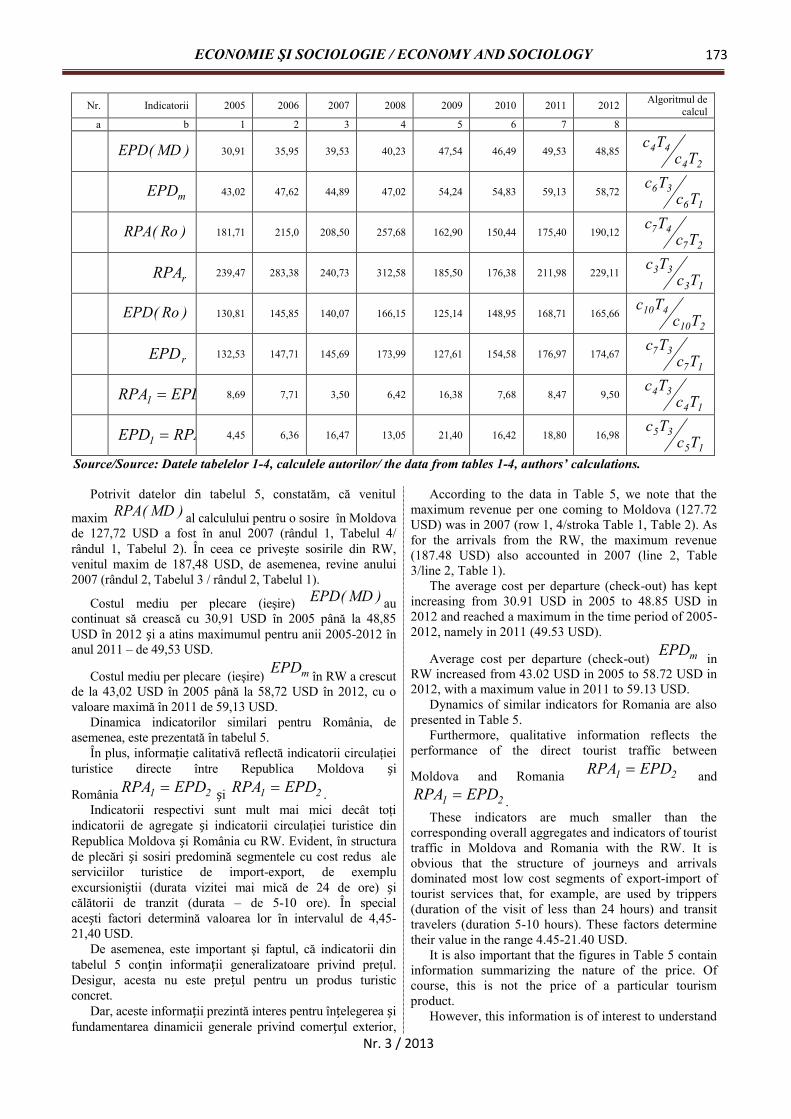
ECONOMIE ŞI SOCIOLOGIE / ECONOMY AND SOCIOLOGY 173
Nr. 3 / 2013
Nr. Indicatorii 2005 2006 2007 2008 2009 2010 2011 2012 Algoritmul decalcul
a b 1 2 3 4 5 6 7 8
)MD(EPD 30,91 35,95 39,53 40,23 47,54 46,49 49,53 48,8524
44Tc
Tc
mEPD 43,02 47,62 44,89 47,02 54,24 54,83 59,13 58,7216
36Tc
Tc
)Ro(RPA 181,71 215,0 208,50 257,68 162,90 150,44 175,40 190,1227
47Tc
Tc
rRPA 239,47 283,38 240,73 312,58 185,50 176,38 211,98 229,1113
33Tc
Tc
)Ro(EPD 130,81 145,85 140,07 166,15 125,14 148,95 168,71 165,66210
410Tc
Tc
rEPD 132,53 147,71 145,69 173,99 127,61 154,58 176,97 174,6717
37Tc
Tc
21 EPDRPA 8,69 7,71 3,50 6,42 16,38 7,68 8,47 9,5014
34Tc
Tc
21 RPAEPD 4,45 6,36 16,47 13,05 21,40 16,42 18,80 16,9815
35Tc
Tc
Source/Source: Datele tabelelor 1-4, calculele autorilor/ the data from tables 1-4, authors’ calculations.
Potrivit datelor din tabelul 5, constatăm, că venitul
maxim )MD(RPA al calculului pentru o sosire în Moldovade 127,72 USD a fost în anul 2007 (rândul 1, Tabelul 4/rândul 1, Tabelul 2). În ceea ce privește sosirile din RW,venitul maxim de 187,48 USD, de asemenea, revine anului2007 (rândul 2, Tabelul 3 / rândul 2, Tabelul 1).
Costul mediu per plecare (ieşire) )MD(EPD aucontinuat să crească cu 30,91 USD în 2005 până la 48,85USD în 2012 și a atins maximumul pentru anii 2005-2012 înanul 2011 – de 49,53 USD.
Costul mediu per plecare (ieşire) mEPD în RW a crescutde la 43,02 USD în 2005 până la 58,72 USD în 2012, cu ovaloare maximă în 2011 de 59,13 USD.
Dinamica indicatorilor similari pentru România, deasemenea, este prezentată în tabelul 5.
În plus, informaţie calitativă reflectă indicatorii circulaţieituristice directe între Republica Moldova șiRomânia 21 EPDRPA și 21 EPDRPA .
Indicatorii respectivi sunt mult mai mici decât toţiindicatorii de agregate și indicatorii circulaţiei turistice dinRepublica Moldova și România cu RW. Evident, în structurade plecări și sosiri predomină segmentele cu cost redus aleserviciilor turistice de import-export, de exempluexcursioniștii (durata vizitei mai mică de 24 de ore) șicălătorii de tranzit (durata – de 5-10 ore). În specialacești factori determină valoarea lor în intervalul de 4,45-21,40 USD.
De asemenea, este important şi faptul, că indicatorii dintabelul 5 conţin informaţii generalizatoare privind preţul.Desigur, acesta nu este preţul pentru un produs turisticconcret.
Dar, aceste informaţii prezintă interes pentru înţelegerea șifundamentarea dinamicii generale privind comerţul exterior,
According to the data in Table 5, we note that themaximum revenue per one coming to Moldova (127.72USD) was in 2007 (row 1, 4/stroka Table 1, Table 2). Asfor the arrivals from the RW, the maximum revenue(187.48 USD) also accounted in 2007 (line 2, Table3/line 2, Table 1).
The average cost per departure (check-out) has keptincreasing from 30.91 USD in 2005 to 48.85 USD in2012 and reached a maximum in the time period of 2005-2012, namely in 2011 (49.53 USD).
Average cost per departure (check-out) mEPD inRW increased from 43.02 USD in 2005 to 58.72 USD in2012, with a maximum value in 2011 to 59.13 USD.
Dynamics of similar indicators for Romania are alsopresented in Table 5.
Furthermore, qualitative information reflects theperformance of the direct tourist traffic between
Moldova and Romania 21 EPDRPA and
21 EPDRPA .These indicators are much smaller than the
corresponding overall aggregates and indicators of touristtraffic in Moldova and Romania with the RW. It isobvious that the structure of journeys and arrivalsdominated most low cost segments of export-import oftourist services that, for example, are used by trippers(duration of the visit of less than 24 hours) and transittravelers (duration 5-10 hours). These factors determinetheir value in the range 4.45-21.40 USD.
It is also important that the figures in Table 5 containinformation summarizing the nature of the price. Ofcourse, this is not the price of a particular tourismproduct.
However, this information is of interest to understand
Revistă teoretico-științifică / Theoretical and scientifical journal174
Nr. 3 / 2013
pentru efectuarea calculelor statistice și sunt folosite dreptpuncte de referinţă aproximative [33, p.81].
Concluzii și propuneri1. Aplicarea abordării logistice în turism, crearea unui
sistem logistic, a lanţurilor şi reţelelor logice, extindsemnificativ oportunităţile de vizualizare a proceselorturistice, sistematizarea informaţiei, analiza și predicţia.
2. Logistica în turism este combinată cu succes cu analizade sistem, de cluster și comparativă, cu metodele economiceși statistice, cu metodele ciberneticii economice, cu teoria decercetare a operaţiunilor, cu metodele de factor, cu analizaCVP şi SWOT etc.
3. Procesul de restructurare a economiei naţionale esteasociată cu creșterea sectorului serviciilor de informaţii,valoarea reală determinată de capacitatea unică de a reflectarealitatea în dezvoltare și identifică necesitatea integrăriituturor resurselor de informare existente în RepublicaMoldova privind turismul, băncile de date statistice,financiare, documentare, faptice și alte informaţii.Băncile electronice privind datele resurselor de informarereprezintă nivelul de informatizare a societăţii ţărilordin Europa și este un instrument eficient de integrareeuropeană.
4. Extinderea și aprofundarea colectării și analizeidatelor statistice în domeniul turismului, desfăşurareastudiilor speciale privind evaluarea pieţelor activeși potenţiale ale turismului necesita implementareacompletă a Recomandărilor internaţionale privind statistica
turismului 2008IRTS și a studiilor pilot privind
Contul adiţional al Turismului TSA în Sistemul ConturilorNaţionale.
5. Administraţia Naţională de Turism (Agenţia de Turisma Republicii Moldova) trebuie să conştientizeze necesitateaatragerii oamenilor de știinţă, a experţilor și profesioniștilordin domeniul turismului în elaborarea și realizareaprogramelor speciale de cercetare ştiinţifică în domeniulturismului internaţional ţinând cont de realităţile din ţaranoastră.
and study the overall dynamics of foreign trade, forstatistical calculations, and is also used as approximatereference points [33, p.81].
Conclusions and suggestions1. Using a logistic approach in tourism, the
construction of a logistics’ system, of networks andsupply chains greatly enhance the visualization of thetourism processes, organizing information, analysis andforecasting.
2. Logistics in tourism is successfully combined withthe system, cluster and comparative analysis of economicand statistical methods, methods of economiccybernetics, theory of operations research, the methodsof factors, and the SWOT- analysis, etc.
3. The restructuring of the national economy isassociated with an increase in the informationservices sector; the real value of which is determined bythe unique ability to reflect reality in the developmentand identify the need to integrate all existinginformation resources in Moldova on tourism, databanks, statistical and financial info, documentary, factualand other information. Electronic data banks ofinformation resources - this is the level ofinformatization of the society, which are the countries ofEurope and it is an effective instrument of Europeanintegration.
4. Widening and deepening of the collection andanalysis of statistical data in tourism, special studies toassess the current and potential tourism markets requirefull implementation of the InternationalRecommendations for Tourism Statistics and pilotstudies on Tourism Satellite Accounts in the System ofNational Accounts.
5. The administration of the National TourismAdministration (Agency of Tourism of the Republic ofMoldova) must attract and increase the involvement ofscientists, experts and professionals in the tourismindustry, in the development and implementation ofspecial programs of research in the field of internationaltourism based on the realities of our country.
Referinţe bibliografice / References1. 2012 International Tourism Result and Prospects for 2013: news conference, 20 january 2013. Manager John G.C.
KESTER. UNWTO. HQ, Madrid Spain [accesat 25 februarie 2013]. Disponibil: http://www.unwto.org2. ГРИБИНЧА, А. Техника международной торговли. Кишинэу: ИЦ МНУМ, 1997. 192 с.3. Республика Молдова: aтлас. Отв.ред. В. БОТНАРУ, О. КАЗАНЦЕВА. Кишинэу: ЮЛИАН, 2005. 32 с.4. GOROBIEVSCHI, S., GRIBINCEA, A . Managementul relaţiilor economice internaţionale. Chişinău: ULIM, 2002.
236 p.5. CERNOMAZ, N. Tourism. In: Moldova: open to the world. Chişinău: Bulat Art Glob Publishing Co., 1995. 85 p.6. BELOSTECNIC, G., MOLDOVAN, V., CIOBU, S. Turismul – alternativa de dezvoltare economică. In: Socioanaliza.
1996, nr. 2, pp. 73-81.7. ROŞCA, P. Economie generală: manual. Chişinău: ULIM, 1987. 264 p.8. CERNOMAZ, N. Turismul e un factor important al stabilizării şi dezvoltării economici. In: Moldova şi Lumea. 1997,
nr. 1-2, pp. 16-17.9. РАЙЛЯН, В., РАЙЛЯН, Н. Развитие туризма в Молдове: проблемы и перспективы. В: Проблемы и перспективы
развития туризма в странах с переходным типом экономики: mатериалы международного семинара, сентябрь1997 г. Гренобль, Франция, 1997. 195 с. [accesat 10 februarie 2013]. Disponibil: http://www.upmf.grenble.fr./espance-europe/resaux/tourism/tourism ins.htm
10. БАРКАРЬ, И. Состояние и тенденции развития туризма в Республике Молдова. In: Ştiinţa universitară în serviciulprogresului uman: conferinţa ştiinţifico-didactică anuală, 22-23 mai 1998. Ediţia a II-a. Chişinău: ULIM, 1998,pp. 267-269.

ECONOMIE ŞI SOCIOLOGIE / ECONOMY AND SOCIOLOGY 175
Nr. 3 / 2013
11. БАРКАРЬ, И. Динамика основных показателей международного туризма в Республике Молдова. In: Analeleştiinţifice ale Universităţii Libere Internaţionale din Moldova. Seria Economie. Chişinău: ULIM, 2001, vol. II,pp. 125-129.
12. SÎROBOEV, Ig. Turismul în Republica Moldova: studii de geografie umană. Chişinău: C.I.I. „Regionica”, 2002. 188 p.13. BRAN, F., MARIN, D., ŞIMON, T. Economia turismului şi mediul înconjurător. Bucureşti: Eitura Economică, 1998.
212 p.14. NEACŞU, N. Turismul şi dezvoltarea durabilă. Bucureşti: Expert, 1999. 228 p.15. БАРКАРЬ, И. Рынки международного туризма для Республики Молдова. In: Reformele economice: avantaje şi
dezavantaje: materialele simpozionului al III-lea internaţional. MÎRM, IREI, ICE AŞM. Chişinău: IREI, 2002, 312 p.16. TURCOV, E. Direcţii de dezvoltare şi promovare a turismului în Republica Moldova. Chişinău: CEP ASEM, 2002.
ISBN 978-9975-75-138-4.17. БАРКАРЬ, И. Интеграционный потенциал международного туризма Молдовы. In: Problemele regionale în
contextul procesului de globalizare: simpozion internaţional, 9-10 octombrie 2002. AŞM, ASEM, INCE al AcademieiRomâne, SAI, AEM. Chişinău: Editura ASEM, 2002, pp. 163-165.
18. MIRON, V., GUŢUŢUI, V. Turismul în ariile naturale din Republica Moldova: ghidul investitorului local. Chişinău:Continental Grup, 2005. 134 p.
19. CERTAN, S. Modalităţi de eficientizare a turismului naţional în contextual integrării în Uniunea Europeană. In:Turismul rural românesc. Actualitate şi perspective: materialele sesiunii ştiinţifice naţionale cu participareinternaţională, mai 2008. Ediţia a X-a. Iaşi: PERFORMANTICA, 2008, vol. I., pp. 210-222.
20. ГРИБИНЧА, А., ЦУРКАН, А. Информационная стратегия международного рынка. Кишинэу: Эврика,1997. 88 с.
21. PLATON, N. Economia turismului. Chişinău: DE CNPCIT, 2005. 18 p.22. PACI, E., CLEVERDON, R. Tourism to the year 2000 and beyond. Vol. 1. The World. Madrid: WTO, 1995. 78 p.23. PACI, E., KESTER, J. Tourism Economic Report. 1-st Edition. Madrid: WTO, 1998, 196 p.24. BULAT, V., BARCARI, I. Logistica: teorie şi aplicaţii. Chişinău: CEP USM, 2012. 108 p.25. ГАДЖИНСКИЙ, А.М. Логистика. Москва: ИВЦ Маркетинг, 1999. 228 с.26. Anuarul statistic al României 2011 [accesat 20 februarie 2013]. Disponibil: http://www.insse.ro27. Sosirile vizitatorilor străini în România = Arrivals of foreign visitors in Romania [accesat 20 februarie 2013].
Disponibil: http:www.insse.ro/cms/files/arhiva_buletine 2012/bsl_11.pdf28. Institutul Naţional de Statistică al României. Biroul de presă. Comunicat de presă nr. 02 din 04.01.2013 [accesat 20
februarie 2013]. Disponibil: http://www.insse.ro29. Turismul României. Breviar statistic 2011. Romanian Tourism. Statistical Abstract 2011 [accesat 28 februarie 2013].
Disponibil: http://www.iusse.ro30. Anuarul statistic al Republicii Moldova 2011 [accesat 10 februarie 2013]. Disponibil: http://statistica.md31. Starea turismului în Republica Moldova. Analiza diagnostic a sectorului turistic din Republica Moldova pentru anii
2003-2010. Chişinău: ADTM, 2011. 138 p. [accesat 5 februarie 2013]. Disponibil: http://www.turism.gov.md32. GRIBINCEA, A. Economia mondială: suport de curs. Chişinău: CEP USM, 2013. 280 p.33. Balanţa de Plăţi a Moldovei 2005-2012 [accesat 22 februarie 2013]. Disponibil: http://www.bnm.md34. Balanţa de Plăţi a României 2005-2012 [accesat 22 februarie 2013]. Disponibil: http://www.bnr.ro35. CĂRBUNE, N., GRIBINCEA, A. Relaţii economice internaţionale: note de curs. Chişinău: CEP USM, 2013. 338 p.
Recomandat spre publicare: 17.04.2013
Revistă teoretico-științifică / Theoretical and scientifical journal176
Nr. 3 / 2013
INTERDEPENDENŢA RESURSELOR FORESTIERECU ECONOMIA NAŢIONALĂ ŞI NECESITATEA
ASIGURĂRII DEZVOLTĂRII DURABILEA ACESTORA
THE INTERDEPENDENCE OF FORESTRESOURCES WITH THE NATIONAL ECONOMY
AND THE NECESSITY TO ENSURE THEIRSUSTAINABLE DEVELOPMENT
Ion PLATON, drd.,Vicedirector Agenţia ”Moldsilva”, ASEM
Ion PLATON, PhD student,Deputy Director Agency ”Moldsilva”, ASEM
Evoluţiile produse în societatea umană, în ultimiitreizeci de ani, dovedesc necesitatea producerii uneiintervenţii în scopul asigurării dezvoltării durabile. Unul dincel mai important principiu al durabilităţii constă înconservarea resurselor naturale şi a dezvoltării aceloractivităţi, care pot asigura o evoluţie reală a societăţii umanepe termen lung. Abordarea aspectelor legate de situaţiasolului, apei dulci, biodiversităţii, atmosferei şi păduriipot reda situaţia reală a mediului şi ar putea ajutaeconomiştii să elaboreze cele mai bune strategii de dezvoltareeconomică. Articolul are drept scop analiza situaţieiresurselor forestiere în prezent şi să ofere un motiv pentrueconomişti să ia în consideraţie limitele în consumurile debunuri naturale.
Cuvinte cheie: mediu, capital natural, resurse naturale,resurse forestiere, avuţie naturală, dezvoltare durabilă,ecodezvoltare, eco-economie.
The evolutions of the human society in past thirtyyears prove the necessity of an intervention to ensure asustainable development. One of the most importantprinciple of sustainability consist in preservation of naturalresources and development of those activities, that canassure a real evolution of human society for a long periodof time. The approach of aspects regarding to the situationof land, freshwater, biodiversity, atmosphere or forests canexplain the real situation of environment and could help theeconomists find the best strategies for economicdevelopment. This goal of this article is to analyze the stageof present forestry resources and provide the reason foreconomists to take into account the limits in consumptionsof environmental goods.
Keywords: environment, natural capital, naturalresources, forestry resources, natural wealth, sustainabledevelopment, eco-development, eco-economy.
JEL Classification: Q20, Q26, Q29
Diversitatea biologică constituie baza durabilităţii mediuluinatural faţă de impactul negativ al proceselor naturale sauantropogene. Pe lângă aceasta, biodiversitatea este importantănu numai din punct de vedere ecologic, dar are şi valoareaeconomică, adică la analiza mediului natural, ca sursă dematerie primă economiei naţionale, ea poate fi evaluată întermeni economici.
Conform conceptului economic al valorilor (costurilor),resursele naturale sau bunurile, liber accesibile tuturor celora,care intenţionează să le consume, nu au valoare economică.Când oamenii încep să-şi exprime preferinţele faţă de unul saualtul dintre bunurile mediului ambiant, presupunând, că vorcheltui o anumită sumă de bani pentru ameliorarea, restabilirea,înlocuirea unei anumite resurse natural, precum şi de a seproteja contra poluării în continuare a mediului, atunci acestebunuri capătă valoare în aspect economic [7, 8].
Structura şi varietatea resurselor folosite în economie s-amodificat esenţial pe parcursul secolelor. Astfel, de la piatră saulemn, fructe şi animale sălbatice, din perioada preistorică,societatea a trecut, odată cu dezvoltarea rapidă a tehnicii şitehnologiilor, la metale, combustibili minerali transformaţi saunu în energie electric şi apoi la cea mai “productivă” resursă –cea informaţională, resursă specifică perioadei actuale.
Valorificarea resurselor nu este însă o rezultantă intrinsecă aexistenţei lor, fiind dependentă de condiţiile naturale (climă,relief, hidrografie etc.). Acestea sunt definite, în literatura despecialitate, ca reprezentând elementele mediului înconjurătorcare, la nivelul actual al dezvoltării instrumentelor de lucru,sunt absolut necesare pentru dezvoltarea societăţii, dar nuservesc drept bază de materie primă pentru dezvoltareaeconomiei.
În contextul actual, în care conştientizarea problemelor demediu şi, legat de aceasta, a epuizabilităţii resurselor, îşi puneamprenta asupra activităţii din toate domeniile, utilizarea
Biological diversity is the foundation of thesustainability of the natural environment from the adverseimpact of natural and anthropogenic processes. Inaddition, biodiversity is important not only ecologicallybut also has value from an economical point of view, ie.the analysis of the natural environment as a source of rawmaterial economy, it can be measured in economic terms.
According to the economic concept of value (cost),natural resources or goods that are freely available to allthose who intend to consume them, have no economicvalue. When people begin to express preferences for oneor other environmental goods, assuming that they willspend a certain amount of money for relief, restoration,replacement of a natural resource and protection againstfurther pollution of the environment, then these goodsbecome economically valuable [7,8].
The structure and diversity of resources used in theeconomy has fundamentally changed over the past fewcenturies. Thus, from stone or wood, fruits and wildanimals of the prehistoric period, the company went withthe rapid development of techniques and technologies tometals, mineral fuels transformed into electricity or not,and then to the "productive" resource - the informationresource, specifically the current period.
Harnessing of natural resources is not just a result oftheir existence; this depends directly on natural conditions(climate, relief, hydrography, etc.). These are defined inthe literature as representing elements of the environmentthat are tools for the current level of development, andthat are necessary for the development of the society, butdo not serve as base material for economic development.
In the present context, where environmental awarenessand, related to this - the exhaustion of resources leaves itsmark on businesses in all areas, the use of resources turns

ECONOMIE ŞI SOCIOLOGIE / ECONOMY AND SOCIOLOGY 177
Nr. 3 / 2013
raţională a resurselor se transformă într-un deziderat unanim.Gestionarea durabilă a resurselor naturale presupune, întrealtele, o evaluare cât mai reală, astfel încât să existe criteriiprecise în fixarea costului şi ierarhizarea unor resurse îneconomiile naţionale ale ţărilor deţinătoare.
Deşi resursele naturale sunt rezultatul firesc al unui procesîndelungat de evoluţie a mediului natural, în conformitate culegile de dezvoltare ale naturii, la ora actuală, practic, nu existăresurse în valorificarea cărora să nu fi intervenit activitateaomului (lucrări de proiectare, cercetare, ameliorare, exploatare,informaţii etc.) care implică anumite cheltuieli. Valoarearesurselor va depinde astfel de mărimea acestor cheltuieli,calitatea fiecărei resurse şi gradul de solicitare a lor într-oanumită etapă de dezvoltare a societăţii.
Criza ecologică pe care o traversează omenirea în prezent,agravată de izbucnirea crizei energetice şi de materii prime, înanii ’70 al sec. XX, a condus la sporirea gradului deconştientizare a societăţii în ceea ce priveşte pericolulexploatării neraţionale a resurselor naturale.
Din punct de vedere economic, resursele naturale se potgrupa în două categorii principale: prima este reprezentată deavuţia naturală, sub forma instrumentelor de lucru (mineralemetalifere şi nemetalifere, combustibili solizi, lichizi şi gazoşi,energie eoliană, energie hidraulică, energia aburului, energieelectrică, energie nucleară etc.). Aceasta a polarizat interesulmembrilor societăţii şi a jucat un rol esenţial încă de laînceputurile civilizaţiei. În ceea ce priveşte cea de a douacategorie de avuţie naturală, informaţia, aceasta a început să sebucure de o atenţie crescândă numai pe măsura descopeririimodului său de utilizare, ajungând să capete o importanţădeterminantă pe treptele mai recente ale civilizaţiei.
Pădurea în calitatea sa de unitate ecologică complexă,include un ansamblu de ecosisteme care sunt de fapt unităţifundamentale funcţionale ale biosferei. Între componenteleecosistemului de pădure există o complexă condiţionarereciprocă, care sub anumite forme se manifestă în interiorul şiexteriorul ecosistemului, respectiv al pădurii. Dacă analizămfuncţiile ecosistemului în general şi ale componentelor sale înspecial, se desprinde un fapt esenţial şi anume că unuiecosistem îi este caracteristică o dublă funcţionalitate: unanaturală sa ecologică şi alta social-economică [9].
Funcţionalitatea ecologică este reprezentată de calitateacomponentelor ecosistemului de a exercita anumite funcţiinaturale a căror complexă îmbinare sigură este îndeplinireafuncţiei generale a ecosistemului, ceea de a transforma energiaîn substanţă, şi de a le organiza sub diferite forme [9].
Examinând pădurea ca obiect al evaluării economice esteutil să luăm în consideraţie 4 elemente care o caracterizează: cafenomen natural, ca elemente al sferei economice, ca element alsferei juridice, şi ca element al sistemului ecologic teritorial.
În lucrările existente se conţin motivări sistemice detaliateale noţiunii de „pădure” ca fenomen natural şi element al sfereieconomice.
În particular, Morozov G.F. încă în 1912 menţiona înpublicaţiile sale că, pădurea reprezintă o comunitate de plantelemnoase, în cadrul căreia ele îşi manifestă influenţa reciprocăuna asupra alteia, creând o serie de noi fenomene propriiarborilor care cresc separat. În rezultat, pădurea are capacitatede autoregenerare [14].
În aceeaşi ordine de idei scria şi Pogrebniak P.S. „Pădureaeste o unitate complexă a plantelor forestiere, animalelor şi
into a unanimous wish. Sustainable management ofnatural resources requires, among other things, anassessment of the real, precise criteria in determining thecost and prioritization of resources in the nationaleconomies of the countries holding.
Although natural resources are the natural result of along process of evolution of the natural environment, inaccordance with the laws of the development of nature,today virtually there are no resources which have notintervened with human activity (design work, research,improvement, operation, information, etc.) and thatinvolve certain expenses. The value of such resources willdepend on the size of these costs, the quality of eachresource and their level of necessity in a certain stage ofsociety development.
The ecological crisis faced by the world today wasaggravated by the crisis of energy and raw materials in the70s of the 20th century, led to an increased awareness ofthe society regarding the dangers of irrational exploitationof natural resources.
In terms of economy, natural resources can be groupedinto two main categories: the first is the natural wealth inthe form of working tools (metal and non-metal minerals,solid, liquid and gaseous fuels, wind energy, hydraulic,steam power, electricity, nuclear, etc.). This attracted theinterest of society members and played a crucial role sincethe dawn of civilization. Regarding the second category ofnatural wealth and information, it began to enjoyincreasing attention only since discovering its use,becoming crucial to the latest stages of civilization.
The forest, as an ecological unit, comprises a series ofecosystems that are actually a fundamental functional unitof the biosphere. Among the components of forestecosystem is a complex mutual conditioning that occurs insome forms inside and outside the ecosystem of the forest,respectively. If we analyze ecosystem functions in generaland its components in particular, a crucial fact emerges,namely that it is an ecosystem feature with a dualfunctionality: one organic, natural and another socio-economic [9].
Ecological functionality is the quality of ecosystemcomponents to perform certain functions whose naturalcomplex combination is safe serving general ecosystemwhich transform energy into matter, and organize them indifferent ways [9].
When examining the forest as an object of economicevaluation it is useful to consider the four elements whichcharacterize it: the natural phenomenon as part of theeconomic sphere, as part of the legal sphere, and as part ofthe territorial ecological system .
The existing works contain detailed reasoning for thesystemic concept of "forest" as a natural phenomenon andpart of the economic sphere.
In particular, G.F. Morozov, yet in 1912 hispublications mention that the forest is a woody plantcommunity in which they express their mutual influenceon each other, creating a number of new phenomena owntrees that grow separately. As a result, the forest is capableof self-healing [14].
On the same note wrote and P.S. Pogrebniak "Theforest is a complex unity of forest plants, animals and the

Revistă teoretico-științifică / Theoretical and scientifical journal178
Nr. 3 / 2013
mediului ocupat de ele (sol, atmosferă)” [15].În această privinţă menţionăm şi opinia lui Tkacenko M. E.,
care a caracterizat pădurea ca element original al landşaftuluigeografic în formă de totalitate a arborilor care sunt biologicinterdependenţi şi influenţează asupra mediului pe un spaţiumai mult sau mai puţin întins [16].
Pădurea, ca şi alte spaţii verzi este unul dintre factoriiimportanţi, care ar putea avea un impact pozitiv asuprarecuperării şi stabilizarea mediului, dezvoltării durabile atuturor formelor de viaţă de pe planetă [10].
În literatură sunt date şi interpretările noţiunii de „ecosistemforestier”, inclusiv de către Luganskii N.A. şi coautorii lui:”Pădurea este o totalitate de componente biologice (arbori,arbuşti, cuvertura vie a solului, animale, microorganisme, etc.şi abiotice (solul, roca-mamă, aerul atmosferic) pe un anumitlot de suprafaţă a solului, care reprezintă un sistem ecologic îndezvoltare şi autoreglare, în cadrul căruia toate componentele,din motivul dependenţei strânse între ele, se influenţează una pealta, creează un mediu specific atât în interiorul său, cât şi pesuprafeţele adiacente [13].
Mai întâi de toate, ecosistemele forestiere sunt rezervoareprincipale pentru carbon si generatoare de oxigen. Pondereapădurilor la componentul stocării de carbon al ecosistemeiterestre se cifrează la 60-70% [11].
Lista componentelor abiotice care intră în ecosistemeleforestiere poate fi completată cu luarea în consideraţie afaptului că factorii abiotici reprezintă totalitatea condiţiilormediului anorganic care influenţează asupra organismului. Înconformitate cu acest fapt, Bîkov B.A. include în factoriiabiotici şi hidrosfera, şi radiaţia solară [12].
Deoarece dezvoltarea economică are loc în cadrul unorsisteme ecologice, pe parcursul anilor a început să se vorbeascătot mai mult de eco-dezvoltare ca fiind o relaţie complexă întredezvoltarea economică şi mediul natural. Progresul tehnico-ştiinţific a înregistrat asemenea performanţe încât, pentrurealizarea obiectivelor sale esenţiale, omul poate transformasubstanţial mediul său natural.
În evoluţia concepţiei despre pădure s-a ajuns treptat laconstatarea caracterului ei complex de ecosistem. Un elementdeosebit de important, care trebuie luat în considerare estestarea, respectiv capacitatea ecosistemelor de a îndeplinianumite cerinţe social-economice. Este necesar să se ştie câtedin aceste păduri au o structură (specii, vârste, consecinţe,volum / ha, etc.), care să permită exercitarea, la niveloptim, a funcţiilor de protecţie a apei, solului, aerului, afuncţiilor de interes social (sanitar, recreative şi estetice),de producţie a lemnului şi alte bunuri, de protejare a altorinterese.
Generalizând caracteristica pădurii ca obiect al evaluăriieconomice, având în vedere faptul că ecosistemul forestier este,în acelaşi timp, element structural independent al biosferei şiobiect al economiei teritoriale, vom prezenta aceste dependenţeîn forma unui sistem ecologo-economic (Figura 1).
Ca element structural independent al biosferei, pădureaproduce în permanenţă o sumă de beneficii social utile legateîntre ele şi cu mediul înconjurător, care au valoare utilă.Acestea, necătând la multitudinea şi diversitatea esenţială, potfi grupate conform prezenţei unor anumiţi indici, după cumurmează:
- funcţiile ecologice ale ecosistemelor forestiere, adicăserviciile potenţiale (de protecţie şi reglare a apelor, de
environment occupied by them (ground and air)." [15]In this connection we mention M.E. Tkachenko 's
opinion that characterized the original forest as part of thelandscape in the form of fully geo trees that areinterdependent biological and environmental influences ona stretched space more or less [16].
The forest, like other green spaces is one of theimportant factors that could have a positive impact on therecovery and stabilization of the environment andsustainable development of all life on the planet [10].
The literature data and interpretations of the term"forest ecosystem", including N.A. Luganskii and his co-authors: "The forest is a set of biological components(trees, shrubs, living blanket of soil, animals,microorganisms, and so on and abiotic components (soil,bedrock, atmospheric air) on any set of surface of soil,which is environmentally friendly and self-developed, inwhich all parts of the ground are in a close relationshipbetween them, influence one another, creating a specificenvironment both within and adjacent surfaces [13].
First of all, forest ecosystems are the main reservoirsof carbon and oxygen generators. The share of forestscomponents of terrestrial carbon storage amounts to 60-70% [11].
The list of abiotic components covered in forestecosystems may be supplemented by consideration of thefact that abiotic factors are all inorganic environmentalconditions that affect the body. In line with this, B.A.Bîkov includes in abiotic factors the hydrosphere and solarradiation [12].
As economic development occurs within ecologicalsystems, over the years there have been increased talksabout eco-development as a complex relationship betweeneconomic development and the natural environment.Scientific and technical progress has made possible thatsuch performance can achieve its key objectives and onecan substantially transform its natural environment.
The evolution of the concept of forest graduallyreached its finding that they are a complex ecosystem. Avery important element to be considered is the state,namely the ability of ecosystems to fulfill certain social-economic environments. It is necessary to know howmany of these forests have a structure (species, age,consequences, volume/ha, etc.), which can be exercised atthe optimal level of protection for the functions of water,soil, air functions of social interest (health, recreationaland aesthetic), the production of timber and otherproperty, in order to protect other interests.
Generalizing the forest feature as an object ofeconomic assessment, given that the forest ecosystem is atthe same time an independent structural element of thebiosphere and the object of territorial economy, we presentthese dependencies in the form of an ecological-economicsystem (Figure 1).
As an independent structural element of the biosphere,the forest produce continuously a useful amount of socialbenefits linked with the environment, which have usefulvalue. These, in spite of the essential multiplicity anddiversity can be grouped according to the presence ofcertain indices, as follows:
- Ecological functions of forest ecosystems, for

ECONOMIE ŞI SOCIOLOGIE / ECONOMY AND SOCIOLOGY 179
Nr. 3 / 2013
producere a oxigenului, de purificare a aerului de contaminări,de creştere a productivităţii culturilor agricole, etc.) – E123…n;
- resursele de utilizare auxiliară (ciuperci, pomuşoare,plante medicinale, cosit, etc.) - A123…n;
- resurse de materie primă de origine lemnoasă (materiallemnos, rădăcini, ramuri, verdeaţă tehnică, scoarţă, etc.) -L123…n;
Resurse cu utilizare specială (vânătoare, terenuri agricole,cercetări ştiinţifice, etc.) - S123…n.
example potential services (protection and control ofwater, oxygen production, purification of aircontamination, increase crop productivity, etc.) - E123…n;
- Use auxiliary resources (mushrooms, berries, herbs,grass, etc.) - A123…n;
- Resources of wood as a raw material (wood, roots,branches, green tech, bark, etc.) - L123…n;
- Resources for special purposes (hunting, agricultural,scientific research, etc.) - S123…n.
Fig. 1. Pădurea ca sistem ecologo-economic/ Fig. 1. Forests as an ecological-economic systemSursa/Source: Elaborată de autor Elaborated by the author.
Funcţiile ecologice în figura prezentată ocupă jumătateade sus a sferei (ecologia). Ele nu au aspect de marfă concret.În cealaltă jumătate a sferei sunt situate resursele forestierăcare au aspect de marfă şi re referă, în primul rând, laeconomie, toate componentele modelului sunt legate între eleşi se influenţează reciproc.
Pe parcursul dezvoltării societăţii omeneşti, influenţatăfiind de izbucnirea crizei energetice şi de materii prime,societatea a început să se preocupe de faptul că exploatareaneraţională a naturii şi utilizarea acesteia fără discernământpoate avea, pe lângă efecte benefice asupra bunăstării peansamblu, consecinţe nefaste asupra echilibrului ecologic.
În acest context, abordarea eco-economică devine deosebitde importantă pentru realizarea dezideratelor dezvoltăriidurabile. Rezultă astfel nevoia de a suprapune ecologiaeconomiei, respectiv nevoia de a integra cerinţele ecologice înevaluarea activităţilor economice. Acest lucru devine necesardat fiind faptul că semnalele pe care le transmite piaţa suntincorecte, ele nu reflectă pagubele produse mediului,respectiv costurile care vor trebui suportate de societate „... opădure localizată în bazinul superior al unui curs de apă poatefurniza servicii cum sunt controlul debitului şi reciclareaprecipitaţiilor înspre interiorul uscatului, servicii care sunt decâteva ori mai valoroase decât producţia ei de buşteni. Dinnefericire, semnalele pieţei nu reflectă aceasta, din cauză căcei care taie copacii nu suportă costurile reducerii serviciilorpădurii” Brown L. [6].
Pe de altă parte, aceasta va constitui o provocareextraordinară, întrucât „nu există precedent în acţiunea detransformare a unei economii bazate în mare măsură peforţele pieţei, într-o economie formulată pe principiileecologiei”, iar „construirea unei eco-economii va afectafiecare colţişor al vieţii noastre”.
The ecological functions in the figure occupy the tophalf of the sphere (ecology). They have the appearanceof specific goods. The other half of the sphere are locatedforest resources that represent goods and relate primarilyto the economy, all components of the model areinterrelated and influence each other.
During the development of human society, beinginfluenced by the crisis of energy and raw materials, thecompany began to worry that the rational exploitation ofnature and its indiscriminate use can have beneficialeffects on well-being in addition to the overall adverseconsequences of ecological balance.
In this context, an eco-economic approach isparticularly important for achieving sustainabledevelopment. This results in the need to overlap ecologywith economy, and namely the need to integrateenvironmental requirements in assessing economicactivities. This is necessary given that the market signalsthey transmit are incorrect, and that they do not reflectenvironmental damage, or costs that will be borne by thecompany ... “forests located in the basin of a stream canprovide services such as flow control and recyclingrainfall inland towards services that are several timesmore valuable than its production logs. Unfortunately, itdoes not reflect market signals, because those who cuttrees do not bear the costs of reducing forest services”Brown L. [6].
On the other hand, it will be a formidable challenge,since "there is no precedent in the action of transformingan economy based largely on market forces in aneconomy brought on the principles of ecology "and"building an eco-economy will affect every corner of ourlives".
Revistă teoretico-științifică / Theoretical and scientifical journal180
Nr. 3 / 2013
Ea ne va modifica modul de iluminare a locuinţelor, cu cene hrănim, unde locuim, cum ne folosim timpul liber şi câţicopii să avem. Eco-economia ne va da o lume în care vomface parte integrantă din natură, în loc să ne înstrăinăm de ea.
De foarte multe ori abordările ştiinţifice sînt încărcate cu odoză de incertitudine în legătură cu rolul bunurilor naturale încadrul mediului şi naturii. În aceste condiţii, distrugereacapitalului natural, inclusiv al resurselor forestiere sauînlocuirea lui cu un altul creat de om se poate de realizat doarpentru acoperirea aspectelor cunoscute ale rolului capitaluluinatural, putând fi pierdute din vedere aspecte esenţiale legatede funcţionarea în ansamblu a unor ecosisteme. Aşadarincertitudinea reprezintă o problemă importantă legată deconsumul bunurilor naturale.
Pe de altă parte, renunţarea la capitalul natural este unproces de multe ori, ireversibil ceea ce impune serioase analizeînaintea luării unor decizii ce pot afecta grav mediile naturale.
Capacitatea de regenerare este legată de perspectivele dedezvoltare durabilă a economiilor sărace, care depind în maremăsură şi într-un mod direct de menţinerea cantităţii deresurse naturale / forestiere. În asemenea ţări nu există nicimăcar capitaluri antropice care să compenseze eventualelediminuări de resurse naturale, iar introducerea lor ar puteaavea efecte incerte şi nu întotdeauna pozitive. Societăţiledependente de capitalurile naturale sînt foarte sensibile ladiverse şocuri (secete, inundaţii, războaie), ceea ce reflectă oflexibilitate redusă în cazul manifestări acestora. Pentru a lemări capacitatea de rezistenţă este necesară o cantitate maimare de capital natural, deci o creştere a acesteia şi nicidecumo diminuare a lui.
Echitatea integrităţii se referă la egalitatea sau fair play-uldintre generaţii, ea reprezentând unul din obiectivele socialeale statelor, fiecare generaţie are drept de utilizare şiproprietate asupra resurselor dar trebuie să-şi achite toatedatoriile pe durata existenţei ei. Generaţiile prezente auposibilitatea de a interveni în asigurarea şi creşterea resurselorpentru generaţiile viitoare.
Dacă oamenii trebuie să fie preocupaţi de soarta generaţiilorviitoare, ei trebuie să se îngrijească în egală măsură şi dedrepturile naturale ale tuturor celorlalte organisme vii.
Reducerea resurselor forestiere, chiar dacă nu afecteazădrepturile omului, poate reduce habitatul sau ecosistemeleplantelor sau animalelor, ceea ce compromite existenţaacestora şi, în final, a biodiversităţii în ansamblul ei.
It will change the lamp housing, what we eat, wherewe live, how we use our free time and how manychildren we have. Eco-economy will give us a worldwhere we are an integral part of nature, rather thanalienate us from it.
Very often scientific approaches are loaded with adose of uncertainty about the role of natural goods in theenvironment and nature. Accordingly, destruction ofnatural capital, including forest resources or resourcesthat can be replaced by man can only be achieved only tocover the role of known aspects of natural capital, andcan be lost sight of key issues related to the overallfunctioning of ecosystems. So uncertainty is animportant issue related to the use of natural capital.
On the other hand, giving up natural capital is aprocess often irreversible which requires serious analysisbefore making decisions that could seriously affect thenatural environments.
The regenerative capacity is related to sustainabledevelopment prospects in poor economies that dependheavily and directly on a maintenance amount of naturalresources/forestry. In such countries, there is not evenhuman capital to compensate for any reduction of naturalresources and their introduction could have uncertain andnot always positive effects. Dependent on natural capitalfirms are very sensitive to various shocks (droughts,floods, wars), reflecting the reduced flexibility for theirevents. In order to increase the resilience is required anamount of natural capital, therefore its growth and not itsdecrease.
Equity refers to equal integrity and fair play betweengenerations, it represents one of the social objectives ofstates, each generation has a right of use and ownershipof resources but you have to pay all debts during yourexistence. Present generations have the opportunity tointervene in ensuring and increasing resources for futuregenerations.
If people need to be concerned about the fate offuture generations, they should equally take care of thenatural rights of all other living organisms.
The reduction of forest resources, while not affectingthe human rights, can reduce ecosystems and the habitatof plants or animals, which undermines their existenceand, ultimately, biodiversity as a whole.
Referinţe bibliografice / References1. DINU, V. Elemente de politică şi administraţie forestieră. Ed. Viaţa forestieră, 1930.2. MILESCU, I. Economie forestieră. Suceava: Ed. Universităţii Suceava, 2002.3. NEGREI, C. Bazele economiei mediului. Bucureşti: Ed. Didactică şi Pedagogică, 1996. 171 p. ISBN 973-30-5901-3.4. PEARCE, D.W., TURNER, R.K. Economia delle resourse naturali e dell'ambiente. Bologna: Il Mulino, 1991. 362 p. ISBN 9788815032850.5. ”Moldova XXI” - Strategia Naţională pentru Dezvoltarea Durabilă. Chişinău, 2000. 125 p.6. BROWN, L. Eco-economia: crearea unei economii pentru planeta noastră. Bucureşti: Ed. Tehnică, 2001. 382 p.7. DRĂGOI, M. Economie forestieră. Bucureşti: Ed. Economică, 2000. 298 p. ISBN 9735902338.8. DRĂGOI, M. Economia şi management forestier. Suceava: Ed. Universităţii din Suceava, 2008. 334 p.9. PĂTRĂSCOIU, N., TOADER, T., SCRIPCARU, Gr. Pădurile şi recrearea. Bucureşti: Ed. Ceres, 1987. 270 p.10. БЕЛОУСОВА, А.П., СЕМАШКО, Л.Ю. Экологические аспекты устойчивого развития и индикаторы его характеризующие. В: Проблемы
окружающей среды и природных ресурсов: обзорная информация. Москва: ВИНИТИ, 2004, № 1, сс. 2-20.11. ИСАЕВ, А.С. Экономические проблемы поглощения углекислого газа посредством лесовосстановления и лесоразведения в России.
Москва, 1995. 155 с.12. ЛЕБЕДЕВ, Ю.В. Эколого-экономическая оценка лесов Урала. Екатеринбург: УрОРАН, 1998. 214 с.13. ЛУГАНСКИЙ, Н.А., ЛЫСОВ, Л.А. Березняки Среднего Урала. Екатеринбург: Изд-во УрГУ, 1991. 99 с.14. МОРОЗОВ, Г.Ф. Учение о лесе. Изд. 5-е. Москва, 1930. 421с.15. ПОГРЕБНЯК, П.С. Основы лесной типологии. Киев: Изд-во АН УССР, 1995. 456 с.16. ТКАЧЕНКО, М.Е. Общее лесоводство. Москва, 1939. 746 с.
Recomandat spre publicare: 14 .08. 2013

ECONOMIE ŞI SOCIOLOGIE / ECONOMY AND SOCIOLOGY 181
Nr. 3 / 2013
SURSELE DE INFORMAŢIE PENTRU ANALIZAREGIONALĂ: NECESITATE, DISPONIBILITATE,
LACUNE ȘI RECOMANDĂRI
INFORMATION SOURCES FOR REGIONALANALYSIS: NECESSITY, AVAILABILITY, FLAWS
AND RECOMMENDATIONS
Natalia IACHIMOV, doctorandAcademia de Studii Economice din Moldova
Natalia IACHIMOV, PhD student,the Academy of Economy Studies from Moldova
Prezentul articol analizează instrumentele statisticenaţionale prin prisma celor europene şi oferă o serie deconcluzii şi recomandări pentru utilizarea lor în analizaregională. O deosebită atenţie se oferă instrumentelorstatistice utilizate de EUROSTAT; un accent apartepunându-se pe mecanismele folosite în România. Oanaliză critică a instrumentelor de monitorizare șievaluare a dezvoltării regionale, statisticile regionaleproduse de Biroul Naţional de Statistică și statisticileregionale ale Ministerului Economiei conduce autorul laoferirea unor concluzii și recomandări pentruarmonizarea instrumentelor naţionale și apropierea decele europene.
The article analyses the national statistical instrumentsthrough the perspective of the European ones and offers alist of conclusions and recommendations for tusing them inthe regional analyses. A particular attention is beingoffered to the instruments used by EUROSTAT; attentionbeing paid to the statistical instruments used in Romania.A critical analyses of the monitoring and evaluationmechanisms of regional development, the regionalstatistics elaborated by the National Office of Statisticsand the Ministry of Economy leads the author to severalconclusions and recommendations regarding theharmonization of the national instruments betweenthemselves and to EU standards.
Cuvinte cheie: Statistica regională, EUROSTAT,conturile regionale, indicatori socio-economici peregiuni de dezvoltare, raioane şi municipii, ProdusulIntern Brut Regional, valoarea adăugată brută,IDAM.
Keywords: Regional statistics, EUROSTAT, regionalaccounts, regional socio-economic indicators for theregions of development, districts and municipalities,Regional Gross Domestic Products, gross value added,Small Area Deprivation Index.
JEL clasification: C1, R1, C82
Introducere. Statistica oficială calitativă reprezintă unabsolut necesar pentru dezvoltarea socio-economică a unuistat cu perspective si aspiraţii europene. Reprezentând un„bun public”, în societatea contemporană, ea are menireade a servi întreaga societate, în condiţii de maximătransparenţă, imparţialitate şi egalitate pentru toategrupurile ţintă de cunoaştere [1].
Comisia de Statistică ONU este recunoscută a fientitatea supremă a Sistemului Statistic Global (SSE), carefuncţionează din anul 1947. SSE constituie un parteneriatîntre EUROSTAT şi instituţiile naţionale de statistică,precum şi alte autorităţi naţionale din fiecare din statelemembre ale UE. EUROSTAT este oficiul de statistică alUE, care publică statisticile oficiale armonizate ale UE șiale zonei euro și oferă o imagine comparabilă, demnă deîncredere și obiectivă a schimbărilor ce au loc în Europa.Pentru a produce aceste statistici, EUROSTAT colecteazădatele de la institutele naţionale de statistică și learmonizează conform metodologiilor unice.
În UE conturile regionale sunt realizate conformmetodologiei SEC 95 şi manualului metodologic alEUROSTAT-ului: metodologia conturilor regionale –valoarea adăugată brută şi formarea brută de capital fix peactivităţi economice și conturile sectorului „Gospodăriilepopulaţiei”.
În România elaborarea Conturilor regionale cuprinde:calculul produsului intern brut regional (PIBR); estimareavalorii adăugate brute regionale pe ramuri de activitate;calculul conturilor regionale ale gospodăriilor populaţiei,prin elaborarea contului de alocare a veniturilor primare şia contului de distribuire secundară a venitului.
Introduction. Qualitative official statistics represents anecessary absoluteness for socio-economic development ofa state having European aspirations and perspectives.Being a ‘public good’ in modern society, it is designed toserve the entire society, under conditions of maximumtransparency, impartiality and equality for all targetknowledge groups [1].
United Nations Statistical Commission is the top entityof the global statistical system (ESS), operating from 1947.ESS is a partnership between EUROSTAT and nationalstatistics institutions, as well as other national authoritiesfrom each of the member states of the EU. EUROSTAT isthe statistics bureau of the EU that publishes harmonizedofficial statistical information of the EU and the euro zoneand offers a comparable picture, both reliable and objective,of changes happening in Europe. In order to provide thisstatistics, EUROSTAT summarises data from nationalstatistics institutions and harmonizes them under the conceptof unified methods of the European Statistical System.
In the EU, regional accounts are compiled inaccordance with ESA 95 and the EUROSTATmethodological manual – the methodology of regionalaccounts is the gross value added and gross fixed capitalformation given the economic activities and the accountsof household sector.
In Romania, the development of regional accountscomprises calculation of regional gross domestic product(RGDP), estimation of regional gross value added perindustry, calculation of regional accounts of households,designing of allocation of primary income account and thesecondary distribution of income account.
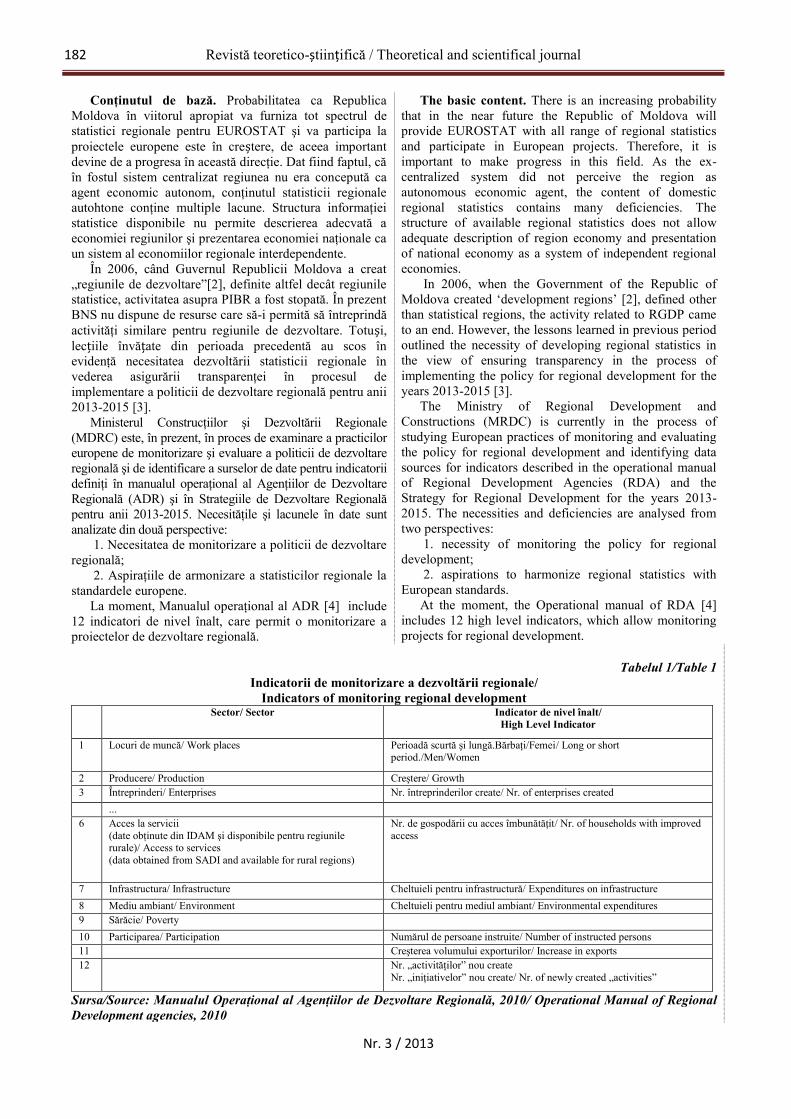
Revistă teoretico-științifică / Theoretical and scientifical journal182
Nr. 3 / 2013
Conţinutul de bază. Probabilitatea ca RepublicaMoldova în viitorul apropiat va furniza tot spectrul destatistici regionale pentru EUROSTAT şi va participa laproiectele europene este în creștere, de aceea importantdevine de a progresa în această direcţie. Dat fiind faptul, căîn fostul sistem centralizat regiunea nu era concepută caagent economic autonom, conţinutul statisticii regionaleautohtone conţine multiple lacune. Structura informaţieistatistice disponibile nu permite descrierea adecvată aeconomiei regiunilor şi prezentarea economiei naţionale caun sistem al economiilor regionale interdependente.
În 2006, când Guvernul Republicii Moldova a creat„regiunile de dezvoltare”[2], definite altfel decât regiunilestatistice, activitatea asupra PIBR a fost stopată. În prezentBNS nu dispune de resurse care să-i permită să întreprindăactivităţi similare pentru regiunile de dezvoltare. Totuși,lecţiile învăţate din perioada precedentă au scos înevidenţă necesitatea dezvoltării statisticii regionale învederea asigurării transparenţei în procesul deimplementare a politicii de dezvoltare regională pentru anii2013-2015 [3].
Ministerul Construcţiilor şi Dezvoltării Regionale(MDRC) este, în prezent, în proces de examinare a practiciloreuropene de monitorizare şi evaluare a politicii de dezvoltareregională şi de identificare a surselor de date pentru indicatoriidefiniţi în manualul operaţional al Agenţiilor de DezvoltareRegională (ADR) şi în Strategiile de Dezvoltare Regionalăpentru anii 2013-2015. Necesităţile şi lacunele în date suntanalizate din două perspective:
1. Necesitatea de monitorizare a politicii de dezvoltareregională;
2. Aspiraţiile de armonizare a statisticilor regionale lastandardele europene.
La moment, Manualul operaţional al ADR [4] include12 indicatori de nivel înalt, care permit o monitorizare aproiectelor de dezvoltare regională.
The basic content. There is an increasing probabilitythat in the near future the Republic of Moldova willprovide EUROSTAT with all range of regional statisticsand participate in European projects. Therefore, it isimportant to make progress in this field. As the ex-centralized system did not perceive the region asautonomous economic agent, the content of domesticregional statistics contains many deficiencies. Thestructure of available regional statistics does not allowadequate description of region economy and presentationof national economy as a system of independent regionaleconomies.
In 2006, when the Government of the Republic ofMoldova created ‘development regions’ [2], defined otherthan statistical regions, the activity related to RGDP cameto an end. However, the lessons learned in previous periodoutlined the necessity of developing regional statistics inthe view of ensuring transparency in the process ofimplementing the policy for regional development for theyears 2013-2015 [3].
The Ministry of Regional Development andConstructions (MRDC) is currently in the process ofstudying European practices of monitoring and evaluatingthe policy for regional development and identifying datasources for indicators described in the operational manualof Regional Development Agencies (RDA) and theStrategy for Regional Development for the years 2013-2015. The necessities and deficiencies are analysed fromtwo perspectives:
1. necessity of monitoring the policy for regionaldevelopment;
2. aspirations to harmonize regional statistics withEuropean standards.
At the moment, the Operational manual of RDA [4]includes 12 high level indicators, which allow monitoringprojects for regional development.
Tabelul 1/Table 1Indicatorii de monitorizare a dezvoltării regionale/
Indicators of monitoring regional developmentSector/ Sector Indicator de nivel înalt/
High Level Indicator
1 Locuri de muncă/ Work places Perioadă scurtă şi lungă.Bărbaţi/Femei/ Long or shortperiod./Men/Women
2 Producere/ Production Creştere/ Growth3 Întreprinderi/ Enterprises Nr. întreprinderilor create/ Nr. of enterprises created
...6 Acces la servicii
(date obţinute din IDAM şi disponibile pentru regiunilerurale)/ Access to services(data obtained from SADI and available for rural regions)
Nr. de gospodării cu acces îmbunătăţit/ Nr. of households with improvedaccess
7 Infrastructura/ Infrastructure Cheltuieli pentru infrastructură/ Expenditures on infrastructure8 Mediu ambiant/ Environment Cheltuieli pentru mediul ambiant/ Environmental expenditures9 Sărăcie/ Poverty10 Participarea/ Participation Numărul de persoane instruite/ Number of instructed persons11 Creşterea volumului exporturilor/ Increase in exports12 Nr. „activităţilor” nou create
Nr. „iniţiativelor” nou create/ Nr. of newly created „activities”
Sursa/Source: Manualul Operaţional al Agenţiilor de Dezvoltare Regională, 2010/ Operational Manual of RegionalDevelopment agencies, 2010

ECONOMIE ŞI SOCIOLOGIE / ECONOMY AND SOCIOLOGY 183
Nr. 3 / 2013
Indicatorii care pot fi bine definiţi rezultă din: estimărilecheltuielilor obţinute din registrele financiare regionale şiraionale; informaţiile produse de BNS; informaţiile produsede Ministerul Economiei prin calcularea IDAM (Indicele deDeprivare a Ariilor Mici).
Statisticile regionale produse de Biroul Naţional deStatistică (BNS)
La moment BNS nu are o unitate specifică de statisticăregională, ci un funcţionar, care produce trimestrial buletinulPrincipalii indicatori socio-economici pe regiuni dedezvoltare, raioane şi municipii - publicaţie care constă întotalmente din tabele fără nici o explicaţie sau interpretare.
Dacă comparăm lista datelor la nivel raional, produse deBNS, cu cerinţele privind datele din tab. 1. se poate observainsuficienţa şi lacunele existente de date necesare pentrumonitorizarea strategiilor regionale. Astfel:
o parte din informaţiile relevante nu este produsă curegularitate;
seriile datelor de nivel raional nu sunt disponibile înformat potrivit (format Excel);
BNS nu produce date pentru exporturile totale dinfiecare regiune sau numărul total a persoanelor instruite înfiecare regiune;
deşi există date despre producţie pe întreprinderiraportate în fiecare raion şi este posibilă folosirea acestorapentru a produce o estimare aproximativă a PIB-uluiregional şi a creşterii valorii adăugate brute (VAB) peregiune, BNS nu produce astfel de estimări.
Prin urmare, principala problemă metodologică îndomeniul perfecţionării statisticii regionale în RepublicaMoldova a devenit elaborarea sistemului conturilorregionale, estimarea PIBR şi a VABR ca indicatori relevanţiai nivelului de dezvoltare regională.
PIBR (Produsul Intern Brut Regional) reprezintăechivalentul regional al PIB. El este evaluat la preţurilepieţei, prin însumarea valorii adăugate la preţ de bază cuvalorile regionalizate ale impozitelor minus subvenţiile peproduse şi import. Suma PIBR la preţ de piaţă a diferitelorregiuni şi a teritoriului extraregional trebuie să fie egală cuPIB la preţ de piaţă. Deoarece PIBR este rezultatul activităţiide producţie a unităţilor cu activitate economică locală(UAE locale) pe care le cuprinde, locul de rezidenţă a UAElocale devine un criteriu esenţial pentru repartizarea lor întreregiuni determinate.
Metodologia utilizată în anii 2000-2001 pentru estimareaPIB regional denotă, că există o bună cunoaştere aprincipiilor conturilor regionale şi că ele au fost aplicatedestul de riguros în trecut, în linii generale, în conformitatecu standardele internaţionale. Cu toate acestea, există uneledomenii, care ar necesita ameliorări pentru a elaboraindicatori, care ar oferi o reflectare fidelă a activităţiloreconomice în regiuni. În special:
informaţiile de la întreprinderi şi instituţii trebuie săse bazeze mai curând pe unităţile locale decât peîntreprinderile, care pot avea activităţi în mai mult de oregiune;
metodele de alocare a impozitelor şi subvenţiilorpentru regiuni trebuie să respecte standardele internaţionale;
metodele de estimare a economiei neobservate lanivel naţional, precum şi producerea unei defalcări regionalea acesteia, trebuie să fie elaborate ţinând cont de bunele
Indicators that are likely to be well defined resultfrom district and regional financial records, informationprovided by NBS, information supplied by the Ministryof Economy based on the calculation of SADI (SmallArea Deprivation Index).
Regional statistics provided by the National Bureauof Statistics (NBS)
At present, NBS does not have a specific unit ofregional statistics, but a clerk who produces quarterly thebulletin Main socio-economic indicators on developmentregions, districts and municipalities, a publication thatfeatures only tables without any accompanyingexplanations or interpretations.
If we compare the data list at district level, offered byNBS, given the requirements that Table 1 displays, wenotice the existing data insufficiency and deficienciesnecessary for monitoring regional strategy. Thus:
A part of relevant information is not furnished on aregular basis;
The data coming from district level are notavailable in the convenient format (Excel);
NBS does not supply data for total exports fromeach region or the total number of instructed persons ineach region;
Although there are data on production perenterprise reported in each district and their use makes itpossible to produce an approximate estimate of regionalGDP and creation of gross value added (GVA) perregion, NBS does not provide such estimates.
Therefore, the main methodological problem in thefield of improving regional statistics in the Republic ofMoldova has become the development of the system ofregional accounts, estimation of RGDP and RGVA asrelevant indicators of the regional development level.
RGDP (Regional Gross Domestic Product) representsthe regional equivalent of GDP. It is evaluated at marketprices, through summation over value added to the baseprice with regional values of taxes minus subsidies onproducts and imports. The sum of RGDP of differentregions and extra-regional territories calculated at marketprice must be equal with GDP at market price. BecauseRGDP is a result of production activity of residentproducer units (RPU), the place of residence of RPUbecomes an essential criterion for distributing themamong determined regions.
The methodology used in 2000-2001 to estimate theregional GDP shows that there was a good understandingof the principles of regional accounts and that they wereapplied strictly in the past, in general, in conformity withinternational standards. Yet, there are several domainsthat would necessitate improvements to be made inindicator development, which would offer a truereflection of region economic activities, and particularly:
information furnished by enterprises andinstitutions has to be based on local units rather than onenterprises doing business in more than one region;
methods of allocation of taxes and subsidies toregions must meet international standards;
methods for estimating the unobserved economy atnational and regional level and regional distribution of it,must be developed taking into account the best practices
Revistă teoretico-științifică / Theoretical and scientifical journal184
Nr. 3 / 2013
practici în alte ţări similare.Ansamblul acestor date, care formează aproape jumătate
din totalul VAB, se cer a fi produse per raion şi agregate,ulterior pe regiuni de dezvoltare. Metodologia de bază esteaplicarea schimbărilor în seturile de date de mai sus laestimările pentru fiecare industrie în fiecare regiune şi, apoi,constrângerea rezultatului pentru a corespunde totaluluinaţional pentru VAB în acea industrie pe parcursul anului.Pentru alte activităţi, rezultatele anului precedent pot fimărite în conformitate cu estimările creşterii naţionalepentru acea activitate [6]. Ca urmare, estimarea VABregional al Moldovei poate fi aplicată de orice analistcompetent prin folosirea unui număr mic de indicatori.
Statisticile regionale ale Ministerului EconomieiDacă la nivel naţional sistemul de indicatori social-
economici ai Republicii Moldova a fost în permanenţăactualizat şi aliniat la cerinţele de informare interne şiexterne, la nivel local acţiunile s-au desfăşurat mult mai lent.La acest nivel se operează cu statisticile regionale aleMinisterului Economiei, reflectate în IDAM, folosiţi pentruatragerea finanţării pentru dezvoltarea regională şi în calitatede instrument pentru selectarea proiectelor la nivel local.
În Republica Moldova IDAM reprezintă o compilareponderată de indici, care oferă informaţii despre distribuireageografică a deprivării în comunităţile rurale din Moldova în7 domenii: venituri, economie, demografie, sănătate,educaţie, condiţii de trai şi geografie. Pentru fiecare indicesunt combinaţi 4-7 indicatori pentru a oferi o măsură dedeprivare al nivelului de domeniu [7].
Analizând indicatorii IDAM putem constata că unii dinei pot fi luaţi în consideraţie la elaborarea mecanismelorpentru monitorizarea şi evaluarea politicii şi proiectelor dedezvoltare regională. Însă producerea IDAM generează oserie de limite:
IDAM este sursa principală pentru măsurareaaccesului la servicii de către gospodăriile individuale, însăfelul cum datele sunt organizate, stocate şi prezentate ca seriide fişiere face dificilă folosirea acestora pentru urmărireadinamicii lor;
ar fi bine ca Ministerul Economiei să ofere MDRCtabelele ce conţin totalitatea variabilelor IDAM la nivel decomună în serii de timp;
devine oportună elaborarea unui set de indicatorirelevanţi pe municipalităţi.
Proiecte în derulareÎncepând cu martie 2013, Uniunea Europeană susţine
perfecţionarea statisticii regionale prin alinierea ei lastandardele EUROSTAT prin Proiectul “Îmbunătăţireadisponibilităţii şi credibilităţii statisticii regionale pentrufactorii de decizie din Republica Moldova”. Principalulpartener extern în cadrul acestui proiect este InstitutulNaţional de Statistică al României, care are o experienţăvastă de armonizare la standardele europene şi va oferiasistenţa necesară în acest domeniu.
Având ca scop implementarea unor acţiuni menite săîmbunătăţească disponibilitatea, relevanţa, acurateţea şiactualitatea datelor statistice la nivel regional şi local,proiectul va ajuta atât factorii de decizie din ţară, cât şipartenerii de dezvoltare să identifice mai bine zoneledezavantajate ale ţării, să înţeleagă mai profund caracterulproblemelor, cu care acestea se confruntă şi să măsoare
in other similar countries.All of these data, which form almost half of overall
GVA, are required to be produced per district andaggregated subsequently per development region. Thebasic methodology is application of changes in sets ofdata above to estimations for each industry in everyregion, and then exercising of restraint on results tomatch national total GVA in the industry during the year.For other activities, the results for the previous year canbe increased in accordance with the estimates of nationalgrowth for the activity [6]. As a result, any competentanalyst can apply the estimation of Moldova’s regionalGVA by using a small number of indicators.
Regional statistics of the Ministry of EconomyIf the system of socio-economic indicators of the
Republic of Moldova has always been updated at thenational level and aligned with internal and externalinformation requirements, local actions took place moreslowly. At this level, regional statistics of the Ministry ofEconomy becomes operational and mirrored in SADI,used to attract finances for regional development and asan instrument for selecting projects locally.
In Moldova, SADI represents a weighted compilationof indices that offers information about geographicaldistribution of deprivation in Moldovan ruralcommunities in seven domains: incomes, economy,demography, health, education, living conditions andgeography. For each index, 4-7 combined indicators offer adeprivation measure of domain level [7].
Having analysed SADI indicators, we find that some ofthem may be taken into account in the development ofmechanisms for monitoring and evaluating the policy andprojects for regional development. However, production ofSADI generates a number of limitations:
SADI remains the main source for measuring howhouseholds access services; however, the way data isorganised, stored, and presented as series of files makes itdifficult the use of these data in order to follow theirdynamics;
It is advisable for the Ministry of Economy to offerThe Ministry of Regional Development and Constructions(MRDC) tables that contain overall SADI variables at thecommunity level in time series;
It is opportune to develop a set of relevant indicatorsper municipalities.
Ongoing projectsBeginning with March 2013, the European Union
supports the improvement of regional statistics through itsalignment to EUROSTAT standards via the project‘Improving availability and credibility of regional statisticsfor decision makers in the Republic of Moldova’. The mainexternal partner within the project is the Romanian NationalInstitute of Statistics, which has extensive experience ofharmonization with European standards and will providethe necessary assistance in this area.
Aiming to implement several actions to improve theavailability, relevance, accuracy and up-to-date character ofstatistical data at regional and local levels, the project willhelp both policy makers in the country and developmentpartners to identify better the disadvantaged areas of thecountry. It will also help them to understand more deeply

ECONOMIE ŞI SOCIOLOGIE / ECONOMY AND SOCIOLOGY 185
Nr. 3 / 2013
impactul acţiunilor şi politicilor de dezvoltare la nivel local.Agenţiilor de dezvoltare regională le revine rolul principal înaprobarea şi promovarea rezultatelor obţinute în cadrulproiectului.
În rezultatul implementării proiectului, autorităţilepublice şi publicul larg vor dispune de date statisticeregionale mai complete şi mai fiabile, ele fiind extrem deimportante pentru procesul de planificare şi asigurare adezvoltării regionale durabile la toate nivelurile.
the nature of the problems that they face and to measure theimpact of actions and development policies at the locallevel. The Regional Development Agencies will play themain role in approving and promoting the project results.
As a result of project implementation, public authoritiesand the general public will make use of more complete andreliable regional statistical data, which are extremelyimportant for planning and ensuring sustainable regionaldevelopment at all levels.
Concluzii și recomandări1. Practica europeană a demonstrat caracterul benefic al
creării unei unităţi dedicate statisticii regionale. Dreptexemplu pot fi numite Centrul pentru Statistici Regionale şiLocale ale Regatului Unit al Marii Britanii,Direcţia Activitate Regională a INSEE, Unitatea deStatistică şi Planificare Regională a StatisticiiSuediei, Direcţia Statistici Sociale şi Spaţiale a BirouluiCentral de Statistică a Olandei. Un model puţin diferit esteurmat în Germania, unde aproape toate responsabilităţilepentru statistici sunt acoperite de Biroul de Statistică Länder,a cărei sarcină primordială este producerea statisticilorpentru Länderu-ul lor propriu, statisticile naţionale fiind unprodus secundar. Astfel, devine necesară crearea uneisubdiviziuni a BNS, care s-ar concentra asupra colectării şicompilării datelor cu conţinut regional şi oferireaacestora utilizatorilor locali şi internaţionali interesaţi înobţinerea informaţiilor şi datelor privind o regiuneparticulară sau arii mici, pentru a nu le impune acestoracăutarea din surse multiple.
2.Pe termen mediu, pentru a spori vizibilitateastatisticilor regionale şi a începe armonizarea cu standardeleeuropene, se recomandă ca BNS să creeze o unitate, care aravea sarcina de susţinere şi extindere a statisticii regionale –Secţia statistici regionale. La moment, acest rol poate fi jucatde către ADR-uri. Creşterea capacităţilor instituţionale şi depersonal ale ADR-lor în aplicarea metodologii utilizate deEUROSTAT este indubitabilă.
3. IDAM nu cade sub incidenţa competenţelorfuncţionale ale Ministerului Economiei și nu existăresurse umane pentru colectarea sistematică a datelor,din care motiv se recomandă ca competenţa deproducere a IDAM să fie transferată la MDRC astfel, încâtIDAM să continue a fi unul din instrumentele demonitorizare şi evaluare a implementării politicilorregionale.
4.Pentru a introduce indicatorii monitorizării strategiilorregionale devine necesar ca BNS să facă disponibile seriilede date la nivel de raion în format Excel; să elaboreze opublicaţie anuală privind statisticile regionale, să oferetabele alocate pe regiuni de dezvoltare.
5. În Carta Europeană a Autonomiei Locale (Strasbourg,1985) este precizat că exerciţiul responsabilităţilorlocale se exercită, de preferinţă şi de manieră generală, decătre autorităţile situate cel mai aproape de cetăţean.Acest moment întăreşte ideea, că în obţinerea unorrezultate optime la nivel global un rol important revinenivelului local. Nevoia de informaţii la nivel local apare nudoar pentru formularea strategiilor de dezvoltaresau în scopuri de cercetare ştiinţifică, ci şi ca urmare asolicitărilor din partea diverşilor investitori. De aceea,este necesar de conștientizat actorii locali despre
Concluzions and reccomandations1.The European practice has shown the benefit of
creating a unit that will work with regional statistics. Inthis context, the Center for Regional and Local Statisticsof the United Kingdom, INSEE Regional ActivitiesDepartment, the Regional Planning and StatisticsDivision of Statistics Sweden, the Department of Socialand Spatial Statistics of the Central Bureau of Statistics,Netherlands are some examples of organizations, whichdisplay extensive European practice in the field. Aslightly different pattern could be seen in Germany,where the Bureau of Statistics Länder undertakes theprimary task to assume almost all responsibilities inorder to produce statistics for its own Länder,considering national statistics a byproduct. Thus, itbecomes necessary to create a subdivision of the NBS,which would focus on collecting and compiling data ofregional content and providing national and internationalusers interested in obtaining information and data,related to a particular region or small area, in order not tomake them search from multiple sources.
2. In the medium term, in order to increase thevisibility of regional statistics and begin harmonizationwith European standards, it is recommended that NBScreate a unit that would be responsible for supportingand expanding the regional statistics – Division ofregional statistics. Currently, RDAs play this role. Theincrease in institutional and personal capacities of RDAsin implementing the methodology used by EUROSTATis indubitable.
3.SADI is not subject to functional competences ofthe Ministry of Economy and there are no humanresources for systematic collection of data, which is whyit is recommended that SADI’s production competencebe moved to MRDC, so that SADI continue to be one ofthe instruments for monitoring and evaluating theimplementation of regional policies.
4. In order to use the indicators of monitoringregional strategies it is necessary that NBS should makedata series available at the district level in Excel, producean annual publication of regional statistics, by providingallocated tables per development regions.
5.The European Charter of Local Self-Government(Strasbourg, 1985) states that the authorities closest tothe citizens should preferably and generally exerciselocal responsibilities. This point reinforces the idea thatthe local level plays an important role in obtaining thebest results globally. The need for local informationappears not only to formulate development strategies orfor the purpose of scientific research, but also as a resultof requests from various investors. Therefore, it isnecessary for local actors to be aware of the necessity of

Revistă teoretico-științifică / Theoretical and scientifical journal186
Nr. 3 / 2013
necesitatea colectării sistematice a datelor şi dedezvoltat capacităţile lor în utilizarea instrumentelorcorespunzătoare metodologiei utilizate de actoriistatistici regionali și naţionali. În acest sens, un parteneriatcu Congresul Autorităţilor Locale din Republica Moldovapoate fi benefic și durabil.
systematic data collection and enhancing theircapabilities in the use of appropriate methodologyinstruments, employed by regional and nationalstatistical actors. In this respect, a partnership with theCongress of Local Authorities in the Republic ofMoldova can be beneficial and sustainable.
Referinţe bibliografice / References1. VOINEAGU, V., CARA, O., DUMITRESCU, I. Statistica oficială în societatea modern. In: Revista Română de
Statistică, 2010, nr.10, pp. 20-282. Legea privind dezvoltarea regională în Republica Moldova: nr. 438 din 28.12.2006. In. Monitorul Oficial al
Republicii Moldova. 2007, nr. 21-24, art. 68.3. Hotărîrea de Guvern cu privire la aprobarea Strategiei naţionale de dezvoltare regională pentru anii 2013-2015: nr.
685 din 04.09.2013. In. Monitorul Oficial al Republicii Moldova. 2013, nr. 198-204, art. 792.4. MDRC: Manualul operaţional al Agenţiei de Dezvoltare Regională. 2010 [accesat 27 mai 2013]. Disponibil:
http://www.adrsud.md/pageview.php?l=ro&idc=6205. JAGDEV SINGH VIRDEE. Raport pe Statistica Regională, elaborat in cadrul proiectului „Moldova: Cooperare în
Dezvoltarea Regională”, implementat de MDRC cu suportul DFID. 2010 [accesat 27 mai 2013]. Disponibil:old.mdrc.gov.md/
6. CATRINESCU, N., POWELL, M. Elaborarea datelor de bază şi susţinerea statisticilor regionale. Proiect MDRD.2010, p. 23
7. GASSMANN, F., VREMIS, M. Multiple deprivation in rural areas in moldova - Development of a small areadeprivation index (SADI). MET Policy Discussion Paper, Moldova. 2006, november.
8. Proiectul “Îmbunătăţirea disponibilităţii şi credibilităţii statisticii regionale pentru factorii de decizie din RepublicaMoldova”, finanţat de Guvernul României, face parte din Programul Comun al ONU “Consolidarea sistemuluistatistic naţional”, implementat de BNS implementat de BNS în parteneriat cu Cancelaria de Stat, MinisterulEconomiei, Ministerul Dezvoltării Regionale şi Construcţiilor şi agenţiile ONU - PNUD, UN Women, UNFPA,UNICEF, ILO [accesat 27 mai 2013]. Disponibil: http://www.statistica.md/newsview.php?l=ro&id=3987&idc=30
Recomandat spre publicare: 07. 06. 2013

ECONOMIE ŞI SOCIOLOGIE / ECONOMY AND SOCIOLOGY 187
Nr. 3 / 2013
ANALIZA CADRULUI NORMATIV PRIVINDINVESTIŢIILE ÎN SECTORUL BANCAR –
ELEMENT ESENŢIAL ÎN DEZVOLTAREABĂNCILOR DIN REPUBLICA MOLDOVA
ANALYSIS OF THE REGULATORY FRAMEWORKREGARDING INVESTMENTS IN THE BANKINGSECTOR – AS AN ESSENTIAL ELEMENT IN THE
DEVELOPMENT OF BANKS IN OF MOLDOVA
Lorina BURUIANĂ, drd., ASEM Lorina BURUIANĂ, PhD student, ASEM
Articolul reflectă realizările autorului în domeniulperfecţionării cadrului normativ privind investiţiile însectorul bancar din Republica Moldova, contribuind larelevarea celor mai importante aspecte ale activităţiibăncilor autohtone în baza cadrului normativ existent şi, înspecial, a celui care vizează investiţiile în sectorul bancar.
Cuvinte cheie: bănci, sector bancar, investiţii străinedirecte, cadru normativ.
The article reflects the author's achievements inimproving the regulatory framework for investments in thebanking sector of the Republic of Moldova, helping toreveal the most important aspects of domestic banks underthe existing regulatory framework and in particulartargeting investments in the banking sector.
Keywords: banking, banking sector, foreign directinvestments, regulatory framework.
JEL: P45, G34
Introducere. Reformele economice care au derulat înRepublica Moldova pe parcursul ultimilor ani au pus înevidenţă necesitatea si importanţa sectorului bancar pentrueconomia autohtonă. Pentru a spori capacitatea băncilor dea satisface necesităţile actuale ale economiei, BancaNaţională, prin perfecţionarea cadrului normativ, poateinfluenţa modul de funcţionare a acestora. Investiţiile,inclusiv cele străine reprezintă un element necesardezvoltării băncilor autohtone.
Conţinutul de bază. Analizând evoluţia sectoruluibancar autohton în perioada 2008-2012, se poate menţionacă la finele anului 2008 în Republica Moldova funcţionau16 bănci licenţiate, inclusiv trei sucursale ale băncilorstrăine [2, p.72]. La finele anului 2011 în RepublicaMoldova funcţionau doar 15 bănci licenţiate de BancaNaţională a Moldovei, inclusiv 4 sucursale ale băncilor şigrupurilor financiare străine. În anul 2012 a fost retrasălicenţa băncii B.C. „Universalbank” S.A., iniţiindu-seprocesul de lichidare silită, în conformitate cu Legeainstituţiilor financiare [2, p.72].
În perioada analizată diminuarea numărului de bănci afost cauzată, în mare parte, falimentelor, situaţie careaccentuează suplimentar incapacitatea băncilor mici dinRepublica Moldova de a se conforma proceselor de fuziunesau achiziţii prin intermediul capitalului străin, fapt care aravea un efect pozitiv asupra sectorului bancar.
Luând în consideraţie faptul că anume prin investiţiilestrăine directe se poate atinge obiectivul de stabilire alegăturilor economice durabile, impactul lor asuprasectoarelor în care au fost efectuate este simţitor. Dar,totodată, sectorul bancar se deosebeşte de celelalte sectoareale economiei naţionale prin reglementările bancarespecifice, elaborate de Banca Naţională a Moldovei.
Conform legislaţiei autohtone, investiţiile directe seefectuează prin următoarele modalităţi [4, p. 9]:
a) constituirea unei unităţi de drept aparţinând integralinvestitorului care furnizează capitalul social (sauechivalentul acestuia); majorarea de către investitor acapitalului social (sau a echivalentului acestuia) al unităţiide drept care aparţine integral investitorului; cumpărarea
Introduction. The economic reforms that havedeveloped in Moldova over the past years havehighlighted the need and importance of the banking sectorto the national economy. To enhance the ability ofbanks to meet the current needs of the economy, theNational Bank, by improving the regulatory frameworkmay affect their operation. Investments, including foreignones are a necessary element in the development ofdomestic banks.
Basic content. Analyzing the evolution of thedomestic banking sector in the period 2008-2012, it maybe mentioned that at the end of 2008 in Moldovawere 16 licensed banks, including three foreign bankbranches [2, p.72]. At the end of 2011 in Moldovafunctioned only 15 banks licensed by the NationalBank, including four branches of foreign banks andfinancial groups. In 2012, “Universalbank” bank's licensewas revoked and was initiated the process of forcedliquidation in accordance with the Financial InstitutionsAct [2, p.72].
In the analyzed period, the reduction of the number ofbanks was due, in large part to bankruptcies, a situationwhich further emphasizes the inability of small banks in theRepublic of Moldova to comply with the merger oracquisition process by foreign capital, which would have apositive effect on the banking sector.
Considering that namely through foreign developmentinvestments can be achieved the goal of establishing lastingeconomic links, their impact on the sectors in which theywere made is significant. But at the same time, the bankingsector differs from other sectors of the national economyby specific banking regulations, developed by the NationalBank of Moldova.
Under domestic law, direct investment is made in thefollowing ways [4, p. 9]:
a) The establishment of a law unit belonging entirely tothe investor providing the capital (or equivalent); theincrease of social capital (or its equivalent) by the investoras the unit belongs entirely to the investor; the acquisitionof an entire existing law unit;
Revistă teoretico-științifică / Theoretical and scientifical journal188
Nr. 3 / 2013
integrală a unei unităţi de drept existente;b) participarea într-o unitate de drept nouă sau într-una
existentă în scopul stabilirii sau menţinerii legăturiloreconomice durabile1;
c) acordarea şi primirea împrumuturilor/creditelor petermen lung (pentru o perioada mai mare de 5 ani) în scopulstabilirii sau menţinerii legăturilor economice durabile;
d) construirea de clădiri sau alte bunuri imobile,procurarea de terenuri, clădiri sau alte bunuri imobilenecesare pentru desfăşurarea activităţii unităţii de dreptcare este obiect al investiţiei directe;
e) reinvestirea veniturilor obţinute din investiţiiledirecte în scopul menţinerii legăturilor economice durabile.
Conform cadrului conceptual din “Balanţa de plăţi şipoziţia investiţională internaţională a Republicii Moldova[1, p. 4] – “Investitor direct într-o întreprindere seconsideră acel investitor străin care deţine cel puţin 10 lasută din capitalul social sau din voturi într-o întreprinderesituată în afara propriei ţări de rezidenţă. Relaţia„investiţie directă” se extinde asupra întreprinderilor încare s-au investit bunuri materiale şi/sau bani şi asupraîntreprinderilor asociate cu ele, adică se referă lainvestiţiile între întreprinderile asociate, filialele şicentralele lor.”
Operaţiunile aferente investiţiilor directe se clasifică încele efectuate: de către nerezidenţi în Republica Moldova şide către rezidenţi în străinătate. Pentru prezentul articolprezintă interes investiţiile directe efectuate în sectorulbancar din Republica Moldova de către nerezidenţi.
“Investiţiile externe în sectorul bancar autohton suntconsiderate mijloacele valutare străine convertibile în MDLla cursul valutar oficial, care sunt utilizate conformlegislaţiei pentru procurarea acţiunilor băncilor licenţiate cuscopul obţinerii profitului şi a unui anumit grad de controlasupra activităţii şi managementului băncii licenţiate” [3,p.160]. Conform legislaţiei naţionale, investiţiile încapitalul băncii ale persoanelor rezidente în zonele off-shore nu trebuie să depăşească mărimea cotei substanţiale2.
Conform reglementărilor menţionate anterior3, rezultăcă noţiunea de investiţie străină directă este definită ca oparticipare într-o unitate de drept, care asigură legăturileeconomice durabile în cazul deţinerii a cel puţin 10% dincapitalul său social. După acelaşi principiu (adică 10 % saumai mult din capitalul statutar), în contul financiar albalanţei de plăţi, este reflectat fluxul de ISD în sectorulbancar. Însă, noţiunea de „investiţii străine directe” înlegislaţia bancară lipseşte. Totodată, în “Regulamentul cuprivire la deţinerea cotei substanţiale în capitalul băncii”
b) Participation in a new unit or existing one as apurpose of establishing or maintaining lasting economiclinks;
c) Granting and receiving loans/credits per term (for aperiod longer than five years) for the purpose ofestablishing or maintaining lasting economic links;
d) The construction of buildings or other real estate,purchase of land, buildings or other immovable propertynecessary for the operation of the unit as it is the object ofthe direct investment;
e) Reinvestment of income from direct investments inorder to maintain sustainable economic relations.
According to the conceptual framework of "Balance ofpayments and international investment position ofMoldova [1, p. 4] - "The direct investor in an enterprise isconsidered the foreign investor that holds at least 10percent of the capital share or voting in an enterpriselocated outside the country of residence. The relationship"direct investment" expands on the firms in whichhave been invested goods and/or money and thebusinesses associated with them, which refers toinvestments between associated companies, subsidiariesand their headquarters."
Operations related to direct investment are classifiedinto those performed: by non-residents in Moldova and byresidents of Moldova abroad. This article shows interest inthe banking sector direct investments made by non-residents of the Republic of Moldova.
"Foreign investment in the domestic banking sector areconsidered foreign currency convertible in MDL at theofficial exchange rate used to purchase shares under thelaws of licensed banks in order to obtain profit and acertain degree of control over the work and management ofthe licensed bank" [3, p.160]. According to the nationallegislation, investment in the bank by persons residing inoffshore areas must not exceed the size of a significantshare.
According to the rules mentioned above3, the conceptof a direct investment is defined as an interest in a lawenforcement unit that provides sustainable economic tieswhen holding at least 10% of its capital share. Followingthe same principle (ie 10 % or more of the statutorycapital), in the financial account of the balance ofpayments, foreign direct investment flows reflectedin the banking sector. However, the term "foreigndirect investment" in banking legislation is missing.However, the "Regulation on holding significant interest ina bank" [6], is reflected as a substantial share" is a
1 Legăturile economice durabile reprezintă relaţii stabilite ca urmare a deţinerii într-o unitate de drept a unei participaţiuni ce constituie10% sau mai mult din capitalul social (sau echivalentul acestuia) ori din numărul de participaţiuni cu drept de vot al unităţii de drept sau aunei participaţiuni care să permită exercitarea de către investitor a unei influenţe considerabile asupra administrării sau activităţii unităţiide drept în care se investeşte capitalul.2 Cota substanţială este un drept de proprietate direct sau indirect care reprezintă echivalentul de 5 la sută sau mai mult din capitalul bănciilicenţiate sau din dreptul de vot ori care permite exercitarea unei influenţe considerabile asupra managementului sau activităţii acesteia[116, p.3].3 Legea privind reglementarea valutara nr.62-XVI din 21 martie 2008. Monitorul Oficial al Republicii Moldova nr.127-130/496 din18.07.2008 (varianta compilată cu includerea modificărilor şi completărilor); Balanţa de plăţi şi poziţia investiţională internaţională aRepublicii Moldova.

ECONOMIE ŞI SOCIOLOGIE / ECONOMY AND SOCIOLOGY 189
Nr. 3 / 2013
[6] este reflectată cota substanţială ca “fiind un drept deproprietate ce reprezintă echivalentul de 5 la sută, sau maimult, din capitalul unităţii economice care permiteexercitarea unei influenţe considerabile asupramanagementului sau activităţii acesteia”. Din acesteconsiderente, actualmente, în Republica Moldova seconsideră obligatorie permisiunea scrisă a Băncii Naţionalea Moldovei, în cazul în care investitorul deţine o cotăsubstanţială în capitalul băncii.
În această ordine de idei, menţionăm că, influenţeimportante asupra activităţii băncii în care s-a investit, arputea avea atât investitorul direct, cât şi cel care deţine ocotă substanţială în capitalul băncii. Drept urmare, înlimitele sectorului bancar aceste două noţiuni (ISD şi cotasubstanţială) pot fi tratate ca noţiuni similare, astfel, fiindnecesară expunerea poziţiei organelor abilitate vis-a-vis deaceste două noţiuni, în vederea delimitării importanţei şiimpactului investiţiilor corespunzătoare acestor douănoţiuni asupra băncilor autohtone.
Luând în consideraţie că, reglementările bancare au uncaracter specific comparativ cu cele ale altor sectoare aleeconomiei, în opinia noastră, ISD într-o bancă pot ficonsiderate “investiţiile efectuate de un investitor străinîntr-o bancă din Republica Moldova în mărimea coteisubstanţiale din capitalul băncii licenţiate în scopulstabilirii sau menţinerii legăturilor economice durabile ceoferă posibilitatea de a influenţa considerabil activitateabăncii în care s-a investit”.
În urma analizei privind investiţiile străine directe înbănci, efectuate atât la nivel naţional cât şi internaţional,s-a observat că băncile prezintă un interes de lungă duratăpentru investitorii străini, dacă aceştia din urmă practicăactivităţi bancare. Investitorii străini care practică activitatebancară şi care deţin şi controlează unităţi bancare înstrăinătate sunt numiţi „bănci multinaţionale”. Băncilemultinaţionale, dispunând de anumite experienţe acumulatedin practicile internaţionale privind îmbunătăţireaproduselor şi serviciilor bancare, pot contribui, în proporţiimai impunătoare, la dezvoltarea băncilor autohtone.
În vederea atingerii scopului propus în prezentul articol,s-a analizat la nivel naţional şi internaţional fluxul decapital străin în bănci. Ca rezultat a analizei efectuate, s-aobservat că, în cazul în care, calitatea de investitor străinrevine persoanelor fizice, fondurilor de investiţii sau altorunităţi care nu practică activitate bancară, investiţia străinăeste de scurtă durată şi fără impact asupra activităţii băncii(rezultat valabil pentru 96% din cele 50 de bănci analizate).În cazurile respective, investitorii străini urmăresc doarobţinerea profitului maxim în condiţii de risc minim,indiferent de cota pe care o deţin în structura capitaluluibăncii. Ca rezultat al acestor analize, se poate identificatipul de investitor străin care influenţează pozitivactivitatea băncilor şi, anume, băncile multinaţionale.
În contextul problematicii abordate în prezentul articol,menţionăm că investiţiile străine directe reprezintă onecesitate reală şi obiectivă pentru sectorul bancar dinRepublica Moldova în vederea consolidării acestuia. Dar,atragerea ISD în sectorul bancar autohton depinde, în maremăsură, de stabilitatea acestuia, care este asigurată desupravegherea bancară. Banca Naţională este unica
property right which is the equivalent of 5 percentor more of the capital of the economic entity in order toexercise a significant influence over the management oractivity of the company." Therefore, now in Moldova it isconsidered mandatory to have a written permission of theNational Bank, when the investor holds a significantinterest in the bank.
In this context, we note that significant influence overthe activities of banks that has been invested in could havethe direct investor, as well as one that has a significantshare in the bank’s capital. Accordingly, within thebanking sector these two notions (FDI and substantialshare) can be treated as similar concepts, so it is necessaryto know the opinion of regulated bodies regarding thesetwo concepts in order to define the importance and impactof investments, corresponding to these two terms, on thedomestic banks.
Considering that banking regulations are morespecific than those of other sectors of the economy, in ourview, FDI in a bank can be considered "investmentby a foreign investor in a bank in the Republic ofMoldova in the amount of a significant share of thelicensed bank’s capital for the purpose of establishingor maintaining lasting economic links that offer theability to significantly influence the investee bank'sactivity".
After analysis performed at national and internationallevels on FDI in banks, it was observed that banks areshowing interest for long-term investors, if the latter practicebanking activities. Foreign investors and banking practicesthat own and control outlets abroad are called "multinationalbanks." Multinational banks have accumulated someexperience of international practices to improve bankingproducts and services and can contribute in imposingproportions to the development of domestic banks.
In order to achieve the purpose stated in this article,we analyzed national and international flow of foreigncapital into banks. As a result of this analysis, it wasobserved that if the quality of investor returns toindividuals, investment funds and other entities that haveno banking, foreign investment is short-lived and has noimpact on the bank (valid result for 96% of the 50 banksanalyzed).
Substantial share is a direct or indirect ownership whichis the equivalent of 5 percent or more of the licensed bank'scapital or voting rights or to exercise a significant influenceover the management or its activity [116, p.3].
2 Law on Foreign Exchange Regulation No.62-XVIdated March 21, 2008. Monitorul Official of the Republicof Moldova from 18.07.2008, nr.127-130/496 (compiledversion including amendments), balance of payments andinternational investment position of the Republic ofMoldova.
In such cases, foreign investors seek only to obtainmaximum profit under minimum risk conditions, regardlessof the share they hold in the capital structure of the bank.As a result of these analyzes, we can identify the type ofinvestor that influences positively on banking activity, andnamely, multinational banks.
In the context of the issues addressed in this article,

Revistă teoretico-științifică / Theoretical and scientifical journal190
Nr. 3 / 2013
instituţie care efectuează licenţierea, supravegherea şireglementarea activităţii instituţiilor financiare înRepublica Moldova. Procesul de supraveghere bancară înRepublica Moldova presupune două etape:
1. Autorizarea instituţiilor bancare, prin eliberareaautorizaţiei de constituire şi funcţionare. În această etapă,banca trebuie să probeze: capacitatea acţionariatului de asusţine activitatea băncii, inclusiv şi în cazul investitorilorstrăini; abilitatea echipei manageriale; calitatea morală aacţionarilor care deţin cote substanţiale şi a echipeimanageriale; respectarea legalităţii în privinţa conceperiiactelor constitutive; fezabilitatea planului de afaceri albăncii; îndeplinirea condiţiilor tehnice, materiale şifinanciare necesare pentru funcţionarea băncii. BNMmanifestă cerinţe de prudenţă faţă de procesul de autorizarea băncilor, inclusiv cu capital străin, în vederea de a creabănci cu o activitate ulterioară fiabilă, care la momentulautorizării sunt lipsite de condiţii prealabile pentruefectuarea operaţiunilor riscante în viitor. În sensul de aproteja sectorul bancar autohton, BNM impune exigenţesporite la cererea de primire a licenţei privind desfăşurareaactivităţilor financiare de către sucursalele băncilor străine.
2. Supravegherea propriu-zisă. Presupunemonitorizarea activităţii băncii, care vizează evoluţiaacesteia în economie şi îndeplinirea criteriilor deprudenţialitate şi performanţă bancară. Astfel, BNMurmăreşte îndeplinirea nivelurilor minime pentru o serie deindicatori de prudenţă bancară, cum ar fi: nivelul minim alcapitalului social; constituirea rezervelor minimeobligatorii şi a rezervelor legale; îndeplinirea unui nivelminim de solvabilitate şi lichiditate bancară; clasificareasistematică a portofoliului de credite; crearea deprovizioane bancare; respectarea nivelurilor maxime deexpunere etc.
În baza celor menţionate mai sus, subliniem că sistemulbancar autohton tinde să se dezvolte în conformitate custandardele elaborate de organismele financiareinternaţionale, specializate în acest domeniu, inclusivconform standardelor stabilite de Directivele UniuniiEuropene, de Comitetul Basel pentru supraveghere bancarăeficientă. În procesul de consolidare şi de atragere ainvestiţiilor străine directe în sectorul bancar, BNMpreîntâmpină apariţia unor bănci problematice. Astfel,luând în consideraţie gradul insuficient de supraveghere şireglementare bancară din zonele off-shore (derulareaoperaţiunilor fără justificarea provenienţei banilor, fărăraportarea activităţilor întreprinse către autoritatea din ţarade origine, efectuarea unor operaţiuni bancare restricţionateîn ţara de origine etc.), BNM impune restricţii privindinvestiţiile din zonele off-shore indiferent de mărimeatranzacţiei.
Cu toate acestea, băncile aplică în continuarestandardele Basel I, astfel băncile din Republica Moldovarămânând în urma practicilor internaţionale la acest capitol.Principiile Basel II au fost elaborate în anul 2004, iar celeale Basel III – în 2009. Standardele noi sunt importante atâtpentru bănci, cu scopul asigurării unei activităţi prudenţialeşi profitabile, cât şi pentru regulator, în scopul administrăriimai eficiente a expunerii băncilor la riscuri. Implementareastandardelor Basel II şi III urmăreşte modificarea cerinţelor
note that foreign direct investment is a realistic andobjective necessity for the banking sector of the Republicof Moldova in order to strengthen it. But attracting FDI inthe domestic banking sector depends largely on its stability,which is ensured of by banking supervision. The NationalBank is only responsible for licensing, supervision andregulation of financial institutions activities in Moldova.The banking supervision process in Moldova requires twosteps:
1. Authorization of banking institutions, throughachievement of the establishment and operationauthorization. At this stage, the bank must prove: theability of shareholders to support the activities of the bank,including for foreign investors, the ability of themanagement team, the moral quality of shareholdersholding substantial shares and the management team;respecting legal terms regarding establishing papers,feasibility of the business plan of the bank, fulfillment ofthe technical conditions, material and financial resourcesfor the proper operation of the bank. NBM shows cautionrequirements regarding the banks’ authorization process,including foreign banks in order to create a sustainablefuture activity, which when are authorized lackprerequisites for risky operations in the future. For thepurposes of protecting the domestic banking sector, theNBM has high demands in the application requirements forreceiving the license on financial activities for foreignbanks subsidiaries.
2. Proper supervision. Includes monitoring the bank,aimed at its development in the economy, and fulfillingprudential criteria and banking performance. The Bankseeks to achieve minimum levels for a number ofprudential indicators such as: the minimum capital,minimum reserves and legal reserves, carrying a level ofminimum bank solvency and liquidity; systematicclassification of the loans’ portfolio, creating bankreserves, compliance with the maximum levels ofexposure etc.
Based on the above, we emphasize that the domesticbanking system tends to develop in accordancewith standards developed by international financialinstitutions specialized in this field, including standards setby EU directives, the Basel Committee on EfficientBanking Supervision. In the process of building andattracting foreign direct investment in the banking sector,the NBM prevents the emergence of problematic banks.Thus, given the insufficient level of supervision andregulation of offshore banking (conducting operationswithout justifying the origin of money, withoutreporting the activities undertaken by the authority of thecountry of origin, conducting banking transactionsrestricted in the home country etc.), BNM appliesrestrictions when it comes to offshore investmentsregardless of the transaction size .
However, banks continue to apply Basel I standards soMoldovan banks lag behind international practices in thisregard. Basel II Principles were developed in 2004 andthose of the Basel III - in 2009. The new standards areimportant both for banks in order to ensure prudent andprofitable activities, and for the governor to administer

ECONOMIE ŞI SOCIOLOGIE / ECONOMY AND SOCIOLOGY 191
Nr. 3 / 2013
pentru supravegherea băncilor la capitolul expunerea lariscuri. Analizând practicile internaţionale, am identificatcă toate ţările Uniunii Europene şi SUA au implementatstandardele Basel II şi III. Ţările Africii au implementatstandardele Basel II şi analizează posibilitatea de tranziţiela principiile Basel III [8, pag. 42-54].
Concluzii şi recomandări. Analizând articolele despecialitate, precum şi studiile privind experienţafuncţionării mai multor sisteme bancare naţionale înregimul Acordului Basel II, am sistematizat principalelerezultate ale implementării Acordului Basel II în sectorulbancar autohton: asigurarea concurenţei corecte în sectorulbancar; asigurarea stabilităţii financiare a sectorului bancar;îmbunătăţirea imaginii sectorului bancar autohton pe planinternaţional; consolidarea supravegherii realizate de bancacentrală, contribuind, în ansamblu, la atragerea investiţiilorstrăine directe în Republica Moldova.
În vederea perfecţionării actelor normative existenteprivind penetrarea investiţiilor în sectorul bancar autohtonrecomandăm următoarele:
1. Reieşind din cele menţionate, precum şi din prevederilecelui de-al 12-lea Principiu de Bază al Comitetului Basel,considerăm oportună dezvoltarea în RM a supravegheriibancare pe bază consolidată, ceea ce reprezintăsupravegherea realizată de către BNM a activităţiiinvestitorilor străini, inclusiv a băncilor multinaţionale şinu doar a activităţii în Republica Moldova a subsidiareiacestora. Principiile acestui tip de supraveghere s-au extins,în special, odată cu fenomenul de integrare europeanăreprezentând o cerinţă a acquis-ului comunitar;
2. Bazându-ne pe reglementările bancare elaborate deBanca Naţională a Moldovei, şi reieşind din necesitateaprotejării investitorilor direcţi şi a protejării băncilor locale,propunem BNM de a modifica art.15 pct.1.a al „Legiiinstituţiilor financiare” în următoarea redacţie: „Transferulunei cote de participare la capitalul băncii se efectueazăexclusiv cu permisiunea prealabilă scrisă a BNM, subsancţiunea nulităţii absolute, prin tranzacţii sau alte actejuridice, indiferent de mărimea cotei investiţiei efectuate încapitalul băncii”;
3. Reieşind din practicile internaţionale existentepropunem BNM facilitarea investiţiilor străine directeefectuate în proporţie de 100% în capitalul băncilorautohtone, fiind identificat impactul pozitiv al acestoraasupra dezvoltării băncilor din ţările receptoare, cum este şiRepublica Moldova;
4. Având la bază cercetările efectuate, propunem BNMacordarea unor privilegii băncilor multinaţionale în calitatede investitor străin, ţinând cont de faptul că acestea dinurmă dispun de practici bune de preluat privindîmbunătăţirea produselor şi serviciilor bancare,contribuind, astfel, la dezvoltarea băncilor autohtone;
5. În scopul protejării investiţiilor, inclusiv în sectorulbancar, propunem modificarea respectivului aliniat, dupăcum urmează: „Persoanele fizice sau juridice, careintenţionează să achiziţioneze o cotă substanţială încapitalul societăţii (inclusiv băncii) urmează, până la dataefectuării tranzacţiei cu valorile mobiliare, să obţinăacordul Comisiei Naţionale a Pieţei Financiare”.Suplimentar, propunem extinderea art. 28 al capitolului III
more effectively the banks' exposure to risk.Implementation of Basel II and III seeks to amend therequirements for supervision of banks in the chapterexposure to risk. Analyzing international practice, wefound that all EU countries and the U.S. have implementedBasel II and III. African countries have implemented BaselII standards and are considering the transition to Basel IIIprinciples [8, pp. 42-54].
Conclusions and recommendations. Analyzingspecialized articles and studies on the experience of severalnational banking systems functioning under the Basel IITreaty, we systematized the main results of theimplementation of Basel II in the domestic banking sector:ensuring fair competition in the intended banking area:financial stability of the banking sector; improvingthe image of the local banking sector internationally,strengthen supervision by the central banks,contribute overall to attract foreign direct investments inMoldova.
In order to improve the existing legal acts regardinginvestments in the domestic banking sector we recommendthe following:
1. Based on the above, as well as the provisions of the12th basic principle of the Basel Committee, we considerappropriate the development in Moldova of bankingsupervision on a consolidated basis, which is supervisingthe work carried out by the NBM supervising foreigninvestors, including multinational banks and not just theactivity of their subsidiary in Moldova. The principles ofthis type of surveillance have expanded especially with thephenomenon of European integration, a requirement of thecommunity acquis.
2. Based on our banking regulations developed by theNational Bank of Moldova, and given the need to protectdirect investors and local banks, we suggest that NBMchanges pct.1.a art. 15 of the "Law on FinancialInstitutions" in the following wording: "The transfer of aparticipation share of capital is carried out only with priorwritten permission from NBM, under penalty of nullity, thetransaction or other legal acts, regardless of the size ofinvestments in the share capital of the bank";
3. Given the existing international practices, wesuggest that NBM facilitates foreign direct investments of100% in the capital of domestic banks, their positiveimpact being identified on the development banks inrecipient countries, as is the Republic of Moldova;
4. Based on the conducted research we suggestthat NBM grants privileges to multinational banks asforeign investors, given that the latter have taken goodpractices to improve banking products and services,thereby contributing to the development of domesticbanks;
5. In order to protect the investments, including in thebanking sector, we propose amendments to that paragraph,as follows: "A person or a company intending toacquire a significant share in the company (including bank)below, should obtain the consent of the NationalCommission of Financial Market until the real estatetransaction done.” Additionally, we propose the extensionof art. 28 of Chapter III of that law "The rights and

Revistă teoretico-științifică / Theoretical and scientifical journal192
Nr. 3 / 2013
din respectiva lege „Drepturile şi obligaţiile acţionarilor”cu un aliniat - „Măsuri de protecţie a acţionarilor contrapreluărilor abuzive ale acţiunilor”.
obligations of shareholders" with a paragraph - "Measuresto protect shareholders against the takeovers abusiveactions”.
Referinţe bibliografice/ References1. BANCA NAŢIONALĂ A MOLDOVEI. Balanţa de plăţi și poziţia investiţională internaţională a Republicii
Moldova: anuar statistic. 2011 http://www.bnm.md/md/bnm_balance/index_22357.pdf2. BANCA NAŢIONALĂ A MOLDOVEI. Rapoartele anuale 1999-2012 [accesat 20 mai 2013]. Disponibil:
http://www.bnm.md/md/annual_report3. BORŞ, I. Rolul investiţiilor străine în dezvoltarea sectorului bancar al Republicii Moldova. In: Rolul investiţiilor în
dezvoltarea durabilă a economiei naţionale în contextul integrării europene: conferinţa ştiinţifică internaţională,29-30 octombrie 2010. ASEM. Chişinău, 2010, p. 160. ISBN 978-9975-75-542-9.
4. Legea privind reglementarea valutara: nr. 62-XVI din 21 martie 2008. In: Monitorul Oficial al Republicii Moldova.2008, nr.127-130, art. 496.
5. Legea instituţiilor financiare: nr. 550-XIII din 21 iulie 1995. In: Monitorul Oficial al Republicii Moldova. 2011, nr.78-81, art. 199.
6. Legea Republicii Moldova privind societăţile pe acţiuni Nr. 1134 din 02.04.1997. In: Monitorul Oficial alRepublicii Moldova. 2008, nr. 1-4, art. 1. Republicată în temeiul Legii pentru modificarea şi completarea Legii nr.1134-XIII din 2 aprilie 1997 privind societăţile pe acţiuni: nr. 163- XVI din 13.07.2007. In: Monitorul Oficial alRepublicii Moldova, 2007, nr. 141-145, art. 593. Modificată prin Legea Parlamentului pentru modificarea şicompletarea unor acte legislative: nr. 178 din 11.07.12. In: Monitorul Oficial al Republicii Moldova. 2012, nr. 190-192, art. 644.
7. Regulamentul nr. 42/09-01 cu privire la deţinerea cotei substanţiale în capitalul băncii cu ultimele modificări prinHotărârea Consiliului de administraţie al Băncii Naţionale a Moldovei: nr. 171 din 11.09.2008. In: Monitorul Oficialal Republicii Moldova. 2008, nr. 180-181.
8. Regulamentul nr. 23/09-01 cu privire la licenţierea băncilor, aprobat prin Hotărârea Consiliului de administraţie alBăncii Naţionale a Moldovei: nr. 37 din 15.08.1996. In: Monitorul Oficial al Republicii Moldova. 1996, nr. 59-60,art. 74.
9. TĂBÎRŢĂ, E. et al. Calitatea reglementărilor bancare ale Băncii Naţionale a Moldovei în vederea asigurăriistabilităţii financiare în Republica Moldova. In: Băncile în economia concurenţei, incertitudinii, inovării șiintegrării. Chișinău: ASEM, 2013, vol. I, pp. 14-30.
10. STRATULAT, O., DOHOTARU, M. Basel II: Între așteptări și efecte. In: Băncile în economia concurenţei,incertitudinii, inovării și integrării: simpozion știinţifico-practic internaţional, 19 aprilie 2013. Chișinău: ASEM,vol. I. pp. 42-54.
Recomandat spre publicare: 22.08.2013
ECONOMIE ŞI SOCIOLOGIE / ECONOMY AND SOCIOLOGY 193
Nr. 3 / 2013
CERINŢEde prezentare a articolelor ştiinţifice spre publicare
în revista „Economie şi Sociologie”
În scopul asigurării calităţii şi evaluării echitabile a publicaţiilor ştiinţifice, autorii, la prezentareaarticolelor spre editare, sunt rugaţi să ţină cont de următoarele criterii:
Conţinutul articolului trebuie să corespundă unui nivel ştiinţific înalt al revistei ştiinţifice de categoria„B” a Academiei de Ştiinţe a Moldovei. Articolul trebuie să deţină caracter original şi să conţină o noutatedeterminată. Formulele teoretice trebuie confirmate prin calculări practice. Lucrarea trebuie să prezinte interespentru un mediu vast de cititori ai revistei. Obligatoriu, în articol trebuie indicată distincţia dintre viziuneaautorului sau rezultatele obţinute de cele anterior publicate.
Articolele se prezintă la redacţie, cu două luni până la editare, pe suport electronic (format Word 2003) şitipărite în limba română şi engleză. Textul va fi tipărit pe o singură parte. Tabelele, diagramele şi figurile seprezintă într-o variantă unică, cu textul respectiv în ambele limbi, separate prin bară.Structura articolului:
1. Titlul articolului (Times New Roman, 14pt, centrat, cu majuscule);2. Autorul articolului (Prenumele Numele, gradul ştiinţific, titlul ştiinţific, instituţia – Times New
Roman, aldin, cursiv, 14pt, aliniere de dreapta);3. Adnotare (Times New Roman, 10pt, cursiv, cca 300 de semne, în limba română şi engleză);4. Cuvinte cheie (6-8 cuvinte, Times New Roman, 10pt, cursiv, în limba română şi engleză);5. JEL (numărul conform sistemului de clasificare Journal of Economic Literature);6. Introducere;7. Conţinutul de bază;8. Concluzii;9. Referinţe bibliografice (5-8 surse).
Textul va fi scris: cu caractere – Times New Roman; 14pt; interval – 1,5; Formatul paginii: A4 210x297 mm,
Margini: sus – 15 mm, jos – 20 mm, stânga – 20 mm, dreapta – 20 mm. lucrarea va conţine maxim 8 pagini A4.Elementele grafice (tabele şi figuri) se vor plasa, nemijlocit, după referinţa respectivă în text. Toate
elementele, obligatoriu, sunt însoţite de denumire şi număr de ordine (deasupra tabelului, sub figură), sursăşi, după necesitate, informaţie suplimentară: note, legendă (sub element). Se admit figuri scanate doar decalitate înaltă. La includerea în lucrare a elementelor grafice, autorii sunt rugaţi să ţină cont de formatulde editare a revistei.
Referinţele bibliografice se plasează la sfârşitul articolului în ordine alfabetică (Nume, iniţialaprenumelui, titlu, editură, an, pagini – Times New Roman, 12pt, aliniere de stânga). Lista va conţine 5-8 sursebibliografice. În text se vor indica trimiteri bibliografice, conform numărului de ordine în listă (de ex., [5]).
Articolele tipărite (în 2 exemplare – în limba română şi engleză) se semnează de către autor şi se fixeazădata. La exemplarul de control se anexează recenzia. La prima prezentare a articolului, de asemenea, autorulsemnează, că a făcut cunoştinţă cu cerinţele de prezentare a articolului spre publicare şi, pe fiecare dinexemplarele de control, declaraţia privind responsabilitatea pentru autenticitatea materialului (Notă: Declar peproprie răspundere că lucrarea prezentată este autentică, fără tentă de plagiere. Data prezentării:___Semnătura:____).
Decizia privind publicarea sau excluderea articolului în/din numărul revistei se ia la şedinţa colegiuluiredacţional. Recenzarea articolelor ştiinţifice se face anonimă. Colegiul redacţional nu duce discuţii cu autorularticolului exclus şi are dreptul să nu cerceteze articolele ce nu sunt prezentate conform cerinţelor deprezentare. Manuscrisul articolului nu se restituie.
Într-un număr al revistei, de regulă, se publică doar un articol al unui autor sau coautor.
Colegiul redacţional al revistei „Economie şi Sociologie”

Revistă teoretico-științifică / Theoretical and scientifical journal194
Nr. 3 / 2013
Bun de tipar: 28.09.2013. Tirajul 100 ex.Coli de tipar 23,56. Coli editoriale 28,12. Com. 27.
Complexul-Editorial al IEFS, 2013