psy524 lecture 19 logistic_cont
TRANSCRIPT
8/7/2019 Psy524 Lecture 19 Logistic_cont
http://slidepdf.com/reader/full/psy524-lecture-19-logisticcont 1/29
Logistic Regression
Continued
Psy 524Ainsworth
8/7/2019 Psy524 Lecture 19 Logistic_cont
http://slidepdf.com/reader/full/psy524-lecture-19-logisticcont 2/29
Eq uations
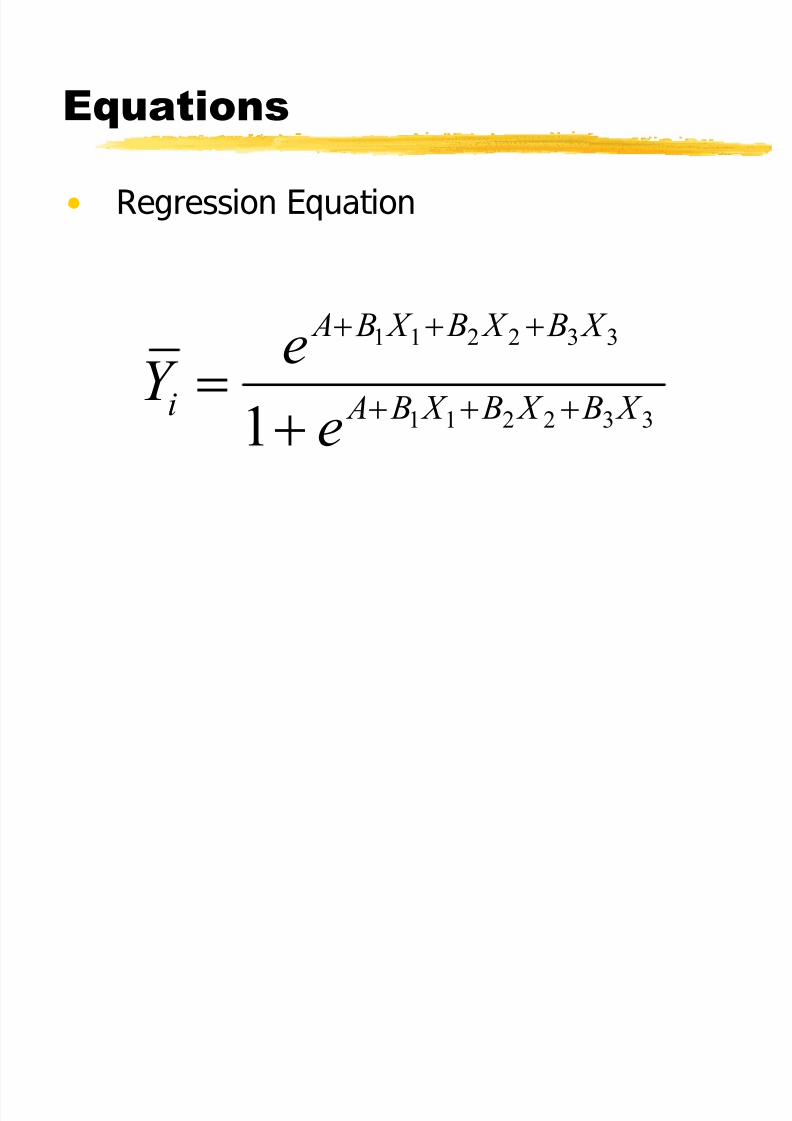
Regression Equation
1 1 2 2 3 3
1 1 2 2 3 31
A B X B X B X
i A B X B X B X
eY
e
!
8/7/2019 Psy524 Lecture 19 Logistic_cont
http://slidepdf.com/reader/full/psy524-lecture-19-logisticcont 3/29
Eq uations
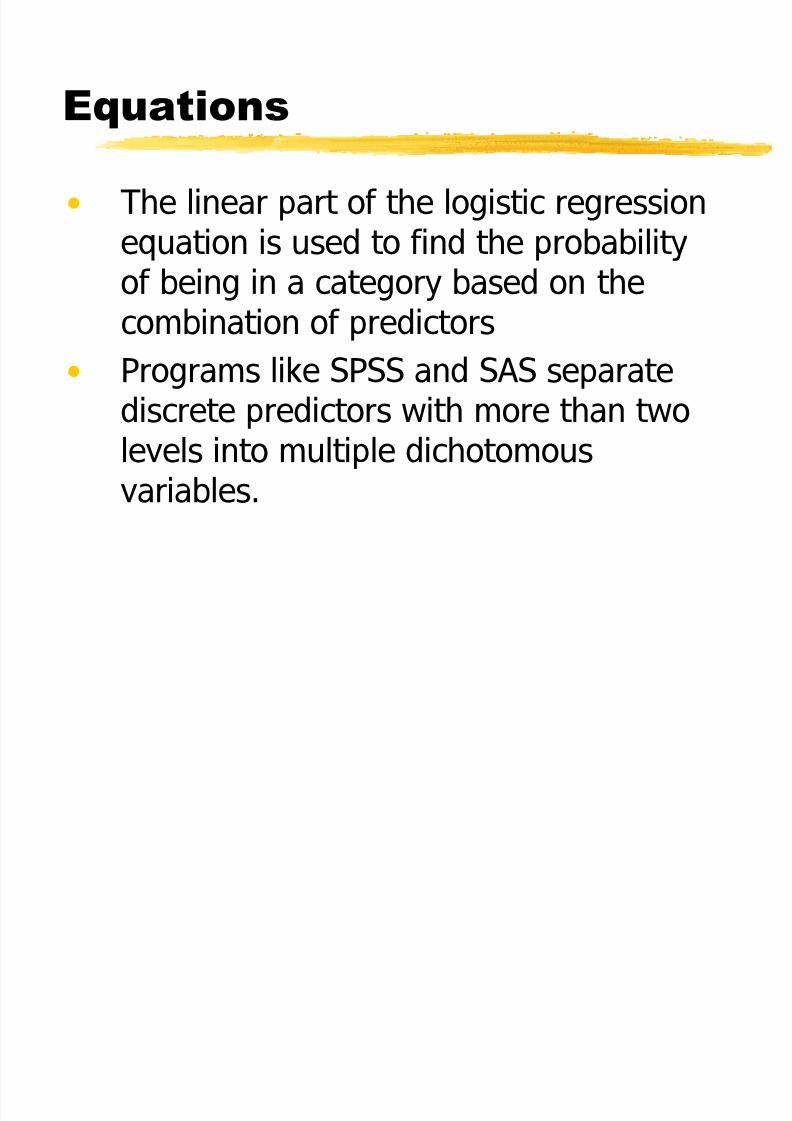
The linear part of the logistic regressionequation is used to find the probabilityof being in a category based on thecombination of predictorsPrograms like SPSS and SAS separate
discrete predictors with more than twolevels into multiple dichotomousvariables.
8/7/2019 Psy524 Lecture 19 Logistic_cont
http://slidepdf.com/reader/full/psy524-lecture-19-logisticcont 4/29
Eq uations
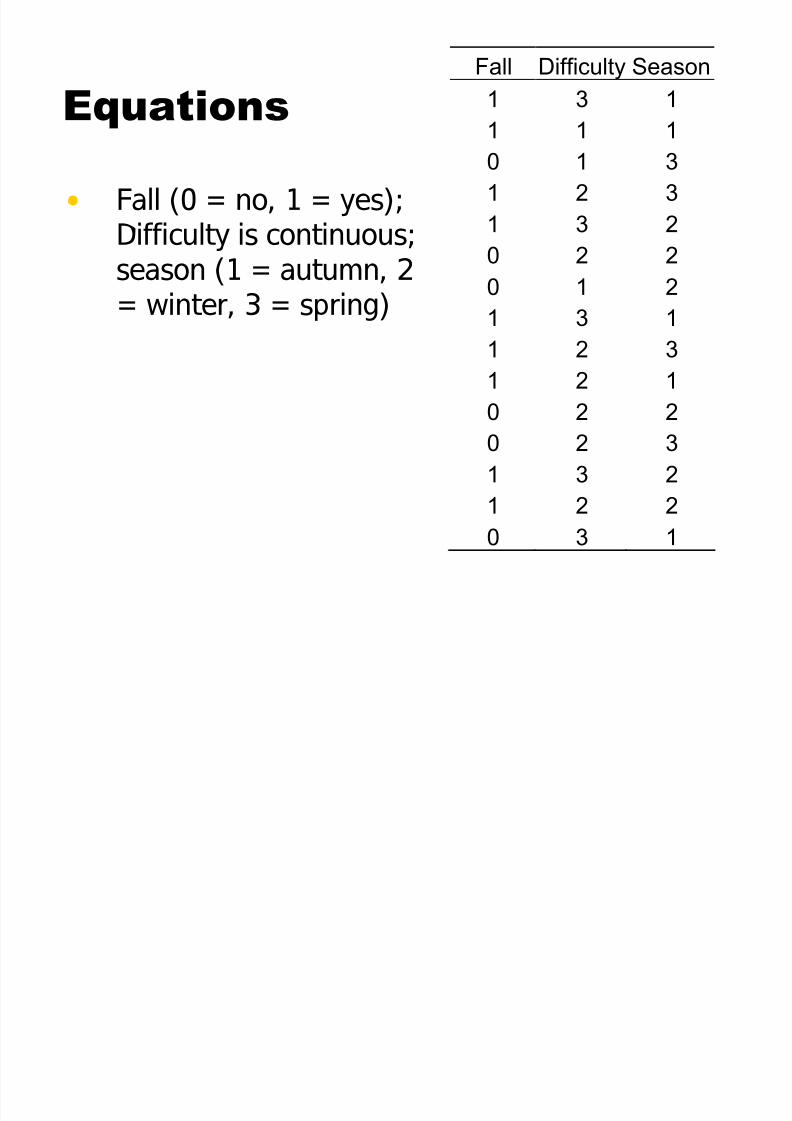
Fall (0 = no, 1 = yes);Difficulty is continuous;
season (1 = autumn, 2= winter, 3 = spring)
Fall Difficulty Season1 3 1
1 1 10 1 31 2 31 3 20 2 20 1 21 3 11 2 31 2 1
0 2 20 2 31 3 21 2 20 3 1
8/7/2019 Psy524 Lecture 19 Logistic_cont
http://slidepdf.com/reader/full/psy524-lecture-19-logisticcont 5/29
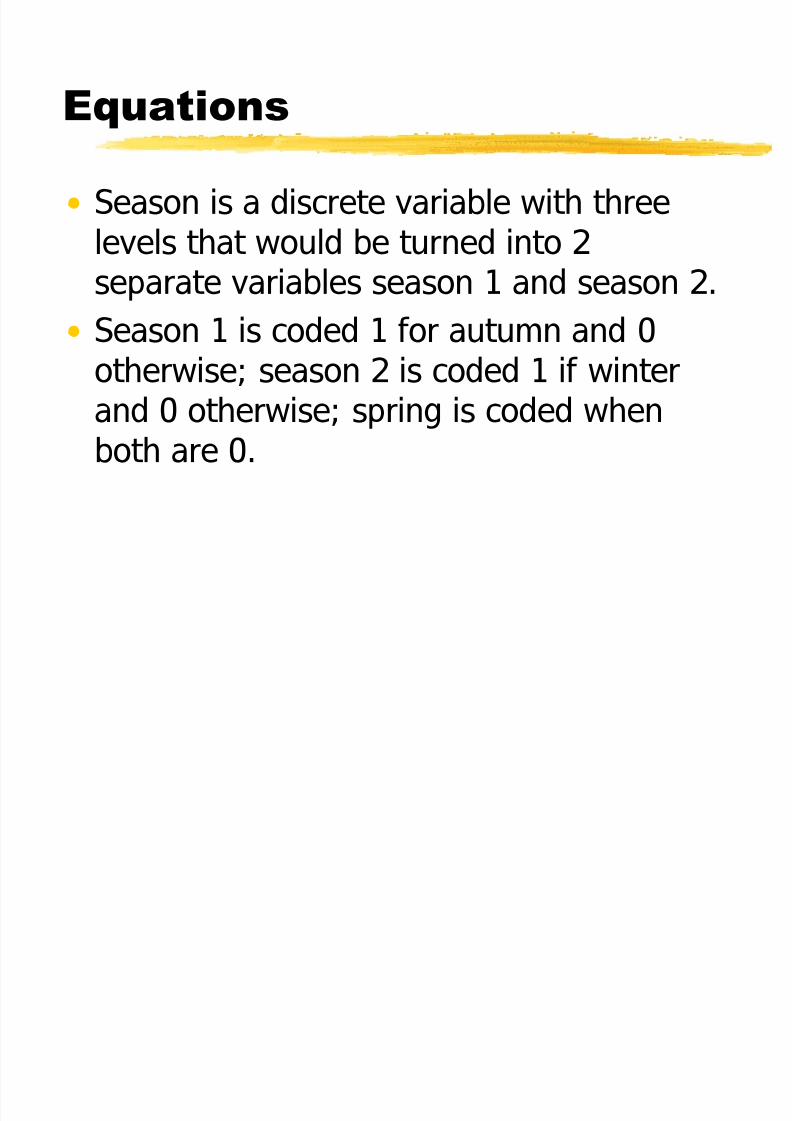
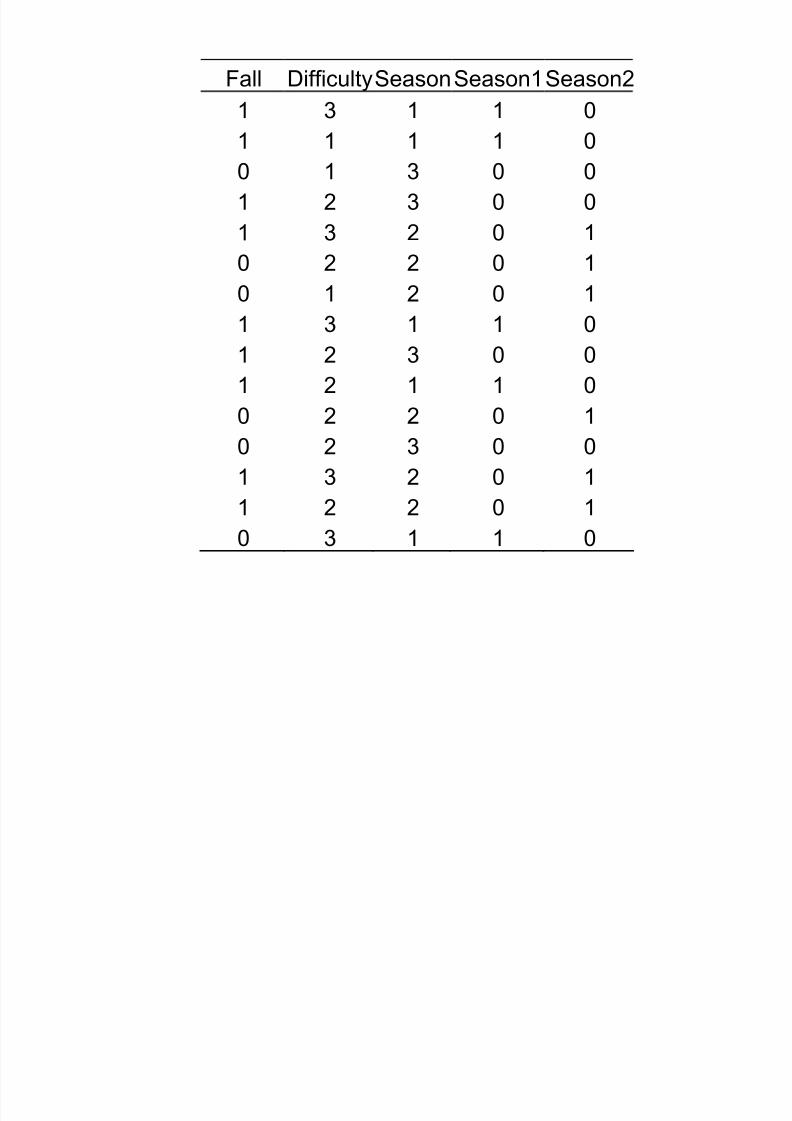
Eq uations
Season is a discrete variable with threelevels that would be turned into 2separate variables season 1 and season 2.Season 1 is coded 1 for autumn and 0otherwise; season 2 is coded 1 if winter
and 0 otherwise; spring is coded whenboth are 0.
8/7/2019 Psy524 Lecture 19 Logistic_cont
http://slidepdf.com/reader/full/psy524-lecture-19-logisticcont 6/29
Fall Difficulty Season Season1 Season21 3 1 1 0
1 1 1 1 00 1 3 0 01 2 3 0 01 3 2 0 10 2 2 0 10 1 2 0 11 3 1 1 01 2 3 0 01 2 1 1 0
0 2 2 0 10 2 3 0 01 3 2 0 11 2 2 0 10 3 1 1 0
8/7/2019 Psy524 Lecture 19 Logistic_cont
http://slidepdf.com/reader/full/psy524-lecture-19-logisticcont 7/29
I nterpreting coefficients
Good news regression coefficients andtheir standard errors are found throughadvanced calculus methods of maximumlikelihood (e.g. derivatives, etc.), sowe re not getting into it.
8/7/2019 Psy524 Lecture 19 Logistic_cont
http://slidepdf.com/reader/full/psy524-lecture-19-logisticcont 8/29
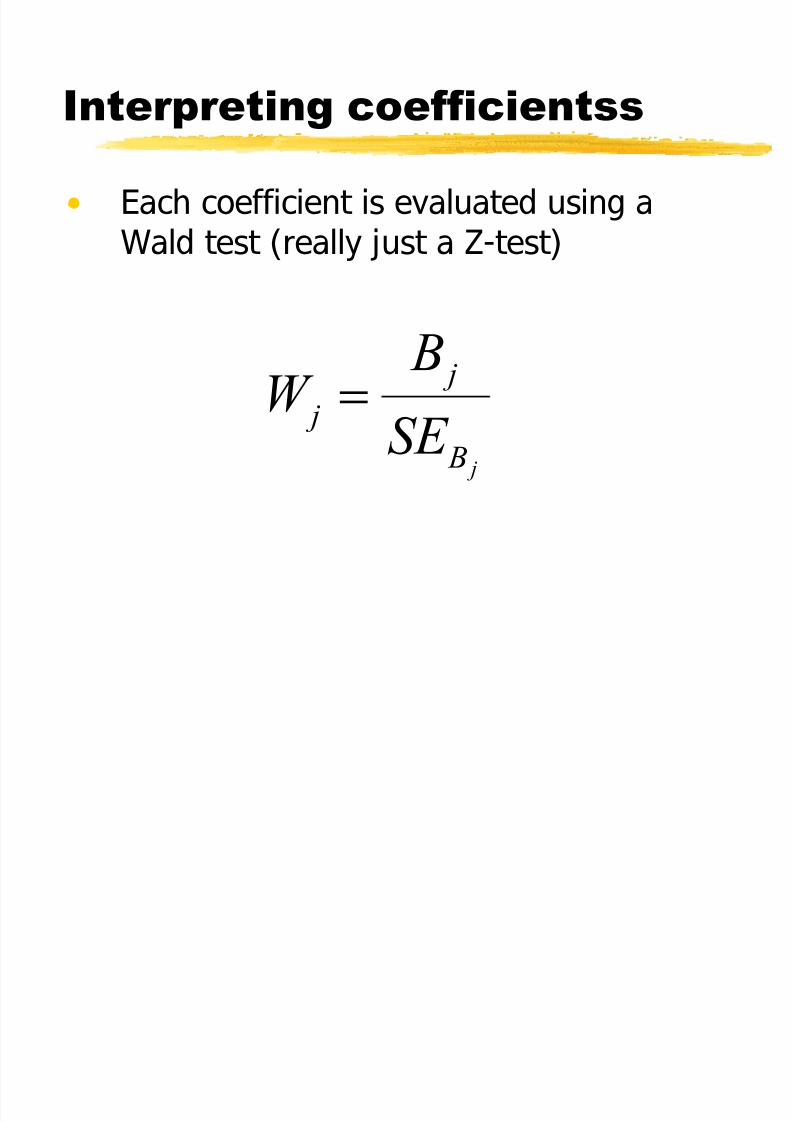
I nterpreting coefficientss
Each coefficient is evaluated using aWald test (really just a Z-test)
j
j
jB
BW
SE !
8/7/2019 Psy524 Lecture 19 Logistic_cont
http://slidepdf.com/reader/full/psy524-lecture-19-logisticcont 9/29
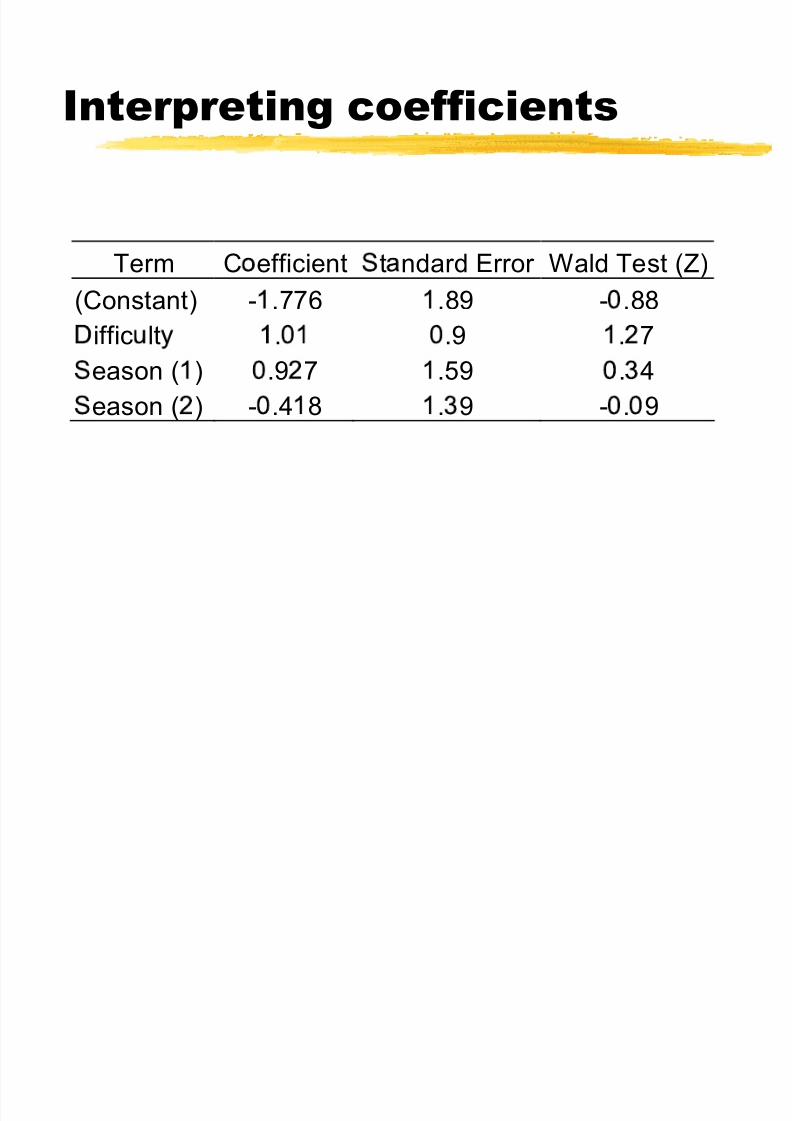
I nterpreting coefficients
Term C e fficien t t ndard E rror Wa ld Te st (Z)(C on st an t) - .776 .89 - .88iffic lt . .9 . 7ea s on ( ) .9 7 .59 . 4
ea s on ( ) - .4 8 . 9 - . 9
8/7/2019 Psy524 Lecture 19 Logistic_cont
http://slidepdf.com/reader/full/psy524-lecture-19-logisticcont 10/29
I nterpreting coefficients
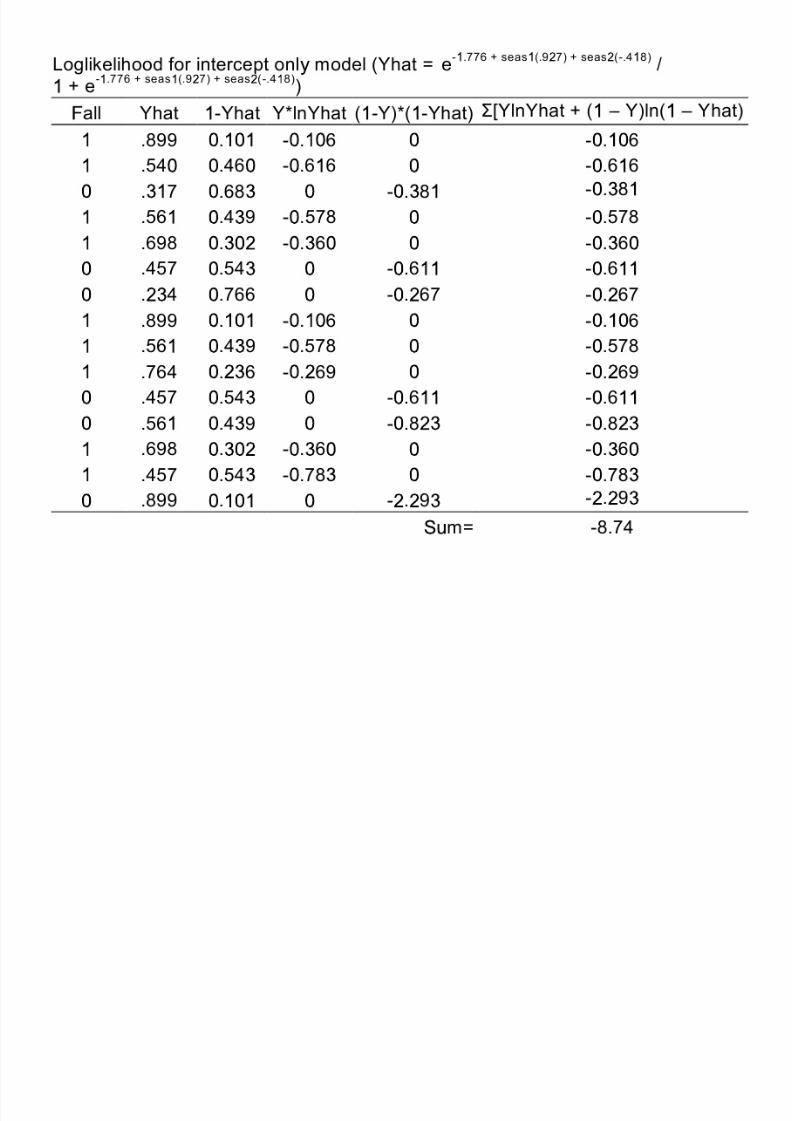
The tests of the coefficients areapproximate z-scores so they are testedas z-scores. None of the coefficients aresignificant in the sample data.The coefficients are placed into the
model like in regular multiple regressionin order to predict individual subjects probabilities.
8/7/2019 Psy524 Lecture 19 Logistic_cont
http://slidepdf.com/reader/full/psy524-lecture-19-logisticcont 11/29
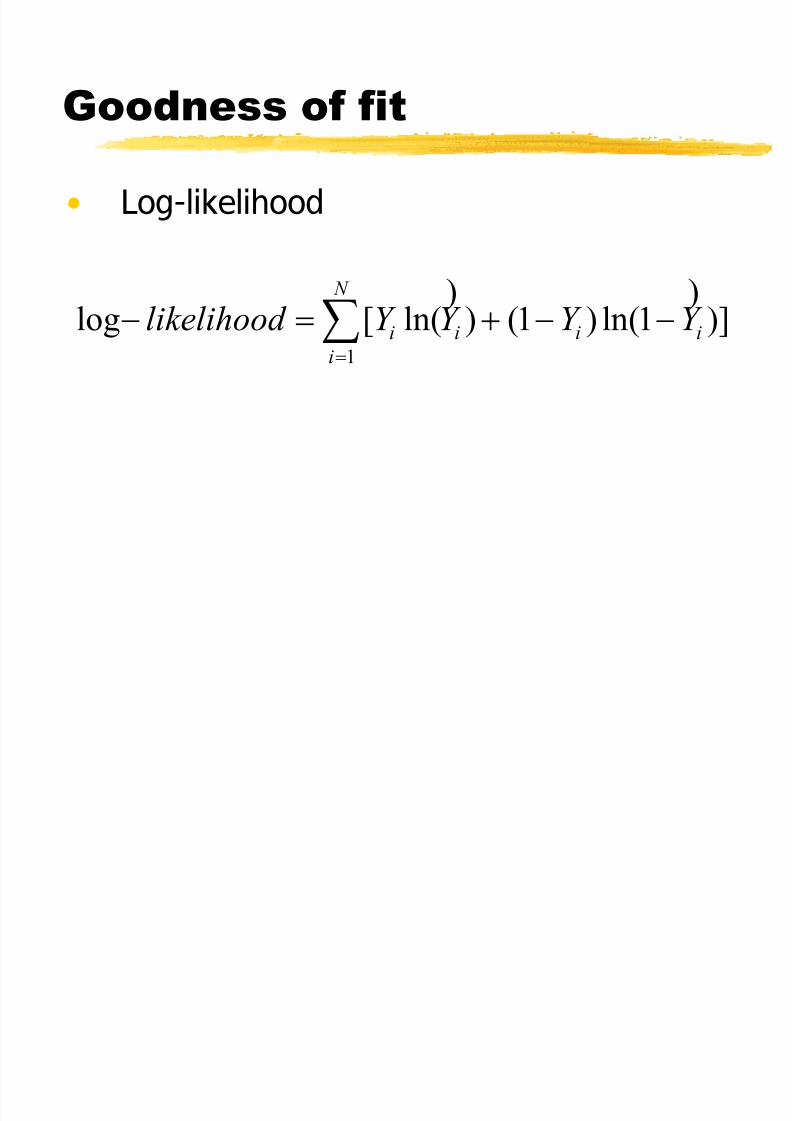
G oodness of fit
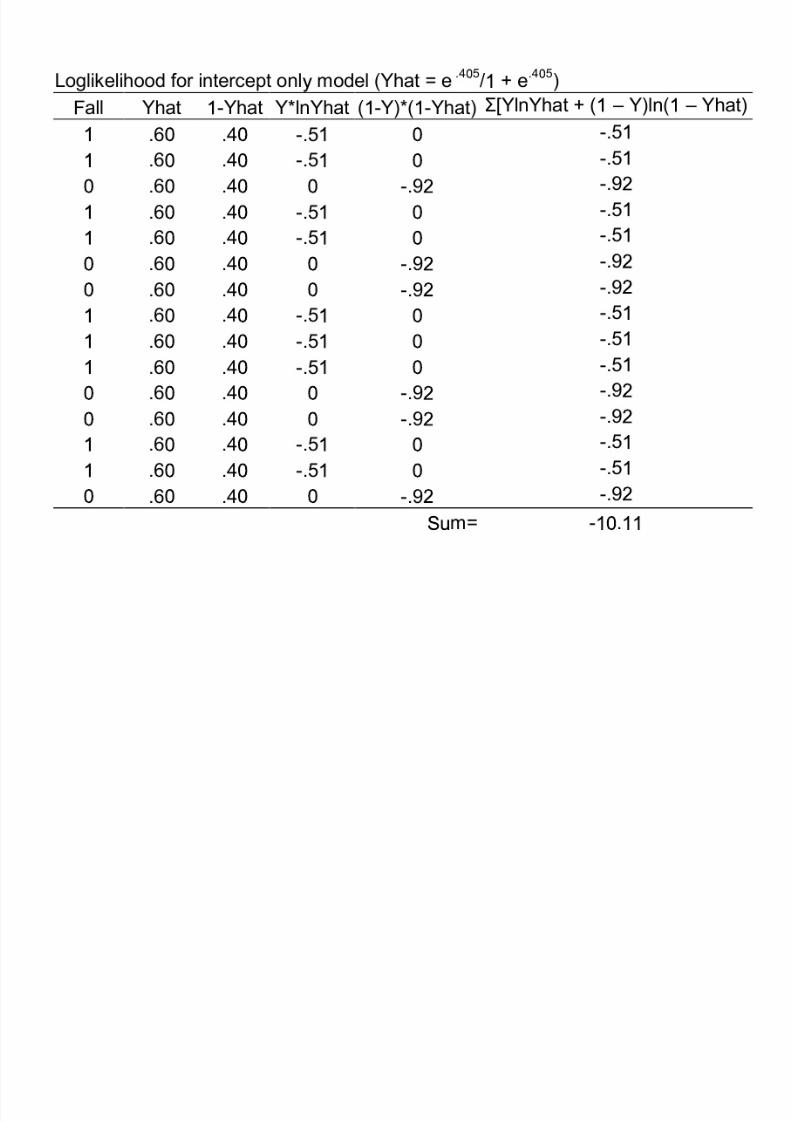
Log-likelihood
1
log [ ln( ) (1 ) ln(1 )]N
i i i i
i
likelihood Y Y Y Y !
! §) )
8/7/2019 Psy524 Lecture 19 Logistic_cont
http://slidepdf.com/reader/full/psy524-lecture-19-logisticcont 12/29
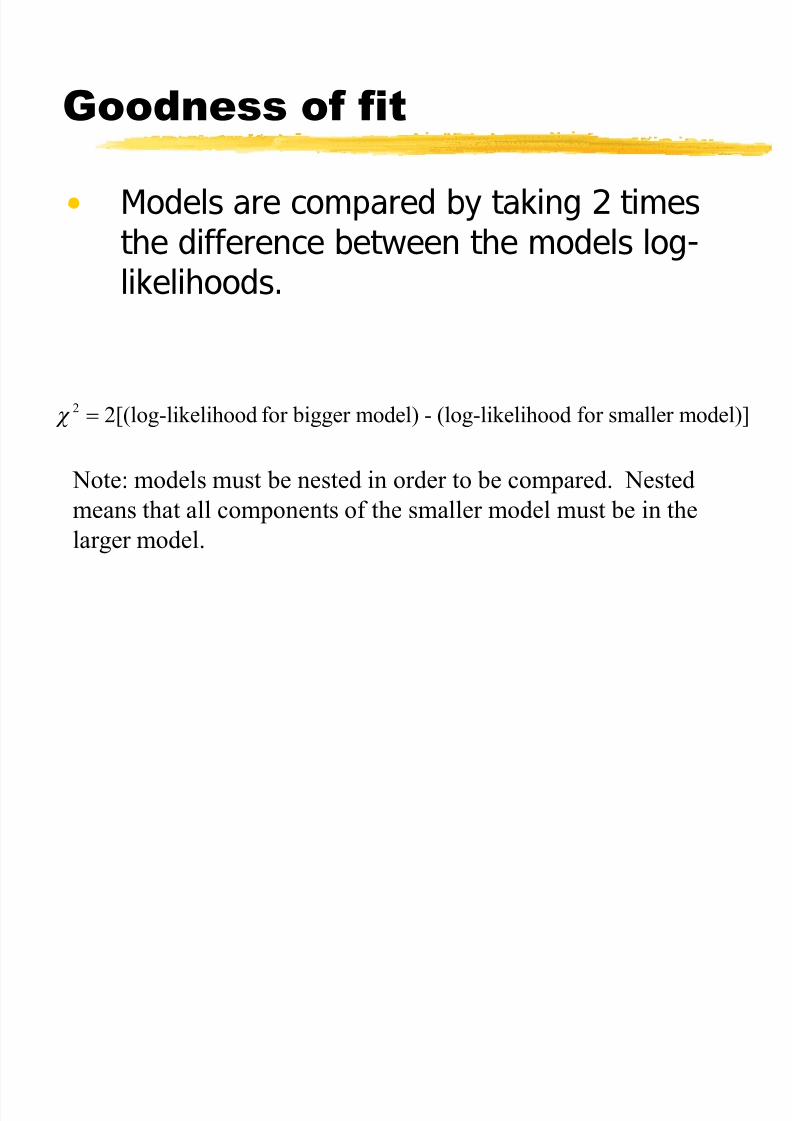
G oodness of fit
Models are compared by taking 2 timesthe difference between the models log-likelihoods.
2
2[(log-likelihood f or bigger model) - (log-likelihood f or sma ller model)]G !
Note: model s mus t be nested in order to be compa red. Nested means that all component s of the sma ller model mus t be in the larger model.
8/7/2019 Psy524 Lecture 19 Logistic_cont
http://slidepdf.com/reader/full/psy524-lecture-19-logisticcont 13/29
G oodness of fit
Often a model with intercept andpredictors is compared to an intercept only model to test whether thepredictors add over and above theintercept only. This is usually noted as
2=2[LL(B)-LL(0)]
8/7/2019 Psy524 Lecture 19 Logistic_cont
http://slidepdf.com/reader/full/psy524-lecture-19-logisticcont 14/29
8/7/2019 Psy524 Lecture 19 Logistic_cont
http://slidepdf.com/reader/full/psy524-lecture-19-logisticcont 15/29
8/7/2019 Psy524 Lecture 19 Logistic_cont
http://slidepdf.com/reader/full/psy524-lecture-19-logisticcont 16/29
G oodness of Fit
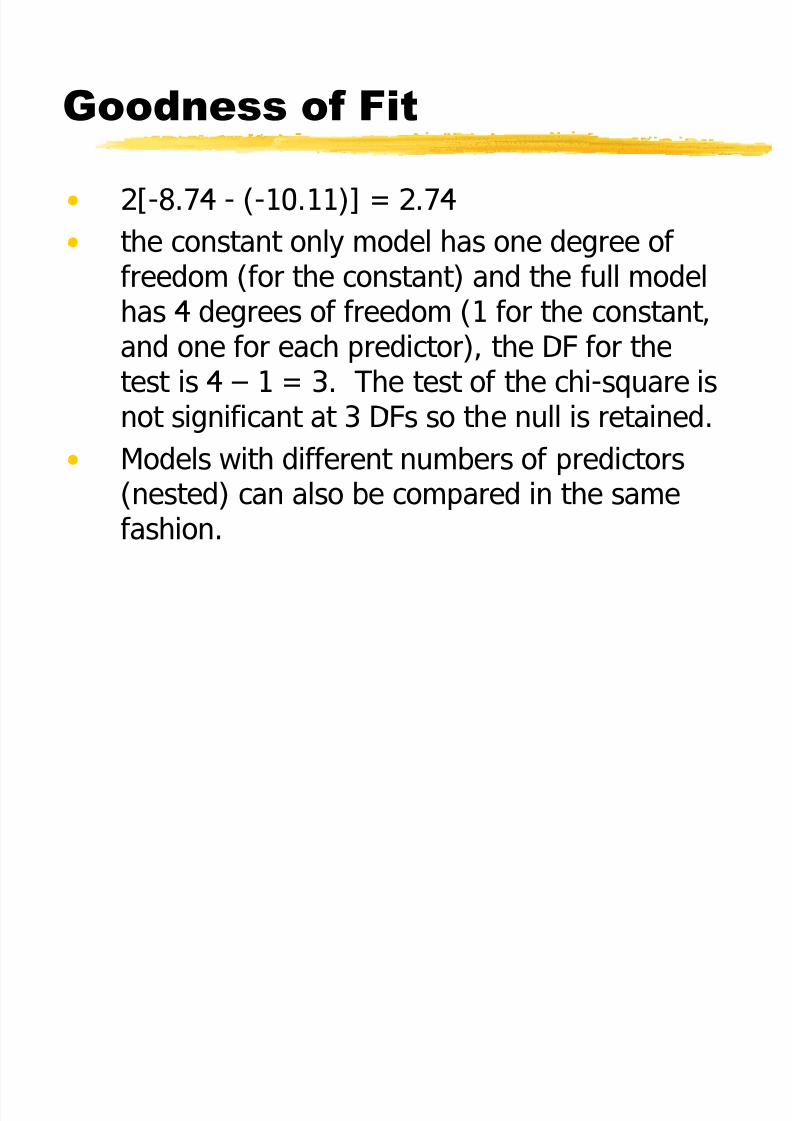
2[-8.74 - (-10.11)] = 2.74the constant only model has one degree of
freedom (for the constant) and the full modelhas 4 degrees of freedom (1 for the constant,and one for each predictor), the DF for thetest is 4 1 = 3. The test of the chi-square is
not significant at 3 DFs so the null is retained.Models with different numbers of predictors(nested) can also be compared in the samefashion.
8/7/2019 Psy524 Lecture 19 Logistic_cont
http://slidepdf.com/reader/full/psy524-lecture-19-logisticcont 17/29
S tandardized Residuals
Given a model you can calculate thestandardized residual of each persons
predicted probability (using the rather scarymatrix formula on page 527)You can have SPSS save the standardizedresiduals and once this is done you can
analyze them to see if any are above 3.3 andif they are the subject is an outlier accordingto the given model.
8/7/2019 Psy524 Lecture 19 Logistic_cont
http://slidepdf.com/reader/full/psy524-lecture-19-logisticcont 18/29
T ypes of Logistic Regression
Direct or SimultaneousSequential or User defined
Stepwise or StatisticalProbit vs. Logistic
Logistic assumes a categorical (qualitative)underlying distributionProbit assumes a normal distribution and uses Z-scores to estimate the proportion under the curve.Near .5 the analyses are similar they only differ at the extremes.
8/7/2019 Psy524 Lecture 19 Logistic_cont
http://slidepdf.com/reader/full/psy524-lecture-19-logisticcont 19/29
I nferential T ests
Assessing goodness of fit for the modelThere are many goodness of fit indices, soyou need to keep in mind what is beingcompared to know whether a significant difference is good or not. Some testssignificance means fit and otherssignificance means lack of fit.
8/7/2019 Psy524 Lecture 19 Logistic_cont
http://slidepdf.com/reader/full/psy524-lecture-19-logisticcont 20/29
I nferential T ests
Also consider sample sized when evaluatinggoodness of fit. Chi-square statistics are
heavily influenced by sample size so that with a very large sample even minutedifferences will be significant.
If the sample size is large and the chi-square is
significant this may not be important Though if there is significance and the sample isrelatively small than the effect is notable.
8/7/2019 Psy524 Lecture 19 Logistic_cont
http://slidepdf.com/reader/full/psy524-lecture-19-logisticcont 21/29
I nferential T ests
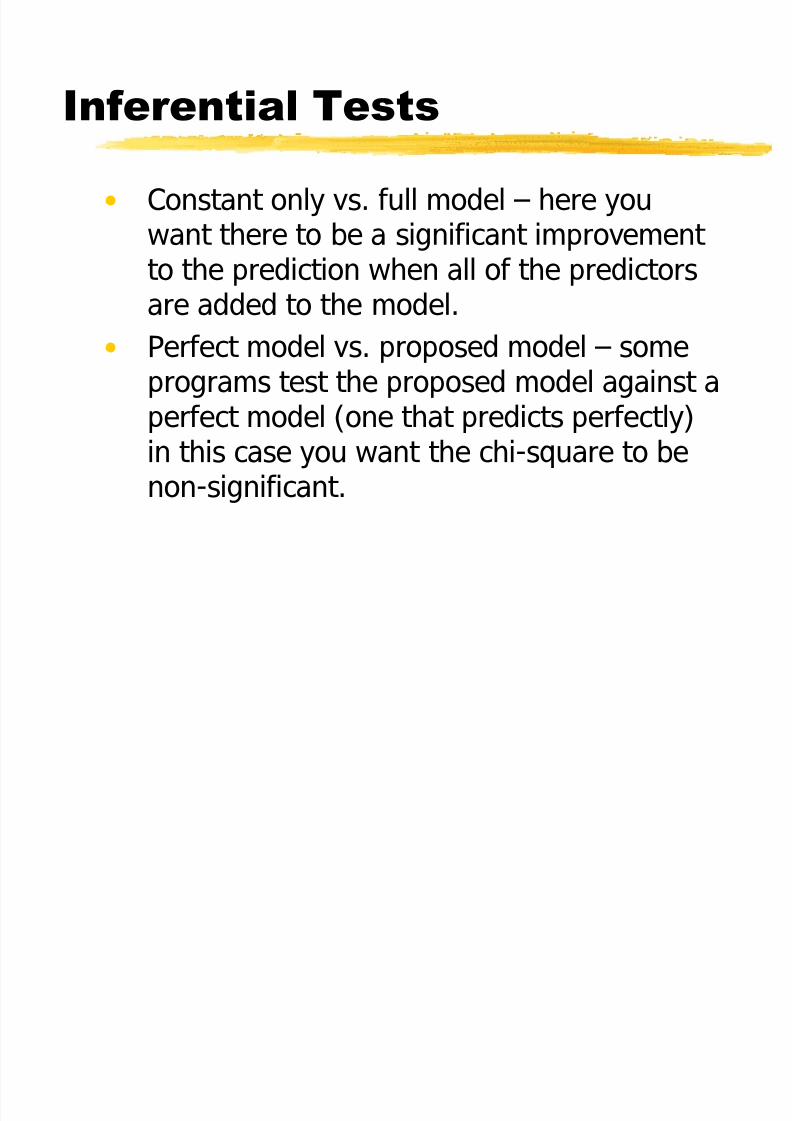
Constant only vs. full model here youwant there to be a significant improvement
to the prediction when all of the predictorsare added to the model.Perfect model vs. proposed model someprograms test the proposed model against a
perfect model (one that predicts perfectly)in this case you want the chi-square to benon-significant.
8/7/2019 Psy524 Lecture 19 Logistic_cont
http://slidepdf.com/reader/full/psy524-lecture-19-logisticcont 22/29
I nferential T ests
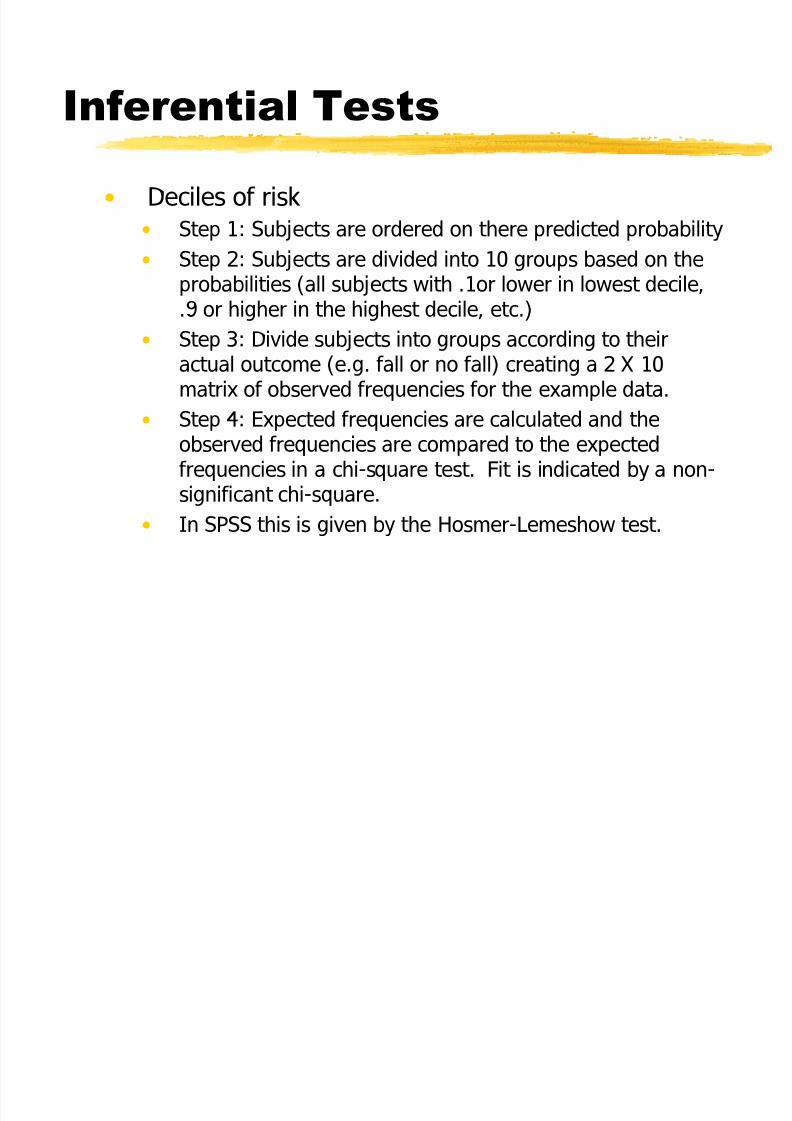
Deciles of riskStep 1: Subjects are ordered on there predicted probabilityStep 2: Subjects are divided into 10 groups based on theprobabilities (all subjects with .1or lower in lowest decile,.9 or higher in the highest decile, etc.)Step 3: Divide subjects into groups according to theiractual outcome (e.g. fall or no fall) creating a 2 X 10matrix of observed frequencies for the example data.
Step 4: Expected frequencies are calculated and theobserved frequencies are compared to the expectedfrequencies in a chi-square test. Fit is indicated by a non-significant chi-square.In SPSS this is given by the Hosmer-Lemeshow test.
8/7/2019 Psy524 Lecture 19 Logistic_cont
http://slidepdf.com/reader/full/psy524-lecture-19-logisticcont 23/29
T est of individual predictors
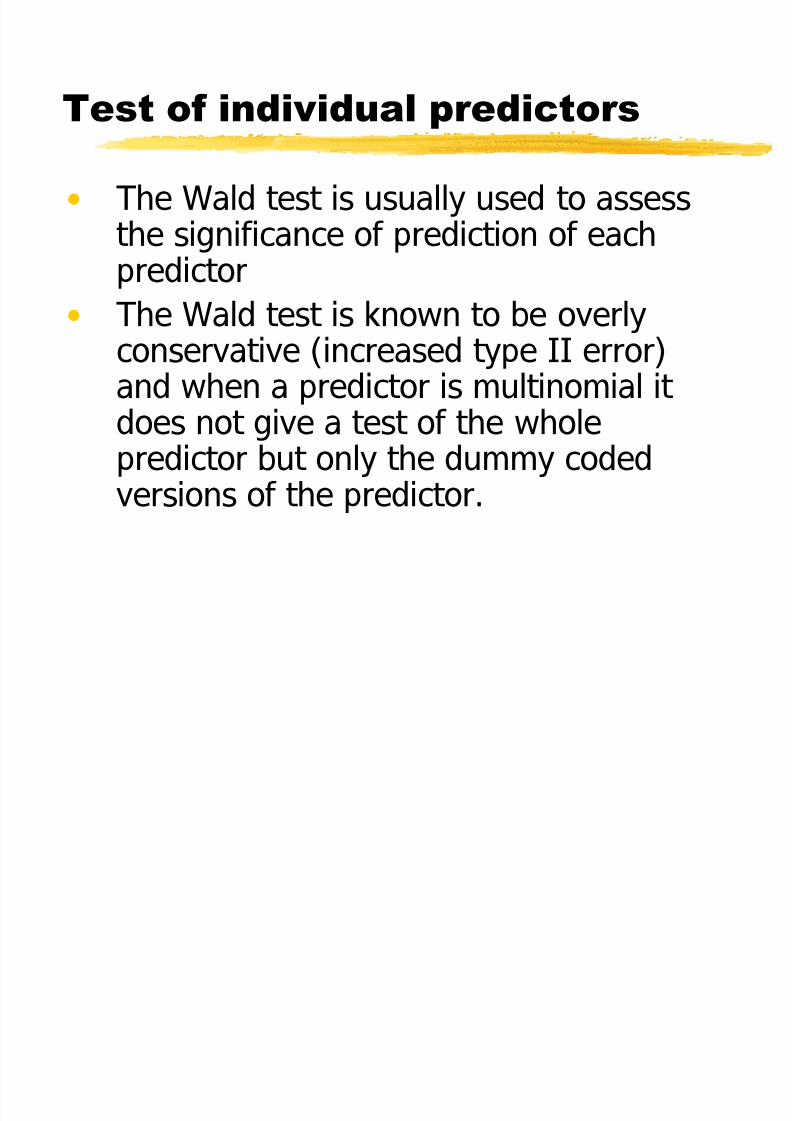
The Wald test is usually used to assessthe significance of prediction of each
predictorThe Wald test is known to be overlyconservative (increased type II error)and when a predictor is multinomial it does not give a test of the wholepredictor but only the dummy codedversions of the predictor.
8/7/2019 Psy524 Lecture 19 Logistic_cont
http://slidepdf.com/reader/full/psy524-lecture-19-logisticcont 24/29
N umber and type of outcomes
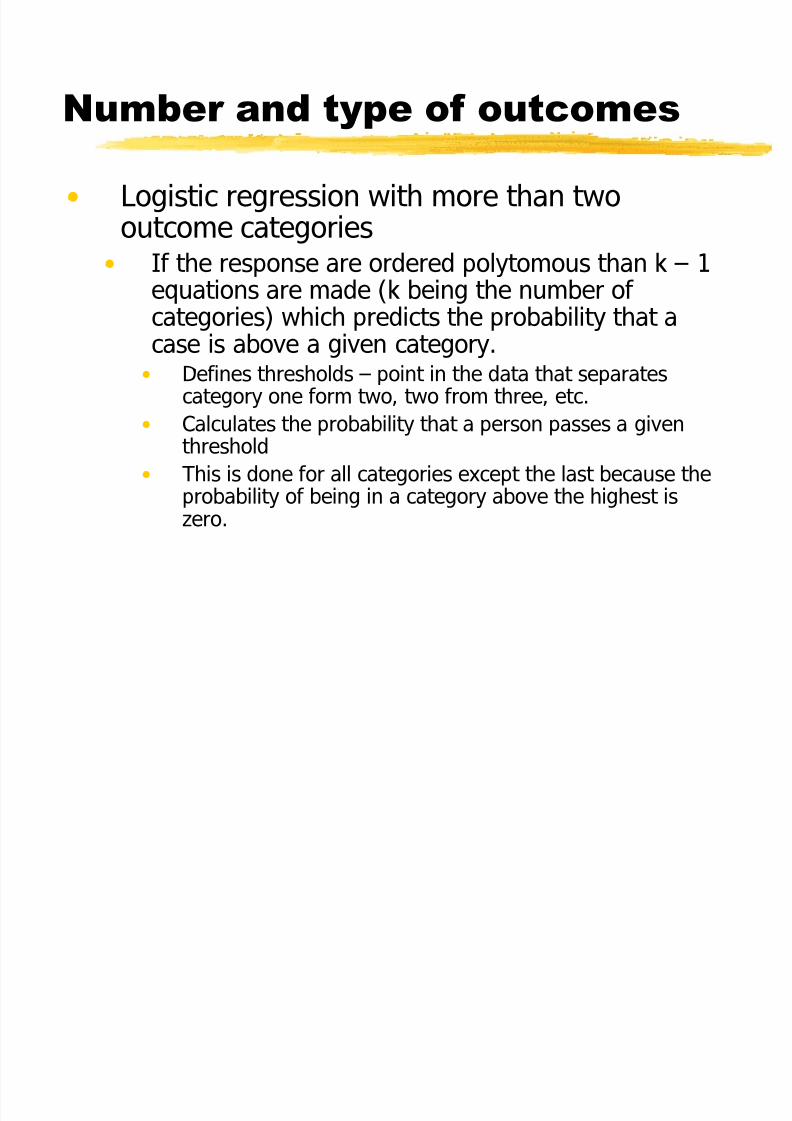
Logistic regression with more than twooutcome categories
If the response are ordered polytomous than k 1equations are made (k being the number of categories) which predicts the probability that acase is above a given category.
Defines thresholds point in the data that separatescategory one form two, two from three, etc.Calculates the probability that a person passes a giventhresholdThis is done for all categories except the last because theprobability of being in a category above the highest iszero.
8/7/2019 Psy524 Lecture 19 Logistic_cont
http://slidepdf.com/reader/full/psy524-lecture-19-logisticcont 25/29
N umber and type of outcomes
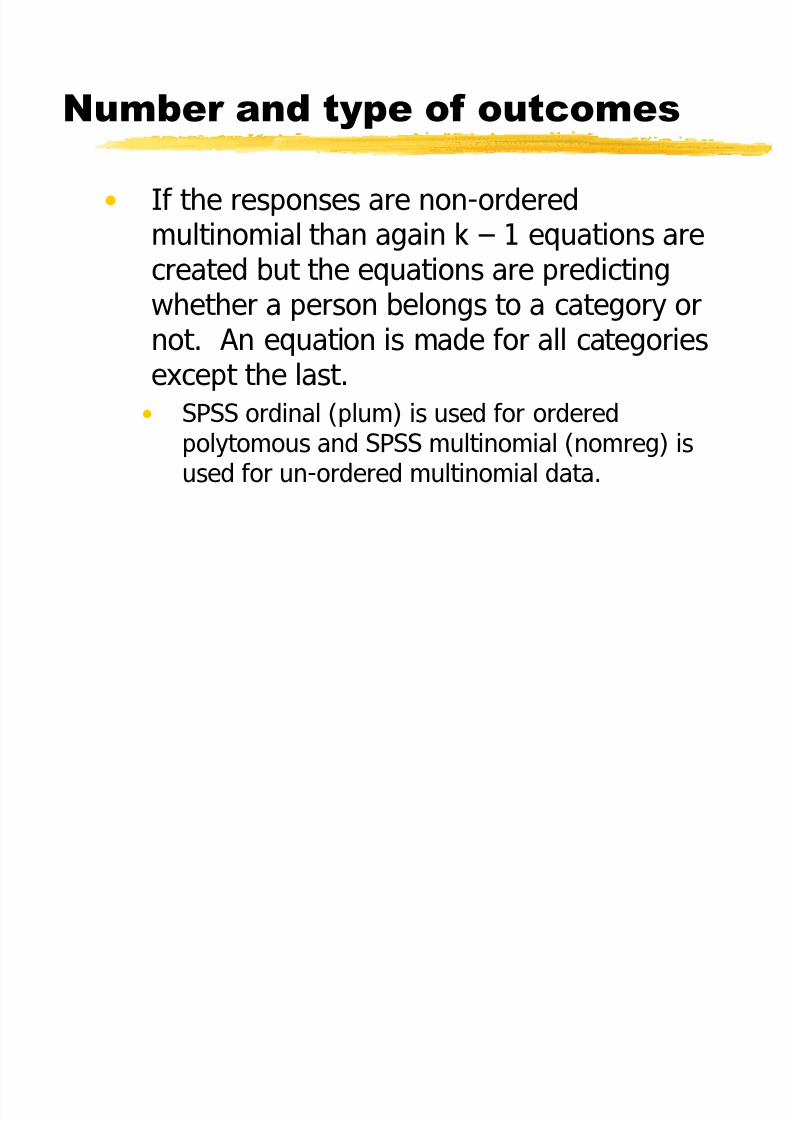
If the responses are non-orderedmultinomial than again k 1 equations are
created but the equations are predictingwhether a person belongs to a category ornot. An equation is made for all categoriesexcept the last.
SPSS ordinal (plum) is used for orderedpolytomous and SPSS multinomial (nomreg) isused for un-ordered multinomial data.
8/7/2019 Psy524 Lecture 19 Logistic_cont
http://slidepdf.com/reader/full/psy524-lecture-19-logisticcont 26/29
S trength of association(pseudo R-s q uare)
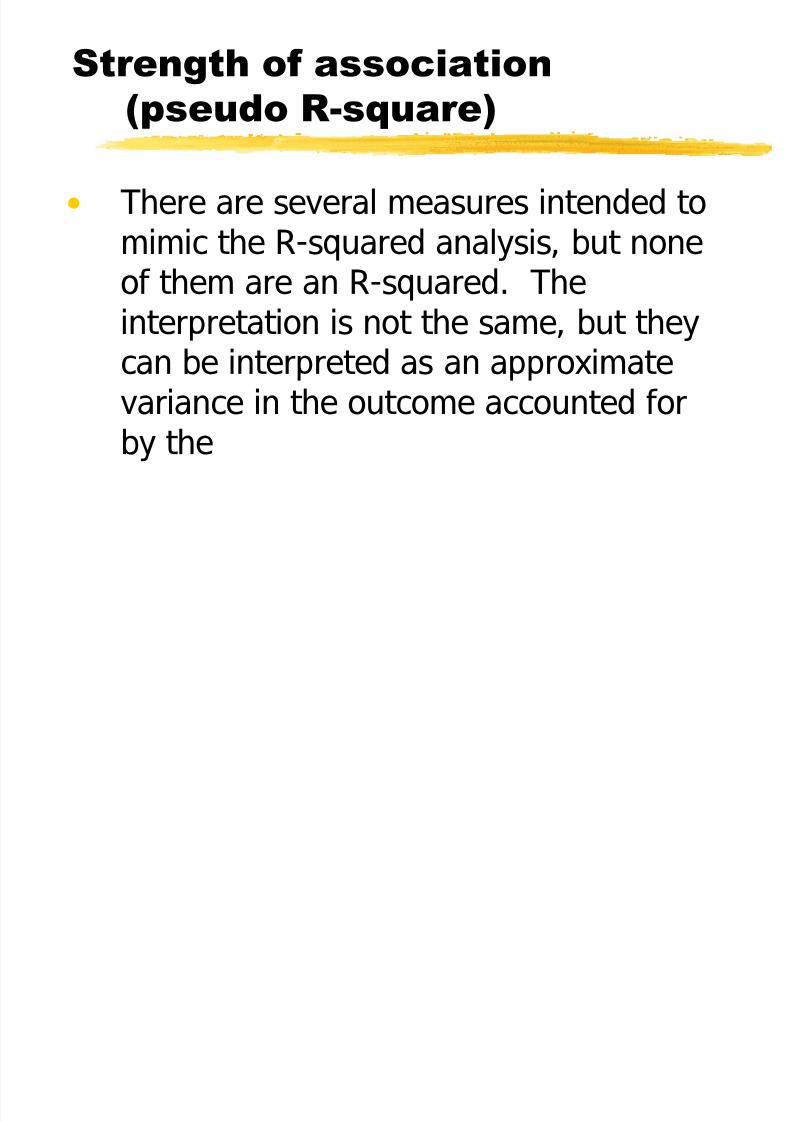
There are several measures intended tomimic the R-squared analysis, but noneof them are an R-squared. Theinterpretation is not the same, but theycan be interpreted as an approximate
variance in the outcome accounted forby the
8/7/2019 Psy524 Lecture 19 Logistic_cont
http://slidepdf.com/reader/full/psy524-lecture-19-logisticcont 27/29
S trength of association(pseudo R-s q uare)
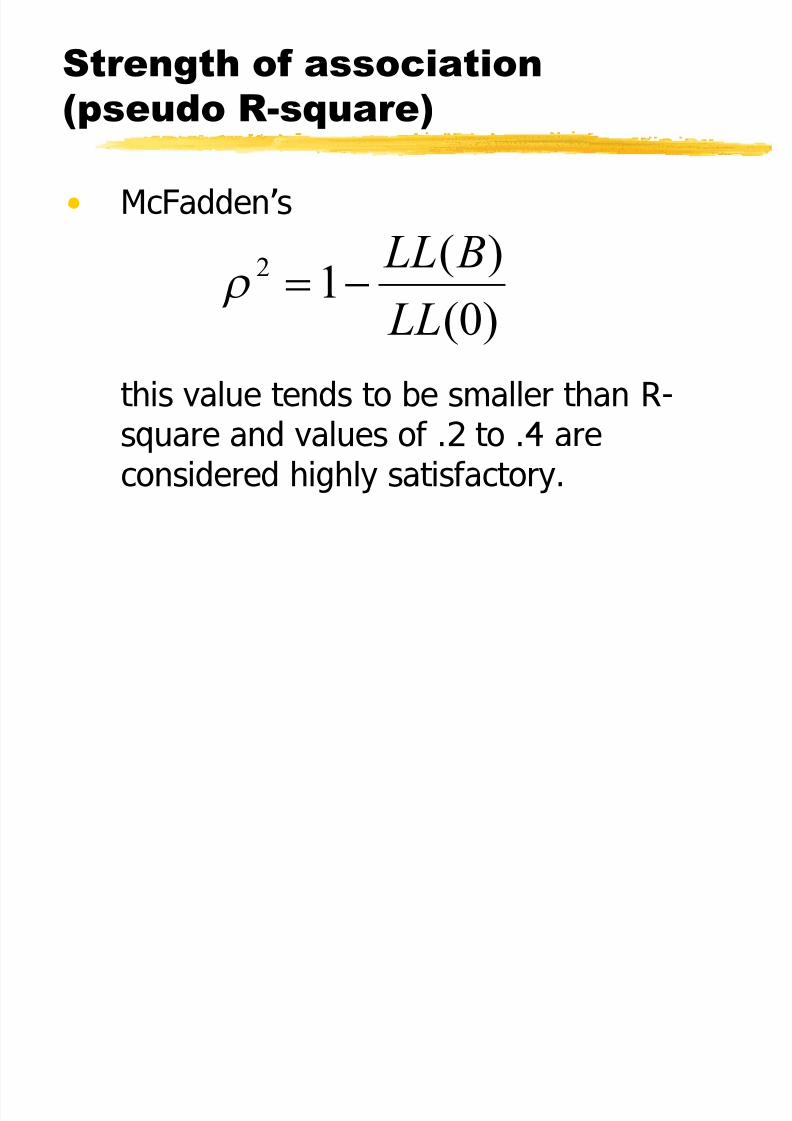
McFadden s
this value tends to be smaller than R-square and values of .2 to .4 areconsidered highly satisfactory.
2( )
1 (0)LL B
LLV !
8/7/2019 Psy524 Lecture 19 Logistic_cont
http://slidepdf.com/reader/full/psy524-lecture-19-logisticcont 28/29
S trength of association(pseudo R-s q uare)
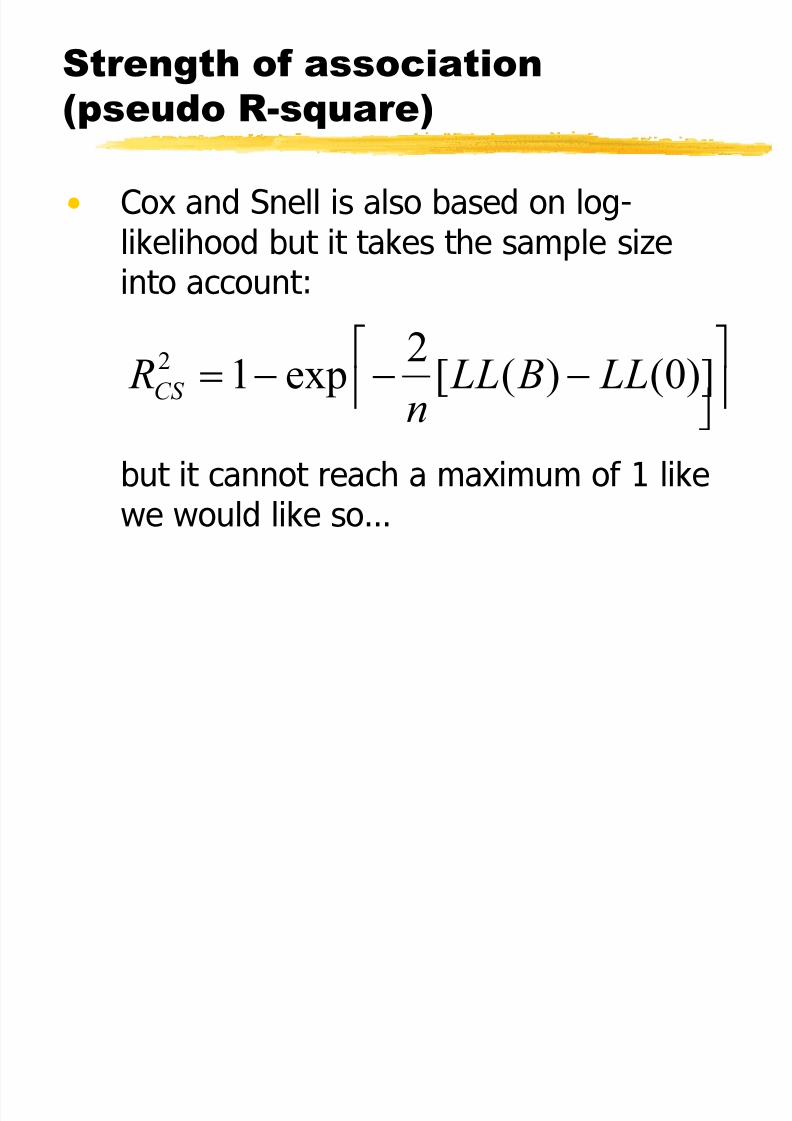
Cox and Snell is also based on log-likelihood but it takes the sample sizeinto account:
but it cannot reach a maximum of 1 likewe would like so
2 21 exp [ ( ) (0)]C S
R LL B LLn
« »! ¬ ¼½
8/7/2019 Psy524 Lecture 19 Logistic_cont
http://slidepdf.com/reader/full/psy524-lecture-19-logisticcont 29/29
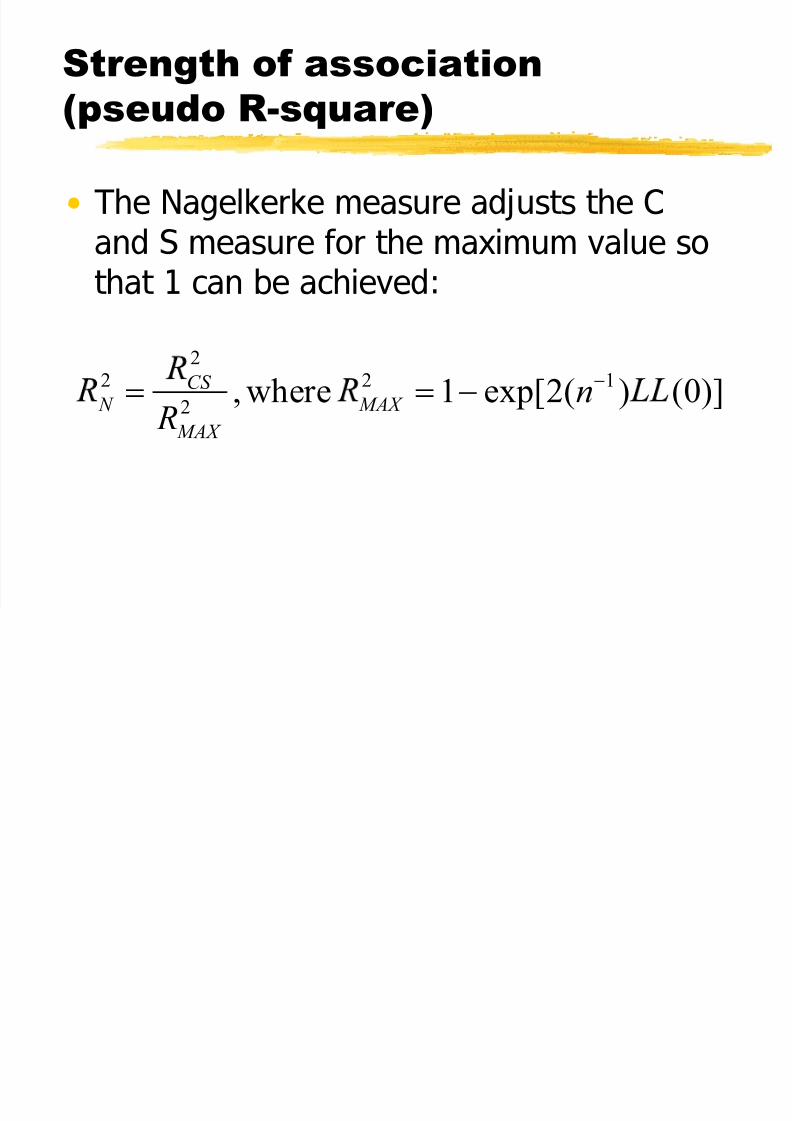
S trength of association(pseudo R-s q uare)
The Nagelkerke measure adjusts the Cand S measure for the maximum value sothat 1 can be achieved:
22 2 1
2 , where 1 exp[2( ) (0)]C S
N M AX
M AX
nR
! !