ectrocoroziunea
TRANSCRIPT
7/26/2019 ectrocoroziunea
http://slidepdf.com/reader/full/ectrocoroziunea 1/30
NASA/CR—2016–218220
Prepared for Marshall Space Flight Center
under Contract NNM12AA41C
Electrochemical, Polarization, and Crevice
Corrosion Testing of Nitinol 60,
A Supplement to the ECLSS Sustaining
Materials Compatibility Study
R.E. Lee
Jacobs ESSSA Group, Huntsville, Alabama
March 2016
7/26/2019 ectrocoroziunea
http://slidepdf.com/reader/full/ectrocoroziunea 2/30
The NASA STI Program…in Profle
Since its founding, NASA has been dedicated to the
advancement of aeronautics and space science. The
NASA Scientic and Technical Information (STI)
Program Ofce plays a key part in helping NASA
maintain this important role.
The NASA STI Program Ofce is operated by
Langley Research Center, the lead center for
NASA’s scientic and technical information. The
NASA STI Program Ofce provides access to
the NASA STI Database, the largest collection of
aeronautical and space science STI in the world.The Program Ofce is also NASA’s institutional
mechanism for disseminating the results of its
research and development activities. These results
are published by NASA in the NASA STI Report
Series, which includes the following report types:
• TECHNICAL PUBLICATION. Reports of
completed research or a major signicant
phase of research that present the results of
NASA programs and include extensive data
or theoretical analysis. Includes compilations
of signicant scientic and technical data
and information deemed to be of continuing
reference value. NASA’s counterpart of peer-
reviewed formal professional papers but has less
stringent limitations on manuscript length and
extent of graphic presentations.
• TECHNICAL MEMORANDUM. Scientic
and technical ndings that are preliminary or of
specialized interest, e.g., quick release reports,
working papers, and bibliographies that contain
minimal annotation. Does not contain extensiveanalysis.
• CONTRACTOR REPORT. Scientic and
technical ndings by NASA-sponsored
contractors and grantees.
• CONFERENCE PUBLICATION. Collected
papers from scientic and technical conferences,
symposia, seminars, or other meetings sponsored
or cosponsored by NASA.
• SPECIAL PUBLICATION. Scientic, technical,
or historical information from NASA programs,
projects, and mission, often concerned with
subjects having substantial public interest.
• TECHNICAL TRANSLATION.
English-language translations of foreignscientic and technical material pertinent to
NASA’s mission.
Specialized services that complement the STI
Program Ofce’s diverse offerings include creating
custom thesauri, building customized databases,
organizing and publishing research results…even
providing videos.
For more information about the NASA STI Program
Ofce, see the following:
• Access the NASA STI program home page at
<http://www.sti.nasa.gov>
• E-mail your question via the Internet to
• Phone the NASA STI Help Desk at
757 –864–9658
• Write to:
NASA STI Information Desk Mail Stop 148
NASA Langley Research Center
Hampton, VA 23681–2199, USA
7/26/2019 ectrocoroziunea
http://slidepdf.com/reader/full/ectrocoroziunea 3/30
i
NASA/CR—2016–218220
Electrochemical, Polarization, and Crevice
Corrosion Testing of Nitinol 60,
A Supplement to the ECLSS Sustaining
Materials Compatibility Study
R.E. Lee
Jacobs ESSSA Group, Huntsville, Alabama
March 2016
National Aeronautics and
Space Administration
Marshall Space Flight Center • Huntsville, Alabama 35812
Prepared for Marshall Space Flight Center
under Contract NNM12AA41C
and sponsored by
Jacobs ESSSA Group
managed at Marshall Space Flight Center
7/26/2019 ectrocoroziunea
http://slidepdf.com/reader/full/ectrocoroziunea 4/30
ii
Available from:
NASA STI Information Desk
Mail Stop 148
NASA Langley Research Center
Hampton, VA 23681–2199, USA
757–864–9658
This report is also available in electronic form at
<http://www.sti.nasa.gov>
TRADEMARKS
Trade names and trademarks are used in this report for identification only. This usage does not constitute an official
endorsement, either expressed or implied, by the National Aeronautics and Space Administration.
7/26/2019 ectrocoroziunea
http://slidepdf.com/reader/full/ectrocoroziunea 5/30
iii
EXECUTIVE SUMMARY
In a previous study, electrochemical test results are presented for six noble metals which wereevaluated in test solutions representative of waste liquids processed in the Environmental Control
and Life Support System (ECLSS) aboard the International Space Station (ISS). Subsequently,
a seventh metal, Nitinol 60, was added for evaluation and subjected to the same test routines, data
analysis, and theoretical methodologies as those utilized during the previous study. With the earlier
project, the six test metals evaluated included three titanium grades, (commercially pure, 6Al-4V
alloy and 6Al-4V low interstitial alloy), two nickel-chromium alloys (Inconel® 625 and Hastelloy®
C276), and one high-tier stainless steel (Cronidur® 30). The titanium alloys gave the best results of
all the metals, indicating superior corrosive nobility and galvanic protection properties for the three
titanium metals.
For this current effort, the results have clearly shown that Nitinol 60 is also quite noble as it is
very corrosion resistant and galvanically compatible with the other six metals from both an electro-
chemical perspective and long-term crevice corrosion scenario. This was clearly demonstrated utiliz-
ing the same techniques for linear, Tafel and cyclic polarization, and galvanic coupling of the metal
candidate as was done for the previous study. The high nobility and low corrosion susceptibility for
Nitinol 60 appear to be intermediate to the nickel/chromium alloys and the titanium metals with
indications that are more reflective of the titanium metals in terms of general corrosion and pitting
behavior.

7/26/2019 ectrocoroziunea
http://slidepdf.com/reader/full/ectrocoroziunea 6/30
iv
7/26/2019 ectrocoroziunea
http://slidepdf.com/reader/full/ectrocoroziunea 7/30
v
TABLE OF CONTENTS
1. INTRODUCTION ............................................................................................................. 1
1.1 Background .................................................................................................................. 1
1.2 Polarization Concepts ................................................................................................... 2
2. EXPERIMENTAL ............................................................................................................. 2
2.1 Test Sample Preparation ............................................................................................... 2
2.2 Procedures and Techniques ........................................................................................... 3
3. RESULTS OF CORROSION TESTING ........................................................................... 7
3.1 Crevice Corrosion Assessment ...................................................................................... 7
3.2 Electrochemical Assessment ......................................................................................... 10
3.3 Galvanic Coupling Assessment ..................................................................................... 14
3.4 Summary of Electrochemical Testing ........................................................................... 15
REFERENCES ....................................................................................................................... 17
7/26/2019 ectrocoroziunea
http://slidepdf.com/reader/full/ectrocoroziunea 8/30
vi
LIST OF FIGURES
1. Images of the (a) PAR 2273 potentiostat test system, (b) Gamry 300 potentiostattest unit and (c) flattest cell which can be attached to either system ............................ 4
2. Typical workstation and test cell configuration showing two stacked
PAR workstations with two test cellsin operation (center) .......................................... 5
3. Incremental flow sequence for polarization testing ..................................................... 7
4. Images with descriptions of crevice sample surfaces after six months
in the test solutions .................................................................................................... 8
5. Images with descriptions of crevice sample surfaces after one year storage ................ 8
6. Illustration of a chromium-rich alloy seconds after immersion
in an acidic electrolyte ................................................................................................ 9
7. Data plot of Nitinol 60 cyclic polarization test run (blue trace) with descriptions ...... 13
7/26/2019 ectrocoroziunea
http://slidepdf.com/reader/full/ectrocoroziunea 9/30
vii
LIST OF TABLES
1. Reduced Data Summary for Open Circuit Potential Testing ...................................... 10
2. Reduced Data Summary for Linear and Tafel Polarization ........................................ 11
3. Reduced Data Summary for Cyclic Polarization Testing ............................................ 12
4. Reduced Data Summary for Galvanic Coupling Evaluation ...................................... 14

7/26/2019 ectrocoroziunea
http://slidepdf.com/reader/full/ectrocoroziunea 10/30
7/26/2019 ectrocoroziunea
http://slidepdf.com/reader/full/ectrocoroziunea 11/30
CONTRACTOR REPORT
ELECTROCHEMICAL, POLARIZATION, AND CREVICE
CORROSION TESTING OF NITINOL 60,
A SUPPLEMENT TO THE ECLSS SUSTAINING
MATERIALS COMPATIBILITY STUDY
1.0 Introduction
1.1 Background
The particular analytical methodologies and theoretical approaches employed for this current studyare identical to those developed during the initial metals compatibility study evaluating Commercially
Pure Titanium, Titanium 6Al-4V alloy, Titanium 6Al-4V Low Interstitial alloy, Inconel® 625, Hastelloy®C276 Cronidur® 30. These concepts and techniques were covered comprehensively in the final reports
for that study. Thus, the reader is referred to two principal resources for background regarding thetechniques utilized for the Nitinol 60 project.
(1) “ECLSS Sustaining Metal Materials Compatibility Final Report, Electrochemical and Crevice
Corrosion Test Results”, R.E. Lee, NASA/CR—2015–218208, April 2015, Contract NNM12AA41C
(2) “ECLSS Sustaining Metal Materials Compatibility Final Briefing, Electrochemical and
Crevice Corrosion Test Results”, October 6, 2014, Randy Lee
In accordance with the initial study, the purpose for evaluating Nitinol 60 was to evaluate potential
corrosive effects and possible galvanic incapabilities between Nitinol 60, the subject test solutions and theother metals under consideration. While the initial project call for evaluations in the alternate pretreated
urine and its concentrated brine, in addition, the Nitinol study also included the baseline pretreated urineand its associated brine solution, making a total of four test solutions:
(1) the proposed or alternate pretreated waste solution
(2) the alternate brine concentrate derived from solution (1)
(3)
the former or baseline pretreated waste solution
(4) the baseline brine concentrate derived from solution (3)
Since solutions (3) and (4) were not included in the test plan for the original six metals, some of the data points for the galvanic coupling phase involving these six metals were unavailable for this study. The
former baseline pretreat formulation includes chromic acid and sulfuric acid while the proposed formulais based on chromic acid and phosphoric acid. Specifically, the change was from sulfuric to phosphoric
7/26/2019 ectrocoroziunea
http://slidepdf.com/reader/full/ectrocoroziunea 12/30
in response to issues related to precipitation effects in some of the system filters. Composition of the Nitinol 60 evaluated was 59.5% Nickel, 40.4% Titanium and 0.07% other elements. Nitinol alloys arenot present in most published Galvanic Series, but they are expected to rank up near Titanium.
1.2 Polarization Concepts
Whenever the potential (voltage) and electric current (amperage) are measured and evaluatedtogether, the potential is an indication of the nobility with respect to the tendency, probability orsusceptibility for corrosion to occur. The current is directly proportional to the rate of oxidation, a quantity
which can be converted into units indicating how fast the base metal is recessing and how fast the oxidethickness is changing. Base metal recession (etching) and oxide growth (passivation) are mutually
inclusive processes. A high breakdown potential infers high nobility with low susceptibility to corrosion,while a large pitting current indicates a high pitting rate. A low corrosion potential implies a high
susceptibility to corrosion while a high repassivation current demonstrates a robust oxide-restoration process (repassivation) that is characteristic of strong corrosion protection mechanisms.
2.0 Experimental
2.1 Test Sample Preparation
2.1.1 Machining and Finishing of Test Samples
All test samples were machined from bulk metal stock into approximately 3’ X 3” X 1/2” plates.
This size was deemed appropriate for all of the polarization, galvanic and crevice corrosion testing asmandated by the ECLSS project to satisfy the requirements for evaluating the performance and
compatibility of each metal candidate of interest. All the metal samples were degreased, rinsed and dried,and then liberally rinsed with DI water, solvent rinsed and air dried in ambient atmosphere (68-72°F and
30-40% R.H.) to promote natural development of their native surface oxide layers prior to testing.
2.1.2 Crevice Sample Assembly Configuration
Samples for evaluating crevice corrosion effects were assembled in two different configurationsloosely based on ASTM G78 as described below. However, the specific test approach utilized throughout
these studies was developed in-house at Marshall Space Flight Center several years back.
Angled Crevice Sample Configuration Sandwich-type assemblies consisted of two sample plates clamped together and separated by a small
rectangular-shaped, single layer of filter paper near one side of the clamped assembly to create a tiny
angled crevice gap between the two plates.
Parallel Crevice Sample Configuration Sandwich-type assemblies consisted of two sample plates clamped together and separated by a larger
square-shaped, single layer of filter paper centered in the assembly to create a tiny parallel crevice gaparound the edges between the two plates.
2
7/26/2019 ectrocoroziunea
http://slidepdf.com/reader/full/ectrocoroziunea 13/30
2.2 Procedures and Techniques
2.2.1 Crevice Corrosion Evaluations
Test assemblies of Nitinol 60 were placed in storage in both the pretreat and brine solutions in two
separate groups, one group to be evaluated after 6 months storage in each solution and another group to be evaluated after 12 months storage. Test articles consisted of two plates clamped together as ‘sandwich’-
type assemblies with a single piece of filter in between the plates. After removal from the test solutionsand thorough rinsing, each sample was subjected to visual and microscopic evaluation to check for signs
of corrosion, surface growth, pitting, base metal degradation and/or any anomaly of relevance.
Wedge/sandwich assemblies of Nitinol 60 plates were segregated into separate storage bins, each
bin containing one of the four tests solutions. Samples were monitored periodically. After six months,half of the samples were removed, carefully cleaned and evaluated. After 12 months, the remaining
samples were then removed, carefully cleaned and evaluated. Since the number of plates received for the project was short by two, one of the 6-month assemblies had to be omitted. This sample was chosen to
be from the baseline brine test group. However, all 12 month samples were available and evaluated sothe loss in information due to the missing sample is considered to be trivial for this study.
2.2.2 Polarization Workstations and Equipment
Electrochemical measurements were carried out utilizing computer-controlled potentiostatworkstations supplied by Princeton Applied Research (PAR) and Gamry Instruments. Specifically, four
PAR models 2273 and 273A systems along with two Gamry model 3000s were utilized throughout thestudy. Both of these systems included their own proprietary software for data collection and analysis.
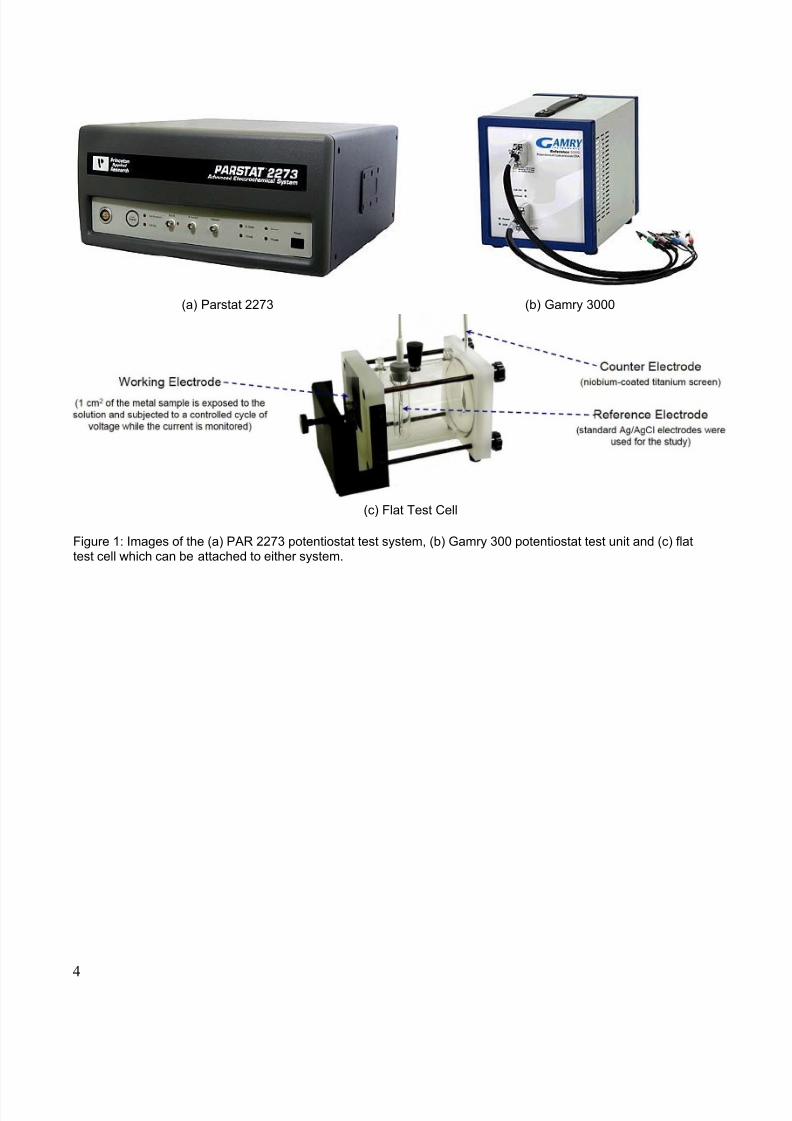
Test solutions and metal samples were accommodated using Flat Test Cells throughout the project whichincluded 1 cm2 exposure holes on one end for polarization routines and 1 cm2 exposure holes on both ends
for galvanic coupling. Ag/AgCl reference electrodes were used throughout. The equipment, experimentalconfigurations and workstations are depicted in Figures 1 and 2.
3
7/26/2019 ectrocoroziunea
http://slidepdf.com/reader/full/ectrocoroziunea 14/30
(a) Parstat 2273 (b) Gamry 3000
(c) Flat Test Cell
Figure 1: Images of the (a) PAR 2273 potentiostat test system, (b) Gamry 300 potentiostat test unit and (c) flattest cell which can be attached to either system.
4
7/26/2019 ectrocoroziunea
http://slidepdf.com/reader/full/ectrocoroziunea 15/30
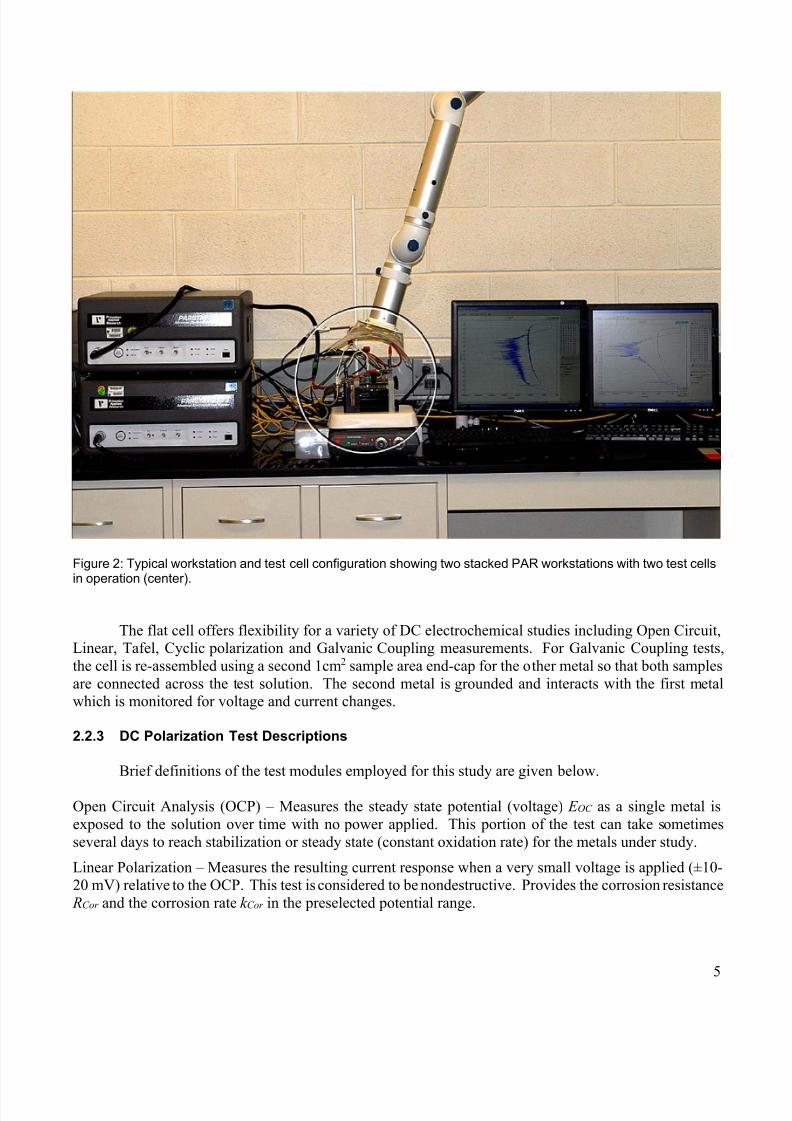
Figure 2: Typical workstation and test cell configuration showing two stacked PAR workstations with two test cellsin operation (center).
The flat cell offers flexibility for a variety of DC electrochemical studies including Open Circuit,Linear, Tafel, Cyclic polarization and Galvanic Coupling measurements. For Galvanic Coupling tests,
the cell is re-assembled using a second 1cm2 sample area end-cap for the other metal so that both samples
are connected across the test solution. The second metal is grounded and interacts with the first metalwhich is monitored for voltage and current changes.
2.2.3 DC Polarization Test Descriptions
Brief definitions of the test modules employed for this study are given below.
Open Circuit Analysis (OCP) – Measures the steady state potential (voltage) E OC as a single metal is
exposed to the solution over time with no power applied. This portion of the test can take sometimes
several days to reach stabilization or steady state (constant oxidation rate) for the metals under study.
Linear Polarization – Measures the resulting current response when a very small voltage is applied (±10-20 mV) relative to the OCP. This test is considered to be nondestructive. Provides the corrosion resistance
RCor and the corrosion rate k Cor in the preselected potential range.
5
7/26/2019 ectrocoroziunea
http://slidepdf.com/reader/full/ectrocoroziunea 16/30
Tafel Polarization – Measures current response across a larger potential range (±200-250 mV) relative to
the OCP. Spans the near cathodic and anodic regions close to E OC providing the corrosion potential E Cor ,corrosion current I Cor , the beta Tafel parameters and k Cor . May or may not be slightly destructive.
Cyclic Polarization – Applies a broad potential cycle across the anodic passivation range, beyond the
breakdown potential E Brk after which the scan direction is reversed at a preselected potential E Ver , called
the vertex, where the potential begins to decrease, passing through the repassivation branch and back downto zero. The current is monitored throughout. A hysteresis loop is usually generated. This technique
provides rates for pitting corrosion, passivation and repassivation as well as unique information regarding
tendencies, susceptibilities and capabilities associated with corrosion and passivation behavior.Supplemental general corrosion information may also be obtained from cyclic polarization data.
Note: For clarity, it should be realized that the crystal structures comprising the passive oxides on these metals are
not always damaged catastrophically at E Brk , but rather their electrical insulator properties undergo a rapid
transformation as resistance drops off and conduction increases across the layer allowing external corrosive agentsto interact directly with the metal surface, possibly leading to pit initiation. This is due to the rapid increase in the
mobility of charge carriers near E Brk . As the voltage is further increased, tunneling of the electrons may occur and
then at some point beyond E Brk , the oxide structures may physically fail and start dissolving in the test solution.
Galvanic Coupling – Measures the steady state potential (voltage) E OCG and current I g as two metals
interact (galvanically) across the test solution with no power applied. This test can sometimes take several
days to reach a stabilized steady state for the particular metals under study.
For many researchers, their polarization test strategy includes cathodically conditioning the sample
prior to or at the beginning of the test run by starting the scan at a very low potential relative to the pre-
measured open circuit potential (OCP). Such treatments are intended to chemically reduce, dissolve andremove or strip the air-formed native oxide layer from the metal surface while it is immersed within the
the test solution under cathodically protective conditions. This induces formation of a new passive layer
on the test surface as the potential passes into the anodic portion of the scan well below the original OCP.
The intent is to conduct the test on an uncontaminated, freshly formed passive layer within the specificelectrolytic solution of interest. The newly-formed oxide layer is very similar to the air-formed coating . . .
but it is not necessarily the same.
In contrast, one of the objectives of these studies was to evaluate the metals in their natural states
after immersion into the subject test solutions because this approach better represents the actual field
conditions that exist when components are assembled, incorporated into the full-scale ECLSS system andexposed to pretreated and brine solutions. In any event, the oxide layer will adapt to the new environment
over time. It is also realized that cathodic conditioning is not applied to the components prior to or during
their normal operation environments, so such treatments were not considered to be relevant for this project.Alternatively, our test samples included final rinsing steps in DI water and solvent followed by 24 hours
of ambient air drying under controlled conditions (68°-72°F, 30-40% R.H.) in order to encourage a robustnatural passive layer to form on the surfaces prior to testing. However, a few complementary test sampleswere intentionally subjected to negative cathodic voltages during cyclic testing as part of the overall
evaluation in order to better understand the effects of extreme polarization applications.
6
7/26/2019 ectrocoroziunea
http://slidepdf.com/reader/full/ectrocoroziunea 17/30
2.2.4 Polarization Test Sequence
Metal candidates were subjected to the test sequence depicted in Figure 3 below. Depending on
time allocations and schedule flexibility, a minimum of 4 and up 6 separate test sample areas wereevaluated for each candidate metal in order to obtain respectable averages and test the extremes.
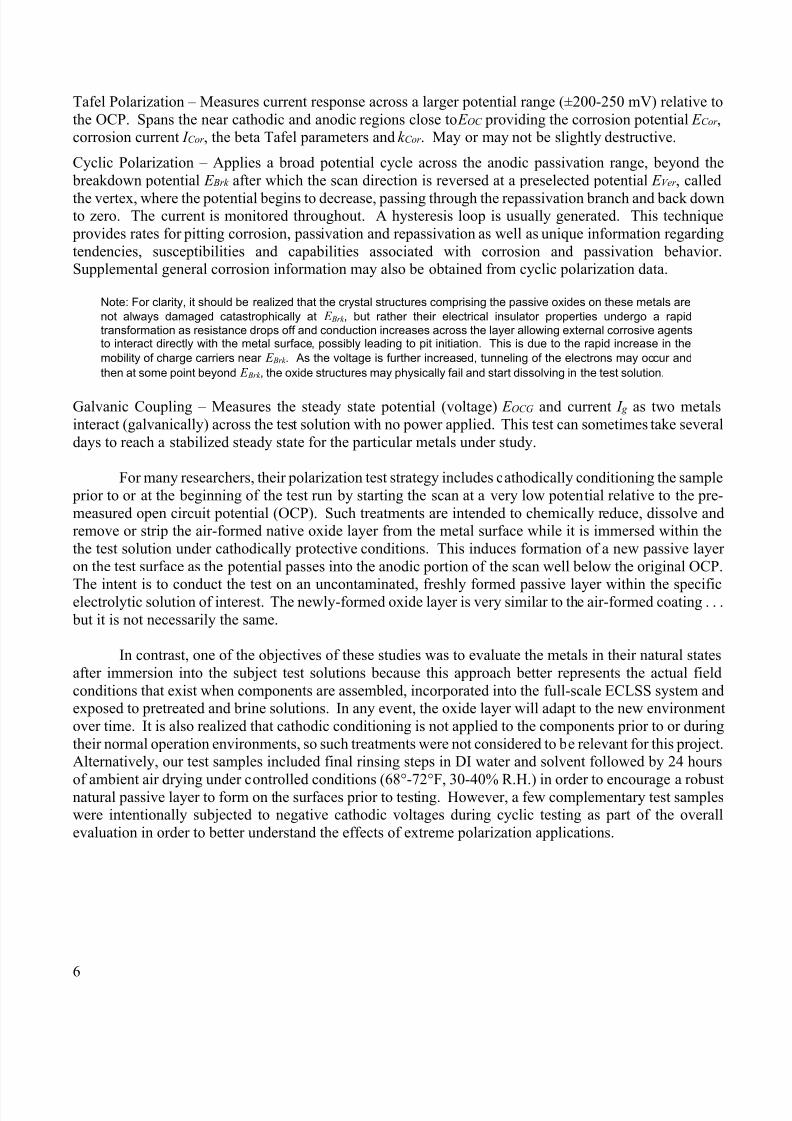
Figure 3: Incremental flow sequence for polarization testing.
2.2.5 Galvanic Coupling
In this phase of the testing, test cells are equipped with two metals, one acting as the ‘working’
electrode and the other as the ‘counter’ electrode. The test assembly is allowed to sit under open circuit
conditions with no power applied while the working sample is monitored by the potentiostat for voltageand current changes as it responds to the presence of the counter sample. Increases in either potential,
current or both indicate that the working metal is anodic (less noble) to the counter metal as the working
metal attempts to protect itself by raising its open circuit potential (OCP) and increasing its rate of passiveoxide generation. For all the metals under study, including Nitinol 60, these changes are very slight, being
in the milli-volt and nano-amp ranges. If the working metal is cathodic to the counter metal, its OCP is
slightly reduced while the rate of passivation decreases. Cathodic behavior indicates that the working
metal is nobler than the counter metal as the working metal’s corrosion protection requirements arerelaxed. This test is nondestructive. Since no power is applied to the cell, no degradation or discoloration
on either of the exposed surfaces takes place, at least for the noble metals under evaluation.
3.0 Results of Corrosion Testing
3.1 Crevice Corrosion Assessment
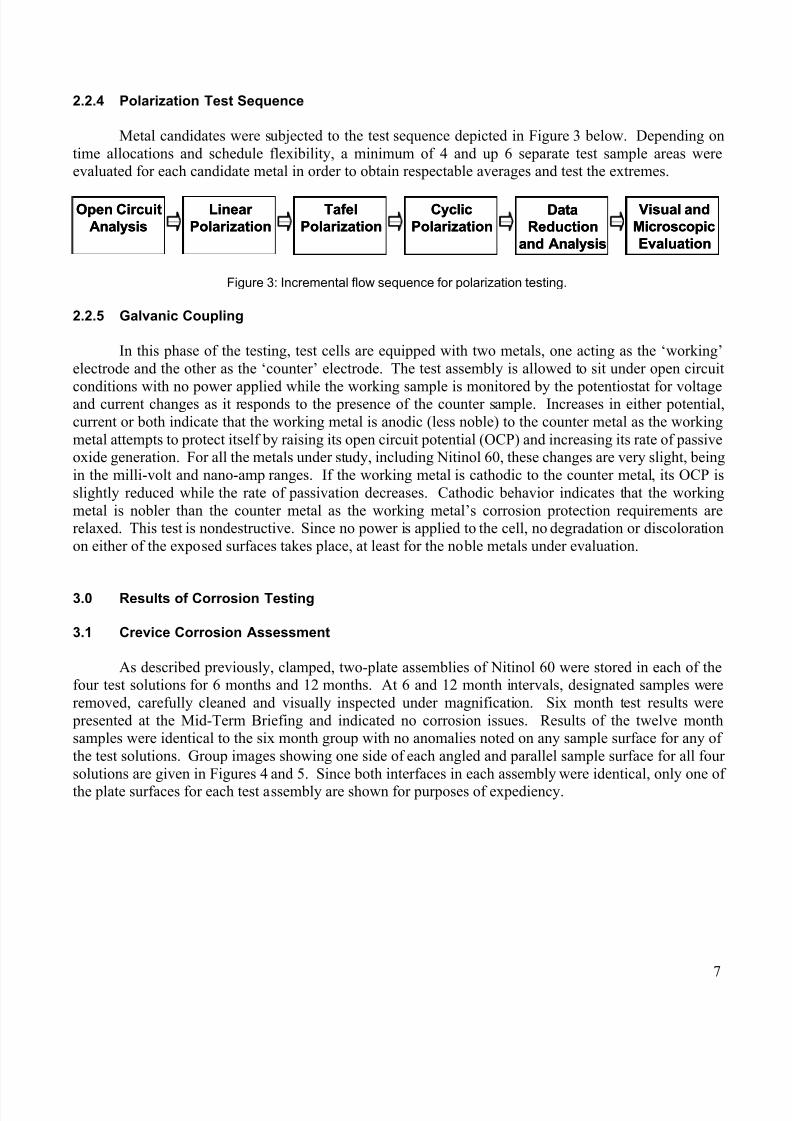
As described previously, clamped, two-plate assemblies of Nitinol 60 were stored in each of thefour test solutions for 6 months and 12 months. At 6 and 12 month intervals, designated samples were
removed, carefully cleaned and visually inspected under magnification. Six month test results were
presented at the Mid-Term Briefing and indicated no corrosion issues. Results of the twelve monthsamples were identical to the six month group with no anomalies noted on any sample surface for any of
the test solutions. Group images showing one side of each angled and parallel sample surface for all four
solutions are given in Figures 4 and 5. Since both interfaces in each assembly were identical, only one of
the plate surfaces for each test assembly are shown for purposes of expediency.
Visual and
Microscopic
Evaluation
Data
Reduction
and Analysis
Cyclic
Polarization
Tafel
Polarization
Linear
Polarization
Open Circuit
Analysis
Visual and
Microscopic
Evaluation
Data
Reduction
and Analysis
Cyclic
Polarization
Tafel
Polarization
Linear
Polarization
Open Circuit
Analysis
7
7/26/2019 ectrocoroziunea
http://slidepdf.com/reader/full/ectrocoroziunea 18/30
Figure 4: Images with descriptions of crevice sample surfaces after six months in the test solutions.
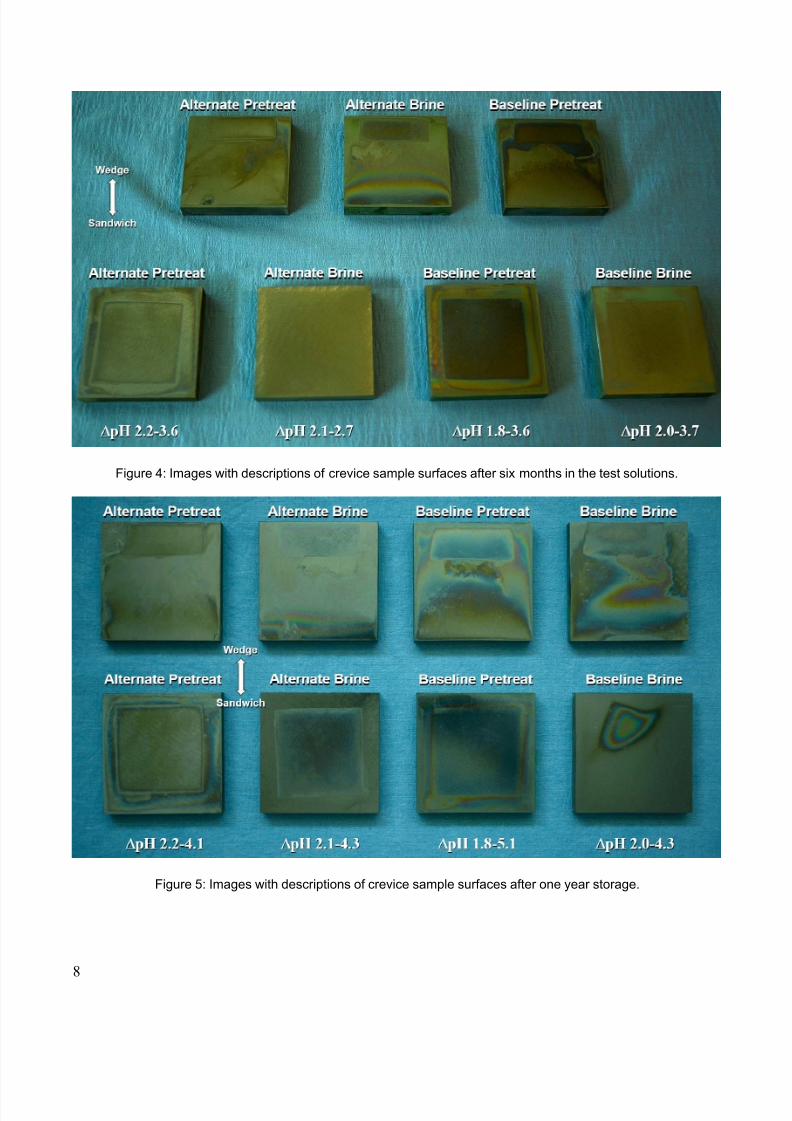
Figure 5: Images with descriptions of crevice sample surfaces after one year storage.
8
7/26/2019 ectrocoroziunea
http://slidepdf.com/reader/full/ectrocoroziunea 19/30
The pH of each storage solution was measured at the start of the test and then after the 6 and 12
month test periods. These results are provided in Figures 4 and 5. In all cases, microscopic examinationindicated no visible signs of pitting, etching, recession or surface growth on any of metal surfaces for any
of the test solutions. After removing the samples from the acidic test solutions, rinsing in DI water and
allowing to stabilize in the ambient atmosphere, discoloration patterns were seen on some of the surfaces
which were analogous to those observed on titanium samples previously. However, it has beendemonstrated that these discolorations are purely superficial in nature and have no effect on the corrosion
protection properties of the metal. They are believed to develop due to very slight lattice deviations in the
oxide structure as it adapts to ambient conditions during the rinsing and air stabilization process.
Overall changes in solution pH indicated no anomalies which could be attributed to corrosion
events since no corrosion was observed on any surface in any solution. Organism growth in and atop thealternate pretreat bath was substantial after 2-3 weeks in storage but then leveled off and remained
essentially constant for the remainder of the test periods. No growth was seen in the any of the other
solutions. Initial and 12-month pH values for the four test solution are given below.
(1) Alternate Pretreat:∆ pH 2.2 – 4.1
(2) Alternate Brine: ∆ pH 2.1 – 4.3
(3) Baseline Pretreat: ∆ pH 1.8 – 5.1
(4) Baseline Brine: ∆ pH 2.0 – 4.3
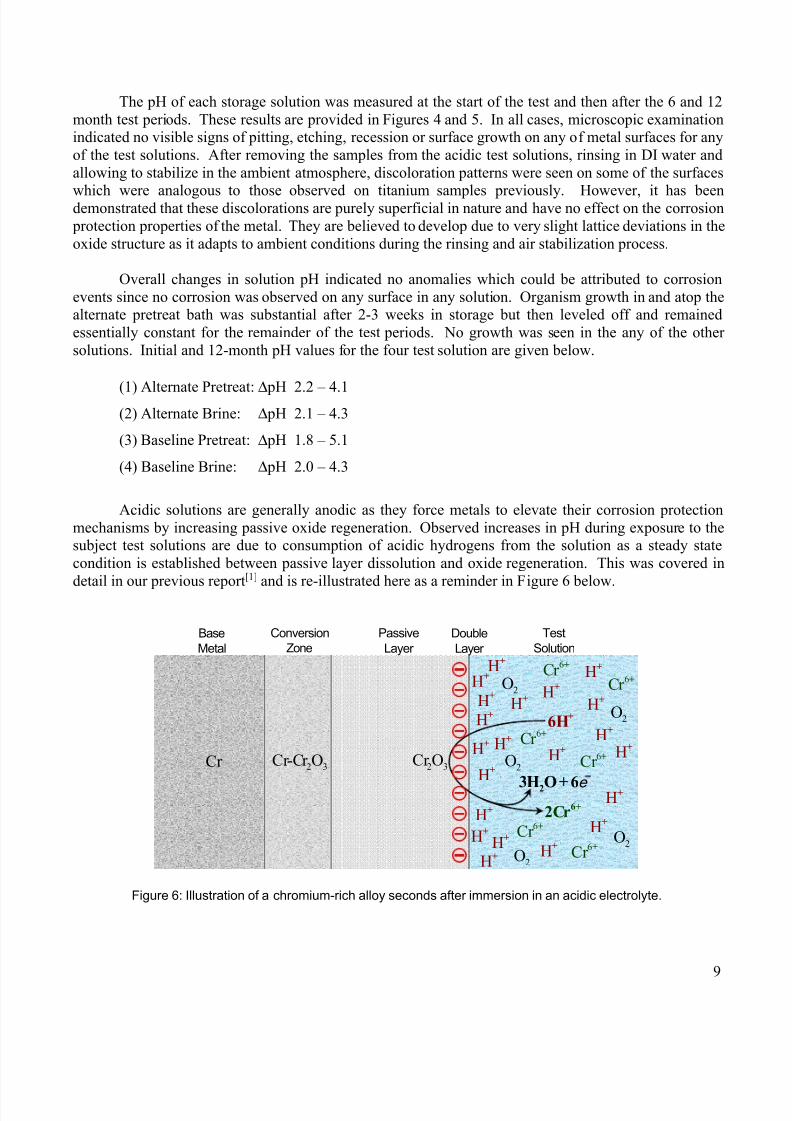
Acidic solutions are generally anodic as they force metals to elevate their corrosion protection
mechanisms by increasing passive oxide regeneration. Observed increases in pH during exposure to thesubject test solutions are due to consumption of acidic hydrogens from the solution as a steady state
condition is established between passive layer dissolution and oxide regeneration. This was covered in
detail in our previous report[1] and is re-illustrated here as a reminder in Figure 6 below.
Figure 6: Illustration of a chromium-rich alloy seconds after immersion in an acidic electrolyte.
Conversion
Zone
Base
Metal
Cr
Double
Layer
Test
Solution
2 3Cr-Cr O 2 3Cr O
+6H
23H O + 6
e 6+
2Cr
H+
H+
H+H+
H+
H+
H+
H+
H+
H+H+H+
H+
H+
H+
H+H+
H+
H+
H+ H+
2O
2O
2O
2O
2O
6Cr
+
6Cr +
6Cr +
6Cr +
6Cr +
6Cr +
Passive
Layer
9
7/26/2019 ectrocoroziunea
http://slidepdf.com/reader/full/ectrocoroziunea 20/30
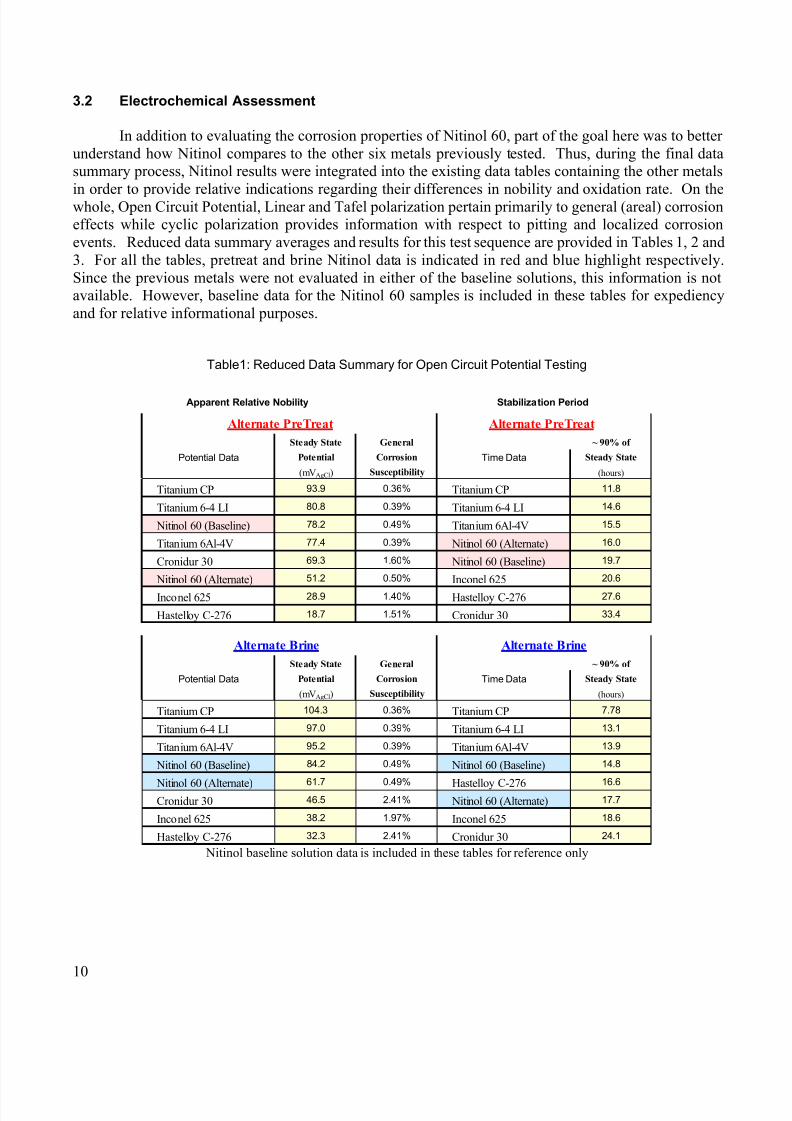
3.2 Electrochemical Assessment
In addition to evaluating the corrosion properties of Nitinol 60, part of the goal here was to better
understand how Nitinol compares to the other six metals previously tested. Thus, during the final datasummary process, Nitinol results were integrated into the existing data tables containing the other metals
in order to provide relative indications regarding their differences in nobility and oxidation rate. On thewhole, Open Circuit Potential, Linear and Tafel polarization pertain primarily to general (areal) corrosioneffects while cyclic polarization provides information with respect to pitting and localized corrosion
events. Reduced data summary averages and results for this test sequence are provided in Tables 1, 2 and
3. For all the tables, pretreat and brine Nitinol data is indicated in red and blue highlight respectively.
Since the previous metals were not evaluated in either of the baseline solutions, this information is notavailable. However, baseline data for the Nitinol 60 samples is included in these tables for expediency
and for relative informational purposes.
Table1: Reduced Data Summary for Open Circuit Potential Testing
Nitinol baseline solution data is included in these tables for reference only
Apparent Relative Nobility Stabilization Period
Alternate PreTreat Alternate PreTreat
Steady State General ~ 90% of
Potential Data Potential Corrosion Time Data Steady State
(mVAgCl) Susceptibility (hours)
Titanium CP 93.9 0.36% Titanium CP 11.8
Titanium 6-4 LI 80.8 0.39% Titanium 6-4 LI 14.6
Nitinol 60 (Baseline) 78.2 0.49% Titanium 6Al-4V 15.5
Titanium 6Al-4V 77.4 0.39% Nitinol 60 (Alternate) 16.0
Cronidur 30 69.3 1.60% Nitinol 60 (Baseline) 19.7
Nitinol 60 (Alternate) 51.2 0.50% Inconel 625 20.6
Inconel 625 28.9 1.40% Hastelloy C-276 27.6
Hastelloy C-276 18.7 1.51% Cronidur 30 33.4
Alternate Brine Alternate Brine
Steady State General ~ 90% of
Potential Data Potential Corrosion Time Data Steady State
(mVAgCl) Susceptibility (hours)
Titanium CP 104.3 0.36% Titanium CP 7.78
Titanium 6-4 LI 97.0 0.39% Titanium 6-4 LI 13.1
Titanium 6Al-4V 95.2 0.39% Titanium 6Al-4V 13.9
Nitinol 60 (Baseline) 84.2 0.49% Nitinol 60 (Baseline) 14.8
Nitinol 60 (Alternate) 61.7 0.49%
Hastelloy C-276 16.6
Cronidur 30 46.5 2.41% Nitinol 60 (Alternate) 17.7
Inconel 625 38.2 1.97% Inconel 625 18.6
Hastelloy C-276 32.3 2.41% Cronidur 30 24.1
10
7/26/2019 ectrocoroziunea
http://slidepdf.com/reader/full/ectrocoroziunea 21/30
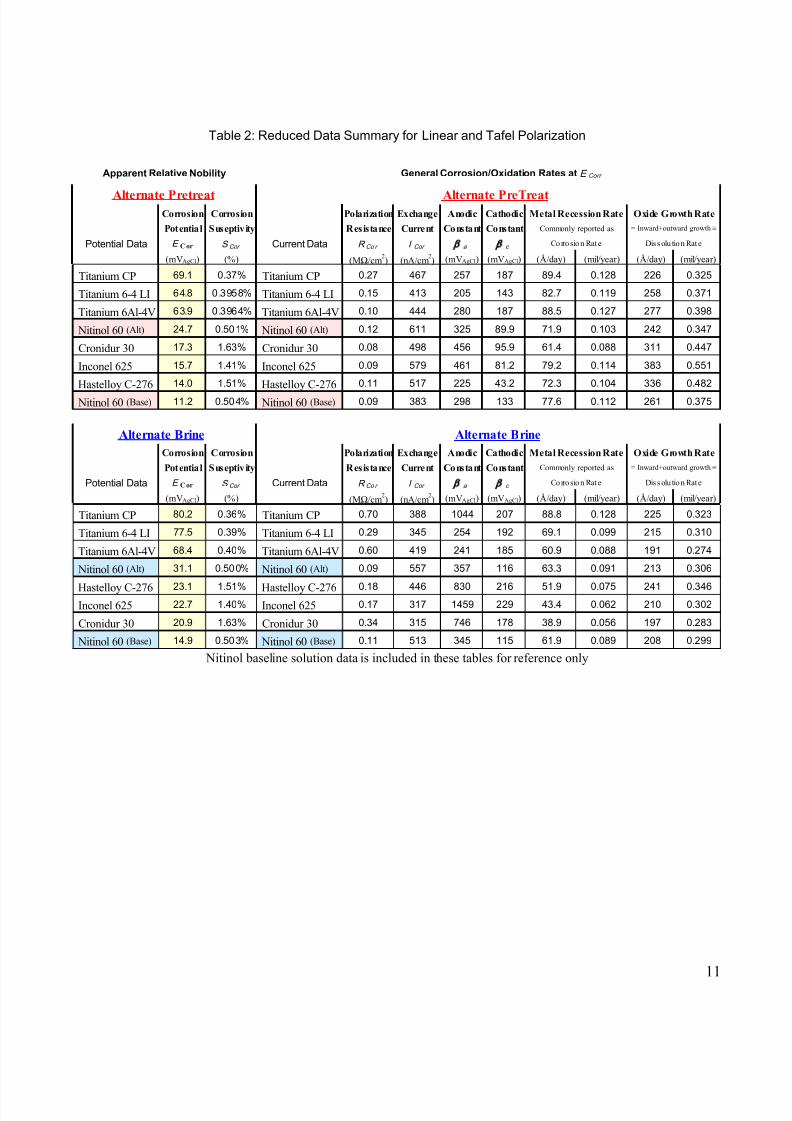
Table 2: Reduced Data Summary for Linear and Tafel Polarization
Nitinol baseline solution data is included in these tables for reference only
Apparent Relative Nobility General Corrosion/Oxidation Rates at E Corr
Alternate Pretreat Alternate PreTreatCorrosion Corrosion Polarization Exchange Anodic Cathodic Metal Recession Rate Oxide Growth Rate
Potential Suseptivity Resistance Current Constant Constant Commonly reported as = Inward+outward growth ≡
Potential Data E C or S Cor Current Data R Co r I Cor a c Corrosion Rat e Dis solu tion Rat e
(mVAgCl) (%) (MΩ/cm2) (nA/cm
2) (mVAgCl) (mVAgCl) (Å/day) (mil/year) (Å/day) (mil/year)
Titanium CP 69.1 0.37% Titanium CP 0.27 467 257 187 89.4 0.128 226 0.325
Titanium 6-4 LI 64.8 0.3958% Titanium 6-4 LI 0.15 413 205 143 82.7 0.119 258 0.371
Titanium 6Al-4V 63.9 0.3964% Titanium 6Al-4V 0.10 444 280 187 88.5 0.127 277 0.398
Nitinol 60 (Alt) 24.7 0.501% Nitinol 60 (Alt) 0.12 611 325 89.9 71.9 0.103 242 0.347
Cronidur 30 17.3 1.63% Cronidur 30 0.08 498 456 95.9 61.4 0.088 311 0.447
Inconel 625 15.7 1.41% Inconel 625 0.09 579 461 81.2 79.2 0.114 383 0.551
Hastelloy C-276 14.0 1.51% Hastelloy C-276 0.11 517 225 43.2 72.3 0.104 336 0.482
Nitinol 60 (Base) 11.2 0.504% Nitinol 60 (Base) 0.09 383 298 133 77.6 0.112 261 0.375
Alternate Brine Alternate Brine
Corrosion Corrosion Polarization Exchange Anodic Cathodic Metal Recession Rate Oxide Growth Rate
Potential Suseptivity Resistance Current Constant Constant Commonly reported as = Inward+outward growth ≡
Potential Data E C or S Cor Current Data R Co r I Cor a c Corrosion Rat e Dis solu tion Rat e
(mVAgCl) (%) (MΩ/cm2) (nA/cm
2) (mVAgCl) (mVAgCl) (Å/day) (mil/year) (Å/day) (mil/year)
Titanium CP 80.2 0.36% Titanium CP 0.70 388 1044 207 88.8 0.128 225 0.323
Titanium 6-4 LI 77.5 0.39% Titanium 6-4 LI 0.29 345 254 192 69.1 0.099 215 0.310
Titanium 6Al-4V 68.4 0.40% Titanium 6Al-4V 0.60 419 241 185 60.9 0.088 191 0.274
Nitinol 60 (Alt) 31.1 0.500% Nitinol 60 (Alt) 0.09 557 357 116 63.3 0.091 213 0.306
Hastelloy C-276 23.1 1.51% Hastelloy C-276 0.18 446 830 216 51.9 0.075 241 0.346
Inconel 625 22.7 1.40% Inconel 625 0.17 317 1459 229 43.4 0.062 210 0.302
Cronidur 30 20.9 1.63% Cronidur 30 0.34 315 746 178 38.9 0.056 197 0.283
Nitinol 60 (Base) 14.9 0.503% Nitinol 60 (Base) 0.11 513 345 115 61.9 0.089 208 0.299
11
7/26/2019 ectrocoroziunea
http://slidepdf.com/reader/full/ectrocoroziunea 22/30
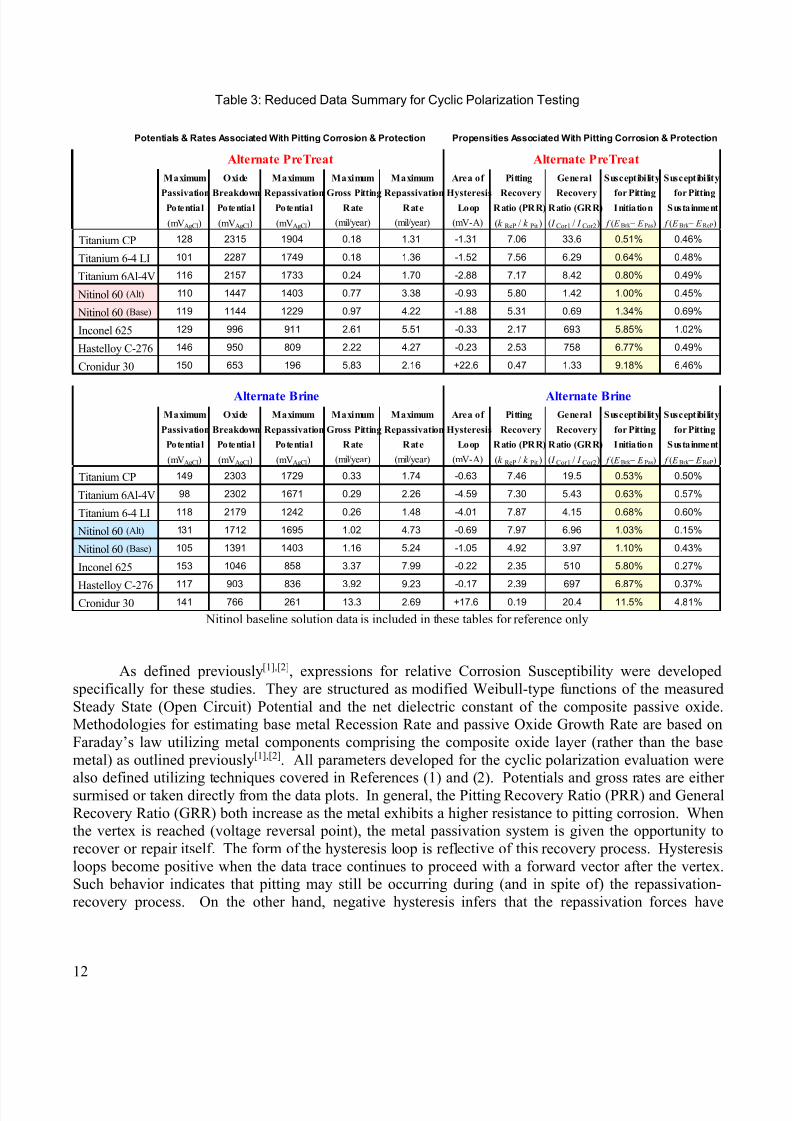
Table 3: Reduced Data Summary for Cyclic Polarization Testing
Nitinol baseline solution data is included in these tables for reference only
As defined previously[1],[2], expressions for relative Corrosion Susceptibility were developed
specifically for these studies. They are structured as modified Weibull-type functions of the measured
Steady State (Open Circuit) Potential and the net dielectric constant of the composite passive oxide.Methodologies for estimating base metal Recession Rate and passive Oxide Growth Rate are based on
Faraday’s law utilizing metal components comprising the composite oxide layer (rather than the base
metal) as outlined previously[1],[2]. All parameters developed for the cyclic polarization evaluation werealso defined utilizing techniques covered in References (1) and (2). Potentials and gross rates are either
surmised or taken directly from the data plots. In general, the Pitting Recovery Ratio (PRR) and General
Recovery Ratio (GRR) both increase as the metal exhibits a higher resistance to pitting corrosion. Whenthe vertex is reached (voltage reversal point), the metal passivation system is given the opportunity to
recover or repair itself. The form of the hysteresis loop is reflective of this recovery process. Hysteresis
loops become positive when the data trace continues to proceed with a forward vector after the vertex.Such behavior indicates that pitting may still be occurring during (and in spite of) the repassivation-
recovery process. On the other hand, negative hysteresis infers that the repassivation forces have
Potentials & Rates Associated With Pitting Corrosion & Protection Propensities Associated With Pitting Corrosion & Protection
Alternate PreTreat Alternate PreTreat
Maximum Oxide Maximum Maximum Maximum Area of Pitting General Susceptibility Susceptibility
Passivation Breakdown Repassivation Gross Pitting Repassivation Hysteresis Recovery Recovery for Pitting for PittingPotential Potential Potential Rate Rate Loop Ratio (PRR) Ratio (GRR) Initiation Sustainment
(mVAgCl) (mVAgCl) (mVAgCl) (mil/year) (mil/year) (mV-A) (k ReP / k Pit ) ( I Cor1 / I Cor2) f ( E Brk − E Pas) f ( E Brk − E ReP)
Titanium CP 128 2315 1904 0.18 1.31 -1.31 7.06 33.6 0.51% 0.46%
Titanium 6-4 LI 101 2287 1749 0.18 1.36 -1.52 7.56 6.29 0.64% 0.48%
Titanium 6Al-4V 116 2157 1733 0.24 1.70 -2.88 7.17 8.42 0.80% 0.49%
Nitinol 60 (Alt) 110 1447 1403 0.77 3.38 -0.93 5.80 1.42 1.00% 0.45%
Nitinol 60 (Base) 119 1144 1229 0.97 4.22 -1.88 5.31 0.69 1.34% 0.69%
Inconel 625 129 996 911 2.61 5.51 -0.33 2.17 693 5.85% 1.02%
Hastelloy C-276 146 950 809 2.22 4.27 -0.23 2.53 758 6.77% 0.49%
Cronidur 30 150 653 196 5.83 2.16 +22.6 0.47 1.33 9.18% 6.46%
Alternate Brine Alternate Brine
Maximum Oxide Maximum Maximum Maximum Area of Pitting General Susceptibility Susceptibility
Passivation Breakdown Repassivation Gross Pitting Repassivation Hysteresis Recovery Recovery for Pitting for Pitting
Potential Potential Potential Rate Rate Loop Ratio (PRR) Ratio (GRR) Initiation Sustainment
(mVAgCl) (mVAgCl) (mVAgCl) (mil/year) (mil/year) (mV-A) (k ReP / k Pit ) ( I Cor1 / I Cor2) f ( E Brk − E Pas) f ( E Brk − E ReP)
Titanium CP 149 2303 1729 0.33 1.74 -0.63 7.46 19.5 0.53% 0.50%
Titanium 6Al-4V 98 2302 1671 0.29 2.26 -4.59 7.30 5.43 0.63% 0.57%
Titanium 6-4 LI 118 2179 1242 0.26 1.48 -4.01 7.87 4.15 0.68% 0.60%
Nitinol 60 (Alt) 131 1712 1695 1.02 4.73 -0.69 7.97 6.96 1.03% 0.15%
Nitinol 60 (Base) 105 1391 1403 1.16 5.24 -1.05 4.92 3.97 1.10% 0.43%
Inconel 625 153 1046 858 3.37 7.99 -0.22 2.35 510 5.80% 0.27%
Hastelloy C-276 117 903 836 3.92 9.23 -0.17 2.39 697 6.87% 0.37%
Cronidur 30 141 766 261 13.3 2.69 +17.6 0.19 20.4 11.5% 4.81%
12
7/26/2019 ectrocoroziunea
http://slidepdf.com/reader/full/ectrocoroziunea 23/30
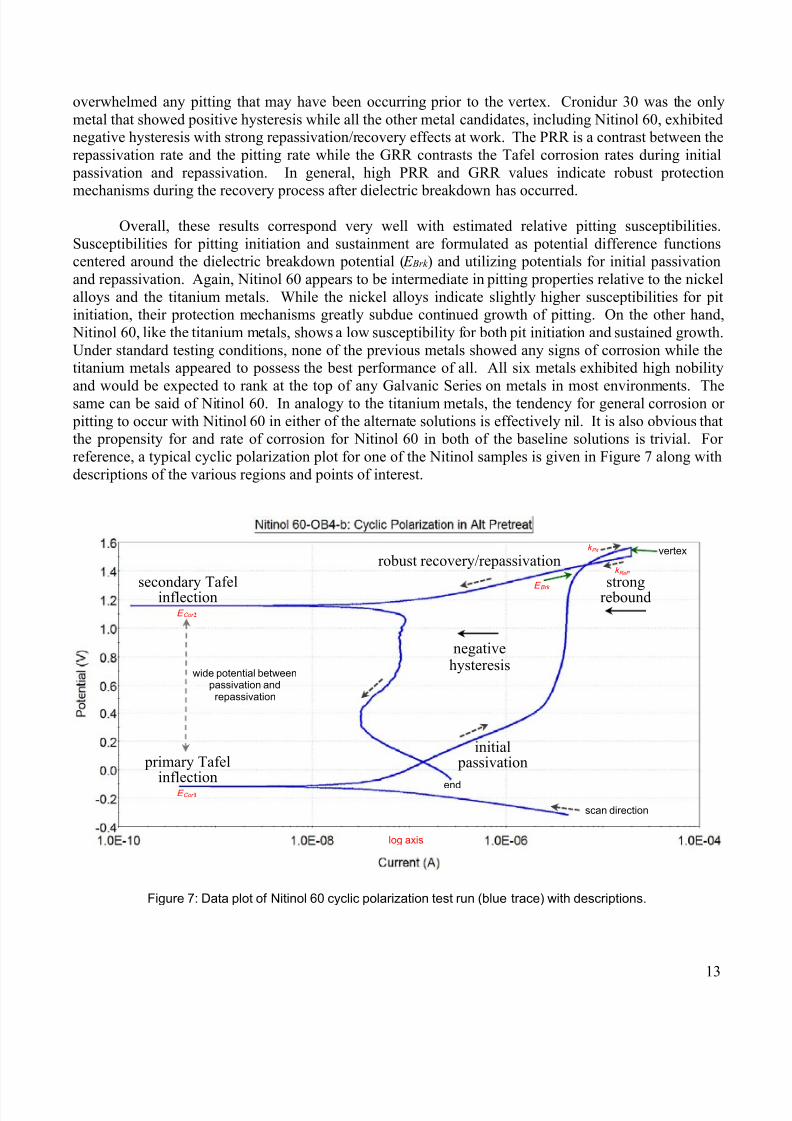
overwhelmed any pitting that may have been occurring prior to the vertex. Cronidur 30 was the only
metal that showed positive hysteresis while all the other metal candidates, including Nitinol 60, exhibitednegative hysteresis with strong repassivation/recovery effects at work. The PRR is a contrast between the
repassivation rate and the pitting rate while the GRR contrasts the Tafel corrosion rates during initial
passivation and repassivation. In general, high PRR and GRR values indicate robust protection
mechanisms during the recovery process after dielectric breakdown has occurred.
Overall, these results correspond very well with estimated relative pitting susceptibilities.
Susceptibilities for pitting initiation and sustainment are formulated as potential difference functionscentered around the dielectric breakdown potential ( E Brk ) and utilizing potentials for initial passivation
and repassivation. Again, Nitinol 60 appears to be intermediate in pitting properties relative to the nickel
alloys and the titanium metals. While the nickel alloys indicate slightly higher susceptibilities for pitinitiation, their protection mechanisms greatly subdue continued growth of pitting. On the other hand,
Nitinol 60, like the titanium metals, shows a low susceptibility for both pit initiation and sustained growth.
Under standard testing conditions, none of the previous metals showed any signs of corrosion while thetitanium metals appeared to possess the best performance of all. All six metals exhibited high nobility
and would be expected to rank at the top of any Galvanic Series on metals in most environments. Thesame can be said of Nitinol 60. In analogy to the titanium metals, the tendency for general corrosion or
pitting to occur with Nitinol 60 in either of the alternate solutions is effectively nil. It is also obvious thatthe propensity for and rate of corrosion for Nitinol 60 in both of the baseline solutions is trivial. For
reference, a typical cyclic polarization plot for one of the Nitinol samples is given in Figure 7 along with
descriptions of the various regions and points of interest.
Figure 7: Data plot of Nitinol 60 cyclic polarization test run (blue trace) with descriptions.
negativehysteresis
secondary Tafelinflection
robust recovery/repassivationvertex
strongreboundE Cor 2
k Pit
k ReP
wide potential betweenpassivation andrepassivation
initial passivation primary Tafel
inflectionE Cor 1
end
scan direction
log axis
E Brk
13
7/26/2019 ectrocoroziunea
http://slidepdf.com/reader/full/ectrocoroziunea 24/30
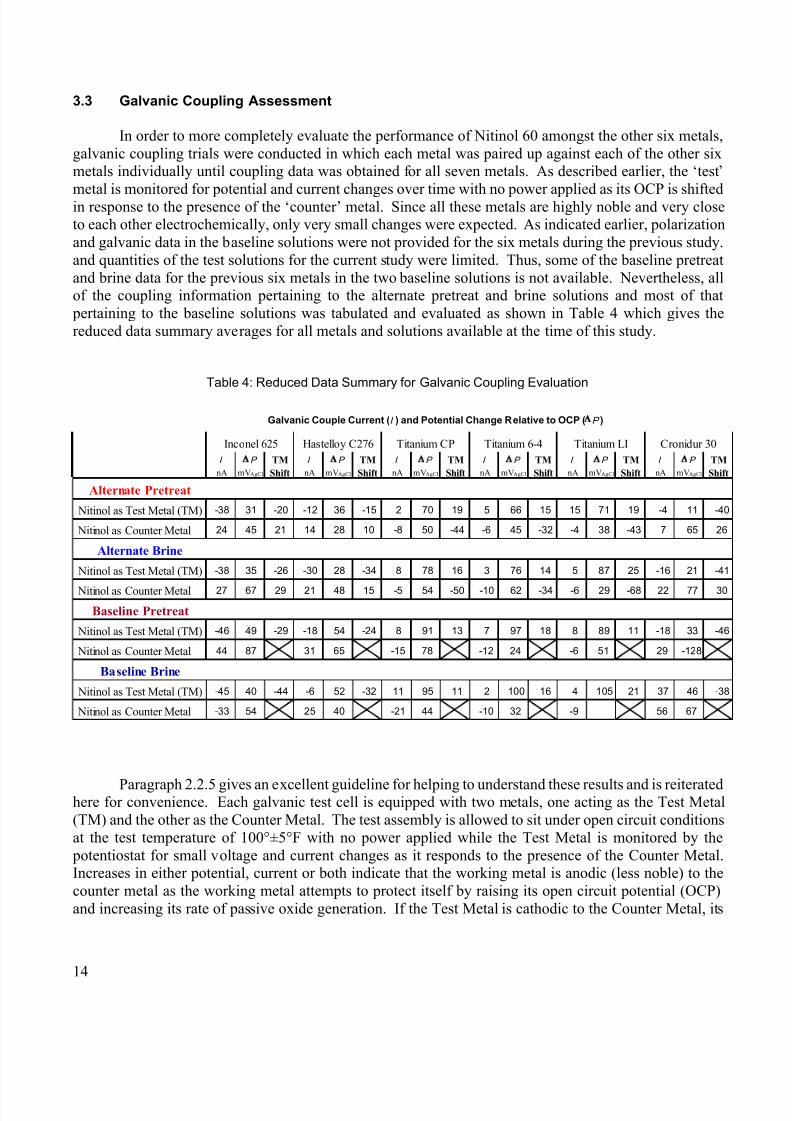
3.3 Galvanic Coupling Assessment
In order to more completely evaluate the performance of Nitinol 60 amongst the other six metals,
galvanic coupling trials were conducted in which each metal was paired up against each of the other sixmetals individually until coupling data was obtained for all seven metals. As described earlier, the ‘test’
metal is monitored for potential and current changes over time with no power applied as its OCP is shiftedin response to the presence of the ‘counter’ metal. Since all these metals are highly noble and very closeto each other electrochemically, only very small changes were expected. As indicated earlier, polarization
and galvanic data in the baseline solutions were not provided for the six metals during the previous study.
and quantities of the test solutions for the current study were limited. Thus, some of the baseline pretreat
and brine data for the previous six metals in the two baseline solutions is not available. Nevertheless, allof the coupling information pertaining to the alternate pretreat and brine solutions and most of that
pertaining to the baseline solutions was tabulated and evaluated as shown in Table 4 which gives the
reduced data summary averages for all metals and solutions available at the time of this study.
Table 4: Reduced Data Summary for Galvanic Coupling Evaluation
Paragraph 2.2.5 gives an excellent guideline for helping to understand these results and is reiteratedhere for convenience. Each galvanic test cell is equipped with two metals, one acting as the Test Metal
(TM) and the other as the Counter Metal. The test assembly is allowed to sit under open circuit conditions
at the test temperature of 100°±5°F with no power applied while the Test Metal is monitored by the
potentiostat for small voltage and current changes as it responds to the presence of the Counter Metal.Increases in either potential, current or both indicate that the working metal is anodic (less noble) to the
counter metal as the working metal attempts to protect itself by raising its open circuit potential (OCP)
and increasing its rate of passive oxide generation. If the Test Metal is cathodic to the Counter Metal, its
Galvanic Couple Current (I ) and Potential Change Relative to OCP ( P )
Inconel 625 Hastelloy C276 Titanium CP Titanium 6-4 Titanium LI Cronidur 30I
P TM I
P TM I
P TM I
P TM I
P TM I
P TM
nA mVAgCl Shift nA mVAgCl Shift nA mVAgCl Shift nA mVAgCl Shift nA mVAgCl Shift nA mVAgCl Shift
Alternate Pretreat
Nitinol as Test Metal (TM) -38 31 -20 -12 36 -15 2 70 19 5 66 15 15 71 19 -4 11 -40
Nitinol as Counter Metal 24 45 21 14 28 10 -8 50 -44 -6 45 -32 -4 38 -43 7 65 26
Alternate Brine
Nitinol as Test Metal (TM) -38 35 -26 -30 28 -34 8 78 16 3 76 14 5 87 25 -16 21 -41
Nitinol as Counter Metal 27 67 29 21 48 15 -5 54 -50 -10 62 -34 -6 29 -68 22 77 30
Baseline Pretreat
Nitinol as Test Metal (TM) -46 49 -29 -18 54 -24 8 91 13 7 97 18 8 89 11 -18 33 -46
Nitinol as Counter Metal 44 87 31 65 -15 78 -12 24 -6 51 29 -128
Baseline Brine
Nitinol as Test Metal (TM) -45 40 -44 -6 52 -32 11 95 11 2 100 16 4 105 21 37 46 -38
Nitinol as Counter Metal -33 54 25 40 -21 44 -10 32 -9 56 67
14
7/26/2019 ectrocoroziunea
http://slidepdf.com/reader/full/ectrocoroziunea 25/30
OCP is slightly reduced while the rate of passivation decreases. Cathodic behavior indicates that the
working metal is nobler than the counter metal as the working metal’s corrosion protection requirementsare relaxed. Potential changes are indicated by the TM Shift in Table 4. Thus, negative currents and/or
negative TM Shifts infer that the Test Metal is cathodic (more noble) than the counter metal it is paired
up with, while positive currents and/or TM Shifts indicate that the Test Metal is anodic (less noble) than
the counter metal it is paired up with. Collectively, for all seven metals evaluated, potential and currentshifts are quite small, being in the milli-volt and nano-amp ranges. As a matter of fact, these changes are
so minute that galvanic differences between the seven metals are completely irrelevant. They are well
within the 250mV limit provided in Table 2 of NASA-STD-6012 [3].
Due to the close proximity of these seven metals in terms of nobility and the fact that no power is
applied, this test is completely nondestructive, producing no surface degradation of any kind. Again, thenobility placement of Nitinol 60 appears to somewhere be in between the nickel/chromium and
iron/chromium alloys (625, C276 and 30) and the three titanium metals. It is perhaps a little closer to the
titanium metals. Therefore, it is concluded that Nitinol 60 is compatible with the six metals tested previously for both the alternate pretreat and alternate brine solutions. One could probably make a strong
argument that all seven metals are also compatible in both of the baseline solutions as well.
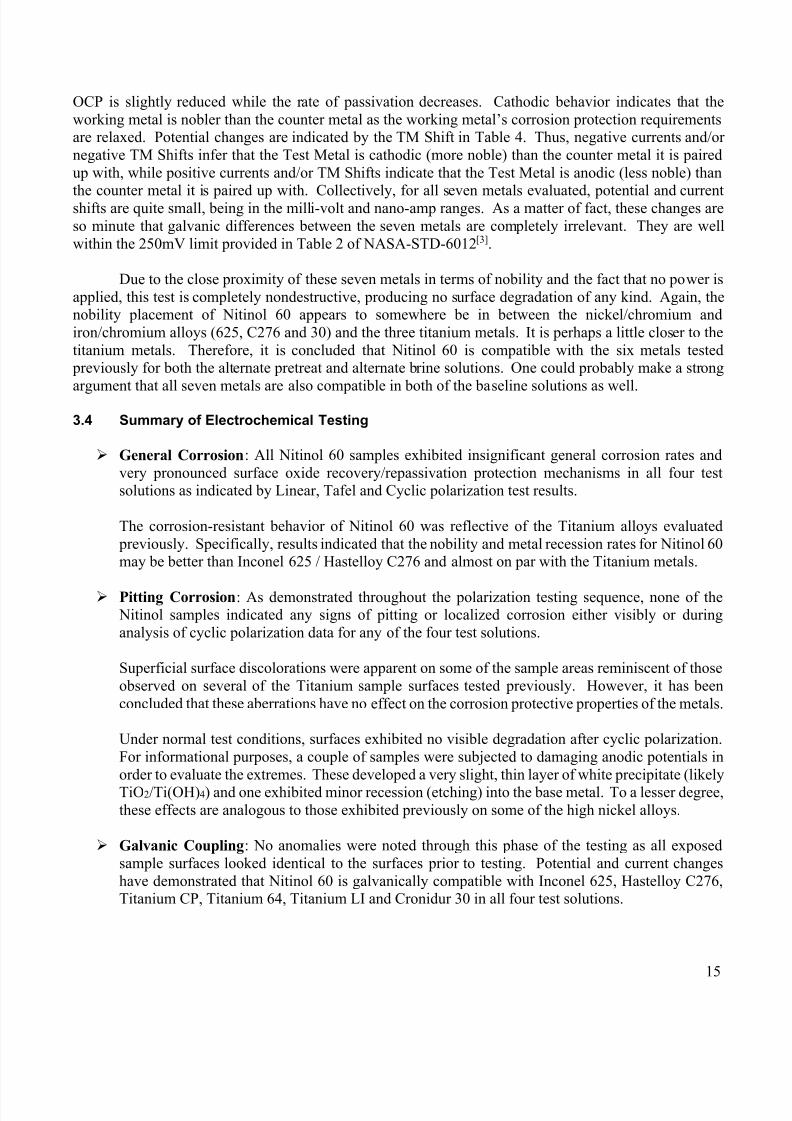
3.4 Summary of Electrochemical Testing
General Corrosion: All Nitinol 60 samples exhibited insignificant general corrosion rates and
very pronounced surface oxide recovery/repassivation protection mechanisms in all four testsolutions as indicated by Linear, Tafel and Cyclic polarization test results.
The corrosion-resistant behavior of Nitinol 60 was reflective of the Titanium alloys evaluated
previously. Specifically, results indicated that the nobility and metal recession rates for Nitinol 60may be better than Inconel 625 / Hastelloy C276 and almost on par with the Titanium metals.
Pitting Corrosion: As demonstrated throughout the polarization testing sequence, none of the Nitinol samples indicated any signs of pitting or localized corrosion either visibly or during
analysis of cyclic polarization data for any of the four test solutions.
Superficial surface discolorations were apparent on some of the sample areas reminiscent of those
observed on several of the Titanium sample surfaces tested previously. However, it has been
concluded that these aberrations have no effect on the corrosion protective properties of the metals.
Under normal test conditions, surfaces exhibited no visible degradation after cyclic polarization.
For informational purposes, a couple of samples were subjected to damaging anodic potentials in
order to evaluate the extremes. These developed a very slight, thin layer of white precipitate (likelyTiO2/Ti(OH)4) and one exhibited minor recession (etching) into the base metal. To a lesser degree,
these effects are analogous to those exhibited previously on some of the high nickel alloys.
Galvanic Coupling: No anomalies were noted through this phase of the testing as all exposed
sample surfaces looked identical to the surfaces prior to testing. Potential and current changes
have demonstrated that Nitinol 60 is galvanically compatible with Inconel 625, Hastelloy C276,Titanium CP, Titanium 64, Titanium LI and Cronidur 30 in all four test solutions.
15

7/26/2019 ectrocoroziunea
http://slidepdf.com/reader/full/ectrocoroziunea 26/30

7/26/2019 ectrocoroziunea
http://slidepdf.com/reader/full/ectrocoroziunea 27/30
References
1. “ECLSS Sustaining Metal Materials Compatibility Final Report, Electrochemical and Crevice
Corrosion Test Results”, R.E. Lee, NASA/CR—2015–218208, April 2015, Contract NNM12AA41C
2. “ECLSS Sustaining Metal Materials Compatibility Final Briefing, Electrochemical and Crevice
Corrosion Test Results”, October 6, 2014, Randy Lee
3. “Corrosion Protection for Space Flight Hardware”, NASA Technical Standard NASA-STD-6012,March 8, 2012
17
7/26/2019 ectrocoroziunea
http://slidepdf.com/reader/full/ectrocoroziunea 28/30
viii
REPORT DOCUMENTATION PAGEForm Approved
OMB No. 0704-0188
The public reporting burden for this collection of information is estimated to average 1 hour per response, including the time for reviewing instructions, searching existing data sources, gathering and maintaining
the data needed, and completing and reviewing the collection of information. Send comments regarding this burden estimate or any other aspect of this collection of information, including suggestio ns for reducing
this burden, to Department of Defense, Washington Headquarters Services, Directorate for Information Operation and Reports (0704-0188), 1215 Jefferson Davis Highway, Suite 1204, Arlington, VA 22202-4302.
Respondents should be aware that notwithstanding any other provision of law, no person shall be subject to any penalty for failing to comply with a collection of information if it does not display a currently valid
OMB control number.
PLEASE DO NOT RETURN YOUR FORM TO THE ABOVE ADDRESS.
1. REPORT DATE (DD-MM-YYYY) 2. REPORT TYPE 3. DATES COVERED (From - To)
4. TITLE AND SUBTITLE 5a. CONTRACT NUMBER
5b. GRANT NUMBER
5c. PROGRAM ELEMENT NUMBER
6. AUTHOR(S) 5d. PROJECT NUMBER
5e. TASK NUMBER
5f. WORK UNIT NUMBER
7. PERFORMING ORGANIZATION NAME(S) AND ADDRESS(ES) 8. PERFORMING ORGANIZATION
REPORT NUMBER
9. SPONSORING/MONITORING AGENCY NAME(S) AND ADDRESS(ES) 10. SPONSORING/MONITOR’S ACRONYM(S)
11. SPONSORING/MONITORING REPORT NUMBER
12. DISTRIBUTION/AVAILABILITY STATEMENT
13. SUPPLEMENTARY NOTES
14. ABSTRACT
15. SUBJECT TERMS
16. SECURITY CLASSIFICATION OF:
a. REPORT b. ABSTRACT c. THIS PAGE
17. LIMITATION OF ABSTRACT 18. NUMBER OF
PAGES
19a. NAME OF RESPONSIBLE PERSON
19b. TELEPHONE NUMBER (Include area code)
Standard Form 298 (Rev. 8-98)Prescribed by ANSI Std. Z39-18
Electrochemical, Polarization, and Crevice Corrosion Testing
of Nitinol 60, A Supplement to the ECLSS Sustaining Materials
Compatibility Study
R.E. Lee
Jacobs ESSSA Group
Huntsville, AL 35806
George C. Marshall Space Flight Center
Huntsville, AL 35812
Unclassified-Unlimited
Subject Category 26
Availability: NASA STI Information Desk (757–864–9658)
Prepared for the Materials and Processes Laboratory, Engineering Directorate
Technical Monitor: C.K. Russell
M–1409
NNM12AA41C
Contractor Report
NASA/CR—2016–218220
corrosion, pitting, passivation, polarization, electrochemical, Tafel, Nitinol
01–03–2016
UU 30U U U
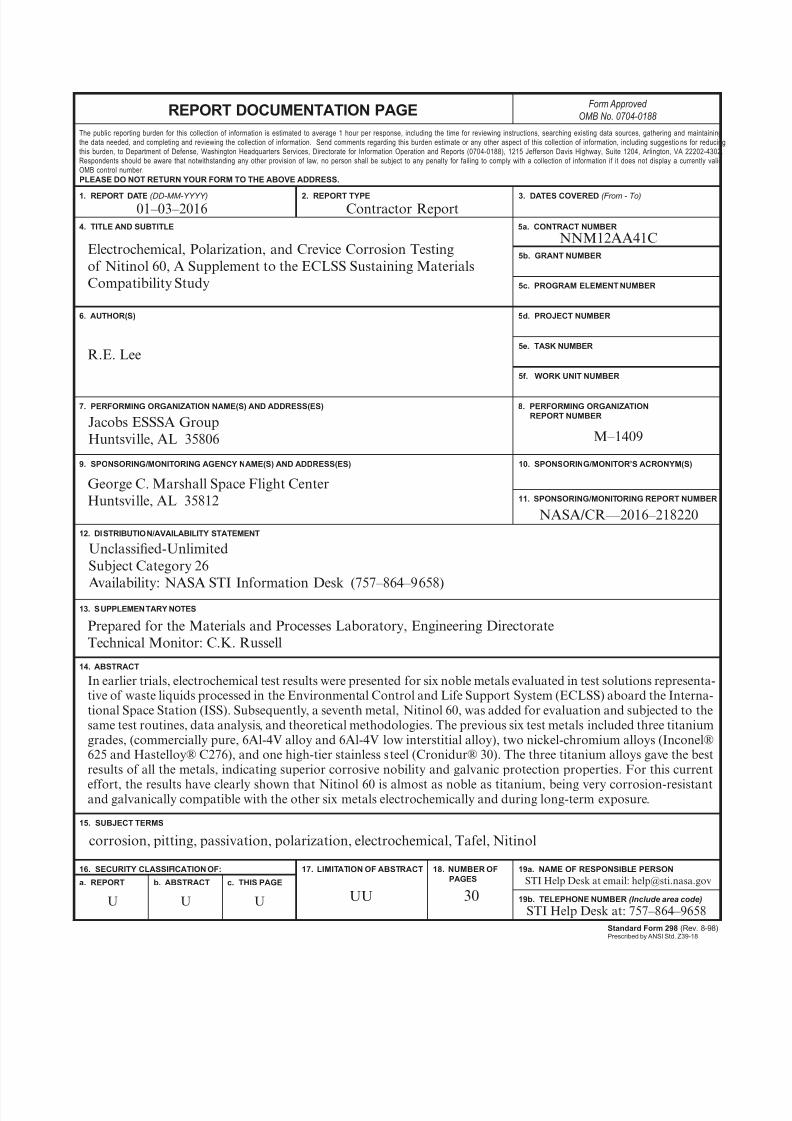
In earlier trials, electrochemical test results were presented for six noble metals evaluated in test solutions representa-tive of waste liquids processed in the Environmental Control and Life Support System (ECLSS) aboard the Interna-tional Space Station (ISS). Subsequently, a seventh metal, Nitinol 60, was added for evaluation and subjected to thesame test routines, data analysis, and theoretical methodologies. The previous six test metals included three titaniumgrades, (commercially pure, 6Al-4V alloy and 6Al-4V low interstitial alloy), two nickel-chromium alloys (Inconel®625 and Hastelloy® C276), and one high-tier stainless steel (Cronidur® 30). The three titanium alloys gave the bestresults of all the metals, indicating superior corrosive nobility and galvanic protection properties. For this current
effort, the results have clearly shown that Nitinol 60 is almost as noble as titanium, being very corrosion-resistantand galvanically compatible with the other six metals electrochemically and during long-term exposure.
STI Help Desk at email: [email protected]
STI Help Desk at: 757–864–9658

7/26/2019 ectrocoroziunea
http://slidepdf.com/reader/full/ectrocoroziunea 29/30

7/26/2019 ectrocoroziunea
http://slidepdf.com/reader/full/ectrocoroziunea 30/30
National Aeronautics and
Space Administration
IS02
George C. Marshall Space Flight Center
Huntsville, Alabama 35812