schimbĂrile climatice Şi implicaŢiile … 2009/035.pdfschimbĂrile climatice Şi implicaŢiile...
TRANSCRIPT
Scientific Papers of the R.I.F.G. Pitesti, Vol. XXV, 2009_________________________________________________
80
SCHIMBĂRILE CLIMATICE ŞI IMPLICAŢIILE ASUPRA PRODUCŢIEI POMICOLE CLIMATE CHANGE IMPACT ON FRUIT GROWING PRODUCTION Elena Mateescu, Adriana Marica, Daniel Alexandru National Meteorological Administration, Bucharest - Romania Abstract Climate change impact on fruit trees production which involves analysis of the specific agro-climate parameters in order to identify the potential thermal risk in autumn, winter and spring seasons. This paper aims to spatial representation of the main phases of development of the fruit species in Muntenia region, that a case study for the Pitesti area, both in terms of current climatic conditions and those expected (2040 and 2080 decades), using two arbitrary climate scenarios. Comparative analysis of current climate trends and future includes data expected of different phenological phases representative of fruit species, respectively bud bursting and flowering at apricot, plum, pear and apple and spring degree accumulation (Tmean>0°C, February 1 – April 10) to monitor the impact of climate variability on fruit agroecosystems in the area of interest. This approach bases the development of strategies for differentiation and territorial zoning of varieties with high ability to adapt to climate change. Analysis results show that phases bud bursting and flowering to all fruit species taken in study, occur sooner an average of 4-8 days in terms of arbitrary scenario the air temperature will increase by 1°C and that, with 9-12 days in terms of temperature increase to 2°C, compared the current. The increasing trend in air temperature it also estimates an increase in the amount of heat units between February 1–April 10 period, compared to current values, with 12% to 23% in 2040 and 30% to 40% in 2080, this indicates an early or even spring, and face increased risk of late spring frosts. Cuvinte cheie: schimbări climatice, risc termic, pomicultura, adaptare Keywords: climate change, thermal risk phenomenon, pomiculture 1. Introduction
Climatic factors are particularly important for growing the fruit-trees production, since each
species/genotype has specific demands during the vegetation season, as regards the temperature and humidity resources. In other words, the phenological development is adjusted by the specific climatic demands and whatever deviation from those may induce restrictive influences, thus determining wide variability at the level of the fruit yield, with respect to both quantity and quality.
It is anticipated that every region in Europe will be negatively affected by the future climate change, involving, in this sense, problems to be solved in all the economic sectors affected by climatic variability. The fourth IPCC (Intergovernmental Panel on Climate Change, 2007) Report gives a comprehensive summary of the latest results in the field, taking into account the relevant long term socio-economic and the scientific aspects for adaptation and mitigation.
In Romania, changes in the climatic regime frame in the global context, with peculiarities induced the geographic region where our country is situated. The analysis of the climatological data series for the 1901-2007 interval highlights that the mean all-country temperature has risen by 0.5°C after 1961 with much more enhanced projected increases in almost the whole country. According to scenarios, in the first decades of the 21st century an increase in the mean annual temperature between 0.5°C and 1.5°C is expected and between 2.0°C and 5.0°C towards the end of the century, function of the scenario of the greenhouse gases emission.
2. Material and methods
The work methodology was based on the computation of the various thermal indices specific to the
fruit tree species, for both the current (1961-2007) and the future (2040 and 2080) climate conditions, from a number of 13 agrometeorological stations situated in Wallachia, as well as a case study for Pitesti area. Thus, for the current climatic conditions, there were used the daily values of the mean temperatures recorded in the 1961-2007 interval, whereas for the future climatic evolution, two scenarios were used of the possible climate change.
As a rule, climatic scenarios are plausible representations of the future climate evolution, based on predictions of the possible increases of the emission of greenhouse gases and of other pollutants. Impact studies carried out at international and national levels use three types of climatic scenarios: synthetic (arbitrary) scenarios, scenarios based on analogous and scenarios based on the outputs of the general circulation models.
Scientific Papers of the R.I.F.G. Pitesti, Vol. XXV, 2009_________________________________________________
81
To achieve its aim, this paper used two arbitrary scenarios, where the air temperature daily values from the current climate are arbitrary modified (increased by 1°C and 2°C respectively). Yielded products are outlined through thematic GIS maps at the level of Wallachia region comprising the mean multiannual data zoning as regards the budding out and flowering in the apricot, plum, pear and apple tree species respectively, as well as the spring coming index, in view to determine the fulfilment intervals, along with the earliest/latest occurrence dates of those events, both for the baseline climate (1961-2004) and for the future one (2040 and 2080 decades respectively). 3. Results and discussions Observed and future changes in the climatic regime in Romania
At the level of the 1901-2007 period, the mean annual all-country air temperature rose by 0.5°C, in the last 20 years the warmest year being 2007 (11.5°C) and the coldest 1985 (8.4°C), Fig. 1.
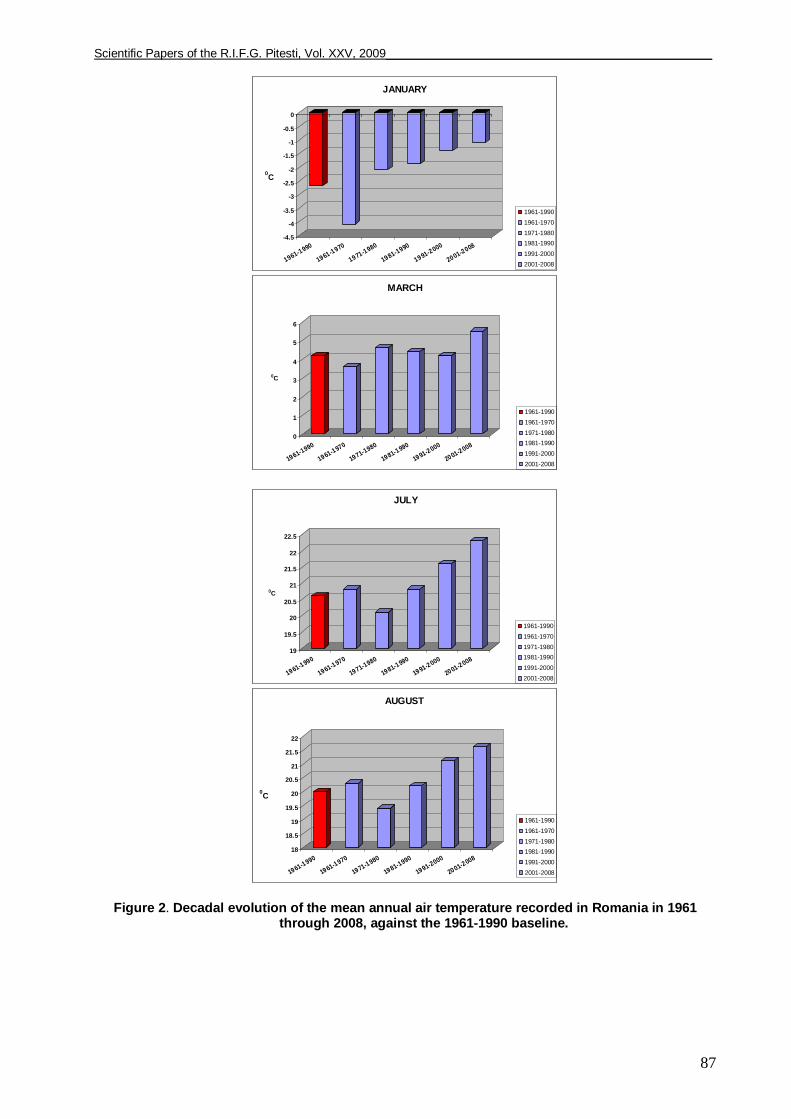
Figure 2 renders the evolution by decades of the mean monthly air temperatures at the level of surfaces of agricultural interest in Romania over the 1961-2008 period, in comparison with the referenced 1961-1990 period, for four months (January, March, July and August), considered to be the most representative as regards the increases of the thermal values (by over 1.3°C). Compared to the baseline, in January, in the 2001-2008 interval, the air temperature rose by 1.6°C, in March by 1.3°C, in July by 1.6°C and in August by 1.6°C. The increasing tend is obvious beginning with 1981.
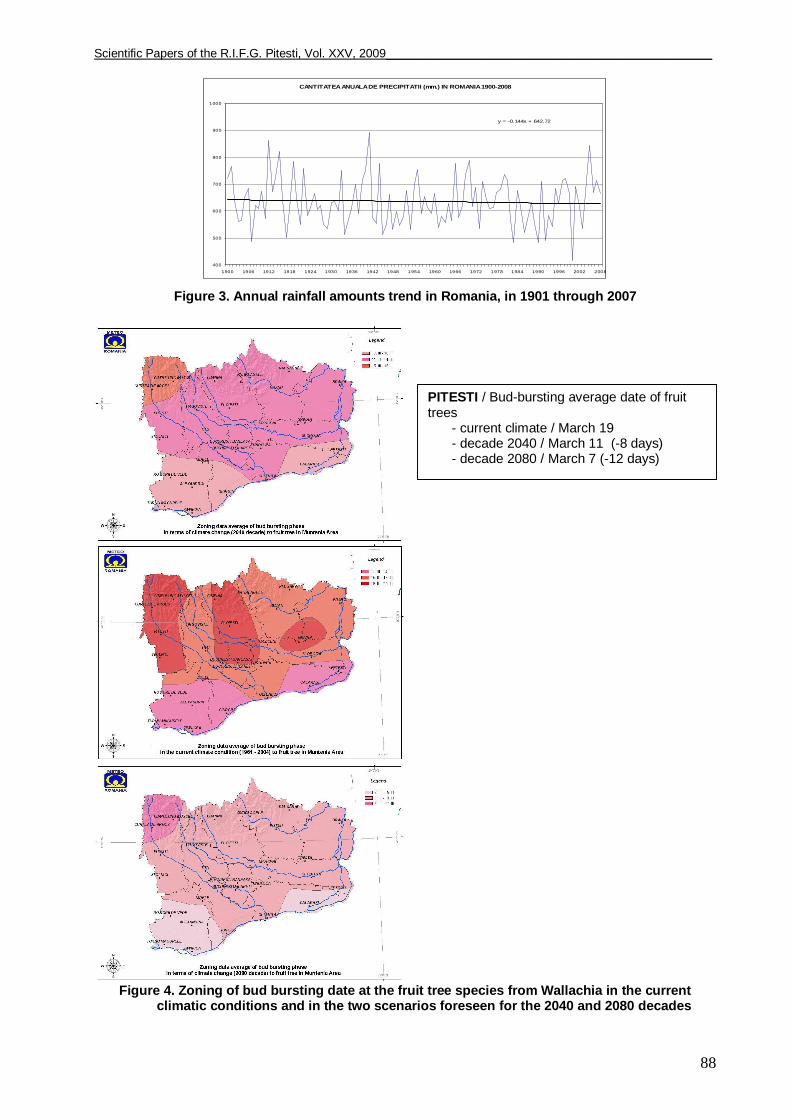
As regards precipitation, the 1901-2007 period highlighted a general decreasing trend in the annual precipitation amounts (Fig. 3) after the year 1960 and a parallel enhance of the precipitation deficit, especially in the south and south-east of the country.
According to the assessments displayed in the Fourth IPCC Report (2007), Romania expects a mean annual warming of the same magnitude as the one projected at European level against the 1980-1990 baseline, with small differences between models in the first decades of the 21st century and much greater towards the end of the century: between 0.5°C and 1.5°C for the 2020-2029 period and between 2.0°C and 5.0°C for 2090-2099, function on the scenario.
As for the extreme air temperatures (mean maxima and mean minima) for the 2070-2099 period (against 1961-1990), results outline the following:
- as regards the mean minimum winter temperature – larger increases in the intra-Carpathian area (4.0°C-6.0°C) and smaller in the remainder of the territory (3.0°C-4.0°C), this climatic signal being already in place, as ascertained by observation data over the 1961-2000 period ( a 0.8-0.9°C warming in the north-east and north-west of the country);
- In the case of the mean maximum summer temperature, a larger increase has been noticed in the south of the country (5.0°C-6.0°C) compared to the north (4.0°C-5.0°C) – a signal also already identified from observation data (e.g. for July, an increase has been identified over the 1961-2000 period in the south, centre and in southern Moldavia of 1.6-1.9°C and smaller in the remainder of the country, i.e. between 0.4°C and 1.5°C, (Busuioc et al, 2003).
From the precipitation standpoint, more than 90% of the models project for the 2090-2099 period severe summer droughts in Romania, especially in the southern and south-eastern areas, with negative deviations against the 1980-1990 baseline in excess of 20% (Christensen et al, 2007). Climate variability impact on fruit growing yield
The growth and development rhythm of the phenological phases in the fruit tree species differentiates function of the demands for heat; the intensity of the physiological processes, being directly correlated with the evolution of the thermal factor between certain thresholds specific to each genotype. In other words, the influence of the thermal factor on the succession of the growth and development phenophases prevails. The heat necessity of the fruit trees for undergoing the phenophases is determined through computing the sum of active temperature degrees, yielded by summing-up the mean daily temperatures above the biological threshold specific to each fruit tree species.
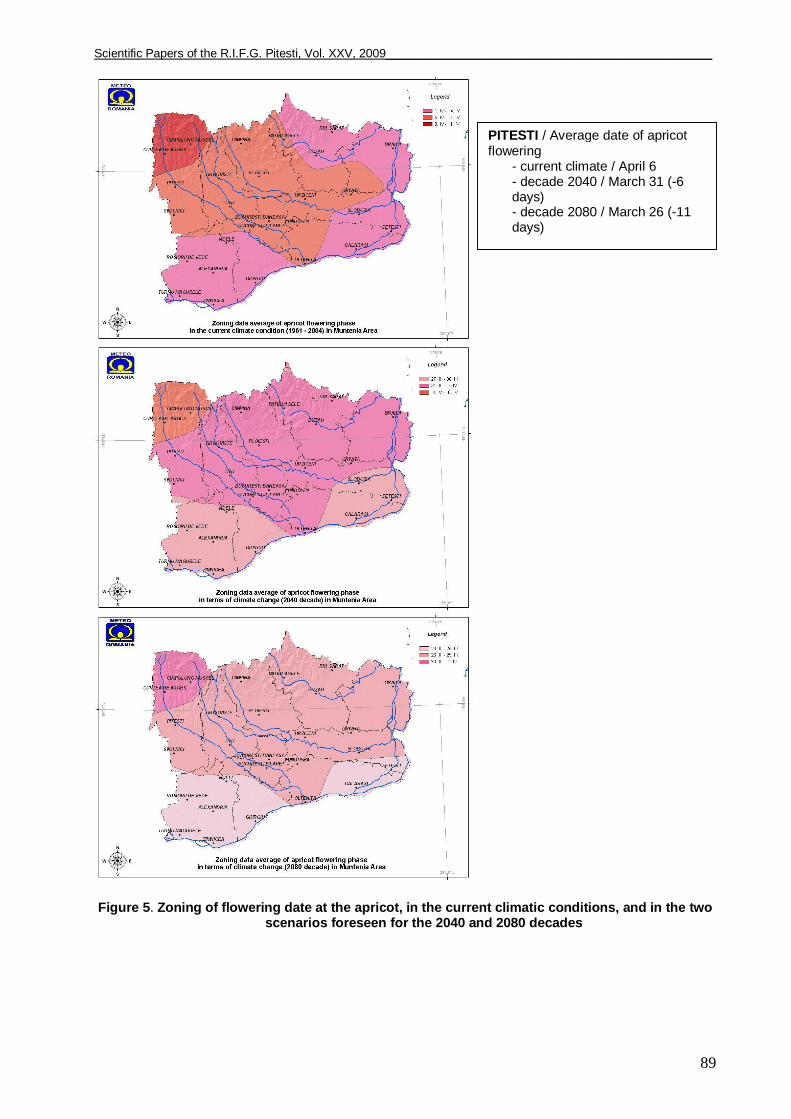
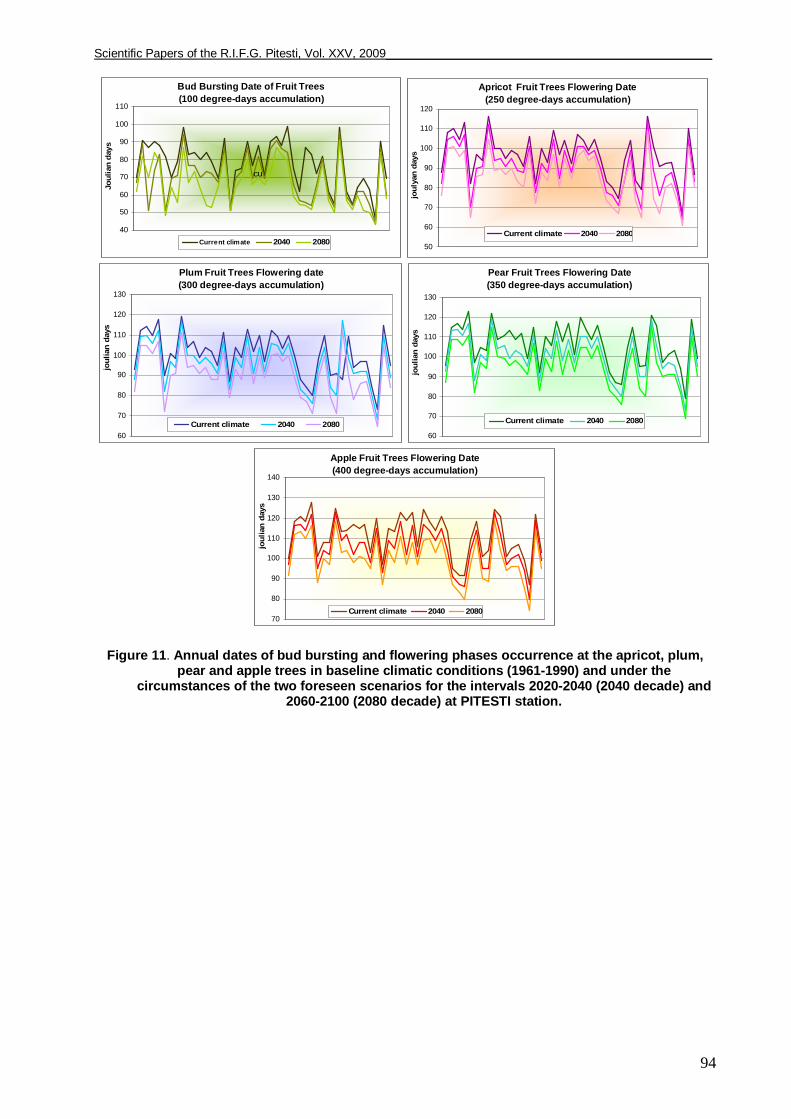
For the bud bursting phase to initiate an amount of mean positive temperatures of 100°C is necessary, expressed through heat units – values computed year by year, from 1 February until the mentioned thermal threshold is reached. In the current climatic conditions, the bud bursting phase generally occurs in the fruit tree plantations from Wallachia in the second 10-day period of March (11-20 March), the earliest date being recorded at Calarasi (11 March) and the latest (20 March) at Curtea de Arges. Under the circumstances of the possible climate change, the bud bursting will occur much earlier, as compared to the current period, i.e. by 2-8 days (between 7 and 18 March), if the temperature increases by 1°C and by 8-12 days (between 3 and 11 March) if the temperature increases by 2°C. The largest differences in the occurrence of this phase, of 10-12 days, between the current climate and the two scenarios are recorded at Pitesti, Ploiesti Grivita and Ramnicu Sarat stations (Figure 4).
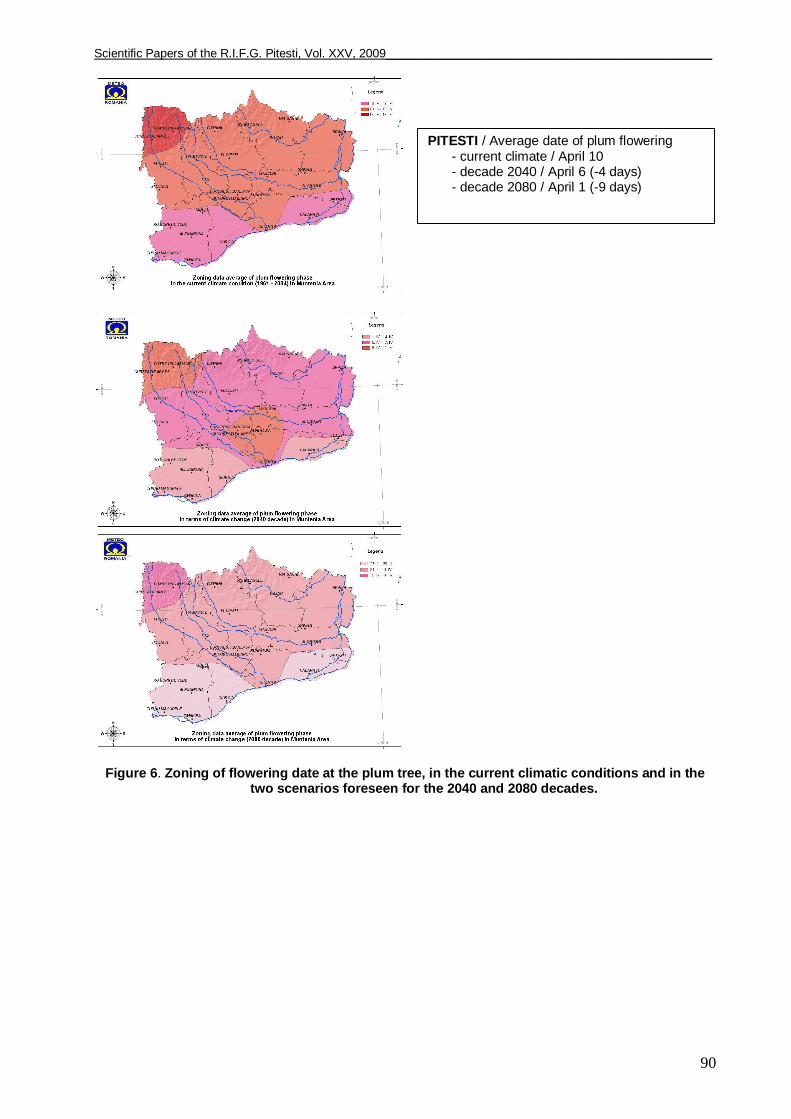
The analysis of the thermal amount of 250°C, a thermal threshold necessary for the initiation of flowering in the apricot species highlights that at the level of the 1961-2004 period the mean multiannual date of this phase generally occurs in the fist 10-day period of April, i.e. between 1 and 11 April. At an increase of the mean air temperature by 1°C (2040 scenario), flowering may occur in the 27 March- 6
Scientific Papers of the R.I.F.G. Pitesti, Vol. XXV, 2009_________________________________________________
82
April interval, whereas at an increase of the air temperature by 2°C (2080 decade), the mean date of apricot flowering will occur 8-11 days earlier in comparison with current conditions and will be recorded as early as in the 23 March-1 April interval. The widest absolute differences (10-11 days) between current and future climate, as regards the number of days by which flowering occurs earlier is noticeable in the area from northern Wallachia (Pitesti, Craiova and Curtea de Arges), Fig. 5.
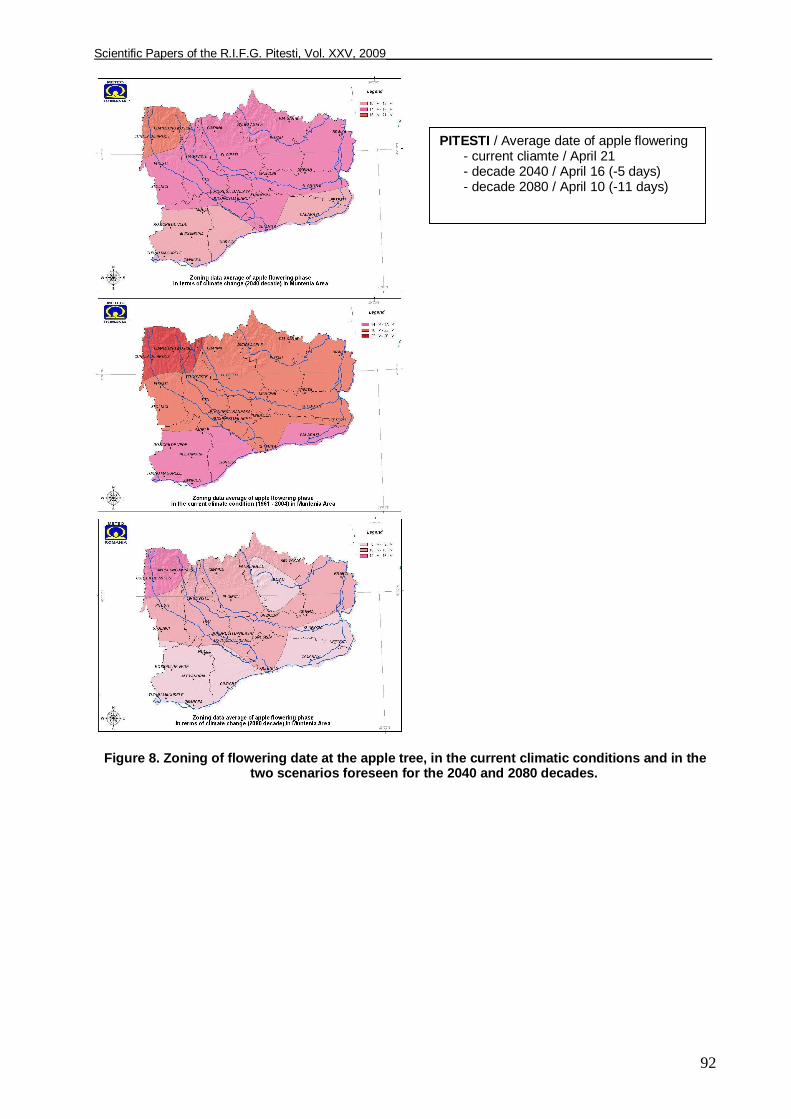
Zoning of the mean multiannual date of the flowering phase occurrence at the plum tree is rendered in Figure 6. In baseline climate conditions, the flowering phase generally occurs between 6 and 16 April, whereas in the circumstances of the foreseeable scenarios, flowering may occur much earlier as compared to the current period, i.e. in the 28 March-11 April interval, in both the 2040 ad the 2080 decade. In the fruit tree plantations from Wallachia, the occurrence date of the flowering phase at the pear tree, expressed as mean multiannual values, ranges from 10 to 21 April, the prevailing interval being 14-17 April in most part of the region. At Calarasi, the pear tree flowering in recorded on the average on 10 April, and the latest pear tree flowering date is recorded at Curtea de Arges, 21 April. Also, at Calarasi, the earliest pear tree flowering date occurred in 2002 (14 March) and the latest- in 1996 (28 April). At Curtea de Arges, the earliest such date was 3 April, in 1990, and the latest was 7 May, in 1965. Noteworthy that at Curtea de Arges (in north-western Wallachia), in 1965, 1969, 1982, 1996, 1997 and 2003, the pear tree flowering was initiated in the first 10-day period of May (between 1 and 7 May), which were the latest occurrence dates for the whole area, except for the year 1969, when the pear tree flowering was initiated at Targoviste on 2 May, and also 1996, when Grivita station recorded the accumulation of 350 heat units on 1 May (thermal threshold for pear tree flowering ΣTmean≥0°= 350 heat units starting 1 February). Under the circumstances of the two arbitrary scenarios, flowering at the plum tree species in Wallachia may occur by at least 3 to 10 days as compared to the current period over the whole of the analysed area (Fig. 7). In the current period, at Wallachia region level areas prevail where flowering at the apple tree occurs on a multiannual average in the 18-22 April intervals. The earliest flowering occurs around 14 April (Turnu Magurele) and the latest on 26 April (Curtea de Arges). The air temperature increase will determine an earlier occurrence of the apple tree flowering, by 4 to 7 days in 2040 and by 8 to 12 days in 2080, (Fig. 8). The thermal oscillations recorded during the spring season strongly influence the evolution and development rhythm of the phenological phases at all the fruit tree species undergoing vegetation. The amount of the heat units accumulated in the winter-to-spring transition period, expressed as the sum of average temperatures >0°C from the 1 February-10 April interval (ΣTmean>0°C, 1 II-10 IV) highlights the intensity of the spring coming rhythm. The lower the values of this thermal index (100-200°C), the later spring coming occurs, whereas if the value of this indicator is higher (401-500°C), spring coming occurs earlier.
In other words, in the circumstances of a thermal amount < 200°C, flowering at the fruit tree species is recorded later, which makes the harming danger from the late spring frosts smaller, compared to the years when spring coming occurs earlier (401-500°C). In the latter situation, the risk taken by the formed flowers and fruit to be affected is higher, because of the thermal hazard generated by the brisk decrease of the minimum air temperatures situated below the critical resilience biological thresholds, i.e. Tmin < -2°C. In the years with an early and very early spring coming (over 400°C) the extra-early and early varieties are the most affected, for instance the open apricot flower can perish at temperature ranging from -2.2 to -5°C and newly put forth fruit at -1...-2°C. Also, during the spring seasons with large day-to-night or day-to-day temperature oscillations, the competition between the vegetative buds and the floriferous buds can be won by the latter ones, to the detriment of the floriferous buds that may further become brown and fall.
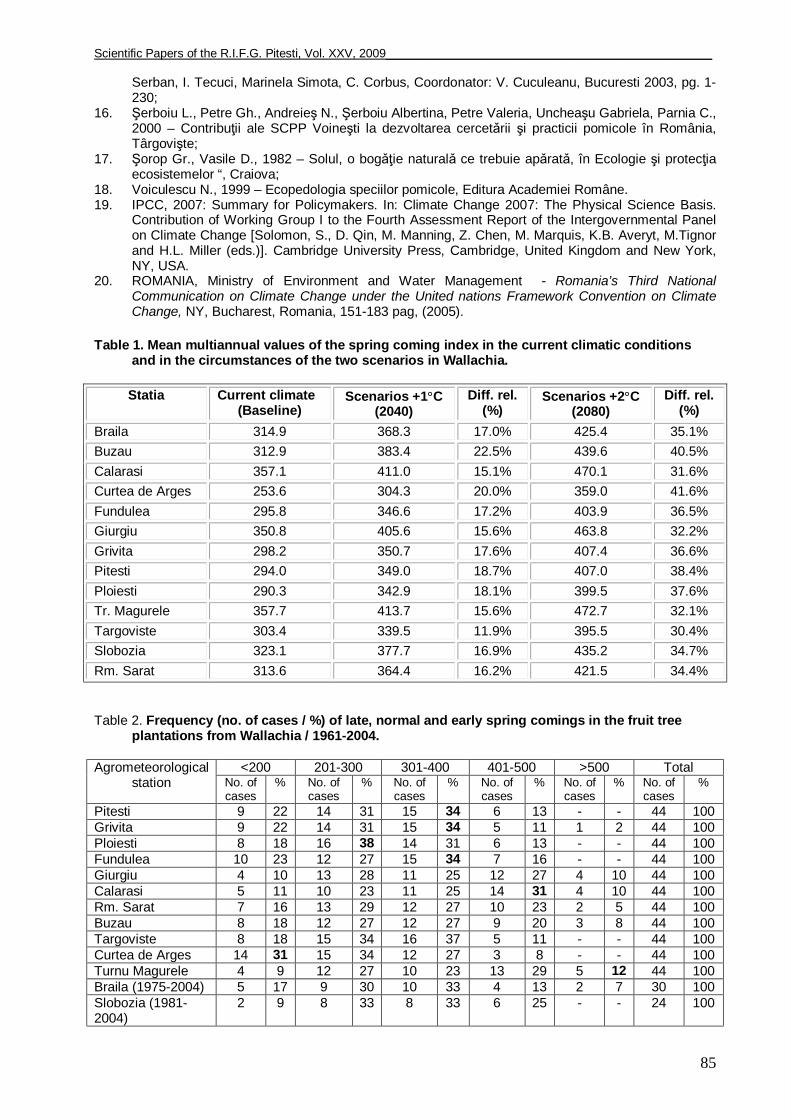
In the current climatic conditions, the mean spring coming index varies between 253.6 and 357.7 heat units, which means that spring coming is generally normal in the Wallachian area (200-400 heat units). With a 1°C air temperature rise, heat units increase from 304.3 to 413.7, i.e. by 12-23% against the current values. With a 2°C temperature increase, 359.0-472.7 heat units, 30-42% higher than the current climate (Tab. 1).
In 1969, spring coming was very late (under 200 heat units) almost over the whole of the Wallachian area, with the lowest value of the spring coming index of 84.8°C at Grivita. Reversely, spring coming occurred early in 1990 (401-500 units) in most of the plantations in Wallachia. That year, the maximum spring coming index reached 568.5 units at Turnu Magurele, against the average of 357.7 units. Under such circumstances, a phenological vegetation advance was recorded, so that flowering at the apricot, plum, pear and apple tree species was recorded in the 16 March – 7 April interval (in comparison with the normal values ranging from 1 to 26 April, i.e. apricot tree flowering between 1 and 11 April; plum tree flowering between 6 and 16 April, pear tree flowering between 10 and 21 April and apple tree flowering between 14 and 26 April) and the sudden minimum air temperature decrease in the first 10-day period of April 1990 to values of 0 ... -4°C harmed the fruit organs at the fruit tree species undergoing the maximum sensitivity phase (flowering, fecundation, fruit formation), and even totally compromised (75-100%) the fruit.
Table 2 exemplifies the frequency (%) of years when spring coming are late (under 200 units), normal (200-400 units) or early (401-500 heat units), at the 13 analysed agrometeorological stations from
Scientific Papers of the R.I.F.G. Pitesti, Vol. XXV, 2009_________________________________________________
83
Wallachia. The mean dates of late spring frosts vary in time and space. In order to establish the risk degree in the periods of maximum sensitivity of the fruit tree species, i.e. bud bursting – flowering, it is important to know the occurrence frequency of the thermal threshold where the vegetative and floriferous buds can be affected, i.e. a minimum air temperature < -2°C recorded in March and April.
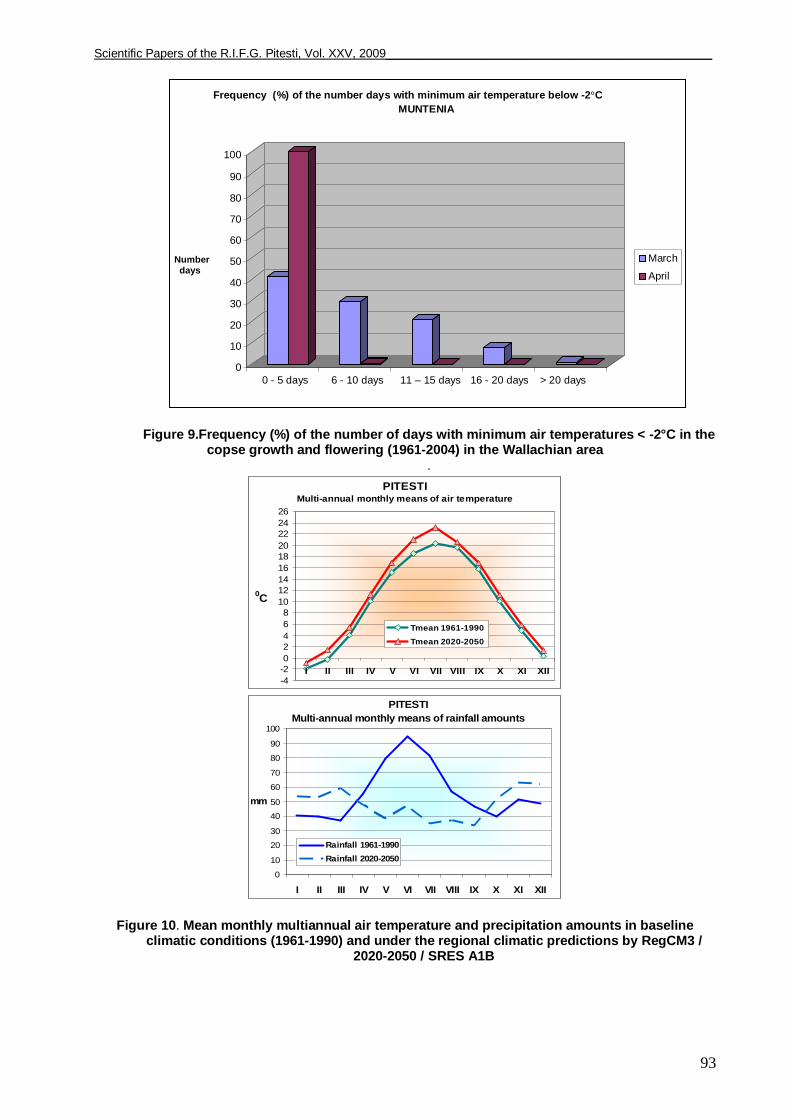
The high frequency in remarkable in Wallachia of the number of days with minimum air temperatures < -2°C in March (0-5 days/41.2%, 6-10 days/ 29.2%, 11-15 days/20.9%, 16-20 days/7.8% and over 20 days/0.8%), as compared to April (0-5 days/99.7% and 6-10 days/0.3%). However, in April the risk that the fruit tree species are affected is greater, given that at all the analysed stations there occur at least 5 days with air temperature values below the critical biological resilience threshold and that fruit trees, especially the early species, can undergo in that period exactly maximum sensitivity phases (budding, flowering), Fig. 9.
The fine resolution (10 km) regional climatic model RegCM3 (Giorgi et al., 1993) is a limited area model that has been adapted so as to improve the simulating power of the regional climate and of the regional-scale atmospheric circulation, through modifying certain physical parameterizations’, most of which in the field of the radiative transfer and the land surface physics. This model has been continuously improved through the contribution of users from a number of research centres worldwide, including Romania (Caian, 1998).
The air temperature and precipitation multiannual monthly mean, in baseline (1961-1990) climatic conditions and under the circumstances of RegCM3 regional climatic predictions for the 2020-2050 period, the SRES A1B scenario, are rendered in Figure 9.
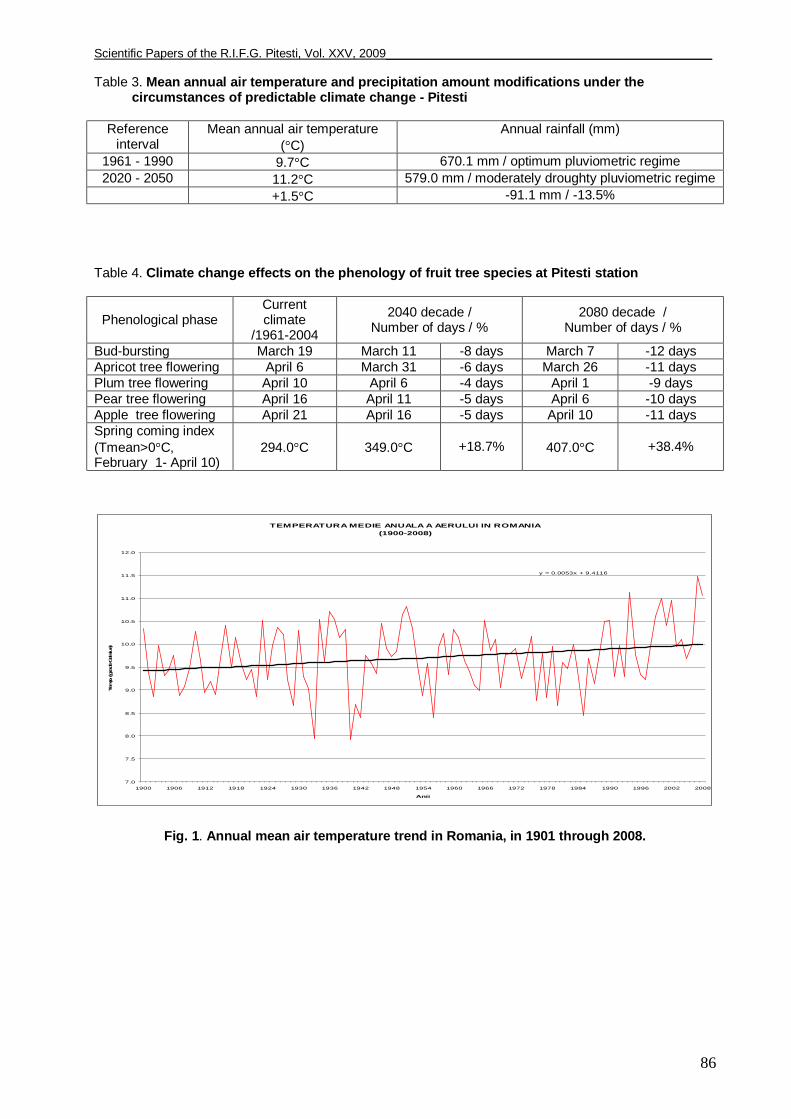
According to the climatic predictions in this scenario, the mean annual air temperature will rise by 1.5°C at Pitesti in the 2020-2050 period against the current period, the largest increases being likely in the warm period of the year, i.e. in April through August (1.1°C/April, 1.6°C/May, 2.6°C/June, 2.8°C/July and 1.0°C/August). Annual precipitation will dwindle by 91.1 mm on the average (13.5% negative deviation), the largest decreases being again estimated to occur in the warm season, namely by 7.5 mm less in April and as much as 47.4 mm less in June, compared to the current climate (Fig. 10 and Tab. 3).
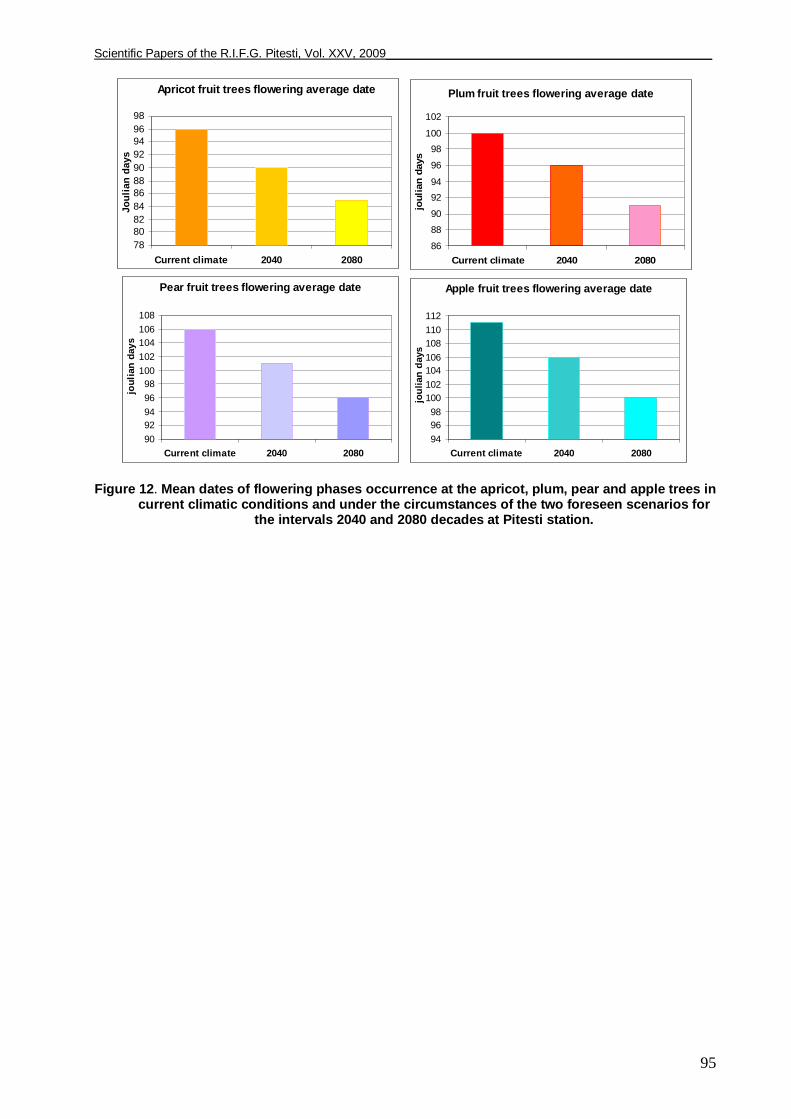
When using the arbitrary scenarios, the analysis of the mean multiannual occurrence dates of the bud bursting and flowering phases at Pitesti, at all the studied fruit tree species, highlights that those dates will occur earlier by 4-8 days on the average, in the scenario where the mean air temperature will rise by 1°C and by 9-12 days if the temperature rises by 2°C against the current climate. Also, on the background of the mean air temperature increasing trend, an increase of the amount of the heat units is estimated in the 1 February – 10 April interval against the current values by 18.7% in 2040 and by 38.4% by 2080, which points at an early or even very early spring coming, with implicit augmented risk implied by the late spring frosts (Tab. 4; Figs. 11 and 12).
4. Conclusions
1. According to the air temperature rise climatic predictions results in the acceleration of
development processes, meaning the shortening of the duration of the phenological phases and their much earlier occurrence as regards the dates, in comparison with the current climatic conditions.
2. In the current climatic conditions (1961-2004), an increasing trend was noticed in the fruit tree plantations from Wallachia, as regards the occurrence date of the bud bursting and flowering phase respectively at the apricot, plum, pear and apple species, expressed through earlier initiation dates of those phases, especially after 1980.
3. As regards the spring coming index, the trend is incremental throughout the analysed period, however more marked in southern Wallachia, which materializes in an earlier spring coming in the fruit tree plantations from the mentioned part of the region, as compared to surfaces from the north of the area.
4. In the Wallachian area, the years when spring coming occurs earlier are more frequent in the south and east of the region, implying that at Turnu Magurele, Calarasi, Giurgiu, Buzau and Ramnicu Sarat agrometeorological stations the risk that the fruit is affected by the late spring frosts is higher in comparison with the plantations from north-western Wallachia (Curtea de Arges), where the years with a late spring coming prevail.
5. According to regional climatic predictions made by RegCM3 / 2020-2050 / SRES A1B (with a 10-km resolution), the mean annual temperature will rise by 0.7°C at Pitesti, in the 2020-2050 decades against the current period, the largest increases being likely during the warm period of the year, i.e. in April through August (1.1°C/April, 1.6°C/May, 2.6°C/June, 2.8°C/July and 1.0°C/August). Annual precipitation amounts will dwindle by 91.1 mm on the average (13.5% negative deviation), the largest decreases being again estimated to occur in the warm season, namely by 7.5 mm less in April and as much as 47.4 mm less in June, compared to the current climate.
6. According to climatic predictions, the air temperature rise will result in accelerated development processes, meaning shorter and displaced phenological phases, much earlier occurring date of those phases against the current climatic conditions.
Scientific Papers of the R.I.F.G. Pitesti, Vol. XXV, 2009_________________________________________________
84
7. Analysis of the results highlight that bud bursting and flowering at all the studied fruit tree species occur earlier, by 2 to 8 days on the average, under the circumstances of the arbitrary scenario where the air temperature may display a 1°C rise and by 8-12 days if the air temperature should rise by 2°C against he current climate.
8. The climate change makes it possible for the heat units accumulated in the 1 February- 10 April period to increase in comparison with the current values by up to 12 - 23% in 2040 and by 30-40% in 2080, which points at earlier or even extra-earlier spring comings, with implicit augmented risk implied by the late spring frosts.
9. The climate change projected for the following decades will allow introducing new, earlier varieties and species, in the areas cultivated today with fruit trees, along with a northwards expansion of the favourability degree of the climatic conditions for a normal growth and development of the fruit tree species.
Monitoring the impact of climate change of the fruit tree agroecosystems is therefore based on the use of agroclimatic indices that express the associated risks, triggering the necessity to know the causes that inflict damage to the fruit tree productivity, especially during the winter and spring seasons. In this context, temperature determines morphological adaptation and the thermal demands make it compulsory to divide the fruit tree species in little demanding, average demanding and highly demanding species. In other words, each species displays a specific demand, the air temperature thus exerting a limitative action as regards the distribution of the species/sorts, in the context of specializing the fruit-tree yield in our country. References 1. Budan C., 1996 – Probleme ecologice şi de protectie a mediului în pomiculturǎ, Hortus nr.4; 2. Aristita Busuioc, V. Cuculeanu, P. Tuinea, A. Geicu, C. Simota, Adriana Marica, A. Alexandrescu,
N. Patrascanu, V.Al. Stanescu, P. Serban, I. Tecuci, Marinela Simota, C. Corbus, 2003. Impactul Potential al Schimbarii Climei in Romania, Ed. ARS DOCENDI, Academia Romana-Comitetul National pentru Modificarile Globale ale Mediului, ISBN 973-558-125-6, Bucuresti, pg 1-230;
3. Ciuhrii M.G., Voloşciuc L.T., 1994 – Ecologie şi strategia protecţiei plantelor, în “ Ecologie şi protecţia mediului”;
4. Cociu V., 1990 – Soiuri noi – factor de progres în pomiculturǎ, ed.Ceres; 5. CuculeanuV., Adriana Marica, Simota, C., 2000. Climate change impacts on agricultural crops in
Romania and adaptation options, In: Nobuo Mimura (eds.), January 2000, Proceedings of the Conference on National Assessment Results of Climate Change, held in San Jose, Costa Rica, March 25-28, 1998 (Printed by the Japan Environmental Agency and Overseas Environmental Cooperation Center), pp. 647-666;
6. Davidescu D., Velicica Davidescu, 1994 – Agricultura biologicǎ – o variantǎ pentru exploataţiile mici şi mijlocii, Ed. Ceres, Bucureşti;
7. Dejeu L., Petrescu C., Chira A., 1997 - Hortivicultura şi protecţia mediului, Ed.Didacticǎ şi pedagocicǎ, Bucureşti;
8. Lixandru Gh.,Caramete C.,Hera C., Marin N.,Borlan Z., Calancea L.,Stoian M., Rǎuţǎ C., 1999 - Agrochimie, editura didacticǎ şi pedagogicǎ, Bucureşti;
9. Measnicov M., 1987 – Pomicultura ecologicǎ (tehnologii nepoluante), Ed.Ceres, Bucureşti; 10. Mateescu Elena, Ion Poiana, I. V. Pescaru, Oprea Oana, Daniel Alexandru (2004) -
“Agrometeorological monitoring system-decision-making instrument to prevent and mitigate the agricultural drought in Romania”, Technical workshop on drought preparedness in the Balkans within the context of the UNCCD, Poiana Brasov 25-26 Octombrie 2004, CD-ROM ISBN 92-95043-06-5;
11. Mateescu Elena, Oprea Oana, Oprisescu Rodica, Amuzescu Anca (2005) - “Aspecte privind impactul variabilitatii climatului asupra agriculturii la inceputul mileniului III”, Sesiunea Anuala de Comunicari Stiintifice “Vremea, clima si dezvoltarea durabila”, A.N.M. Bucuresti, 28-30 Septembrie 2005, CD-ROM ISBN 973-0-04131-8;
12. 12.Neacşu A., Olteanu I., Olteanu E.G., 2000 – Ecologie şi protecţia juridicǎ a mediului, editura Universitaria, Craiova;
13. Negrilǎ A., 1983 – Pomicultura pe înţelesul tuturor, editura Ceres, Bucureşti; 14. Popescu M., Miliţiu I., Mihǎescu Gr., Cireaşǎ V., Godeanu I., Drobotǎ Gh., Cepoiu N., 1982 –
Pomicultura generalǎ şi specialǎ, ed.didacticǎ şi pedagogicǎ, Bucureşti; 15. Simota C., Adriana Marica, V. Cuculeanu, 2003. Impactul schimbarii climei asupra ecosistemelor
agricole; evaluarea vulnerabilitatii si a masurilor de adaptare, Ed. ARS DOCENDI, Academia Romana-Comitetul National pentru Modificarile Globale ale Mediului, ISBN 973-558-125-6, pg 37-99; In “Impactul Potential al Schimbarii Climei in Romania”, Aristita Busuioc, V. Cuculeanu, P. Tuinea, A. Geicu, C. Simota, Adriana Marica, A. Alexandrescu, N. Patrascanu, V.Al. Stanescu, P.
Scientific Papers of the R.I.F.G. Pitesti, Vol. XXV, 2009_________________________________________________
85
Serban, I. Tecuci, Marinela Simota, C. Corbus, Coordonator: V. Cuculeanu, Bucuresti 2003, pg. 1-230;
16. Şerboiu L., Petre Gh., Andreieş N., Şerboiu Albertina, Petre Valeria, Uncheaşu Gabriela, Parnia C., 2000 – Contribuţii ale SCPP Voineşti la dezvoltarea cercetǎrii şi practicii pomicole în România, Târgovişte;
17. Şorop Gr., Vasile D., 1982 – Solul, o bogǎţie naturalǎ ce trebuie apǎratǎ, în Ecologie şi protecţia ecosistemelor “, Craiova;
18. Voiculescu N., 1999 – Ecopedologia speciilor pomicole, Editura Academiei Române. 19. IPCC, 2007: Summary for Policymakers. In: Climate Change 2007: The Physical Science Basis.
Contribution of Working Group I to the Fourth Assessment Report of the Intergovernmental Panel on Climate Change [Solomon, S., D. Qin, M. Manning, Z. Chen, M. Marquis, K.B. Averyt, M.Tignor and H.L. Miller (eds.)]. Cambridge University Press, Cambridge, United Kingdom and New York, NY, USA.
20. ROMANIA, Ministry of Environment and Water Management - Romania’s Third National Communication on Climate Change under the United nations Framework Convention on Climate Change, NY, Bucharest, Romania, 151-183 pag, (2005).
Table 1. Mean multiannual values of the spring coming index in the current climatic conditions
and in the circumstances of the two scenarios in Wallachia.
Statia
Current climate (Baseline)
Scenarios +1°C (2040)
Diff. rel. (%)
Scenarios +2°C (2080)
Diff. rel. (%)
Braila 314.9 368.3 17.0% 425.4 35.1% Buzau 312.9 383.4 22.5% 439.6 40.5% Calarasi 357.1 411.0 15.1% 470.1 31.6% Curtea de Arges 253.6 304.3 20.0% 359.0 41.6% Fundulea 295.8 346.6 17.2% 403.9 36.5% Giurgiu 350.8 405.6 15.6% 463.8 32.2% Grivita 298.2 350.7 17.6% 407.4 36.6% Pitesti 294.0 349.0 18.7% 407.0 38.4% Ploiesti 290.3 342.9 18.1% 399.5 37.6% Tr. Magurele 357.7 413.7 15.6% 472.7 32.1% Targoviste 303.4 339.5 11.9% 395.5 30.4% Slobozia 323.1 377.7 16.9% 435.2 34.7% Rm. Sarat 313.6 364.4 16.2% 421.5 34.4%
Table 2. Frequency (no. of cases / %) of late, normal and early spring comings in the fruit tree plantations from Wallachia / 1961-2004.
<200 201-300 301-400 401-500 >500 Total Agrometeorological
station No. of cases
% No. of cases
% No. of cases
% No. of cases
% No. of cases
% No. of cases
%
Pitesti 9 22 14 31 15 34 6 13 - - 44 100 Grivita 9 22 14 31 15 34 5 11 1 2 44 100 Ploiesti 8 18 16 38 14 31 6 13 - - 44 100 Fundulea 10 23 12 27 15 34 7 16 - - 44 100 Giurgiu 4 10 13 28 11 25 12 27 4 10 44 100 Calarasi 5 11 10 23 11 25 14 31 4 10 44 100 Rm. Sarat 7 16 13 29 12 27 10 23 2 5 44 100 Buzau 8 18 12 27 12 27 9 20 3 8 44 100 Targoviste 8 18 15 34 16 37 5 11 - - 44 100 Curtea de Arges 14 31 15 34 12 27 3 8 - - 44 100 Turnu Magurele 4 9 12 27 10 23 13 29 5 12 44 100 Braila (1975-2004) 5 17 9 30 10 33 4 13 2 7 30 100 Slobozia (1981-2004)
2 9 8 33 8 33 6 25 - - 24 100
Scientific Papers of the R.I.F.G. Pitesti, Vol. XXV, 2009_________________________________________________
86
Table 3. Mean annual air temperature and precipitation amount modifications under the circumstances of predictable climate change - Pitesti
Reference
interval Mean annual air temperature
(°C) Annual rainfall (mm)
1961 - 1990 9.7°C 670.1 mm / optimum pluviometric regime 2020 - 2050 11.2°C 579.0 mm / moderately droughty pluviometric regime
+1.5°C -91.1 mm / -13.5% Table 4. Climate change effects on the phenology of fruit tree species at Pitesti station
Phenological phase Current climate
/1961-2004
2040 decade / Number of days / %
2080 decade / Number of days / %
Bud-bursting March 19 March 11 -8 days March 7 -12 days Apricot tree flowering April 6 March 31 -6 days March 26 -11 days Plum tree flowering April 10 April 6 -4 days April 1 -9 days Pear tree flowering April 16 April 11 -5 days April 6 -10 days Apple tree flowering April 21 April 16 -5 days April 10 -11 days Spring coming index (Tmean>0°C, February 1- April 10)
294.0°C 349.0°C +18.7% 407.0°C +38.4%
Fig. 1. Annual mean air temperature trend in Romania, in 1901 through 2008.
TEMPERATURA MEDIE ANUALA A AERULUI IN ROMANIA (1900-2008)
y = 0.0053x + 9.4116
7.0
7.5
8.0
8.5
9.0
9.5
10.0
10.5
11.0
11.5
12.0
1900 1906 1912 1918 1924 1930 1936 1942 1948 1954 1960 1966 1972 1978 1984 1990 1996 2002 2008
Anii
Temp. (g
rade
Celsius
)
Scientific Papers of the R.I.F.G. Pitesti, Vol. XXV, 2009_________________________________________________
87
-4.5
-4
-3.5
-3
-2.5
-2
-1.5
-1
-0.5
0
0C
1961-1990
1961-1970
1971-1980
1981-1990
1991-2000
2001-2008
JANUARY
1961-19901961-19701971-19801981-19901991-20002001-2008
0
1
2
3
4
5
6
0C
1961-1990
1961-1970
1971-1980
1981-1990
1991-2000
2001-2008
MARCH
1961-19901961-19701971-19801981-19901991-20002001-2008
19
19.5
20
20.5
21
21.5
22
22.5
0C
1961-1990
1961-1970
1971-1980
1981-1990
1991-2000
2001-2008
JULY
1961-19901961-19701971-19801981-19901991-20002001-2008
18
18.5
19
19.5
20
20.5
21
21.5
22
0C
1961-1990
1961-1970
1971-1980
1981-1990
1991-2000
2001-2008
AUGUST
1961-19901961-19701971-19801981-19901991-20002001-2008
Figure 2. Decadal evolution of the mean annual air temperature recorded in Romania in 1961
through 2008, against the 1961-1990 baseline.
Scientific Papers of the R.I.F.G. Pitesti, Vol. XXV, 2009_________________________________________________
88
Figure 3. Annual rainfall amounts trend in Romania, in 1901 through 2007
Figure 4. Zoning of bud bursting date at the fruit tree species from Wallachia in the current
climatic conditions and in the two scenarios foreseen for the 2040 and 2080 decades
CANTITATEA ANUALA DE PRECIPITATII (mm.) IN ROMANIA 1900-2008
y = -0.144x + 642.72
400
500
600
700
800
900
1000
1900 1906 1912 1918 1924 1930 1936 1942 1948 1954 1960 1966 1972 1978 1984 1990 1996 2002 2008
PITESTI / Bud-bursting average date of fruit trees
- current climate / March 19 - decade 2040 / March 11 (-8 days) - decade 2080 / March 7 (-12 days)
Scientific Papers of the R.I.F.G. Pitesti, Vol. XXV, 2009_________________________________________________
89
Figure 5. Zoning of flowering date at the apricot, in the current climatic conditions, and in the two scenarios foreseen for the 2040 and 2080 decades
PITESTI / Average date of apricot flowering
- current climate / April 6 - decade 2040 / March 31 (-6 days) - decade 2080 / March 26 (-11 days)
Scientific Papers of the R.I.F.G. Pitesti, Vol. XXV, 2009_________________________________________________
90
Figure 6. Zoning of flowering date at the plum tree, in the current climatic conditions and in the two scenarios foreseen for the 2040 and 2080 decades.
PITESTI / Average date of plum flowering - current climate / April 10 - decade 2040 / April 6 (-4 days) - decade 2080 / April 1 (-9 days)

Scientific Papers of the R.I.F.G. Pitesti, Vol. XXV, 2009_________________________________________________
91
Figure 7. Zoning of flowering date at the pear tree, in the current climatic conditions and in the two scenarios foreseen for the 2040 and 2080 decades.
PITESTI / Average date of pear flowering - current climate / April 16 - decade 2040 / April 11 (-5 days) - decade 2080 / April 6 (-10 days)
Scientific Papers of the R.I.F.G. Pitesti, Vol. XXV, 2009_________________________________________________
92
Figure 8. Zoning of flowering date at the apple tree, in the current climatic conditions and in the two scenarios foreseen for the 2040 and 2080 decades.
PITESTI / Average date of apple flowering - current cliamte / April 21 - decade 2040 / April 16 (-5 days) - decade 2080 / April 10 (-11 days)
Scientific Papers of the R.I.F.G. Pitesti, Vol. XXV, 2009_________________________________________________
93
Figure 9.Frequency (%) of the number of days with minimum air temperatures < -2°C in the copse growth and flowering (1961-2004) in the Wallachian area
. PITESTI
Multi-annual monthly means of air temperature
-4-202468
101214161820222426
I II III IV V VI VII VIII IX X XI XII
0C
Tmean 1961-1990 Tmean 2020-2050
PITESTI
Multi-annual monthly means of rainfall amounts
0
10
20
30
40
50
60
70
80
90
100
I II III IV V VI VII VIII IX X XI XII
mm
Rainfall 1961-1990Rainfall 2020-2050
Figure 10. Mean monthly multiannual air temperature and precipitation amounts in baseline climatic conditions (1961-1990) and under the regional climatic predictions by RegCM3 /
2020-2050 / SRES A1B
0 10 20 30 40 50 60 70 80 90
100
Number days
0 - 5 days 6 - 10 days 11 – 15 days 16 - 20 days > 20 days
Frequency (%) of the number days with minimum air temperature below -2°C MUNTENIA
March April
Scientific Papers of the R.I.F.G. Pitesti, Vol. XXV, 2009_________________________________________________
94
Bud Bursting Date of Fruit Trees(100 degree-days accumulation)
40
50
60
70
80
90
100
110Jo
ulia
n da
ys
Current climate 2040 2080
cu
Apricot Fruit Trees Flowering Date(250 degree-days accumulation)
50
60
70
80
90
100
110
120
joul
yan
days
Current climate 2040 2080
Plum Fruit Trees Flowering date (300 degree-days accumulation)
60
70
80
90
100
110
120
130
joul
ian
days
Current climate 2040 2080
Pear Fruit Trees Flowering Date (350 degree-days accumulation)
60
70
80
90
100
110
120
130
joul
ian
days
Current climate 2040 2080
Apple Fruit Trees Flowering Date (400 degree-days accumulation)
70
80
90
100
110
120
130
140
joul
ian
days
Current climate 2040 2080
Figure 11. Annual dates of bud bursting and flowering phases occurrence at the apricot, plum, pear and apple trees in baseline climatic conditions (1961-1990) and under the
circumstances of the two foreseen scenarios for the intervals 2020-2040 (2040 decade) and 2060-2100 (2080 decade) at PITESTI station.
Scientific Papers of the R.I.F.G. Pitesti, Vol. XXV, 2009_________________________________________________
95
Apricot fruit trees flowering average date
7880828486889092949698
Current climate 2040 2080
Joul
ian
days
Plum fruit trees flowering average date
86
88
90
9294
96
98100
102
Current climate 2040 2080
joul
ian
days
Pear fruit trees flowering average date
9092949698
100102104106108
Current climate 2040 2080
joul
ian
days
Apple fruit trees flowering average date
949698
100102104106108110112
Current climate 2040 2080
joul
ian
days
Figure 12. Mean dates of flowering phases occurrence at the apricot, plum, pear and apple trees in current climatic conditions and under the circumstances of the two foreseen scenarios for
the intervals 2040 and 2080 decades at Pitesti station.