v umul xxviiiol - cide.ro xxviii.pdfinstitutul naŢional de cercetĂri economice “costin c....
TRANSCRIPT
INSTITUTUL NAŢIONAL DE CERCETĂRI ECONOMICE“COSTIN C. KIRIŢESCU”
V umul XXVIIIol
CENTRUL DE INFORMARE ŞI DOCUMENTARE ECONOMICĂ
A Rcademia omână
INSTITUTUL NAŢIONAL DE CERCETĂRI ECONOMICE “COSTIN C. KIRIŢESCU”
TEZAUR 1993
vol. XXVIII
Centrul de Informare
şi Documentare Economică
Bucureşti, România
Editor: Valeriu IOAN-FRANC Redactori: Adelina BIGICĂ, Haritina BUŞTIUC, Ortansa CIUTACU,
Mircea FÂŢĂ, Dorina GHEORGHE, Paula NEACŞU, Mihaela PINTICĂ, Aida SARCHIZIAN, Ovidiu SÎRBU Culegere text: Mirela AGAPI, Carmen DIŢULESCU
Prezentare grafică, machetare şi tehnoredactare: Luminiţa LOGIN, Nicolae LOGIN, Mihaela PINTICĂ, Victor PREDA
Toate drepturile asupra acestei ediţii aparţin Institutului Naţional de Cercetări Economice
“Costin C. Kiriţescu”. Reproducerea, fie şi parţială şi pe orice suport, este interzisă fără acordul prealabil al editorului, fiind supusă prevederilor legii drepturilor de autor.
ISBN 978-973-159-160-5 Apărut 2014
INSTITUTUL NAŢIONAL DE CERCETĂRI ECONOMICE “COSTIN C. KIRIŢESCU”
TEZAUR 1993
vol. XXVIII
ACADEMIA ROMÂNĂ
CENTRUL DE INFORMARE ŞI DOCUMENTARE ECONOMICĂ

SUMAR volumul XXVIII
ECONOMIA ROMÂNIEI – EVOLUŢII PE TERMEN SCURT _________________ 1
EVALUĂRI PRIVIND COŞUL ŞI BUGETUL DE CONSUM
Cuvânt înainte ........................................................................................................... 9
Partea I
ASPECTE METODOLOGICE ŞI EVALUĂRI
1. Precizări conceptual-metodologice ..................................................................... 13
2. Coşul şi bugetul alimentar................................................................................... 16
3. Produse nealimentare ......................................................................................... 22
4. Servicii................................................................................................................. 26
5. Bugetul total de consum...................................................................................... 28
Partea a II-a
COMPONENŢA ŞI VALOAREA COŞULUI DE CONSUM ..................................... 33
1. Componenţa şi valoarea coşului de consum pentru o familie de salariaţi compusă din patru persoane ............................................................................. 35
1.1. Produse alimentare ..................................................................... 35 1.2. Produse nealimentare ................................................................. 37 1.3. Servicii ......................................................................................... 41
2. Componenţa şi valoarea coşului de consum pentru o familie de pensionari compusă din două persoane........................................................... 44
2.1. Produse alimentare ..................................................................... 44 2.2. Produse nealimentare ................................................................. 46 2.3. Servicii ......................................................................................... 50
ANEXE SALARIAŢI................................................................................................. 52 ANEXA nr. 1. PRODUSE ALIMENTARE ........................................... 52 ANEXA NR. 2. PRODUSE NEALIMENTARE .................................... 60 ANEXA NR. 3. SERVICII.................................................................... 76 ANEXE PENSIONARI ........................................................................ 82 ANEXA NR. 4. PRODUSE ALIMENTARE ......................................... 82
VI
ANEXA NR. 5. PRODUSE NEALIMENTARE .................................... 90 ANEXA NR. 6. SERVICII.................................................................. 101
BUSINESS IN ROMANIA - BETWEEN CHALLENGES AND NEW OPPORTUNITIES
BUSINESS IN ROMANIA - BETWEEN CHALLENGES AND NEW OPPORTUNITIES............................................................................... 107
ROMANIA - TRANSITION FROM WHERE - TO WHAT
ROMANIA - TRANSITION FROM WHERE - TO WHAT ...................................... 115
AGRICULTURE AND FOOD INDUSTRY PRESENT
AGRICULTURE AND FOOD INDUSTRY PRESENT - STATUS OF DEVELOPMENT, OBJECTIVES, DIRECTIONS AND MEANS OF ACTION FOR CONTINUING THE REFORMS IN THE AGRICULTURAL AND FOOD SECTOR ................................................. 123
Introductory Chapter ............................................................................................. 127
FIRST PART
AGRICULTURE AND FOOD INDUSTRY DEVELOPMENT DURING THE PERIOD 1989-1992
1. Ownership and farms restructuring process development .............................. 131 1.1. Ownership breakdown in agriculture in the late 80's............................... 131 1.2. Set up of private ownership and of family peasant household................ 134
1.2.1. The set up of land private ownership............................................. 134 1.2.2. Setup of the production means private ownership......................... 136
1.3. Privatization of agricultural state sector................................................... 137 1.4. Privatization of food industry ................................................................... 140
2. Evolution of agricultural output during 1989-1992 ........................................... 141
3. The agricultural foreign trade between 1989-1992 .......................................... 148
4. The process of setting up and acting in a market economy ............................ 150
SECOND PART
CONTINUATION OF REFORM, TARGETS, TRENDS AND MEANS OF ACTION
1. Targets .............................................................................................................. 155 1.1. Predictable trends in the evolution of the main agricultural products
between 1993-1996 ................................................................................. 155
VII
1.2. The evolution of the industrial food production in 1993-1996 ................. 162 1.3. The increase of the efficiency of the food industry sector according
to the association to the European Community and cooperation at regional and world level ........................................................................... 163
2. Ways and means of action................................................................................ 165 2.1. Privatization in agriculture and in the food industry................................. 165 2.1.1. Establishing and consolidating the peasant trading household
based on family work ............................................................................... 165 2.1.2. Privatization of state-owned commercial companies in
agriculture and restructuring of their activity .................................. 167 2.1.3. Privatization of the research activity and of the extension
activities.......................................................................................... 168 2.1.4. Organization and functioning of the services for agriculture.......... 168 2.1.5. Food industry privatization ............................................................. 171
2.2. Agriculture integration into market economy mechanisms. Agromarkets and market economy institutional system consolidation ... 171 2.2.1. Market economy institutional system consolidation....................... 172
2.3. Agro-markets organization and functioning............................................. 176 2.3.1. Production factors market .............................................................. 176 2.3.2. Land market ................................................................................... 176 2.3.3. Tractors and agricultural machines market.................................... 178 2.3.4. Fertilizers and other chemical market............................................ 178 2.3.5. Labour market ................................................................................ 179 2.3.6. Services market ............................................................................. 179 2.3.7. Agricultural produces market ......................................................... 180
2.4. Research and farmers training ................................................................ 181 2.5. The partnership for agriculture development........................................... 182
2.5.1. Institution of partnership................................................................. 182 2.5.2. Objectives and partnership programs for rural and agriculture
development................................................................................... 183 2.5.3. The partner's types and relations................................................... 185
2.6. Farmers social protection ........................................................................ 185 2.7. The establishment and improvement of juridical framework ................... 187
LA TRANSITION ET LA MODELISATION MACROECONOMIQUE
LA TRANSITION ET LA MODELISATION MACROECONOMIQUE.................... 191
INDEX DE AUTORI............................................................................................... 203

INSTITUTUL NAŢIONAL
DE CERCETĂRI ECONOMICE
ALTE LUCRĂRI ALE INSTITUTELOR
CENTRUL DE INFORMARE ŞI DOCUMENTARE ECONOMICĂ
BUCUREŞTI

ACADEMIA ROMANA INSTITUTUL NAŢIONAL DE CERCETĂRI ECONOMICE
INSTITUTUL DE ECONOMIE NAŢIONALĂ
ECONOMIA ROMÂNIEI - EVOLUŢII PE TERMEN SCURT -
Anul II, vol. 2, Nr. 1-2/12993
CENTRUL DE INFORMARE ŞI DOCUMENTARE ECONOMICĂ Bucureşti, 1993

ACADEMIA ROMANA INSTITUTUL NAŢIONAL DE CERCETĂRI ECONOMICE
INSTITUTUL DE ECONOMIE NAŢIONALĂ
EVALUĂRI PRIVIND COŞUL ŞI BUGETUL DE CONSUM
Dr. Constantin GRIGORESCU (coordonator),
Maria MOLNAR, Maria POENARU,
Georgeta DUMITRESCU
Bucureşti, 1993

SUMAR
Cuvânt înainte ........................................................................................................... 9
Partea I
ASPECTE METODOLOGICE ŞI EVALUĂRI
1. Precizări conceptual-metodologice ..................................................................... 13
2. Coşul şi bugetul alimentar................................................................................... 16
3. Produse nealimentare ......................................................................................... 22
4. Servicii................................................................................................................. 26
5. Bugetul total de consum...................................................................................... 28
Partea a II-a
COMPONENŢA ŞI VALOAREA COŞULUI DE CONSUM ..................................... 33
1. Componenţa şi valoarea coşului de consum pentru o familie de salariaţi compusă din patru persoane ............................................................................. 35
1.1. Produse alimentare ..................................................................... 35 1.2. Produse nealimentare ................................................................. 37 1.3. Servicii ......................................................................................... 41
2. Componenţa şi valoarea coşului de consum pentru o familie de pensionari compusă din două persoane........................................................... 44
2.1. Produse alimentare ..................................................................... 44 2.2. Produse nealimentare ................................................................. 46 2.3. Servicii ......................................................................................... 50
ANEXE SALARIAŢI................................................................................................. 52 ANEXA nr. 1. PRODUSE ALIMENTARE ........................................... 52 ANEXA NR. 2. PRODUSE NEALIMENTARE .................................... 60 ANEXA NR. 3. SERVICII.................................................................... 76 ANEXE PENSIONARI ........................................................................ 82 ANEXA NR. 4. PRODUSE ALIMENTARE ......................................... 82 ANEXA NR. 5. PRODUSE NEALIMENTARE .................................... 90 ANEXA NR. 6. SERVICII.................................................................. 101

Cuvânt înainte
Tranziţia la economia de piaţă s-a dovedit un proces complex, care a produs schimbări rapide şi de amploare în condiţiile de viaţă ale populaţiei Pe de o parte, declinul producţiei şi inflaţia deosebit de puternică au determinat scăderea de mari proporţii a veniturilor reale ale majorităţii populaţiei şi degra-darea consumului acesteia. Pe de altă parte, se pot consemna frecvente mă-suri de contracarare îndeosebi a efectelor inflaţiei, concretizate în indexarea şi compensarea veniturilor băneşti
Aceste evoluţii s-au înregistrat pe fondul unor mişcări masive, bulversan-te ale preţurilor, respectiv ale parametrilor valorici ai nivelului de trai, care fac dificile aprecierile corecte asupra dimensiunii şi gravităţii fenomenelor din acest domeniu. Dificultatea evaluărilor este potenţată de insuficienţa instrumentelor de măsurare şi analiză.
Un astfel de instrument, invocat adesea în contextul negocierilor privind salariile, compensările-indexările, este coşul de consum. Prin Protocolul înche-iat cu ocazia negocierilor guvern-sindicate din aprilie-mai 1993, prilejuite de ultima etapă de eliminare a subvenţiilor şi indexare-compensare a salariilor şi altor venituri băneşti, a fost solicitată Institutului de Economie Naţională elabo-rarea unui studiu privind coşul şi bugetul de consum necesare unui trai decent, normal pentru standardul actual de civilizaţie din ţara noastră, urmând ca acest buget să fie comparat cu bugetul de familie efectiv înregistrat statistic.
Lucrarea cuprinde un coş de consum, reprezentând cantităţi de bunuri şi servicii necesare, coş pe care îi considerăm valabil pentru o perioadă limitată, de 2-3 ani Evaluările bugetului de consum, efectuate pe baza preţurilor medii ale anului 1992 permit comparaţia cu bugetele de familie înregistrate în anul î 992 de către Comisia Naţională pentru Statistică şi relevarea, pe această bază, a unor distorsiuni în ceea ce priveşte nivelul consumului fizic şi structura chel-tuielilor de consum. Bugetul de consum a fost evaluat şi în preţurile lunilor mar-tie şi mai 1993 şi poate fi recalculat periodic, pe măsură ce datele privind preţu-rile efective devin disponibile. Rezultatele, respectiv valoarea consumului şi cheltuielile de consum necesare, exprimate în preţurile înregistrate în cursul unei luni sunt utile pentru aprecieri privind veniturile efectiv realizate de popula-ţie (salariul mediu, pensia medie etc.) comparativ cu cele necesare.
Una din utilizările potenţiale, de mare importanţă practică, ale coşului de consum este în calculul indicilor preţurilor de consum. Coşul de consum propus ar putea fi utilizat pentru calculul indicilor de preţ al coeficienţilor de indexare sau al sumelor destinate compensării dacă veniturile medii (salarii, pensii) ar asigura acoperirea cheltuielilor la nivelul estimat în bugetul de consum în con-diţiile actuale, însă? în care atât nivelul mediu al consumul fizic, cât şi nivelul efectiv al cheltuielilor medii de consum ale familiilor se situează semnificativ
10
sub nivelurile cuprinse în coşul şi bugetul de consum estimat (în principal dato-rită faptului că veniturile medii nu asigură acoperirea cheltuielilor necesare), compensaţiile calculate pe baza acestui coş ar cuprinde şi sume aferente dife-renţelor de preţ pentru cantităţi de produse care nu. intră efectiv în consum. Utilizarea acestui coş în calcule privind indicii preţurilor nu ar conduce la rezul-tate mai bune sau mult mai bune (din punctul de vedere al rigurozităţii reflectă-rii mişcării ansamblului preţurilor) decât cele obţinute prin metoda utilizată în practica statistică actuală; metodă la rândul ei perfectabilă din multe puncte de vedere.
O altă utilizare potenţială a coşului de consum este analiza comparativă în profil regional a puterii de cumpărare a veniturilor şi fundamentarea unor măsuri orientate spre diferenţierea veniturilor. Evaluarea coşului de consum în preţurile înregistrate în fiecare din judeţele cuprinse în comparaţie şi calculul raportului dintre valorile astfel obţinute permit estimarea diferenţelor în ceea ce priveşte costul vieţii în profil judeţean. O analiză similară se poate efectua pen-tru a compara costul vieţii între oraşele mari, între oraşele mari şi cele mici etc.
Institutul de Economie Naţională intenţionează menţinerea preocupărilor pe această temă în problematica sa de cercetare, prin actualizarea ei periodică şi utilizarea rezultatelor obţinute în fundamentarea unor lucrări pe teme conexe.
Suntem deschişi oricăror observaţii şi sugestii de îmbunătăţire a studiului În elaborarea acestei lucrări am beneficiat de sprijinul direcţiilor de spe-
cialitate din Comisia Naţională pentru Statistică, precum şi al Institutului de Igi-enă şi Sănătate Publică, care ne-au pus la dispoziţie datele şi informaţiile ne-cesare şi cărora le exprimăm şi pe această cale gratitudinea noastră.
Mulţumim, totodată, domnului academician prof. dr. Constantin IONETE, Directorul General al Institutului Naţional de Cercetări Economice, domnului dr. Gheorghe ZAMAN, Directorul Institutului de Economie Naţională şi domnului Grigore VÂLCEANU, şeful sectorului de Nivel de trai şi politică socială din Insti-tutul de Economie Naţională, pentru concursul dat în elaborarea lucrării.
AUTORII
Partea I
ASPECTE METODOLOGICE ŞI EVALUĂRI

1. Precizări conceptual-metodologice
Coşul de consum reprezintă ansamblul bunurilor şi serviciilor reprezenta-tive pentru consumul populaţiei, în expresie cantitativă. Bugetul de consum este în principal, reflectarea valorică a coşului; ei cuprinde şi componente ale consumului care nu sunt precizate în coşul de consum, Coşul şi bugetul de consum se determină în coordonate date de timp şi spaţiu. Pentru un anumit spaţiu (ţară) parametrii coşului de consum sunt relativ constanţi, în timp, pe un interval (măsurat în ani), a cărui lungime este determinată de nivelul de dezvol-tare, de viteza, amploarea şi conţinutul modificărilor în nivelul de trai. În schimb, mărimea şi structura bugetului de "consum se modifică în timp odată cu evoluţia preţurilor.
În sens larg, noţiunile de coş şi buget de consum pot fi asociate fiecărei familii, în parte. În sensul obişnuit, utilizat în practica măsurării şi analizei nive-lului de trai, este vorba de coş şi buget de consum pentru familii standard. Ele pot fi alcătuite pentru un tip de familie reprezentativă pentru întreaga populaţie sau pe categorii de populaţie - salariaţi, ţărani, pensionari; familii din mediul urban, din oraşele mari, din mediul rural; familii de diferite dimensiuni; categorii speciale de populaţie. În prezenta lucrare ne-am oprit asupra a două tipuri standard de familii;
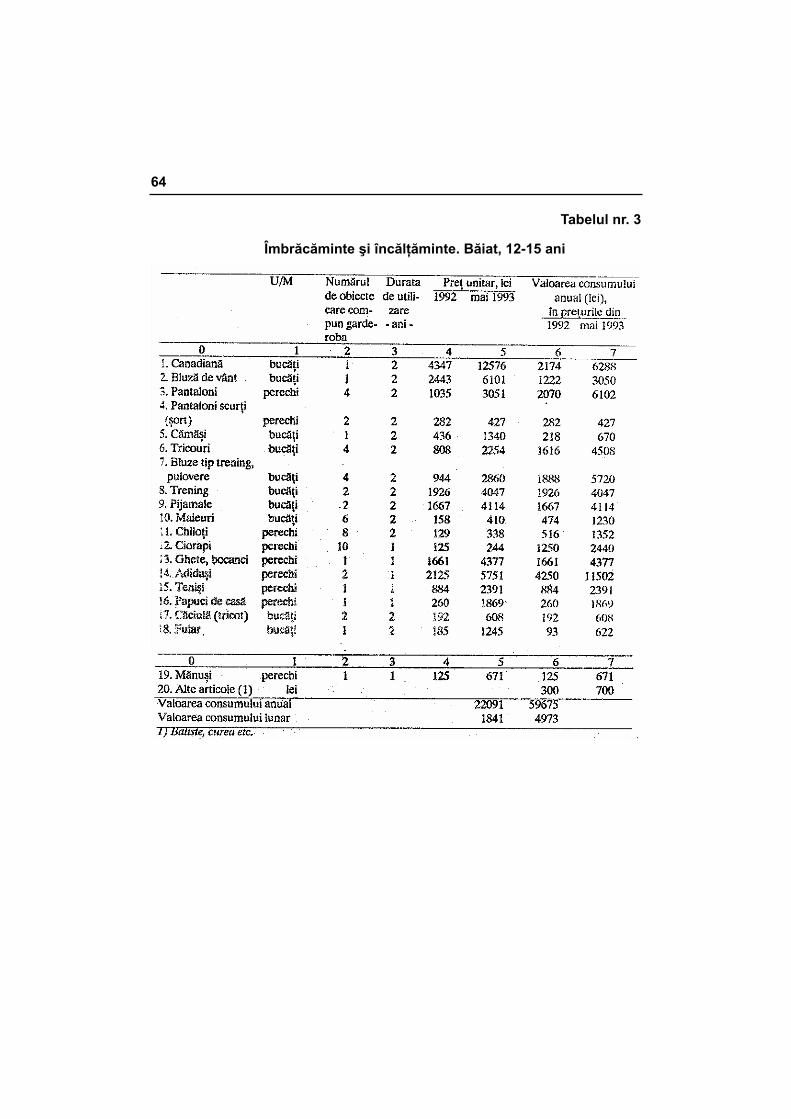
a) o familie de salariaţi, compusă din patru persoane: doi adulţi (bărbat şi femeie de 35-40 ani) şi doi copii (băiat de 12-15 ani şi fată de 7-9 ani);
b) o familie de pensionari, compusă din două persoane (bărbat de peste 62 ani şi femeie de peste 60 ani). S-a avut, de asemenea. în vedere ipoteza că familiile locuiesc în mediul urban, în apartamente de trei şi respectiv două camere.
Coşul şi bugetul de consum au fost construite astfel încât să corespundă condiţiilor de viaţă ale omului mediu, pentru familii situate în zona mediană a distribuţiei populaţiei după nivelul de trai. Ele au fost concepute ca instrumente necesare în evaluări privind veniturile medii (în principal salariul mediu şi pen-sia medie), consumul mediu şi cheltuielile medii de consum etc. Menţionăm că în legătură cu fundamentarea salariului minim, a pensiei minime, a sistemului de asistenţă socială şi a altor măsuri de protecţie socială se practică elabora-rea coşului şi bugetului minim, pe baza cărora se stabileşte pragul sărăciei. Evident, conţinutul şi parametrii cantitativi şi valorici ai coşului şi bugetului mi-nim diferă considerabil de cele estimate pentru nivelul de trai mediu.
Precizăm, de asemenea, că gama produselor şi serviciilor ce alcătuiesc coşul de consum şi, în special, cantităţile aferente acestora, diferă de la o ţară la alta în funcţie de diferenţele în nivelul de dezvoltare şi de civilizaţie, ca şi de tradiţii. În condiţiile realizării unui nivel de trai înalt pentru marea masă a popu-
14
laţiei, ale atingerii unor niveluri ale consumului ca raci eristice fazei de satura-ţie, precum şi ale existenţei unei relative stabilităţi a raporturilor dintre preturi, apare tendinţa simplificării coşului de consum.
Un coş de bunuri şi servicii construit după o metodologie specială este cel utilizat în comparaţiile internaţionale privind puterea de cumpărare a mone-delor naţionale (metoda Kravis).
Cele de mai sus sunt câteva argumente pentru a evidenţia multitudinea posibilităţilor de a construi şi utiliza un coş de consum, faptul că alcătuirea acestuia depinde de scopul căruia îi serveşte. În elaborarea acestei lucrări am avut în vedere cerinţa utilizării cu prioritate a coşului de consum în aprecierea nivelului de trai, adică pentru a compara nivelul consumului şi al cheltuielilor medii de consum ale familiilor de salariaţi şi pensionari realizate în această pe-rioadă cu cele apreciate ca necesare asigurării unui nivel de trai normai pentru standardul de civilizaţie din ţara noastră.
Evaluarea coşului şi bugetului de consum a fost efectuată distinct pentru cele două tipuri de familii (de salariaţi şi de pensionari), pe cele trei mari com-ponente ale consumului: alimentar, de produse nealimentare şi de servicii.
În anumite scopuri de analiză se recurge la determinarea unor coşuri de consum speciale, mai restrânse, cum ar fi coşul de produse alimentare1 sau coşul de consum curent.
Perioada la care se referă coşul de consum este de obicei un an, iar bu-getul de consum se calculează în mod obişnuit pentru o lună. într-o anumită accepţiune se poate vorbi şi de coş zilnic, care cuprinde produse şi servicii de consum curent: produse alimentare, produse nealimentare (de igienă, chimice, ziare, energie electrică, termică şi gaze etc.) şi servicii (transport, în principal), în cantităţi ce revin în medie pe o zi. Coşul zilnic, astfel definit, are un conţinut restrâns, iar graniţa dintre acesta şi celelalte componente ale coşului de con-sum este dificil de stabilit, având în vedere faptul că numeroase produse şi servicii care intră în consumul zilnic se cumpără la intervale mai mari de timp.
În momentul de faţă, coşul zilnic a devenit un termen frecvent utilizat în limbajul curent, conferindu-i-se o anumită semnificaţie în aprecierea cheltuieli-lor de consum ale familiilor şi a impactului creşterilor de preţuri asupra acesto-ra. El reprezintă însă un instrument insuficient de riguros In aprecierea nivelului de trai.
Coşul de consum propus în lucrare se referă la cantităţi necesare a fî consumate anual, iar acolo unde este cazul cuprinde şi cantităţile lunare şi chi-ar zilnice (produse alimentare). Bugetul a fost calculat lunar; pentru consumul alimentar a fost determinat şi bugetul zilnic pe familie şi pe o persoană. Preci-
1 Coşul de produse alimentare este utilizat, de exemplu, în determinarea pragului de sărăcie
în SUA, acestea din urmă fiind calculat ca multiplu (1:3) al valorii coşului alimentar pe ti-puri de familii, diferenţiate după dimensiune şi componenţă.
15
zăm, de asemenea că în cadrul bugetului de consum au fost delimitate cheltu-ielile de consum curent
Coşul de consum estimat pentru familia de salariaţi cuprinde 188 de pro-duse şi servicii, criteriul de selecţie, din cele 400 de poziţii luate în considerare în calculul bugetului de consum, constituindu-l ponderea valorii consumului anual al diferitelor produse şi servicii în bugetul total de consum; au fost cu-prinse cele cu o pondere de peste 0,1%. În legătură cu nivelurile aferente con-sumului cantitativ pe care le conţine coşul de consum proiectat, precum şi eu cele cuprinse în estimările privind bugetul, se impune precizarea că ele consti-tuie elemente de calcul ale unui întreg - coşul şi bugetul de consum. Ele nu au fost gândite şi nu trebuie interpretate ca niveluri strict determinate, caracteristi-ce consumului tuturor familiilor şi nici nu trebuie utilizate ca normative de con-sum. Ele au fost utilizate numai pentru calculul cheltuielilor de consum necesa-re. Dacă are asigurate venituri acoperitoare pentru bugetul estimat, fiecare fa-milie îşi satisface nevoile e trai în conformitate cu gusturile şi preferinţele pro-prii. "Coşul" de produse şi servicii efectiv utilizate de fiecare familie diferă, mai mult sau mai puţin, de cel propus în lucrare, care este, de fapt, un coş de refe-rinţă.
Bugetul de consum, anual şi lunar, a fost determinat la preţurile medii ale anului 1992 şi în preţurile înregistrate în lunile martie şi mai 1993. În evaluare au fost utilizate preţurile medii pe ţară aferente sortimentelor de produse apre-ciate ca cele mai frecvent utilizate în consumul majorităţii populaţiei, precum şi al celor situate în zona de mijloc a diapazonului preţurilor. Acestea au fost se-lecţionate din listele de preţuri la cele peste 2000 de produse şi servicii pentru care Comisia Naţională pentru Statistică face înregistrări sistematice2. În cazul unor produse şi servicii care nu sunt cuprinse în nomenclatorul CNS, au fost efectuate estimări ale preţurilor, pornind de la preţurile unor produse asemănă-toare sau înrudite. Pentru evaluările la preţurile din martie şi mai 1993, produ-sele alimentare sezoniere (legume şi fructe) au fost cuprinse în calcul la preţuri estimate având în vedere preţurile medii din anul 1992 şi indicele preţurilor la alimente. Estimări similare au fost efectuate şi pentru alte produse (mobilă, unele bunuri de folosinţă îndelungată etc.) pentru care sortimentele luate în calcul pentru evaluarea corespunzătoare anului 1992, nu au mai avut preţuri înregistrate în mai 1993. Unele servicii au fost cuprinse în calcul la tarife com-puse, care pe lângă tariful pentru manopera propriu-zisă cuprind şi costul ma-terialelor necesare. 2 Comisia Naţională pentru Statistică desfăşoară o activitate laborioasă pentru calculul indi-
cilor preţuri, în contextul unor permanente preocupări de perfecţionare a metodologiei de calcul, a instrumentarului de culegere şi prelucrare a datelor Menţionăm că indicii preţuri-lor de consum se calculează pe baza unor date privind nivelurile preţurilor la bunurile şi serviciile cuprinse într-un nomenclator cu peste 2000 de poziţii. Aceste date sunt înregis-trate sistematic în cursul unei luni în toate judeţele. Din datele primare remită niveluri me-dii, pe judeţ şi respectiv pe ţară, pentru fiecare din articolele cuprinse în nomenclator.
2. Coşul şi bugetul alimentar
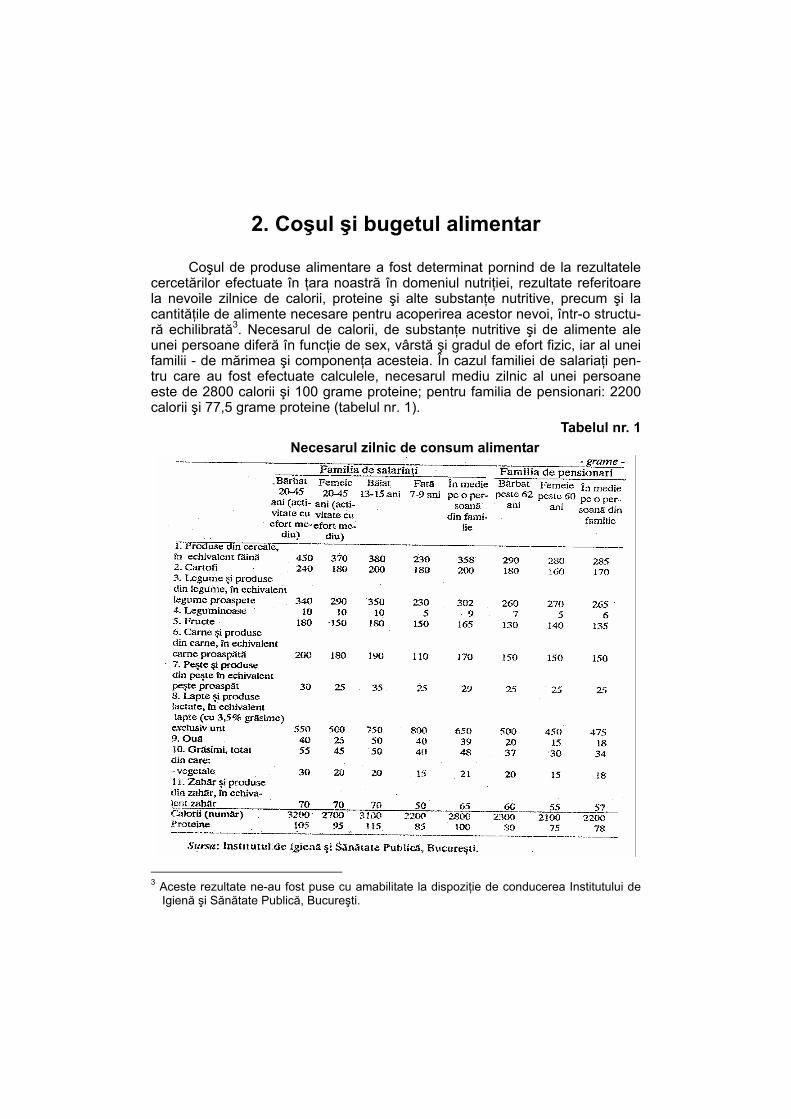
Coşul de produse alimentare a fost determinat pornind de la rezultatele cercetărilor efectuate în ţara noastră în domeniul nutriţiei, rezultate referitoare la nevoile zilnice de calorii, proteine şi alte substanţe nutritive, precum şi la cantităţile de alimente necesare pentru acoperirea acestor nevoi, într-o structu-ră echilibrată3. Necesarul de calorii, de substanţe nutritive şi de alimente ale unei persoane diferă în funcţie de sex, vârstă şi gradul de efort fizic, iar al unei familii - de mărimea şi componenţa acesteia. În cazul familiei de salariaţi pen-tru care au fost efectuate calculele, necesarul mediu zilnic al unei persoane este de 2800 calorii şi 100 grame proteine; pentru familia de pensionari: 2200 calorii şi 77,5 grame proteine (tabelul nr. 1).
Tabelul nr. 1 Necesarul zilnic de consum alimentar
3 Aceste rezultate ne-au fost puse cu amabilitate la dispoziţie de conducerea Institutului de
Igienă şi Sănătate Publică, Bucureşti.
17
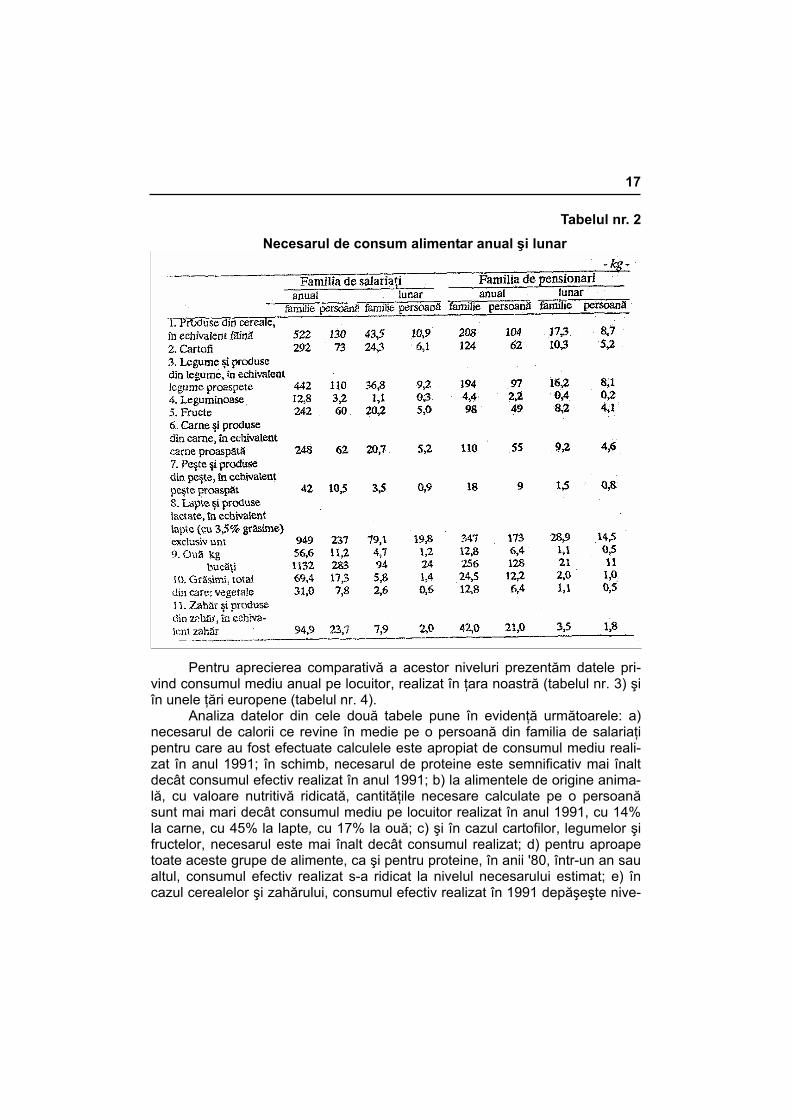
Tabelul nr. 2 Necesarul de consum alimentar anual şi lunar
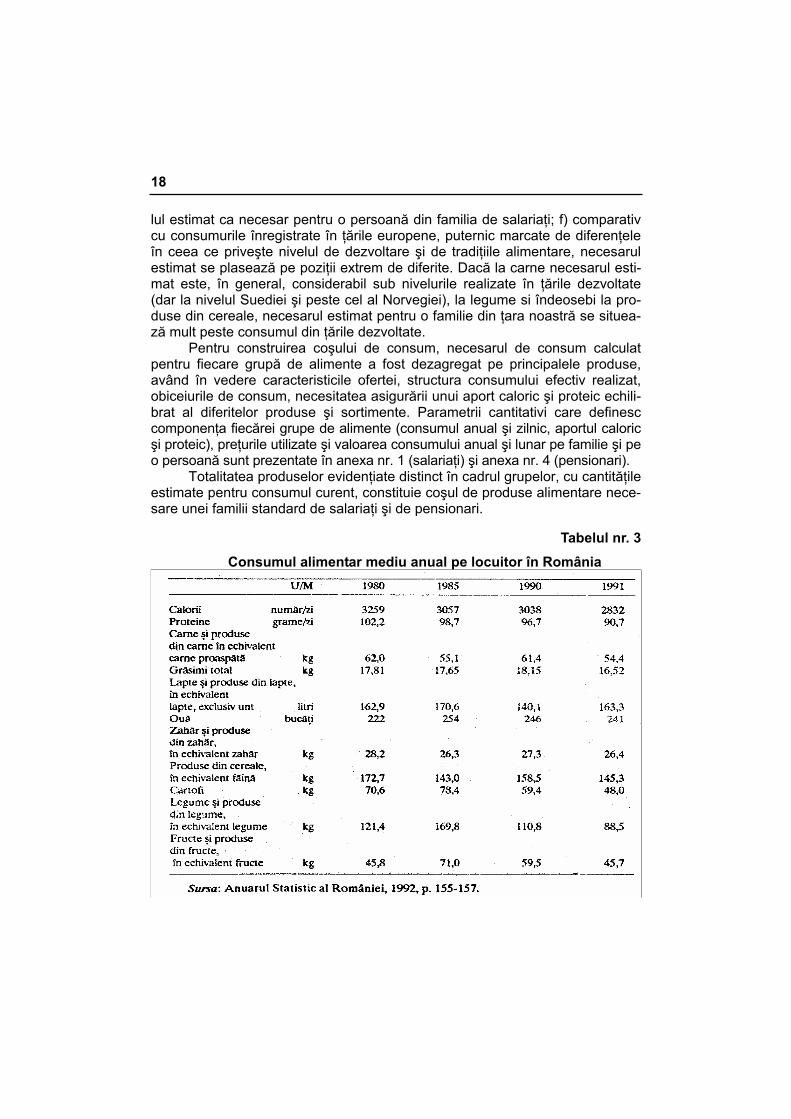
Pentru aprecierea comparativă a acestor niveluri prezentăm datele pri-
vind consumul mediu anual pe locuitor, realizat în ţara noastră (tabelul nr. 3) şi în unele ţări europene (tabelul nr. 4).
Analiza datelor din cele două tabele pune în evidenţă următoarele: a) necesarul de calorii ce revine în medie pe o persoană din familia de salariaţi pentru care au fost efectuate calculele este apropiat de consumul mediu reali-zat în anul 1991; în schimb, necesarul de proteine este semnificativ mai înalt decât consumul efectiv realizat în anul 1991; b) la alimentele de origine anima-lă, cu valoare nutritivă ridicată, cantităţile necesare calculate pe o persoană sunt mai mari decât consumul mediu pe locuitor realizat în anul 1991, cu 14% la carne, cu 45% la lapte, cu 17% la ouă; c) şi în cazul cartofilor, legumelor şi fructelor, necesarul este mai înalt decât consumul realizat; d) pentru aproape toate aceste grupe de alimente, ca şi pentru proteine, în anii '80, într-un an sau altul, consumul efectiv realizat s-a ridicat la nivelul necesarului estimat; e) în cazul cerealelor şi zahărului, consumul efectiv realizat în 1991 depăşeşte nive-
18
lul estimat ca necesar pentru o persoană din familia de salariaţi; f) comparativ cu consumurile înregistrate în ţările europene, puternic marcate de diferenţele în ceea ce priveşte nivelul de dezvoltare şi de tradiţiile alimentare, necesarul estimat se plasează pe poziţii extrem de diferite. Dacă la carne necesarul esti-mat este, în general, considerabil sub nivelurile realizate în ţările dezvoltate (dar la nivelul Suediei şi peste cel al Norvegiei), la legume si îndeosebi la pro-duse din cereale, necesarul estimat pentru o familie din ţara noastră se situea-ză mult peste consumul din ţările dezvoltate.
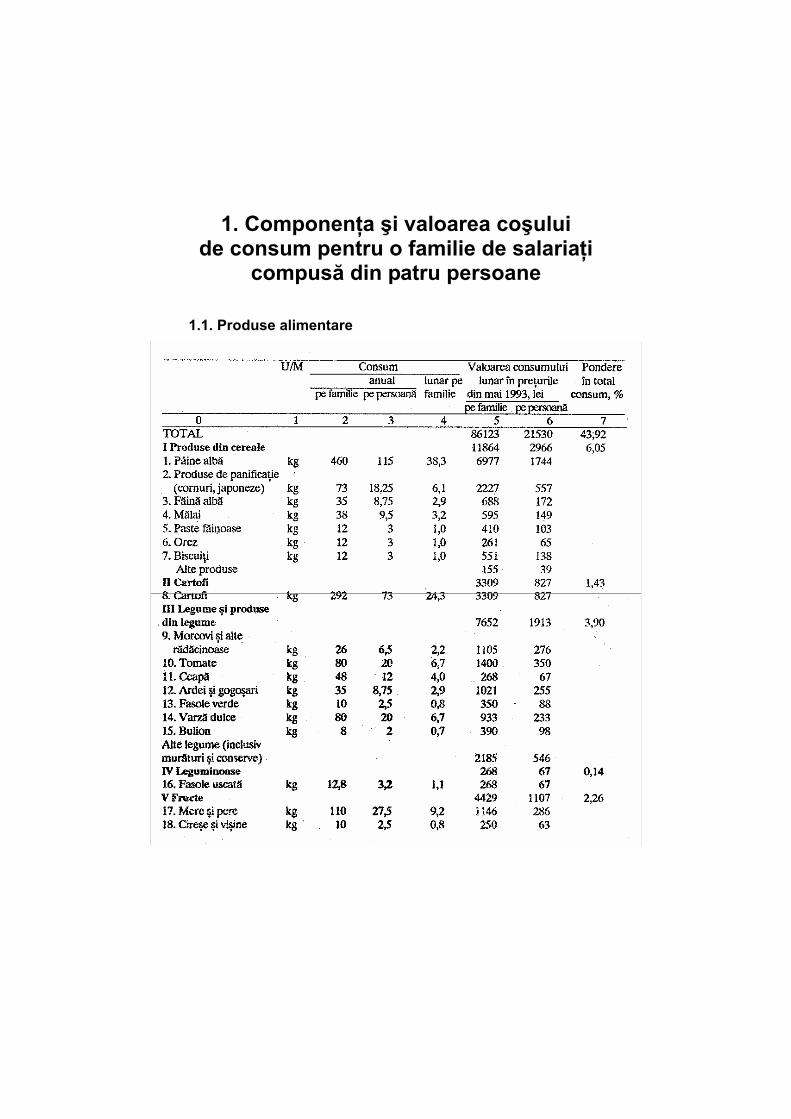
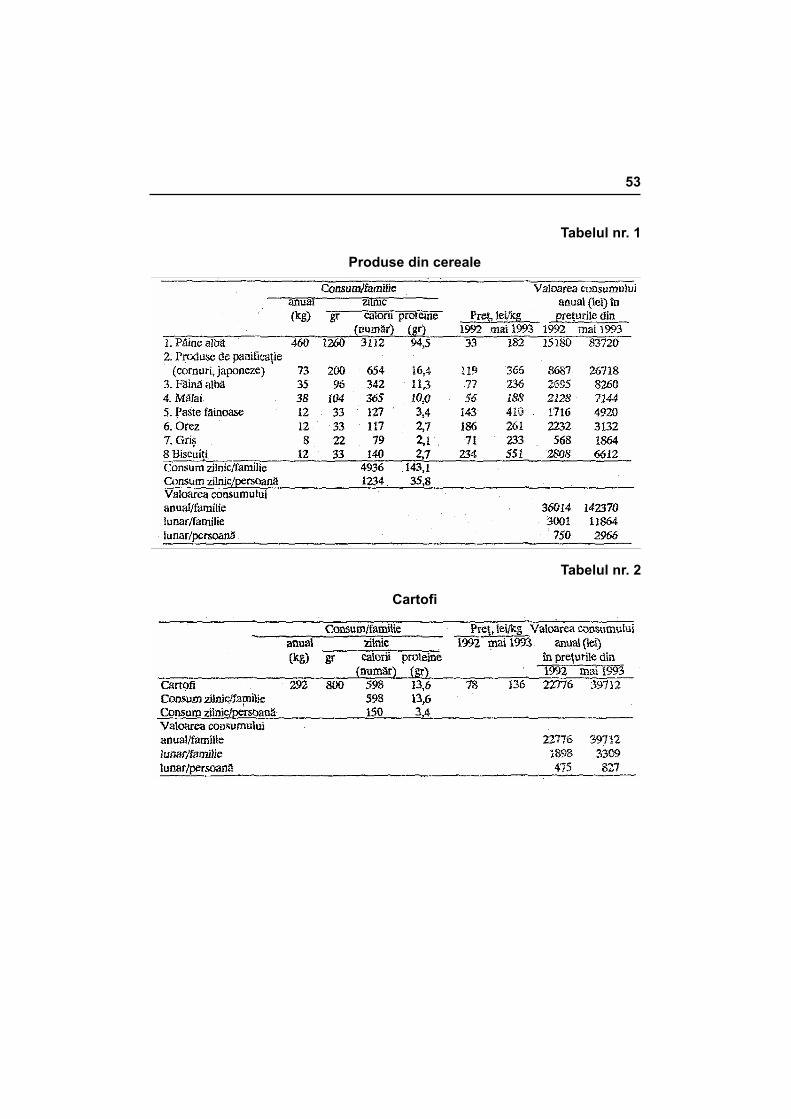
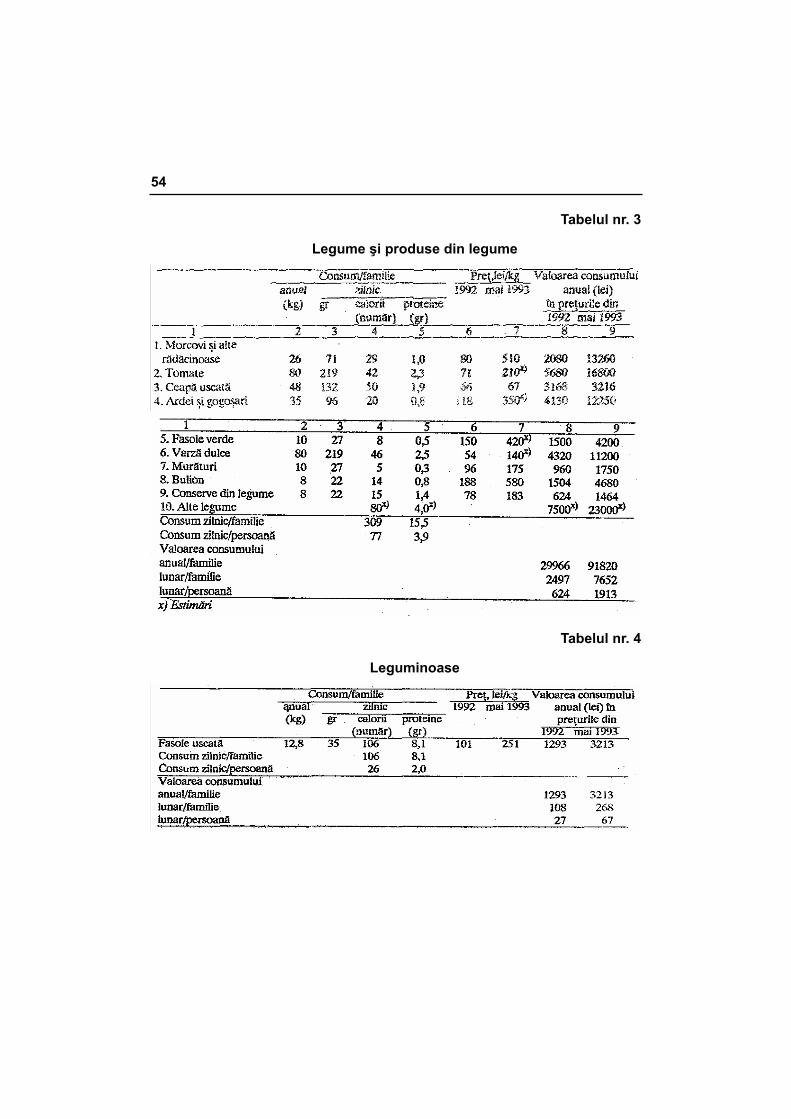
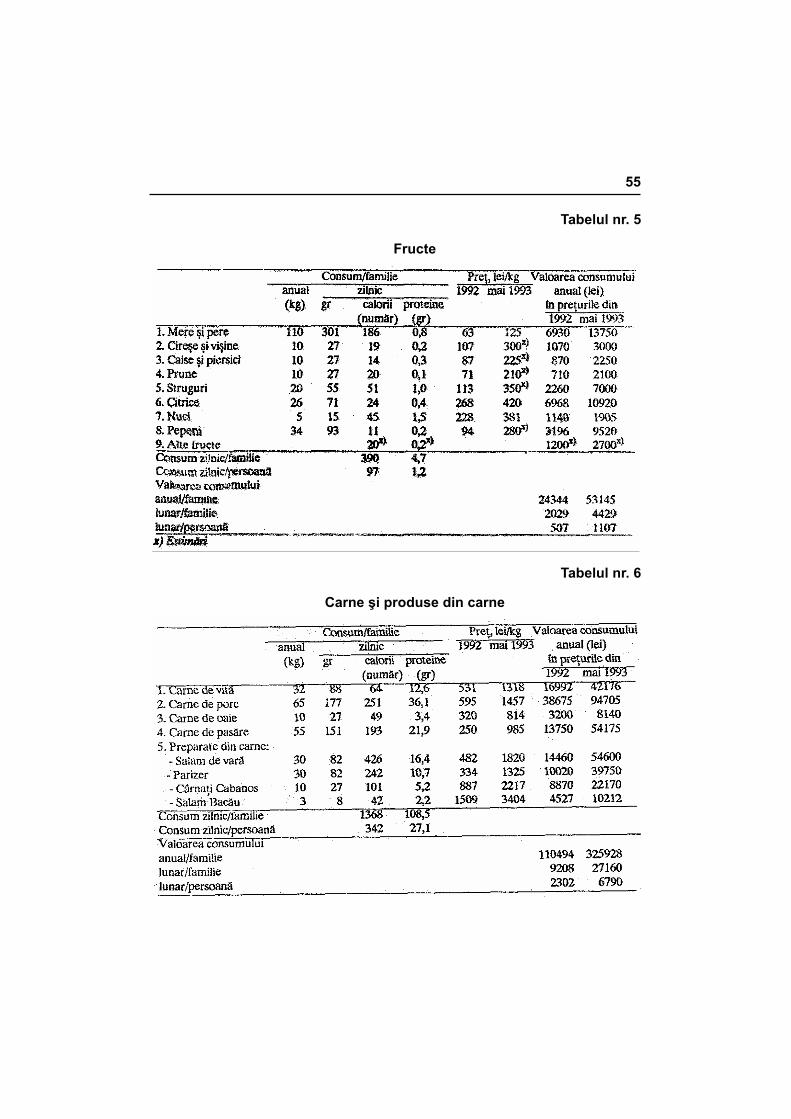
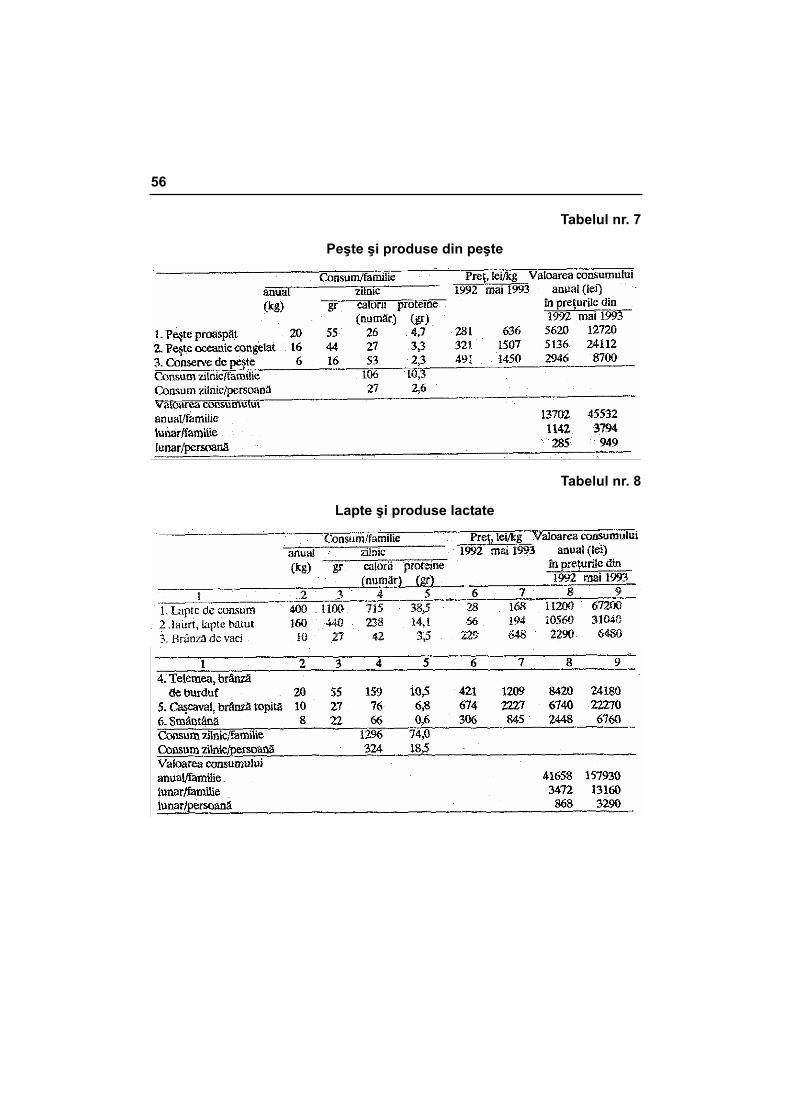
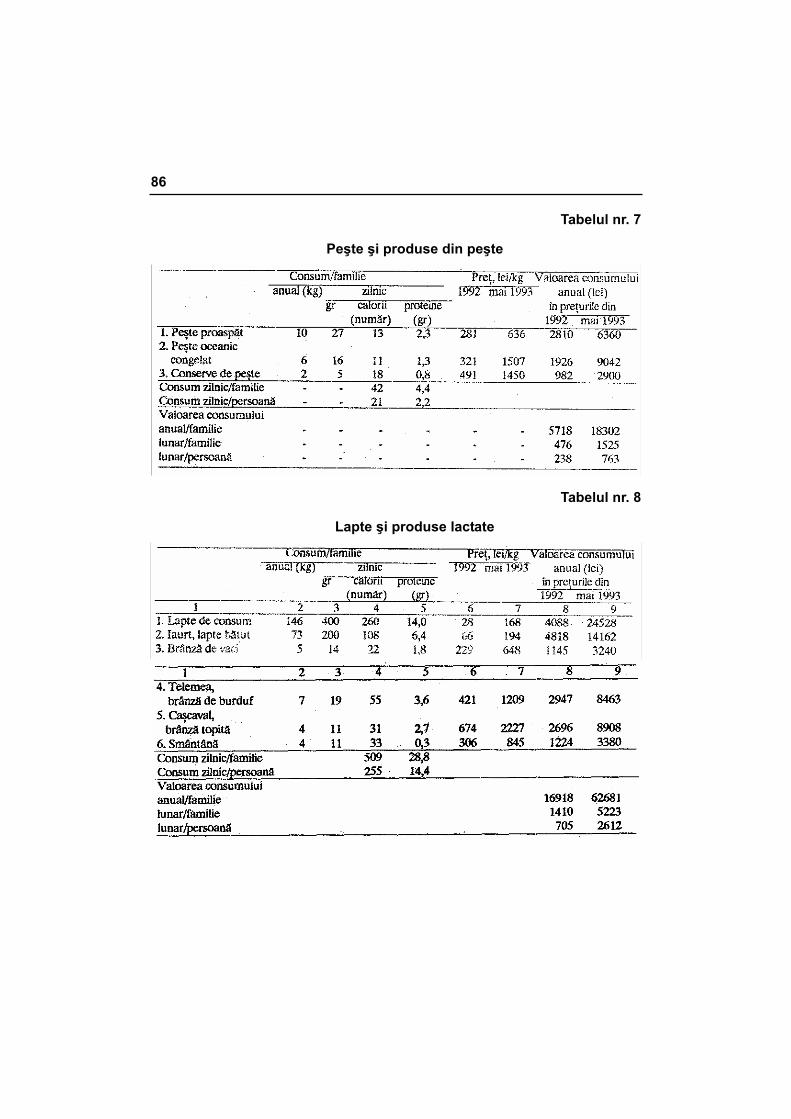
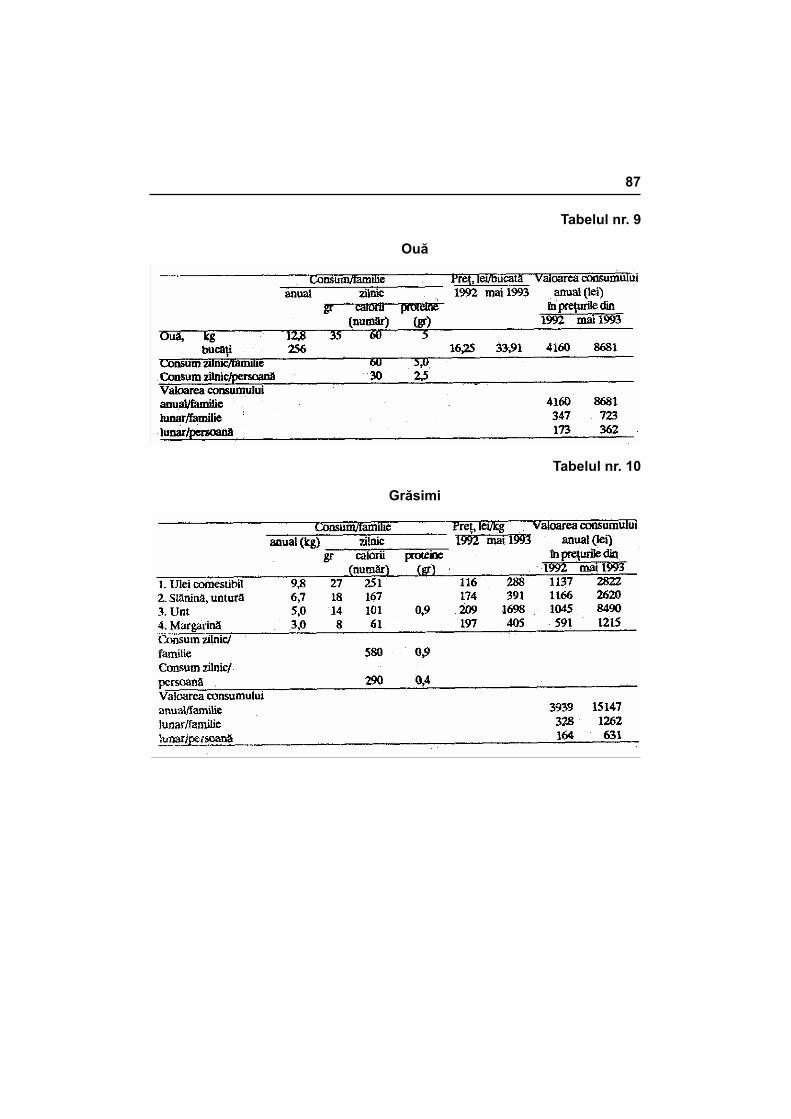
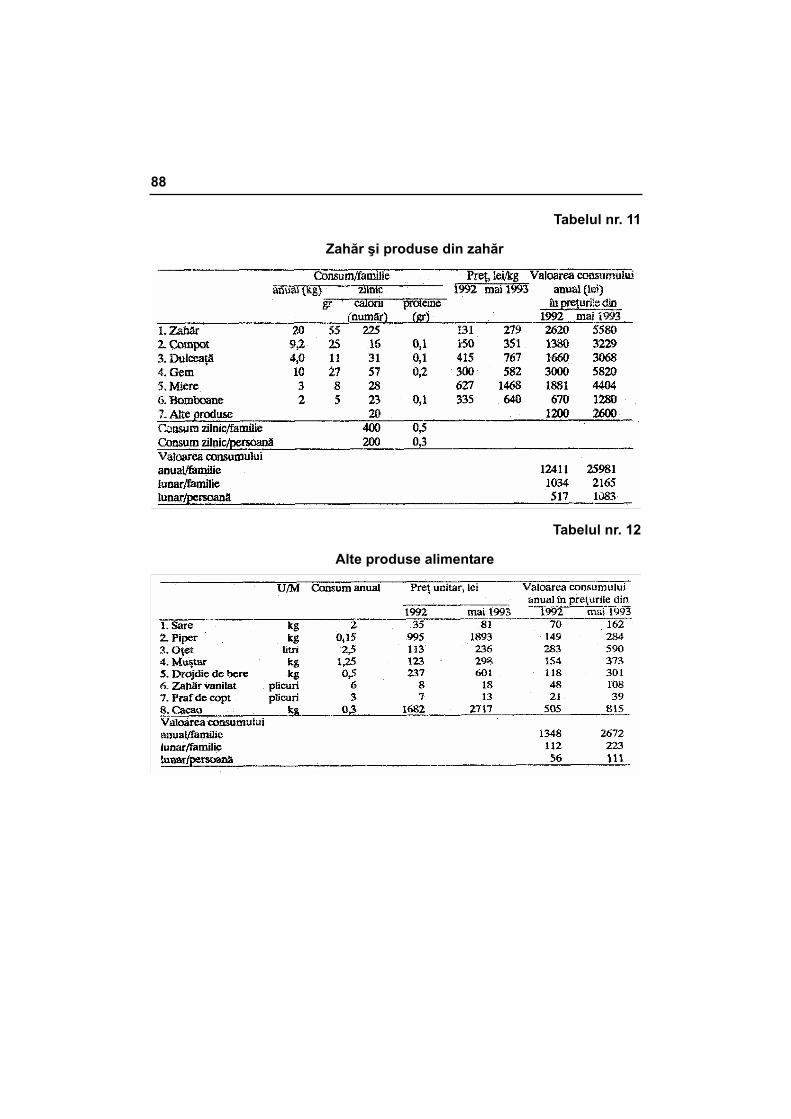
Pentru construirea coşului de consum, necesarul de consum calculat pentru fiecare grupă de alimente a fost dezagregat pe principalele produse, având în vedere caracteristicile ofertei, structura consumului efectiv realizat, obiceiurile de consum, necesitatea asigurării unui aport caloric şi proteic echili-brat al diferitelor produse şi sortimente. Parametrii cantitativi care definesc componenţa fiecărei grupe de alimente (consumul anual şi zilnic, aportul caloric şi proteic), preţurile utilizate şi valoarea consumului anual şi lunar pe familie şi pe o persoană sunt prezentate în anexa nr. 1 (salariaţi) şi anexa nr. 4 (pensionari).
Totalitatea produselor evidenţiate distinct în cadrul grupelor, cu cantităţile estimate pentru consumul curent, constituie coşul de produse alimentare nece-sare unei familii standard de salariaţi şi de pensionari.
Tabelul nr. 3 Consumul alimentar mediu anual pe locuitor în România
19
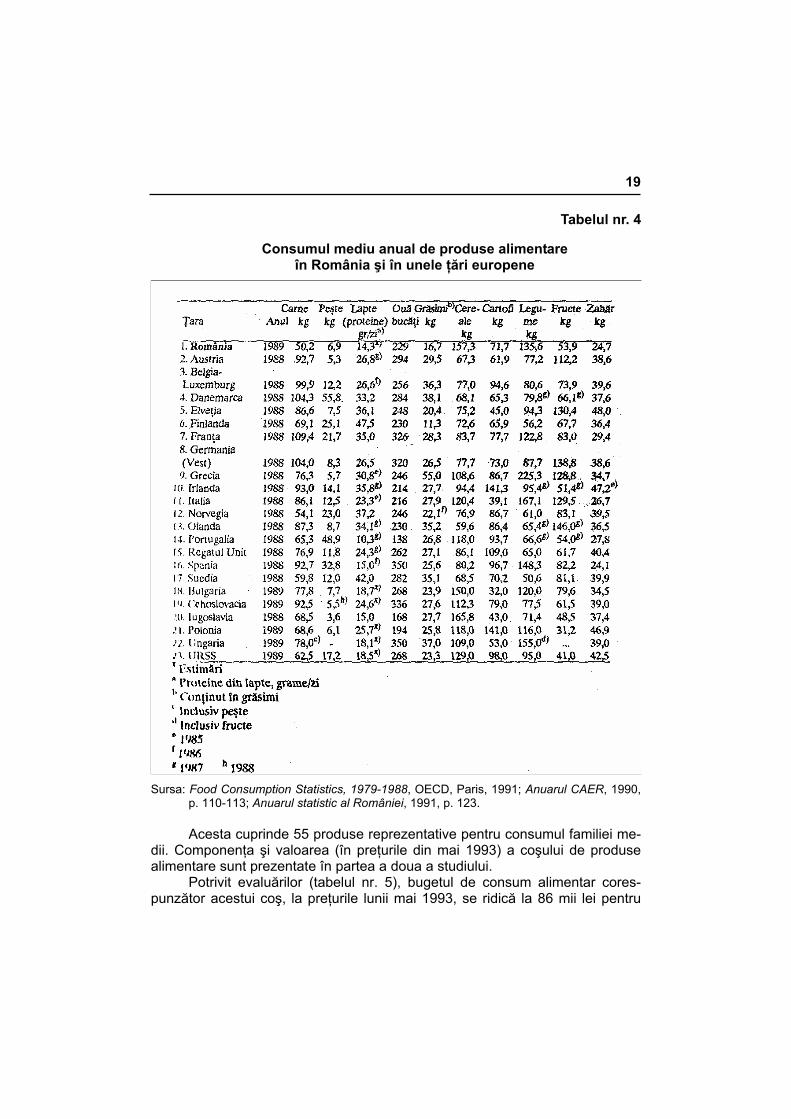
Tabelul nr. 4
Consumul mediu anual de produse alimentare în România şi în unele ţări europene
Sursa: Food Consumption Statistics, 1979-1988, OECD, Paris, 1991; Anuarul CAER, 1990,
p. 110-113; Anuarul statistic al României, 1991, p. 123.
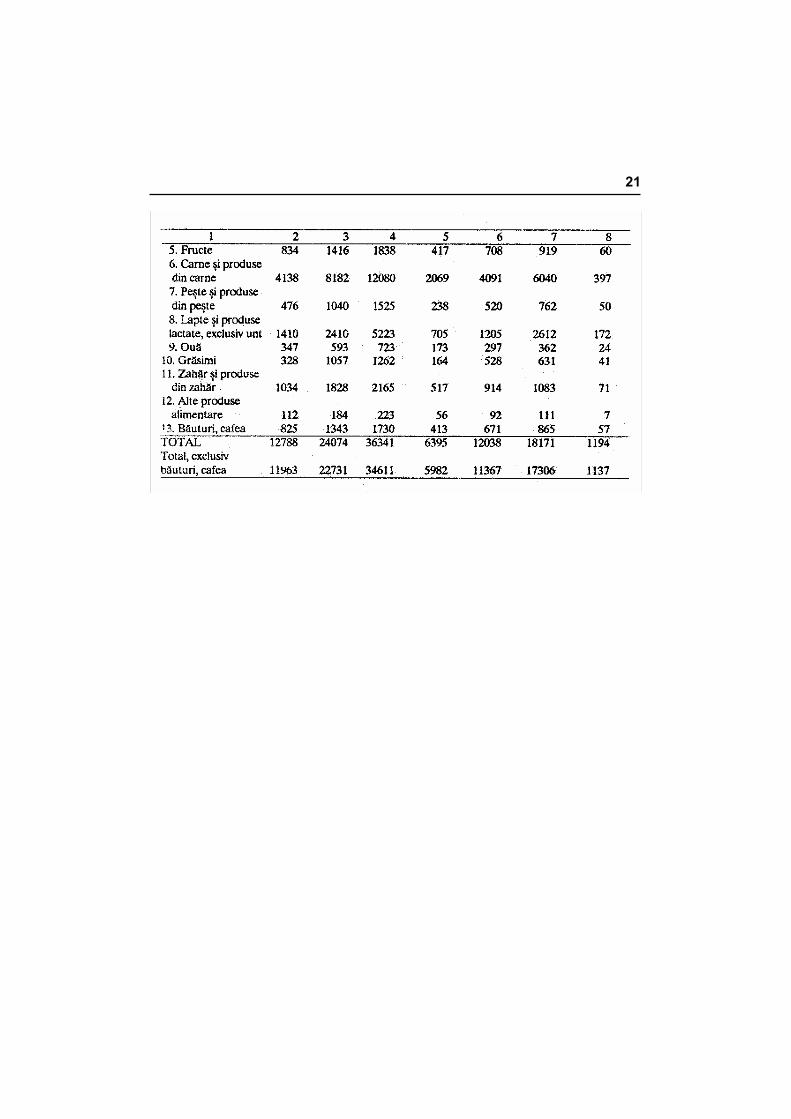
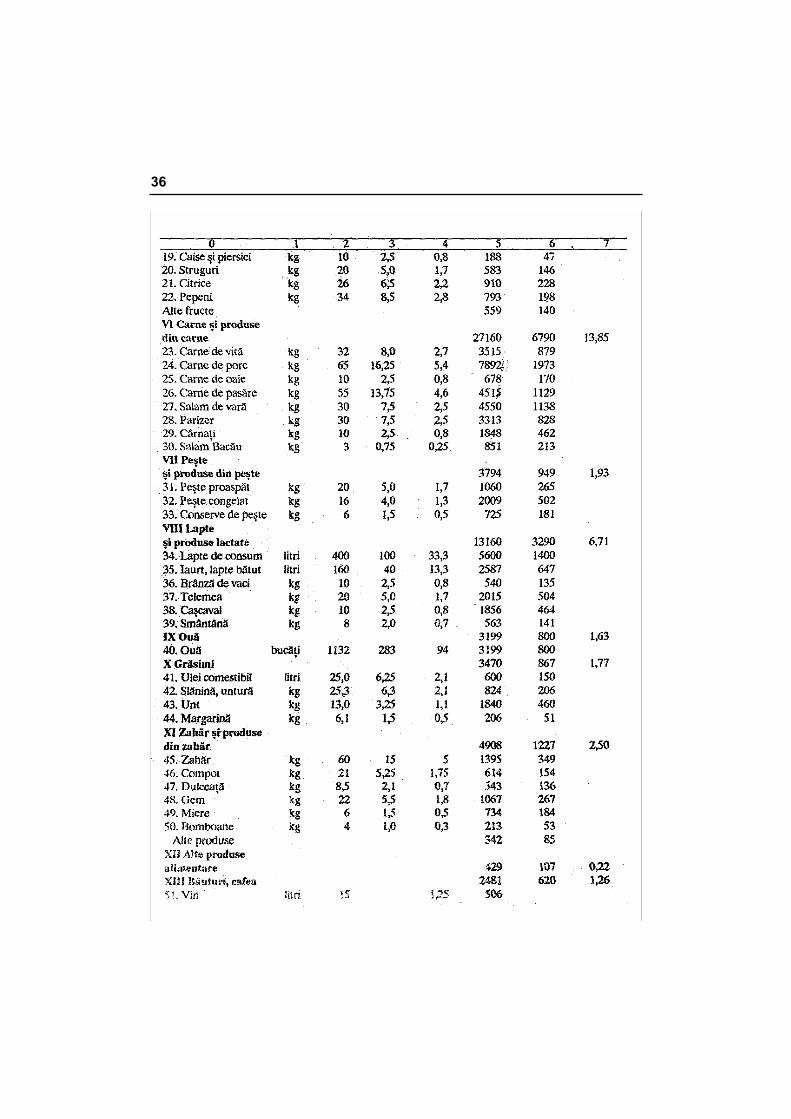
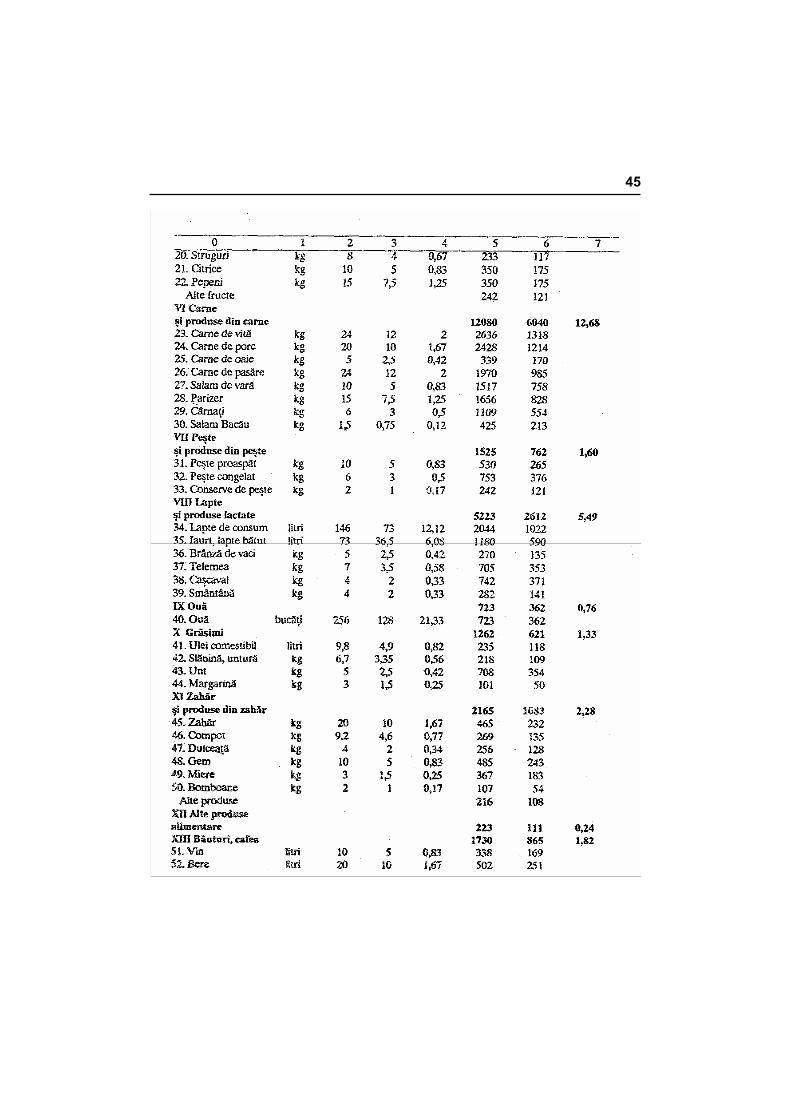
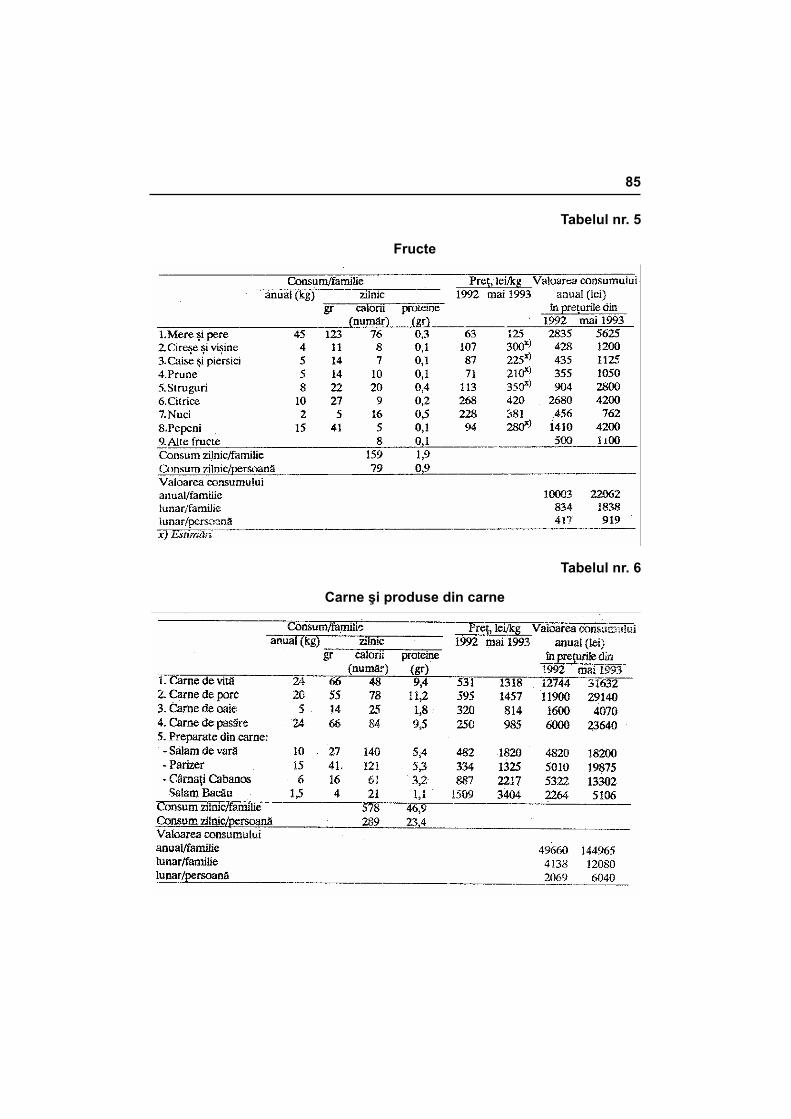
Acesta cuprinde 55 produse reprezentative pentru consumul familiei me-dii. Componenţa şi valoarea (în preţurile din mai 1993) a coşului de produse alimentare sunt prezentate în partea a doua a studiului.
Potrivit evaluărilor (tabelul nr. 5), bugetul de consum alimentar cores-punzător acestui coş, la preţurile lunii mai 1993, se ridică la 86 mii lei pentru
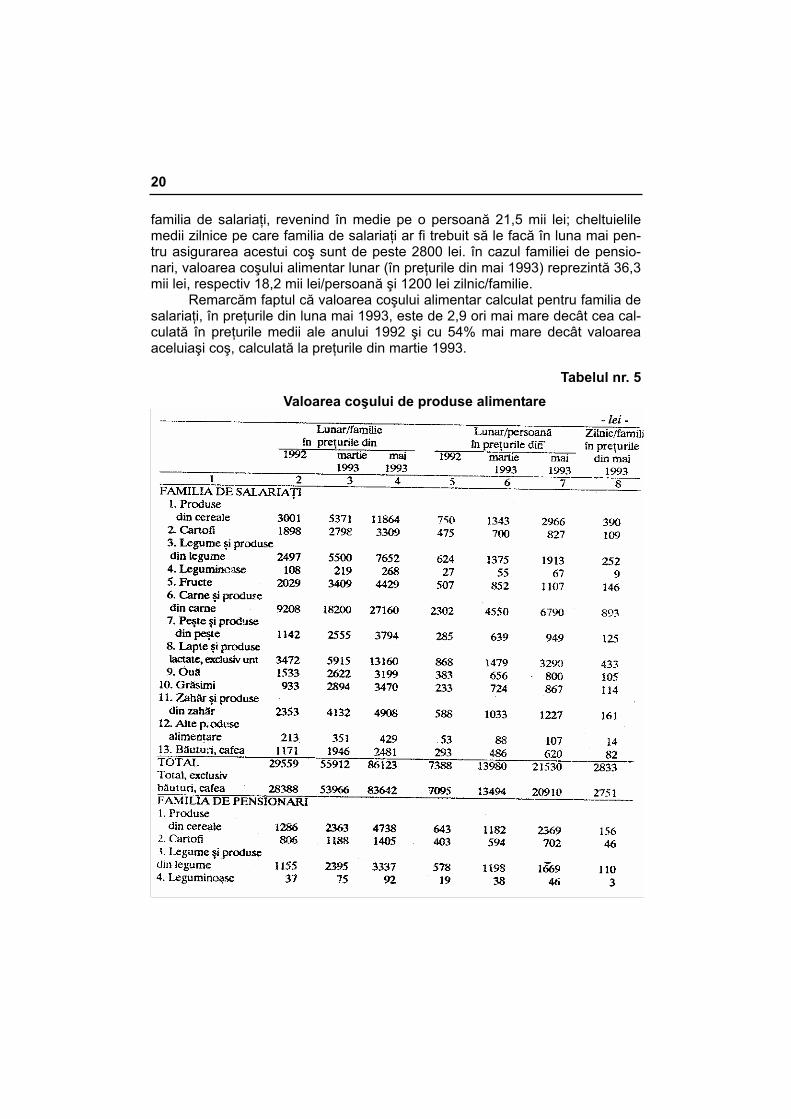
20
familia de salariaţi, revenind în medie pe o persoană 21,5 mii lei; cheltuielile medii zilnice pe care familia de salariaţi ar fi trebuit să le facă în luna mai pen-tru asigurarea acestui coş sunt de peste 2800 lei. în cazul familiei de pensio-nari, valoarea coşului alimentar lunar (în preţurile din mai 1993) reprezintă 36,3 mii lei, respectiv 18,2 mii lei/persoană şi 1200 lei zilnic/familie.
Remarcăm faptul că valoarea coşului alimentar calculat pentru familia de salariaţi, în preţurile din luna mai 1993, este de 2,9 ori mai mare decât cea cal-culată în preţurile medii ale anului 1992 şi cu 54% mai mare decât valoarea aceluiaşi coş, calculată la preţurile din martie 1993.
Tabelul nr. 5 Valoarea coşului de produse alimentare
21
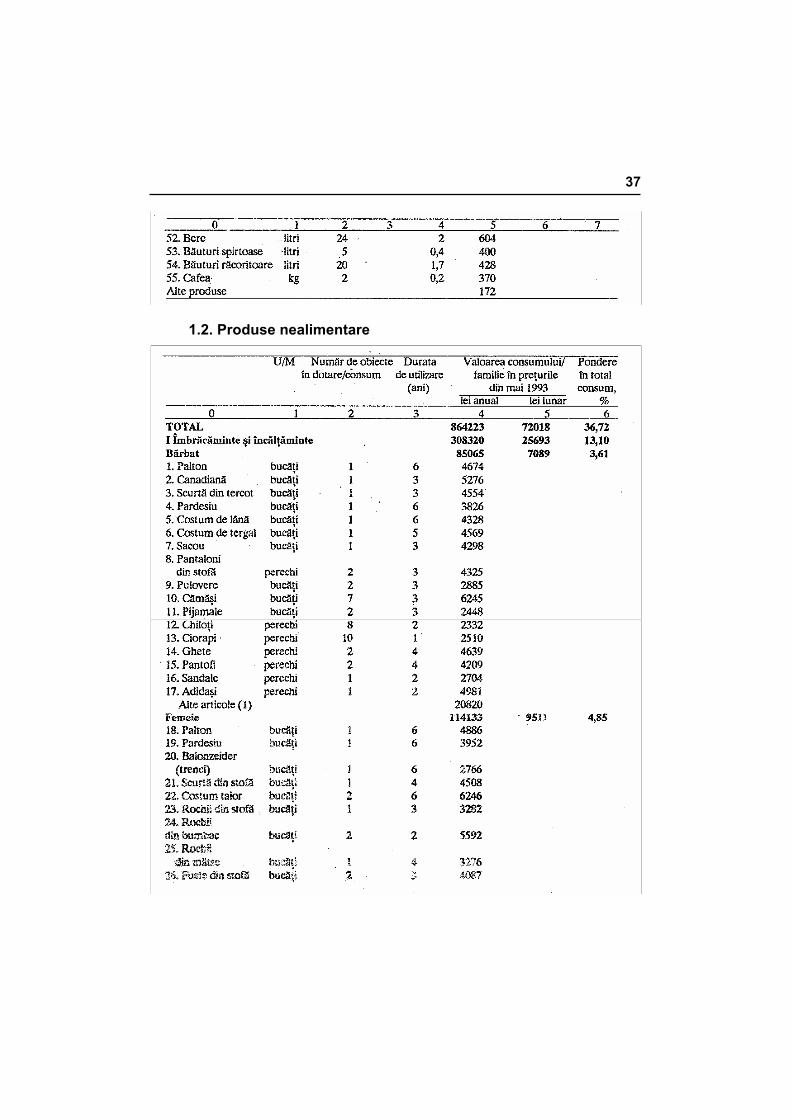
3. Produse nealimentare
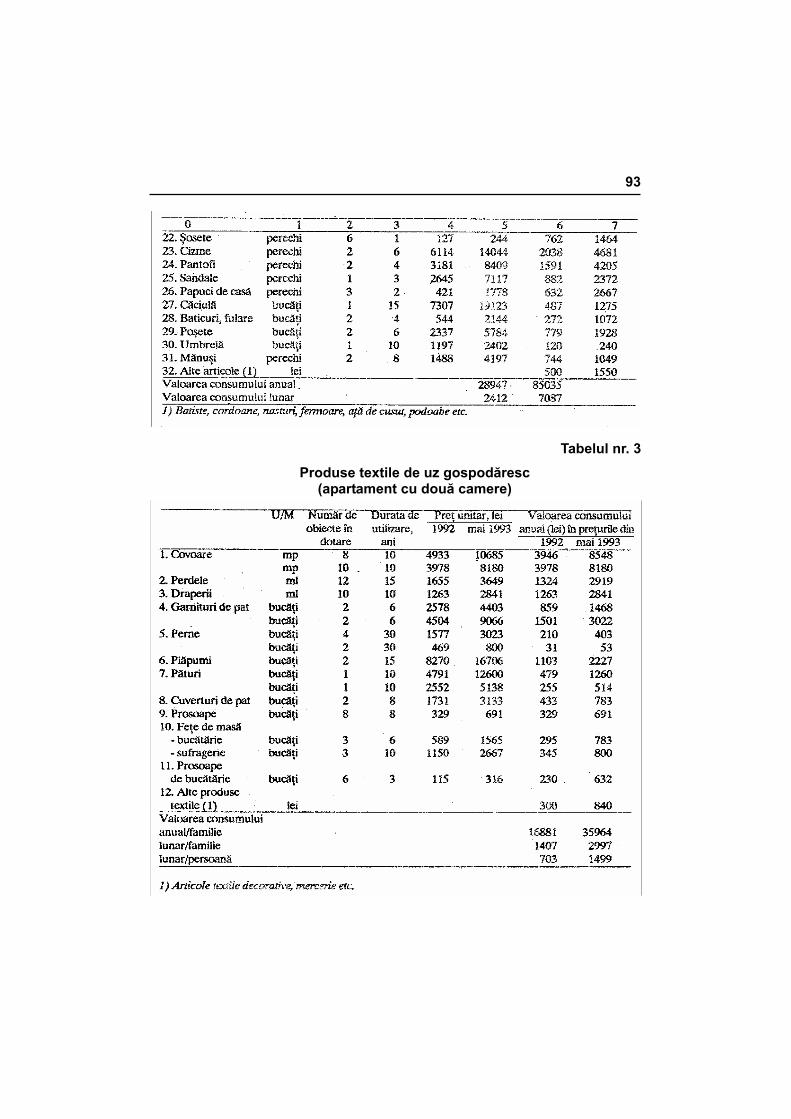
Coşul şi bugetul de consum cuprind două categorii de produse nealimen-tare: produse de consum curent, care se cumpără cu o frecvenţă relativ mare (produsele de igienă personală, detergenţi, energie electrică etc.) şi produse cu o durată de utilizare care depăşeşte un an (majoritatea componentelor garde-robei şi bunurile existente în dotarea gospodăriei). Produsele din cea de a do-ua categorie sunt cuprinse în coşul de consum cu cantităţile aferente consumu-lui anual (calculate ca raport între numărul de obiecte care trebuie să existe în dotare şi durata normală de utilizare a acestora). Bugetul de consum cuprinde valoarea consumului anual, egală cu suma necesară a fi economisită din buge-tul anual (lunar) al familiei în scopul înlocuirii treptate, la intervalele luate în cal-cul, a tuturor bunurilor existente în gospodărie. în condiţii de criză, de scădere a nivelului de trai, o mare parte a gospodăriilor renunţă, în primul rând, la cum-părarea bunurilor de folosinţă îndelungată, necesare dotării sau înlocuirii celor existente în gospodărie, cea mai mare partea veniturilor fiind orientată spre acoperirea cheltuielilor curente. Aceasta nu justifică însă neluarea în conside-rare a acestor produse în alcătuirea coşului şi bugetului de consum, întrucât într-o perioadă mai mare de timp acestea trebuie înlocuite pentru ca familia să-şi poate asigura menţinerea nivelului de trai.
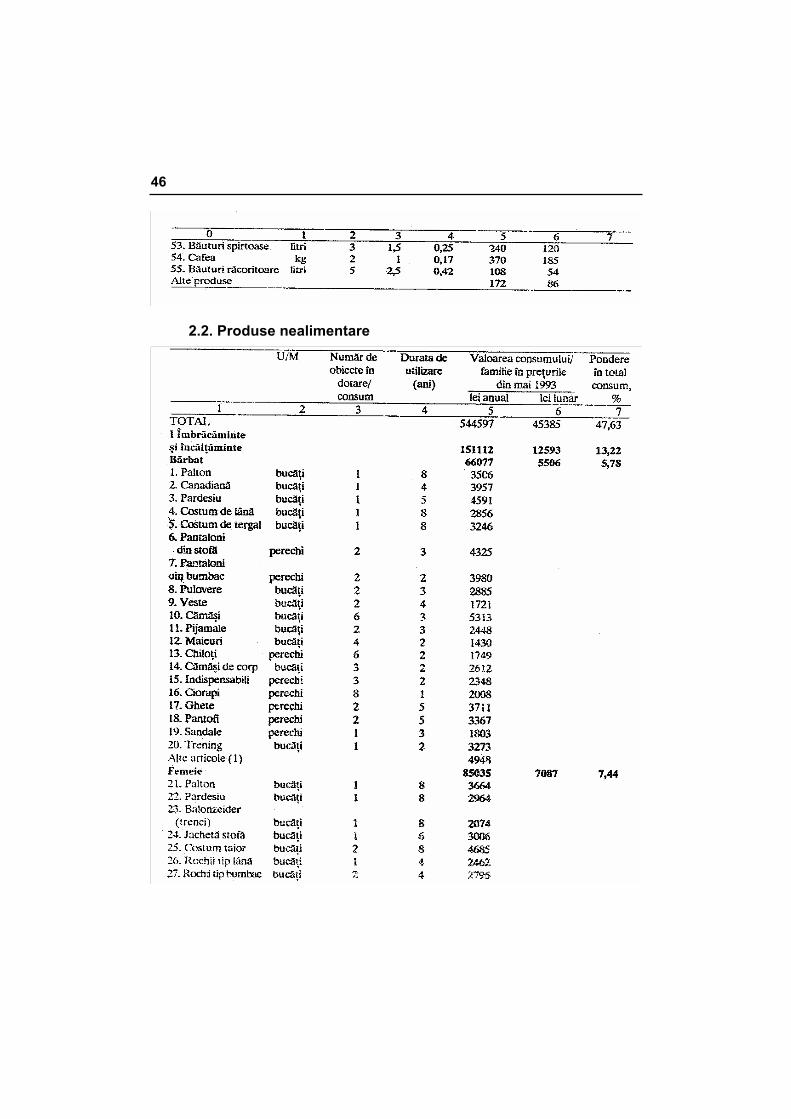
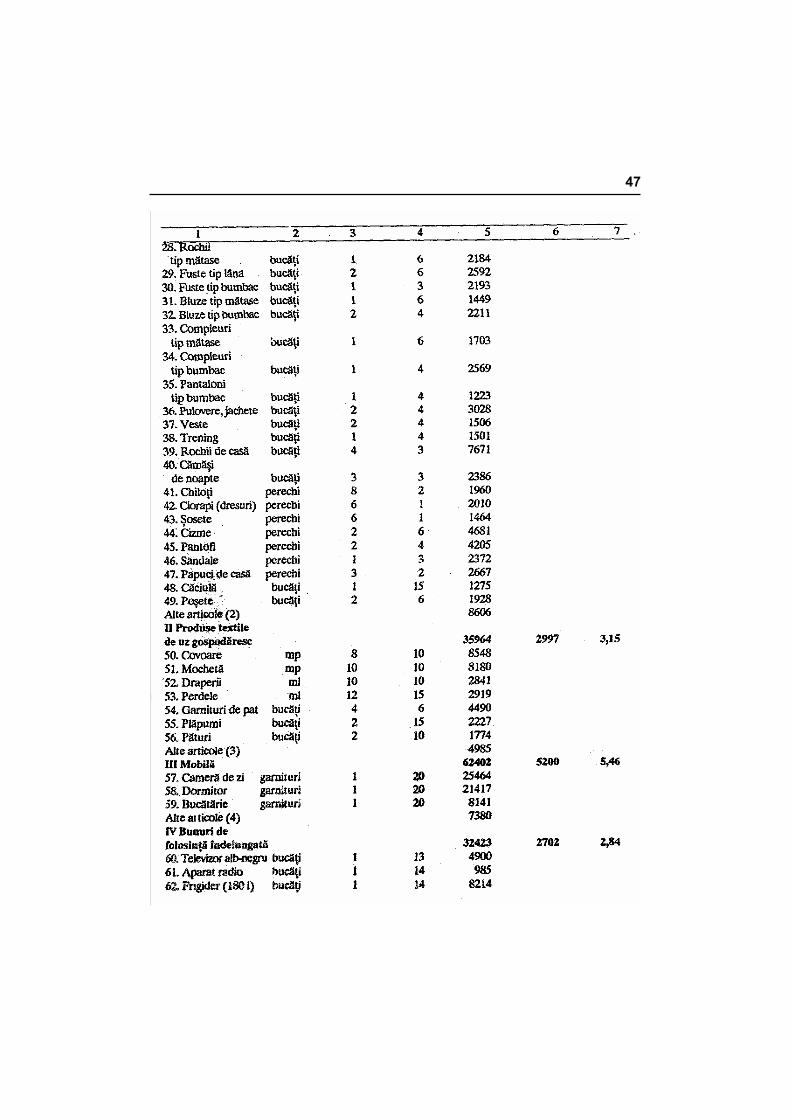
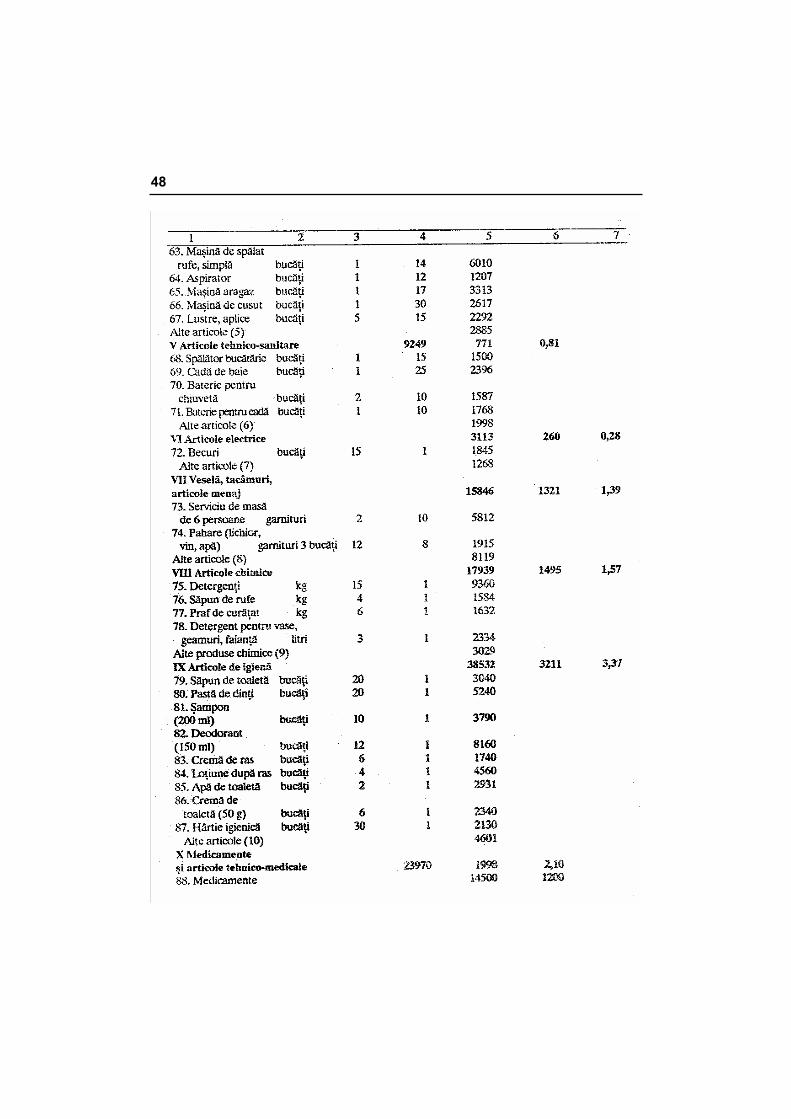
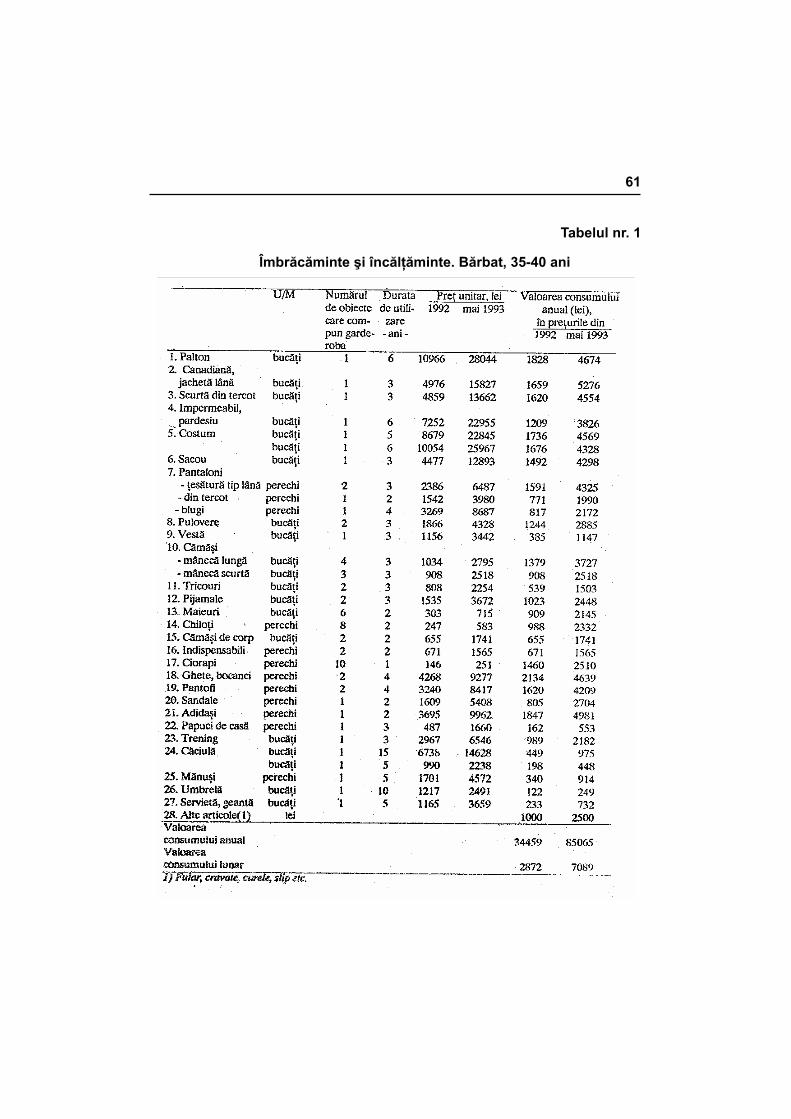
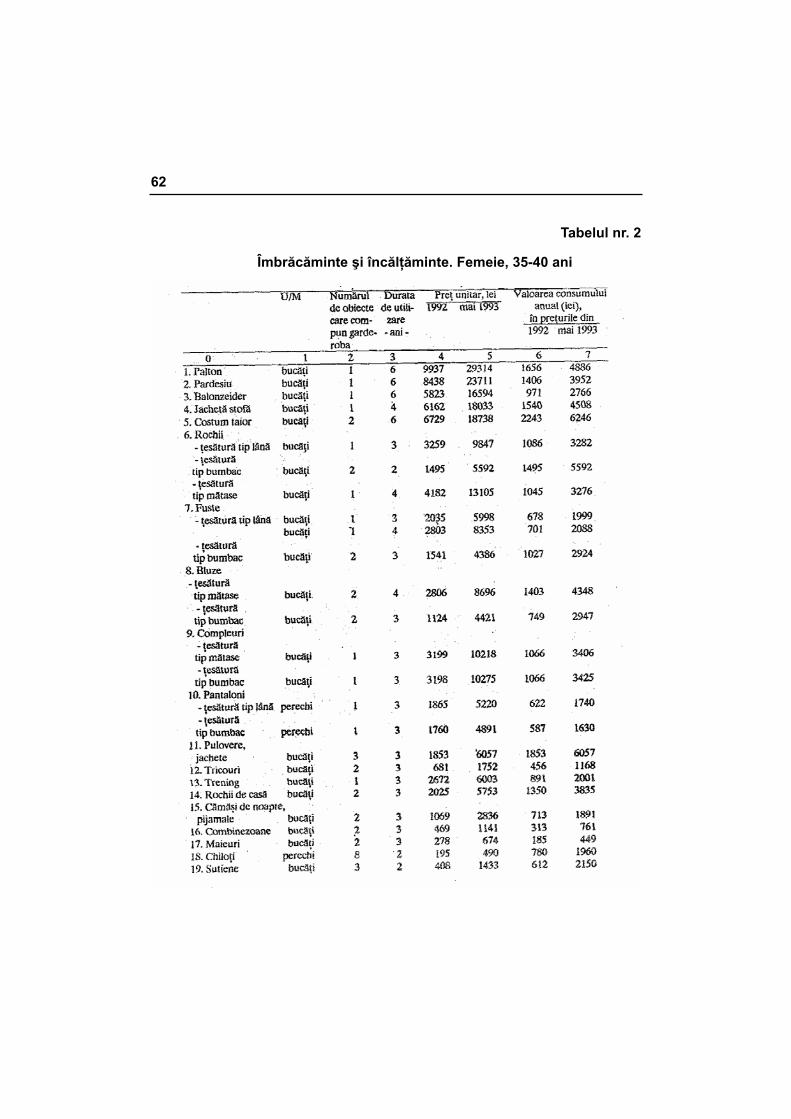
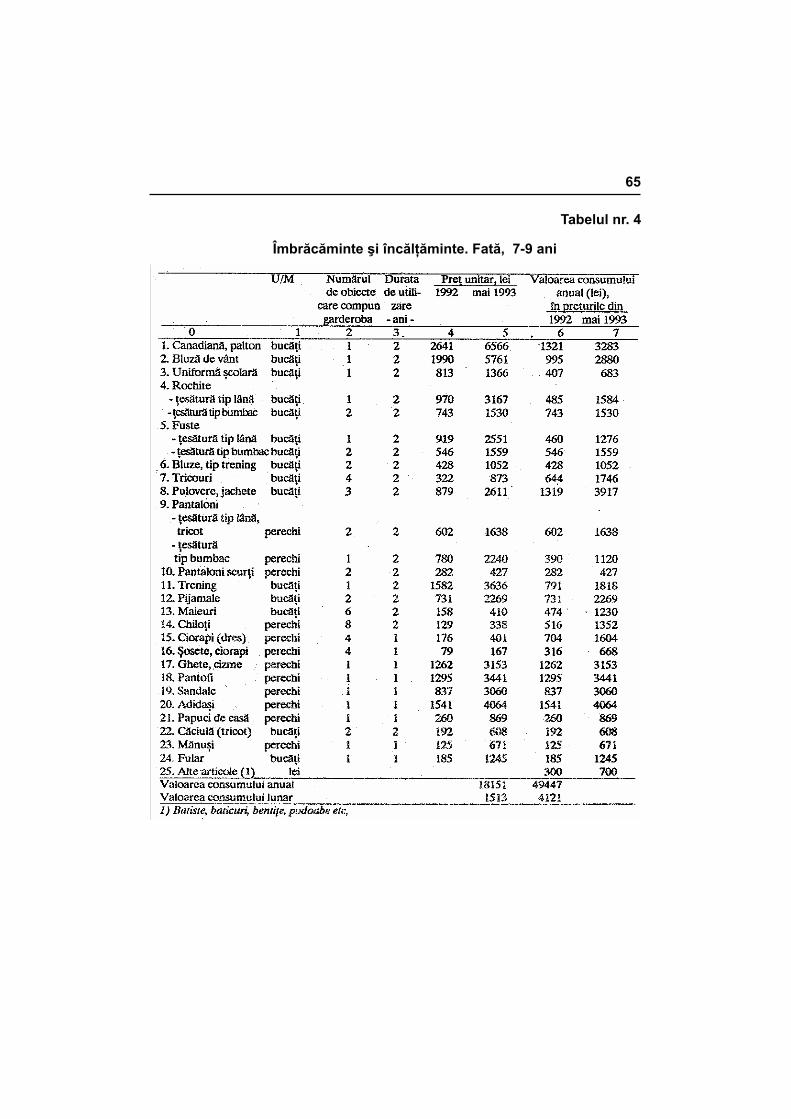
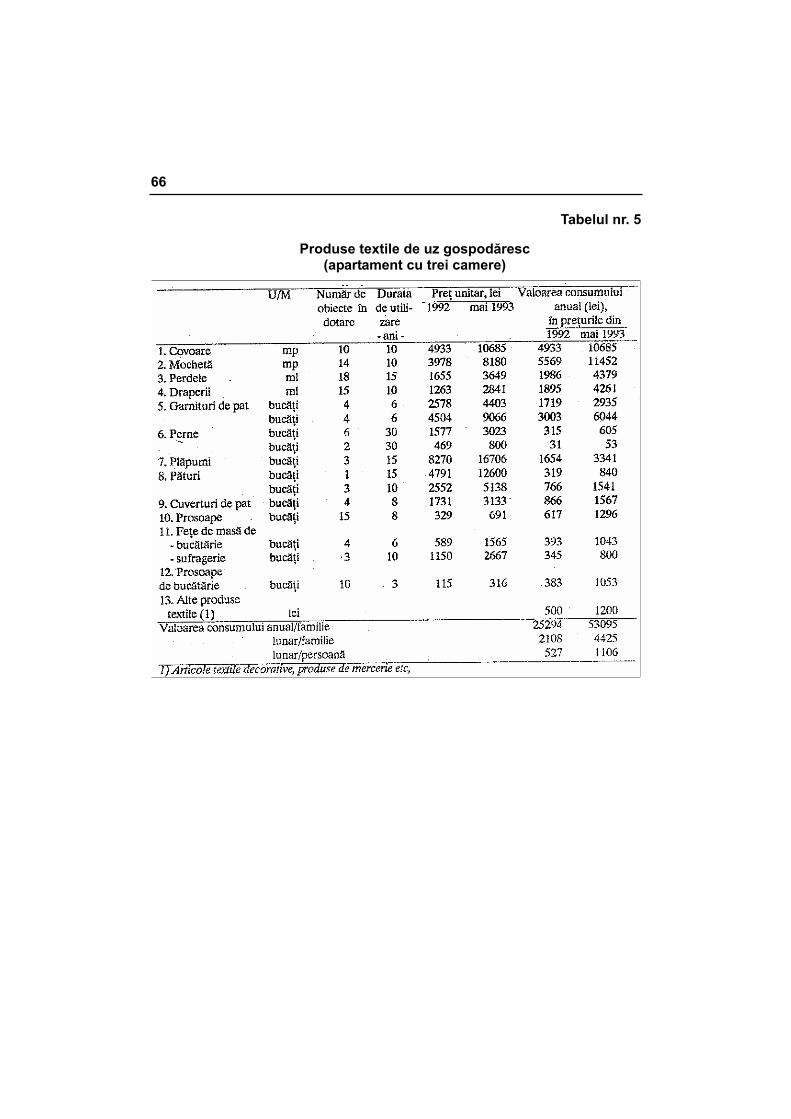
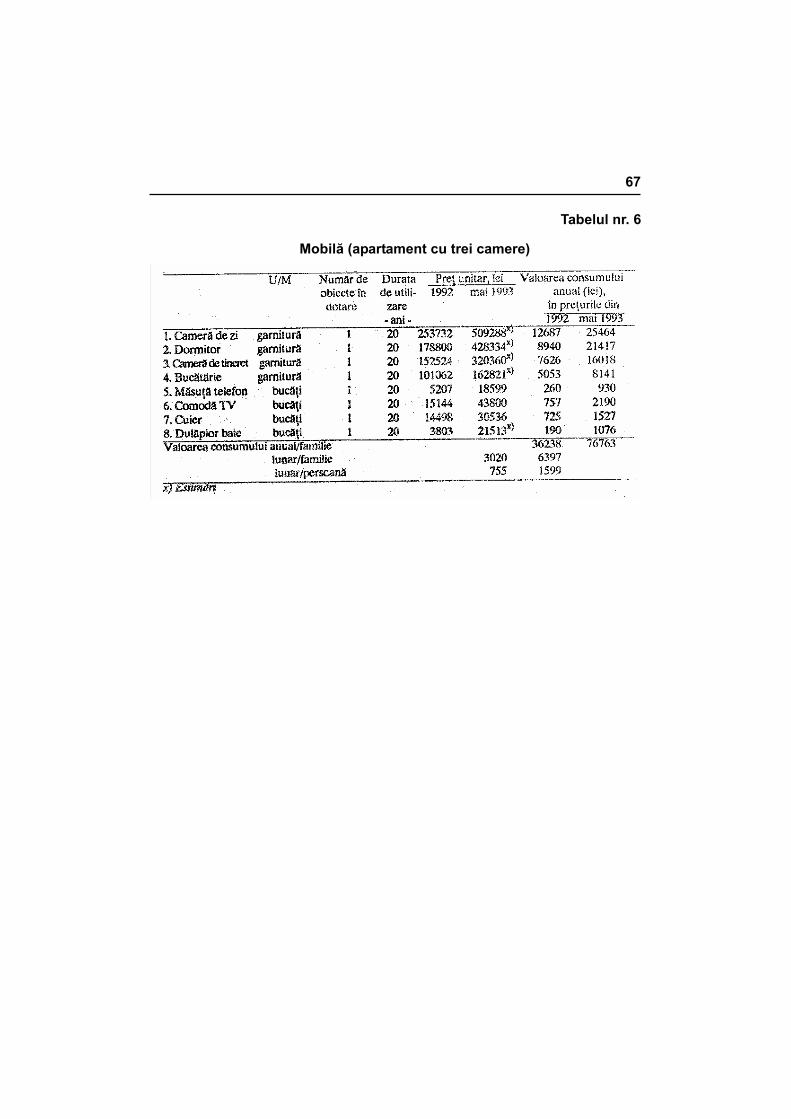
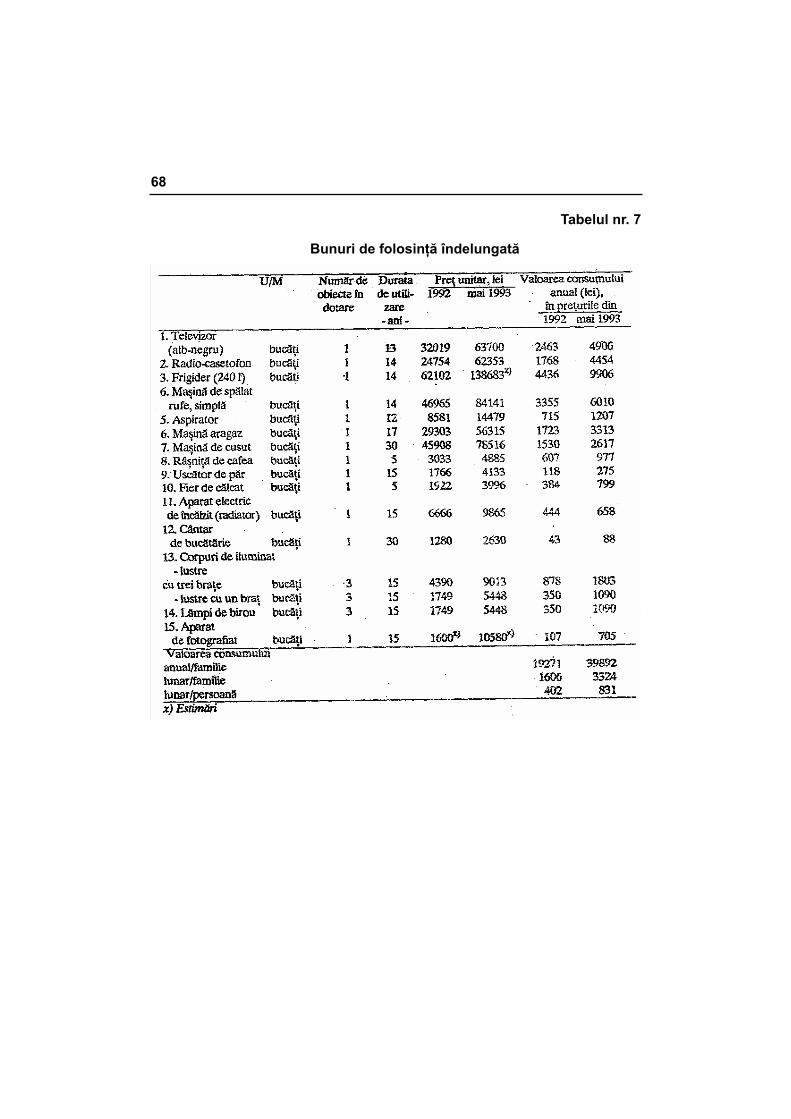
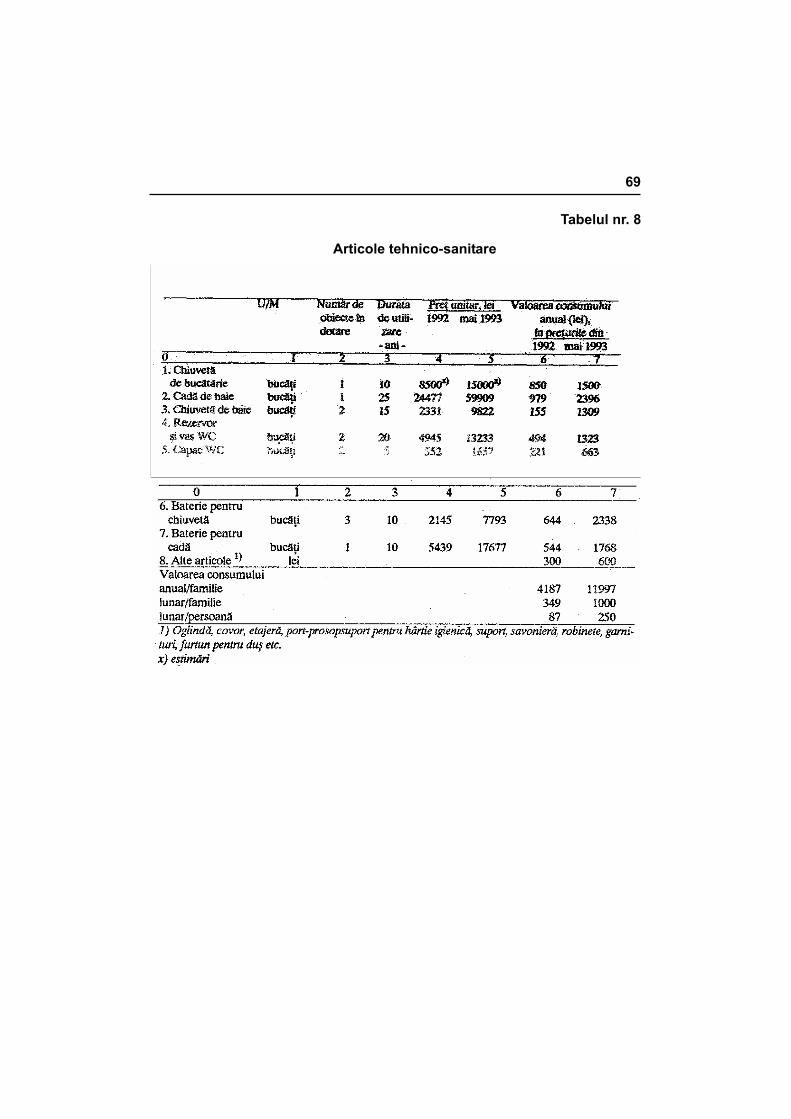
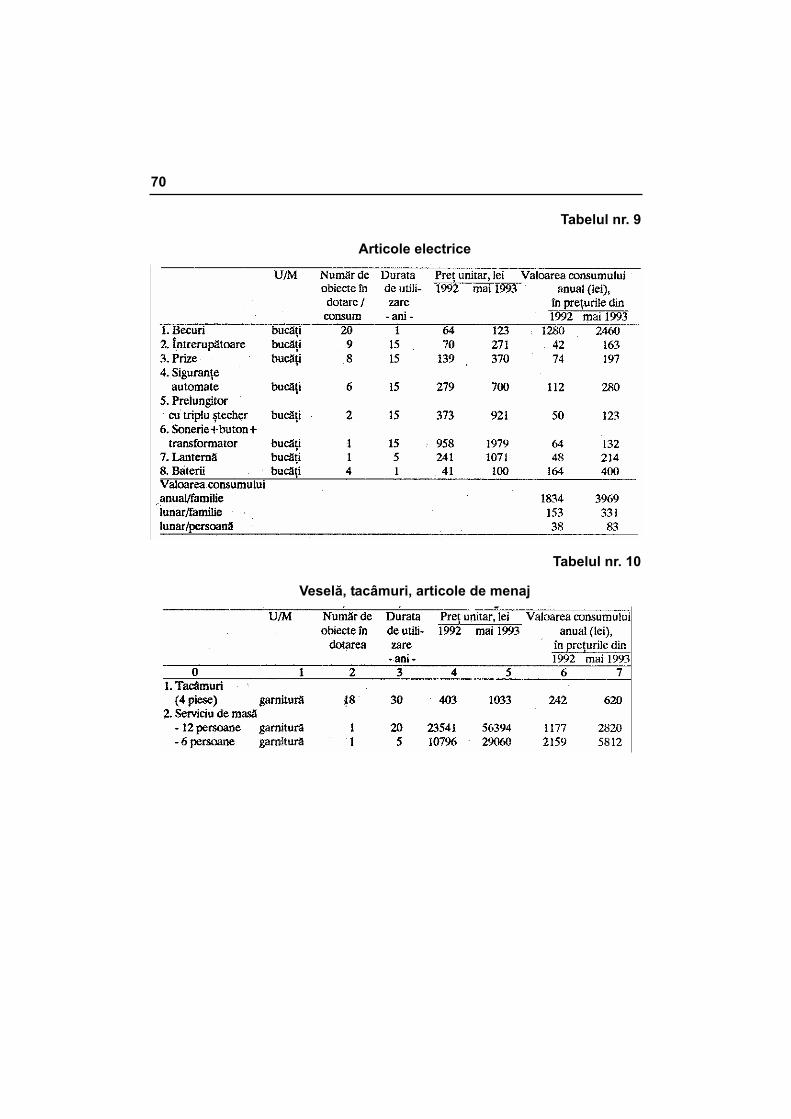
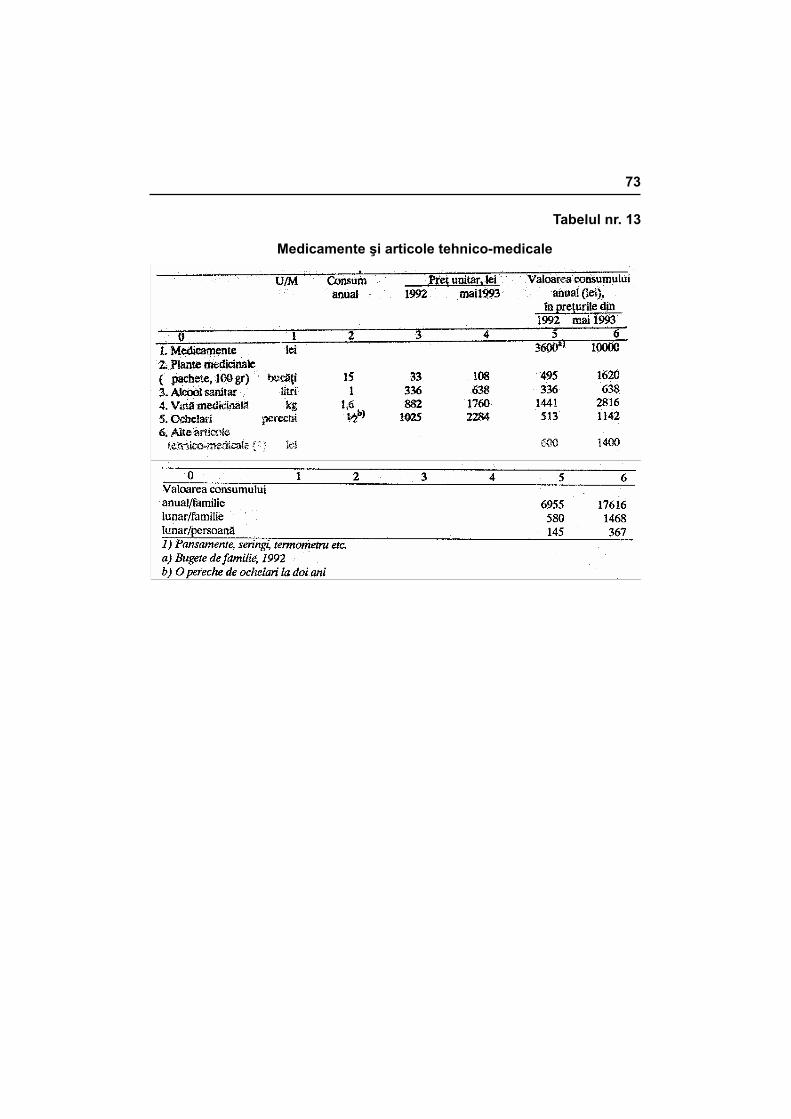
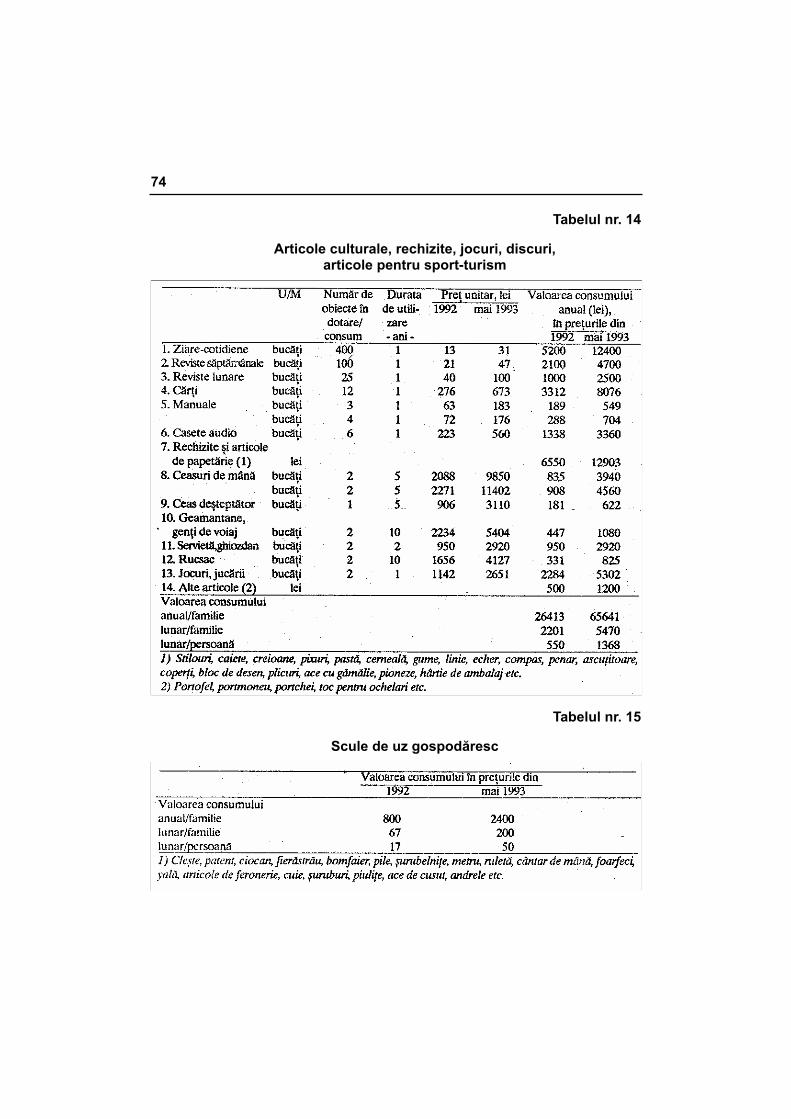
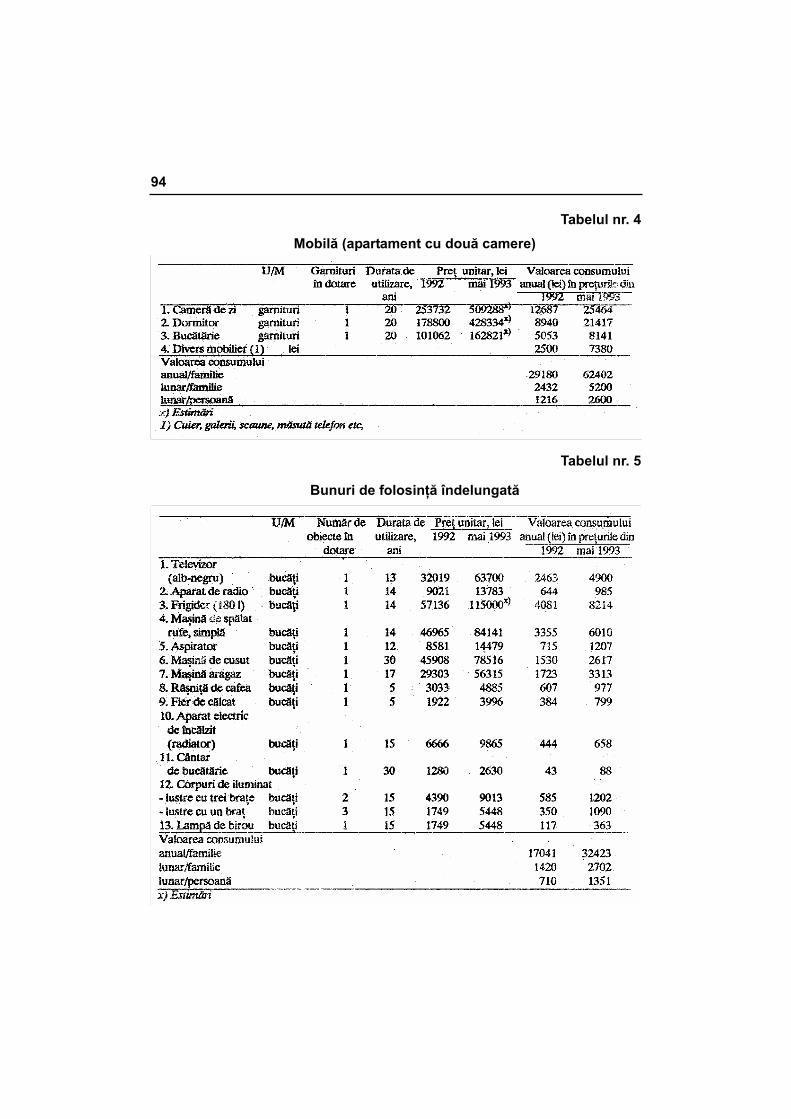
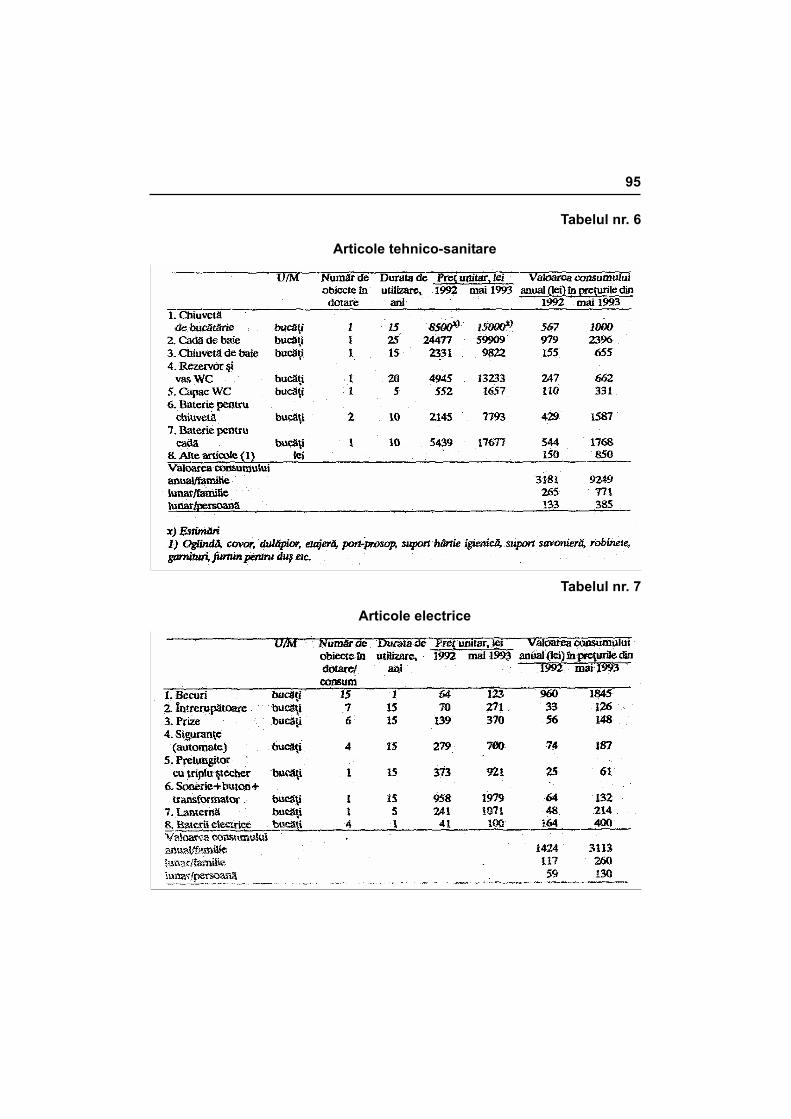
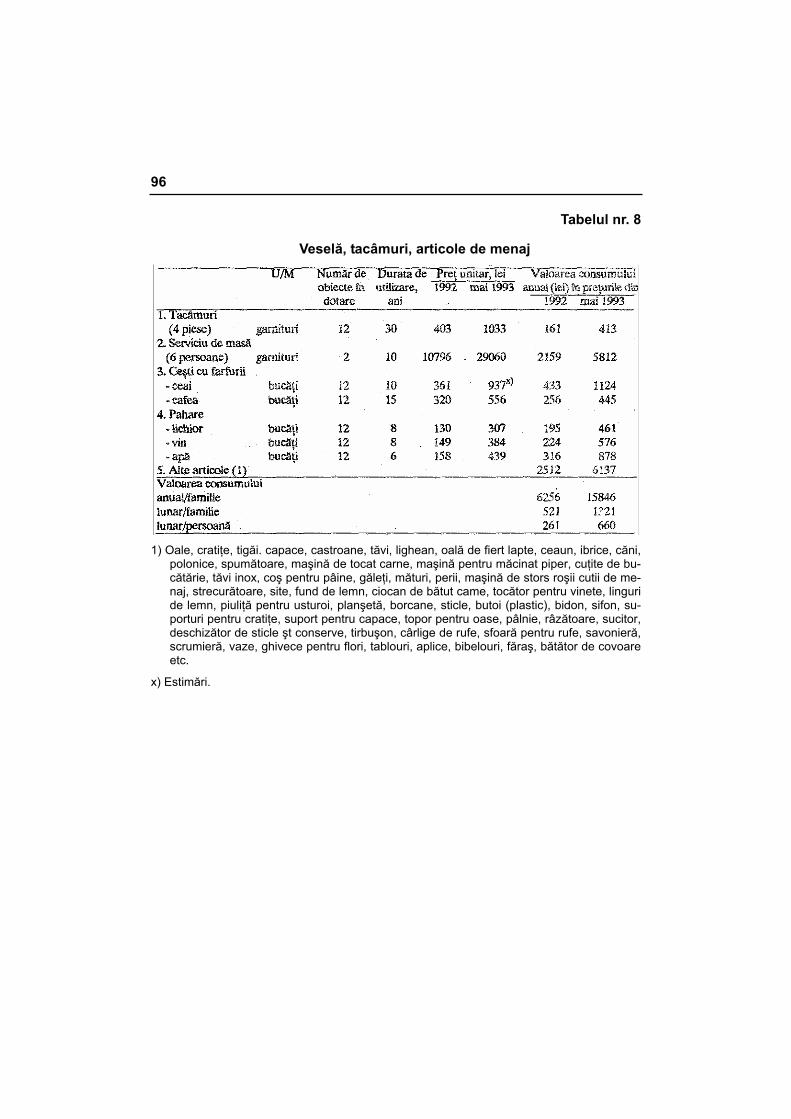
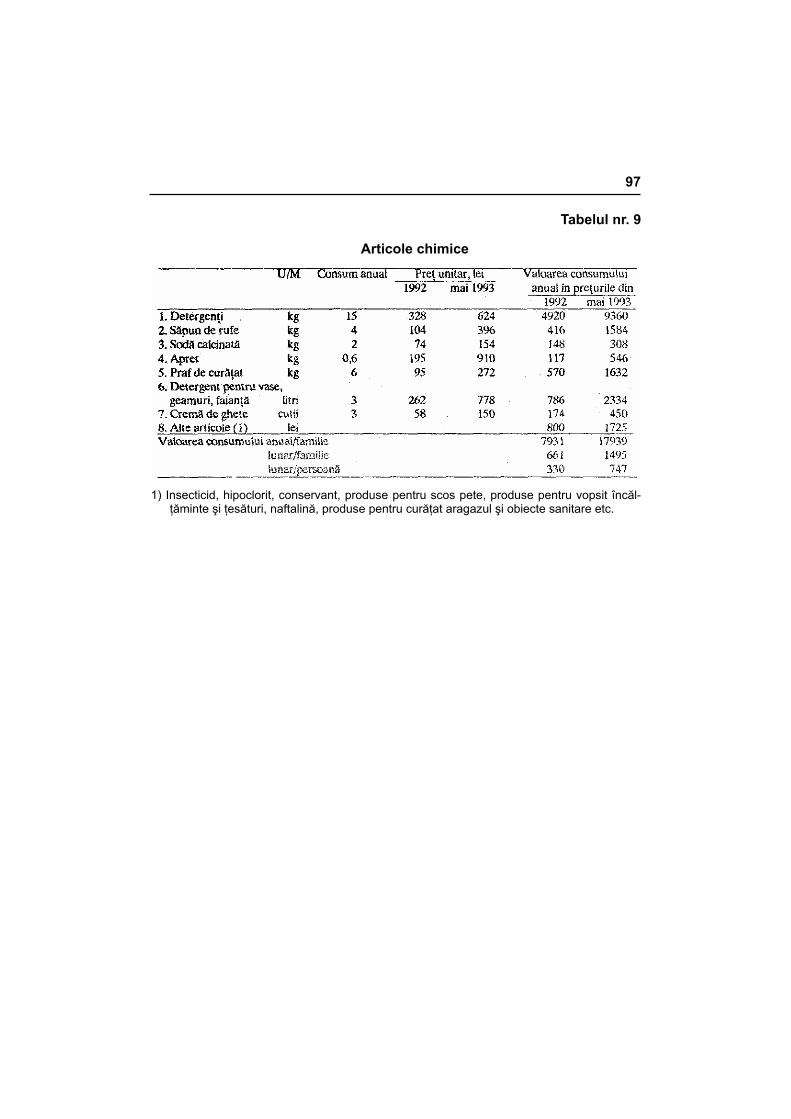
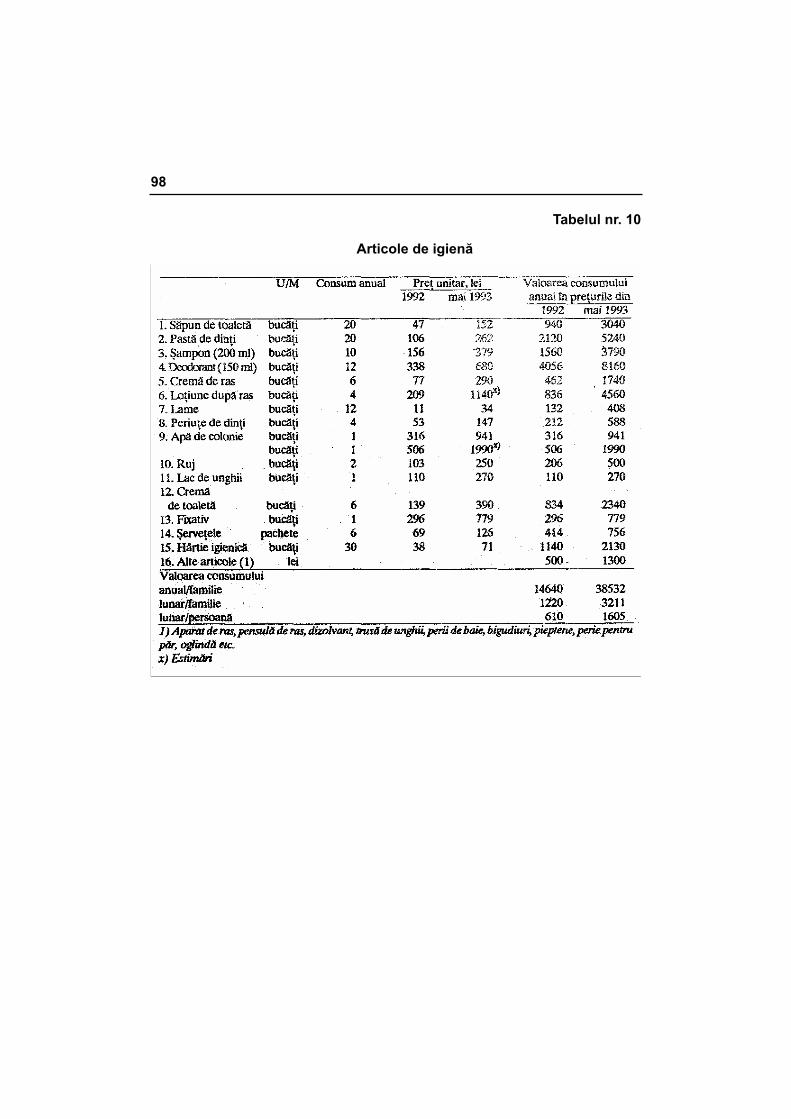
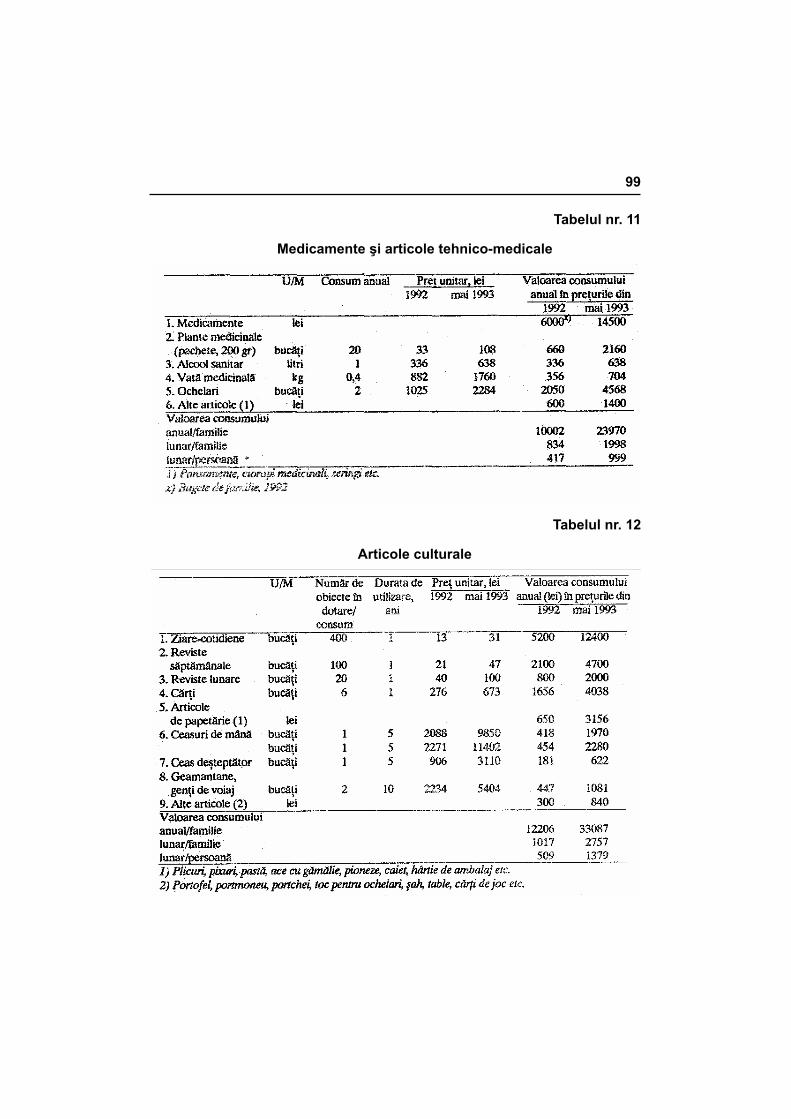
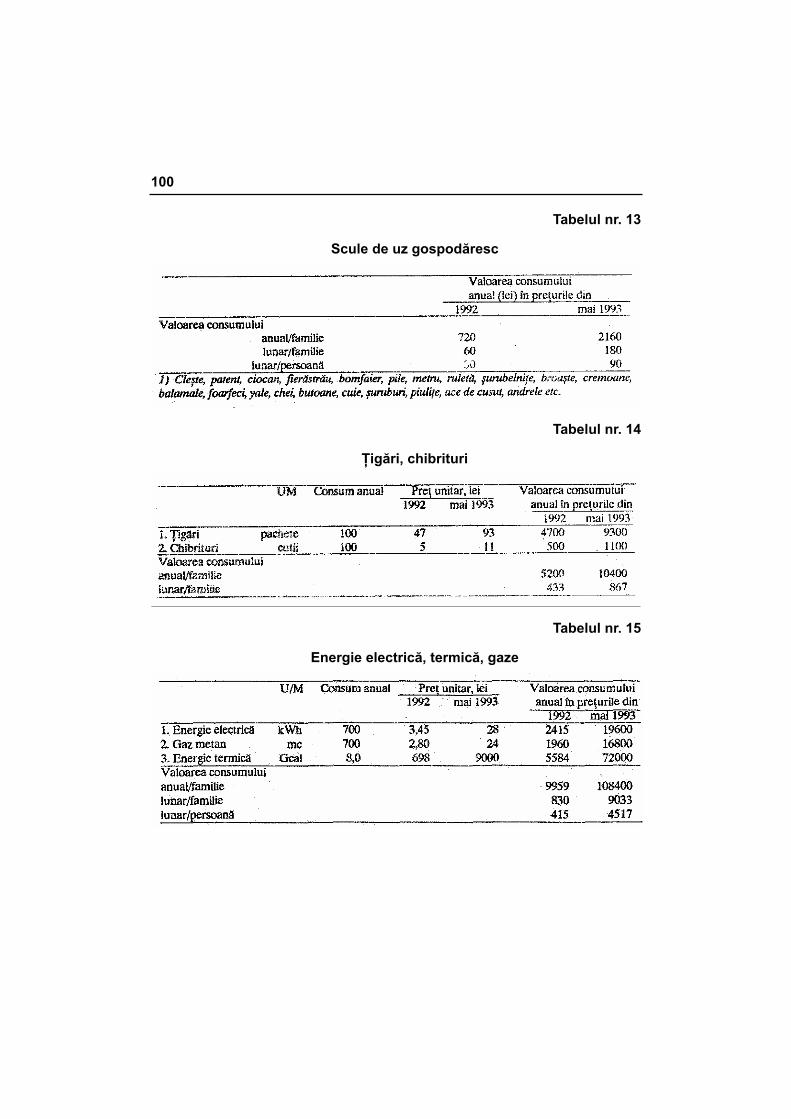
Evaluarea a fost efectuată analitic pentru 14 grupe de produse nealimen-tare: 1) îmbrăcăminte şi încălţăminte; 2) produse textile de uz gospodăresc; 3) mobilă; 4) bunuri de folosinţă îndelungată; 5) articole tehnico-sanitare; 6) arti-cole electrice; 7) veselă, tacâmuri, articole de menaj; 8) articole chimice; 9) ar-ticole de igienă; 10) medicamente şi articole tehnico-medicale, 11) articole cul-turale; 12) scule de uz gospodăresc; 13) ţigări, chibrituri; 14) energie electrică, termică, gaze.
S-a avut în vedere o gamă largă de produse necesare în consumul şi do-tarea familiilor şi gospodăriilor (225 poziţii). Pentru acestea a fost estimat con-sumul anual sau dotarea, precum şi durata de utilizare şi contravaloarea con-sumului anual, respectiv a cheltuielilor necesare înlocuirii bunurilor cu durată de folosinţă medie şi îndelungată (anexa nr. 2 şi anexa nr. 5).
Din totalitatea bunurilor nealimentare luate în considerare în calculul bu-getului de consum, pentru coşul de bunuri şi servicii de consum au fost selecţi-onate acele articole care deţin, în totalul bugetului de consum calculat, o pon-dere mai mare de 0,1 %. Acestea, în număr de 109 articole în cazul familiei de salariaţi, deţin 80% din bugetul aferent produselor nealimentare, calculat la preţurile din mai 1993. Cantităţile de produse nealimentare cuprinse în coşul
23
de consum (exprimate ca raport între numărul de obiecte în dotare şi durata de utilizare sau în cantităţi anuale pentru produsele de uz curent) şi valoarea con-sumului anual şi lunar de produse nealimentare sunt prezentate în partea a doua a studiului.
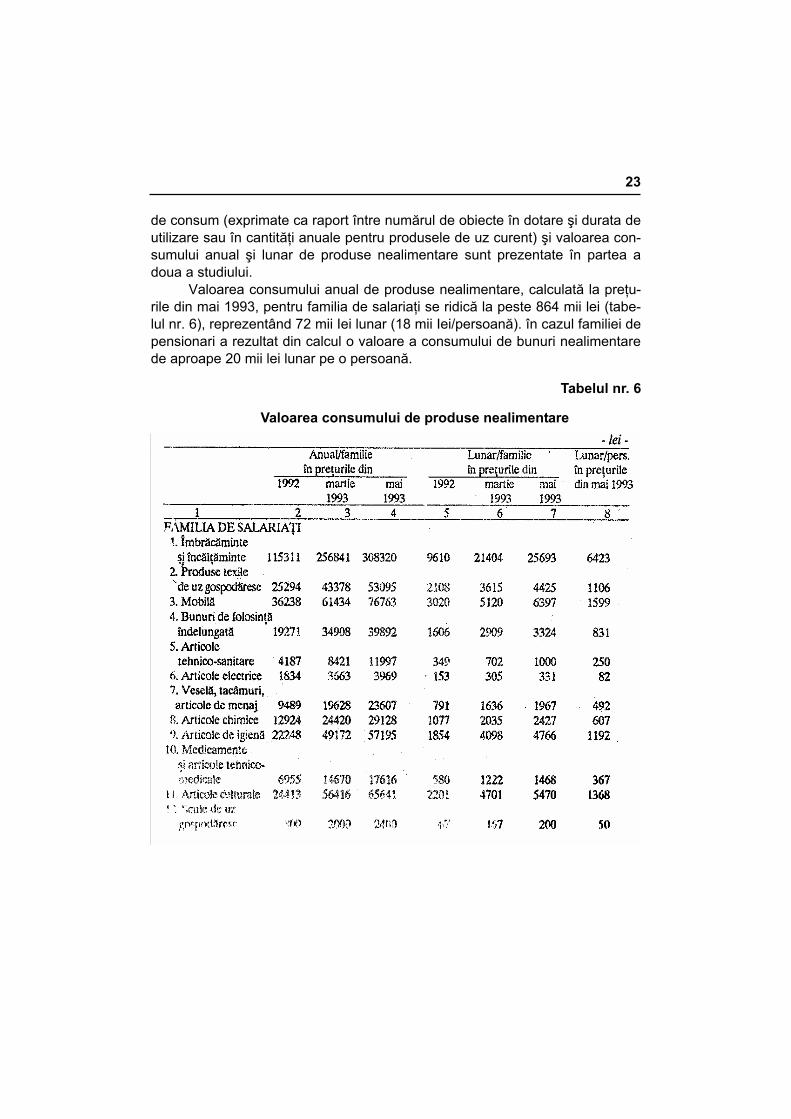
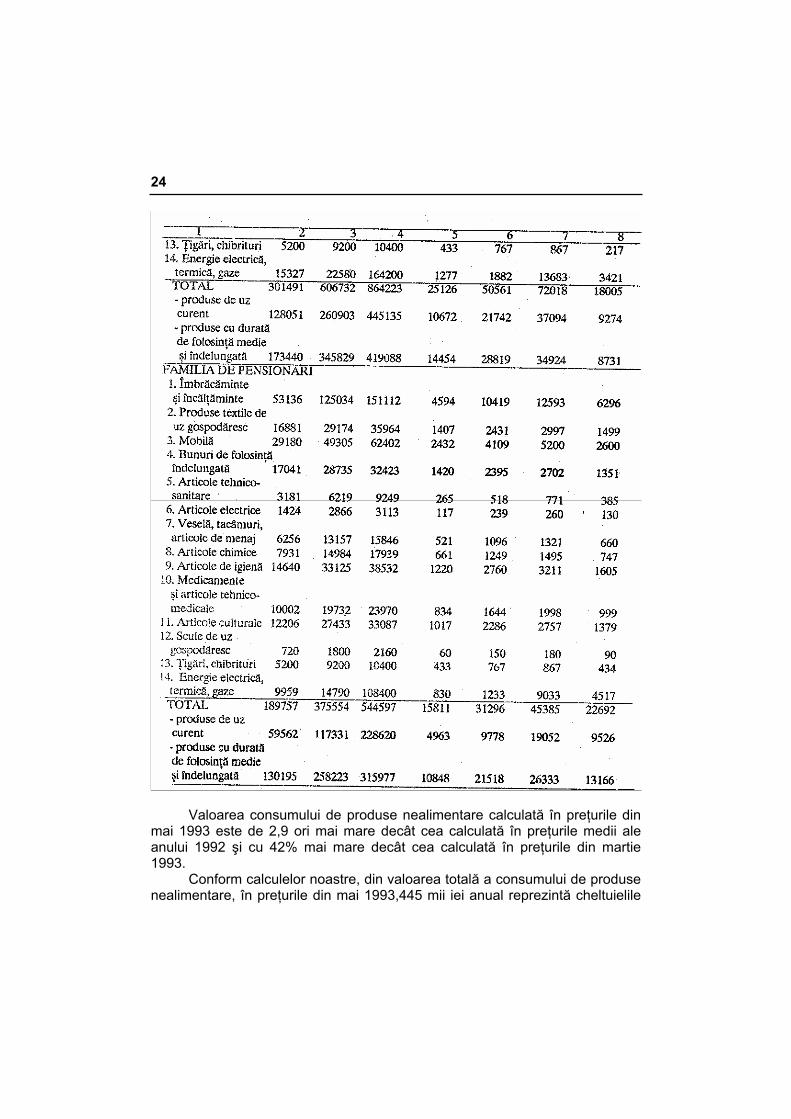
Valoarea consumului anual de produse nealimentare, calculată la preţu-rile din mai 1993, pentru familia de salariaţi se ridică la peste 864 mii lei (tabe-lul nr. 6), reprezentând 72 mii Iei lunar (18 mii Iei/persoană). în cazul familiei de pensionari a rezultat din calcul o valoare a consumului de bunuri nealimentare de aproape 20 mii lei lunar pe o persoană.
Tabelul nr. 6
Valoarea consumului de produse nealimentare
24
Valoarea consumului de produse nealimentare calculată în preţurile din
mai 1993 este de 2,9 ori mai mare decât cea calculată în preţurile medii ale anului 1992 şi cu 42% mai mare decât cea calculată în preţurile din martie 1993.
Conform calculelor noastre, din valoarea totală a consumului de produse nealimentare, în preţurile din mai 1993,445 mii iei anual reprezintă cheltuielile
25
necesare cumpătării bunurilor de consum curent (articole de igienă, detergenţi, medicamente, ziare, rechizite, energie electrică, termică, gaze, o parte din gar-derobă etc.). Cealaltă parte, respectiv 419 mii lei anual reprezintă cheltuielile necesare înlocuirii unei părţi din bunurile existente în dotarea gospodăriei şi din garderobă.
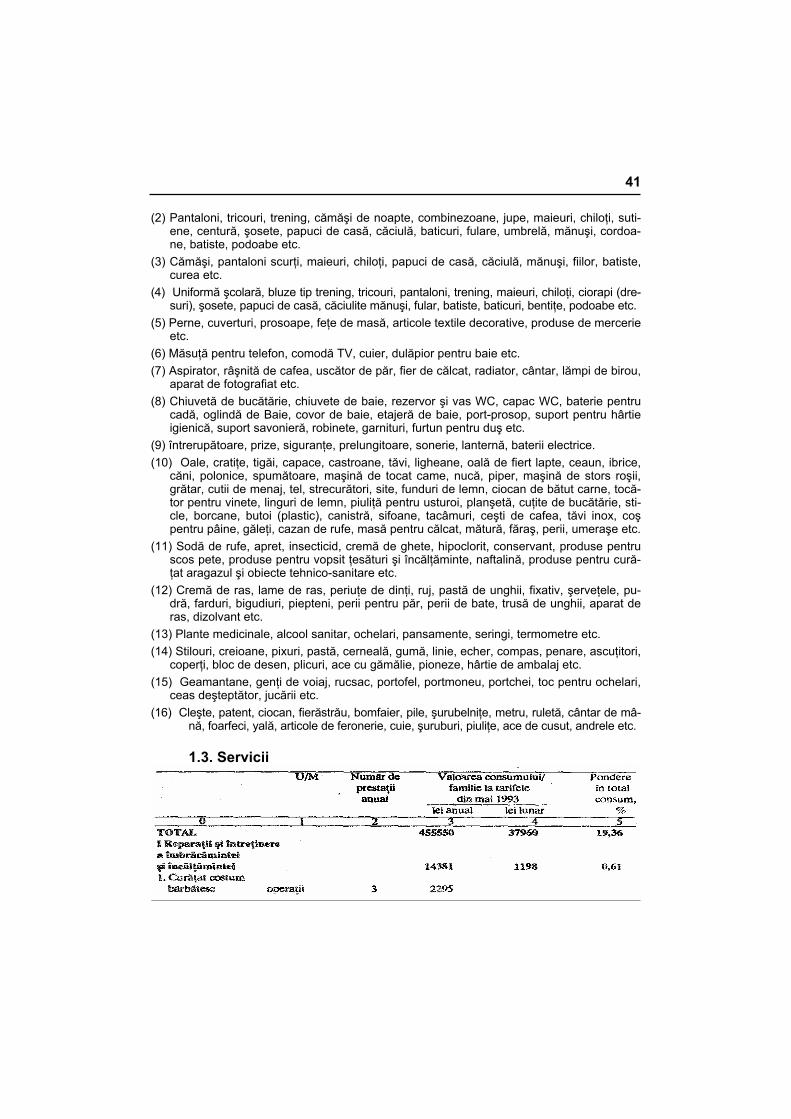
4. Servicii
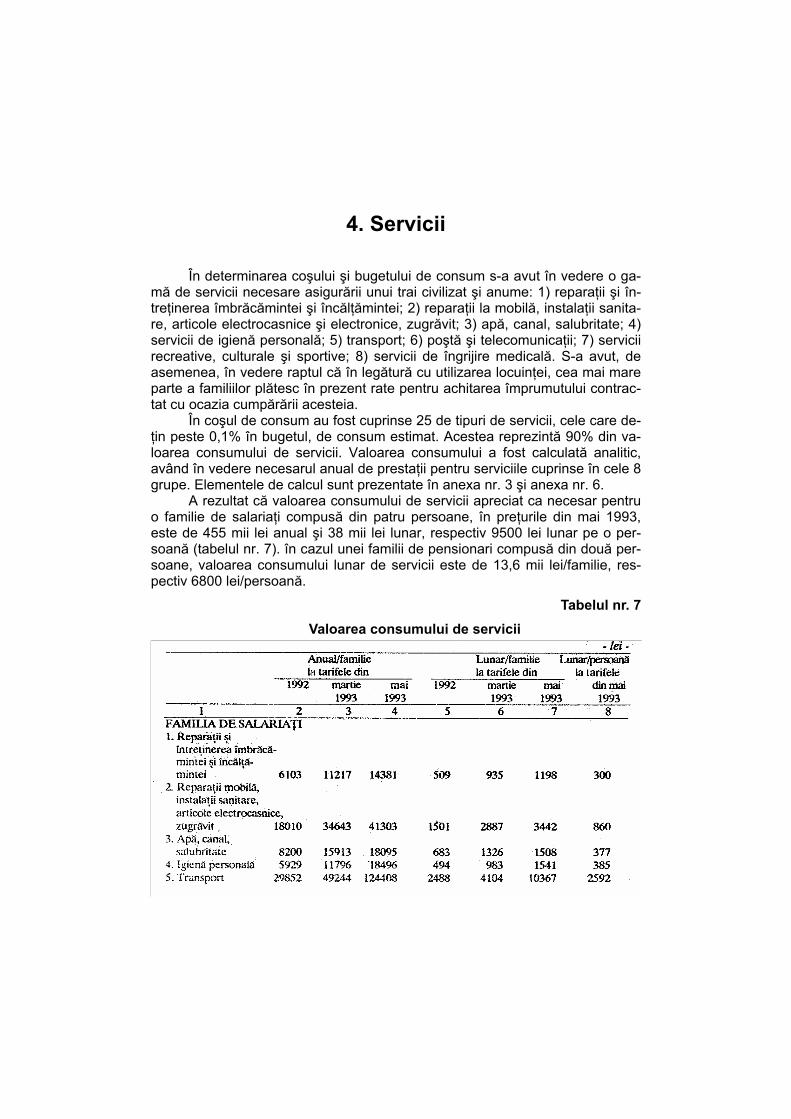
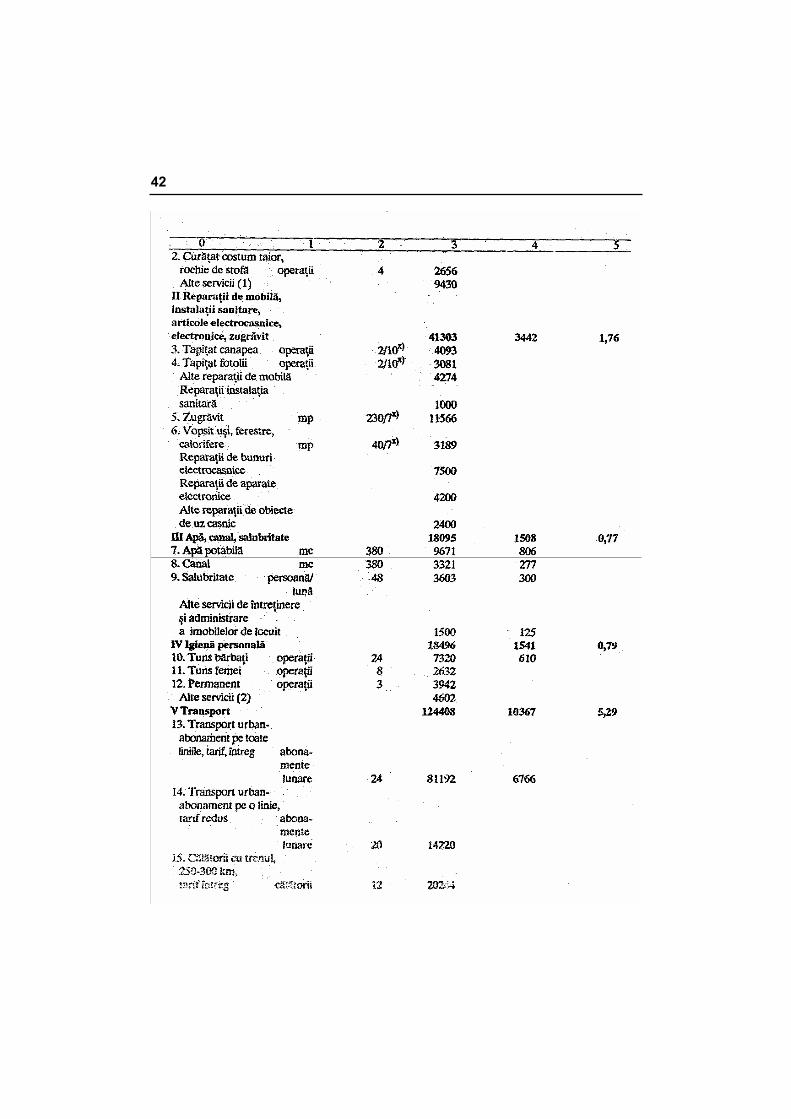
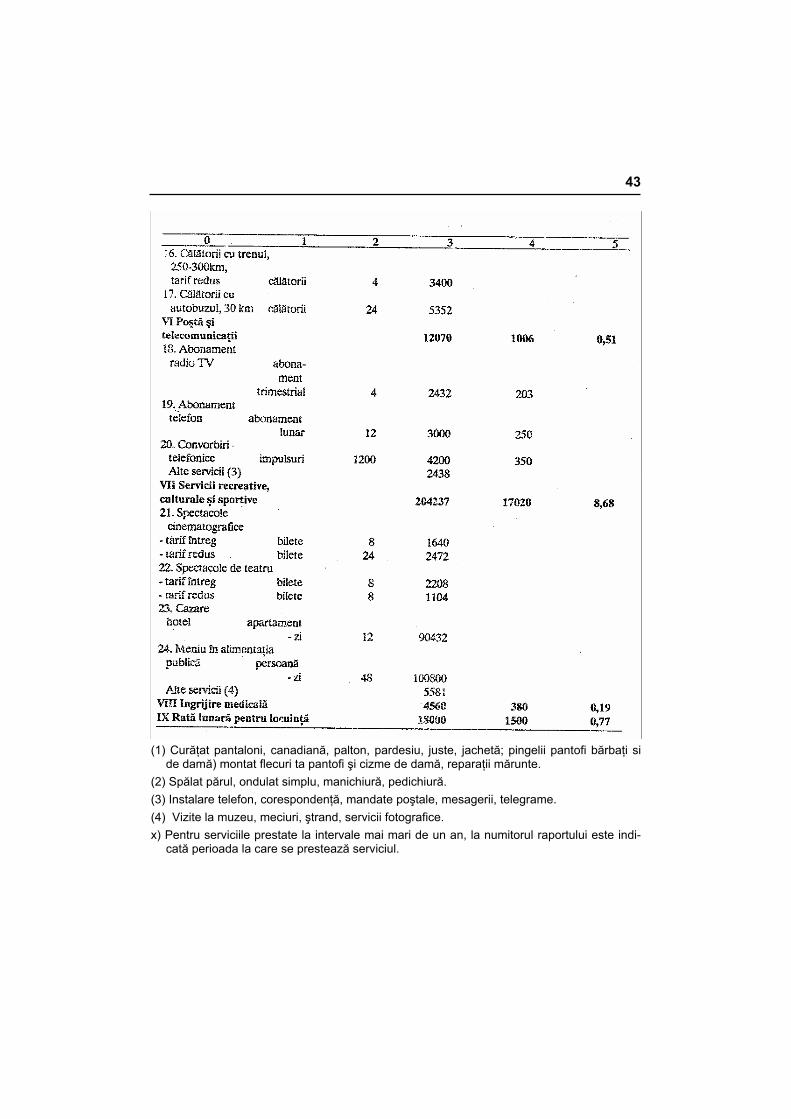
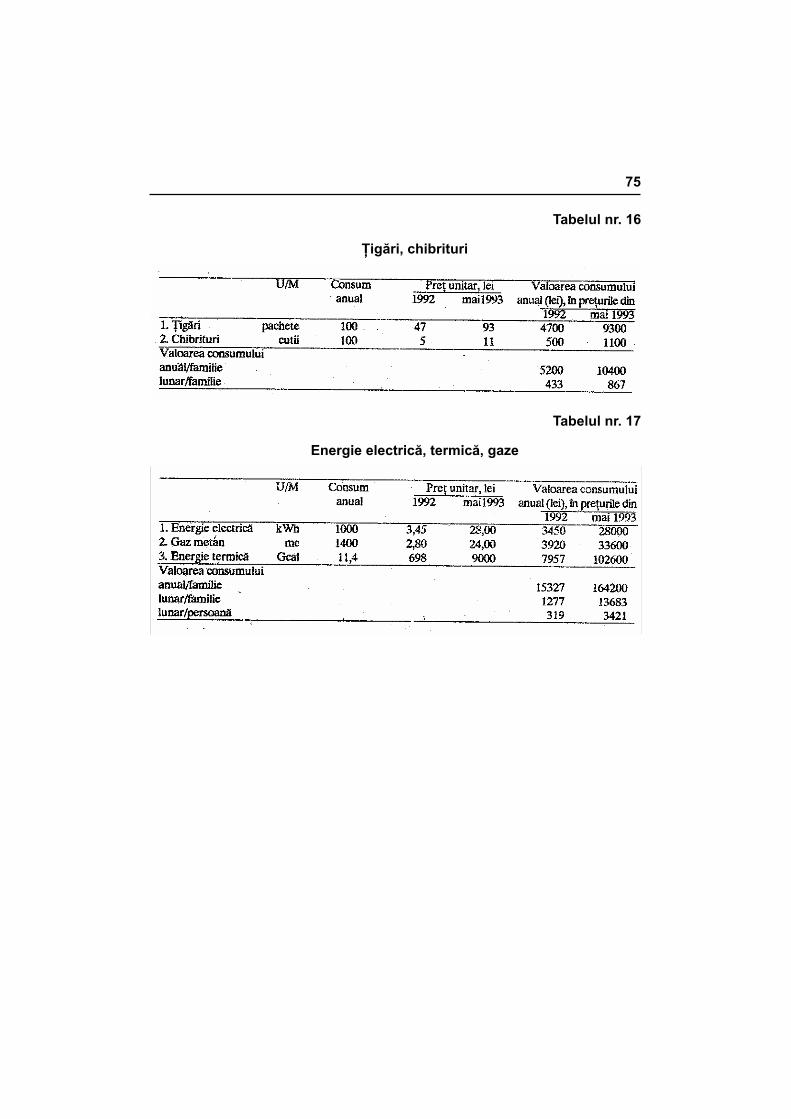
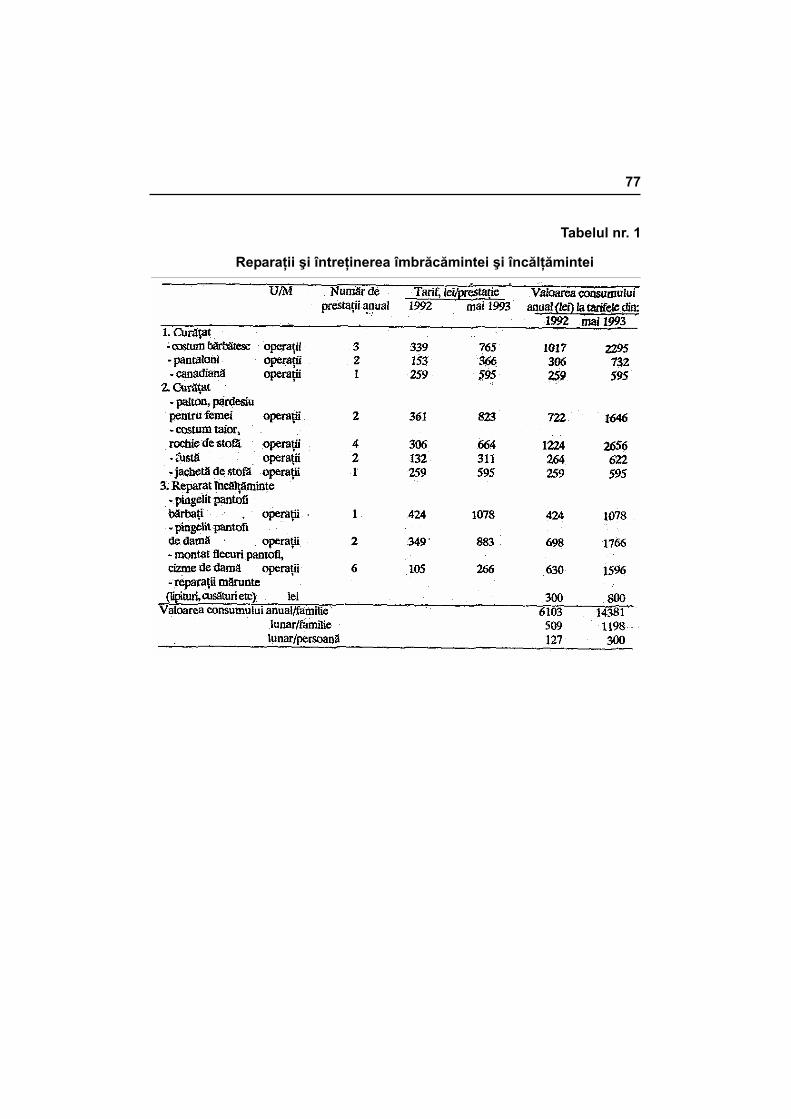
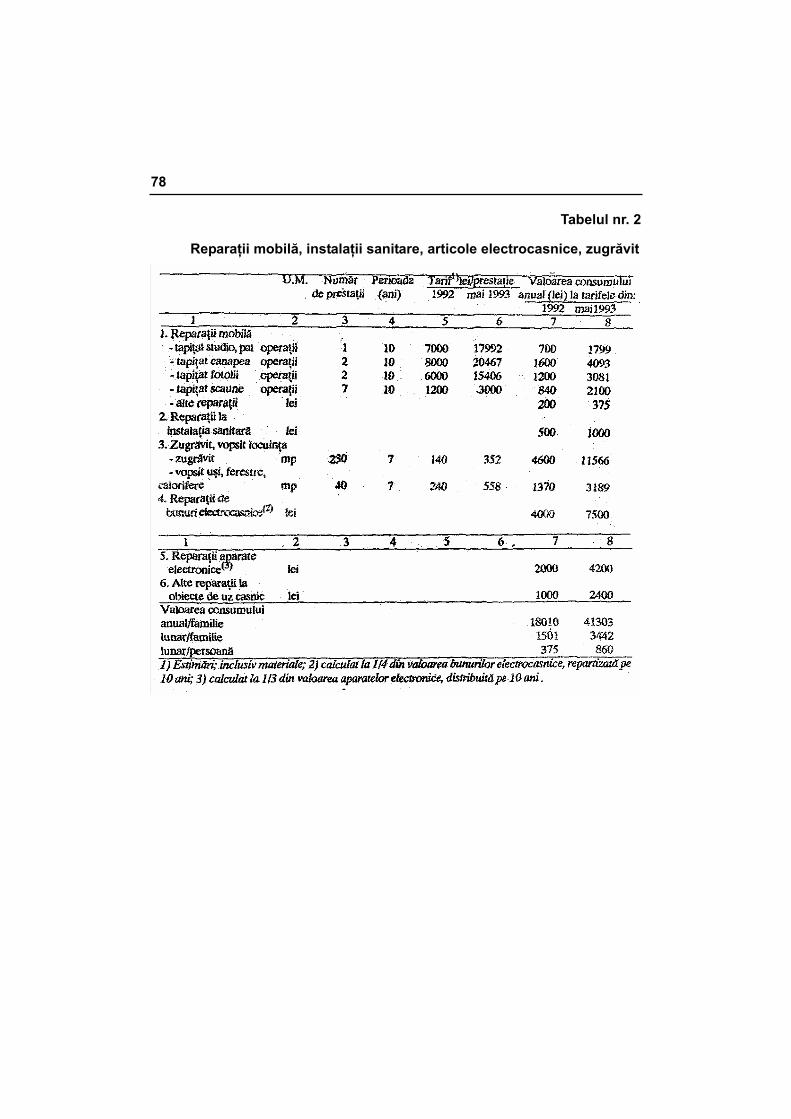
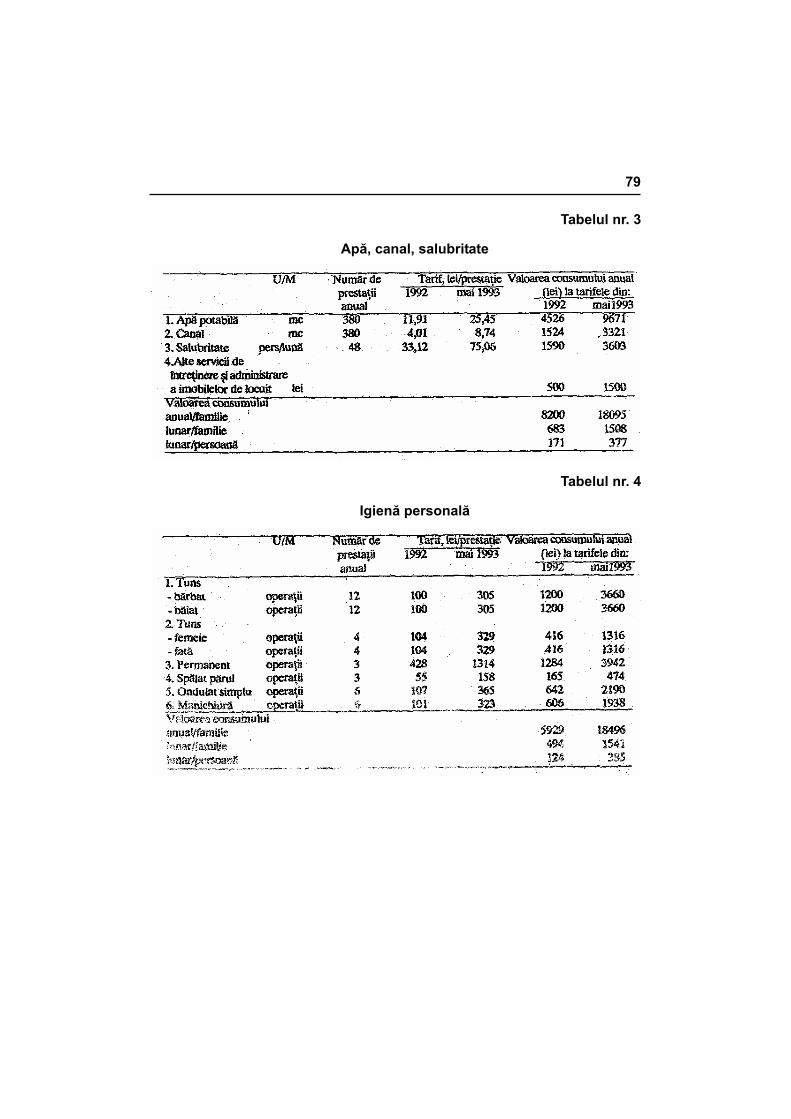
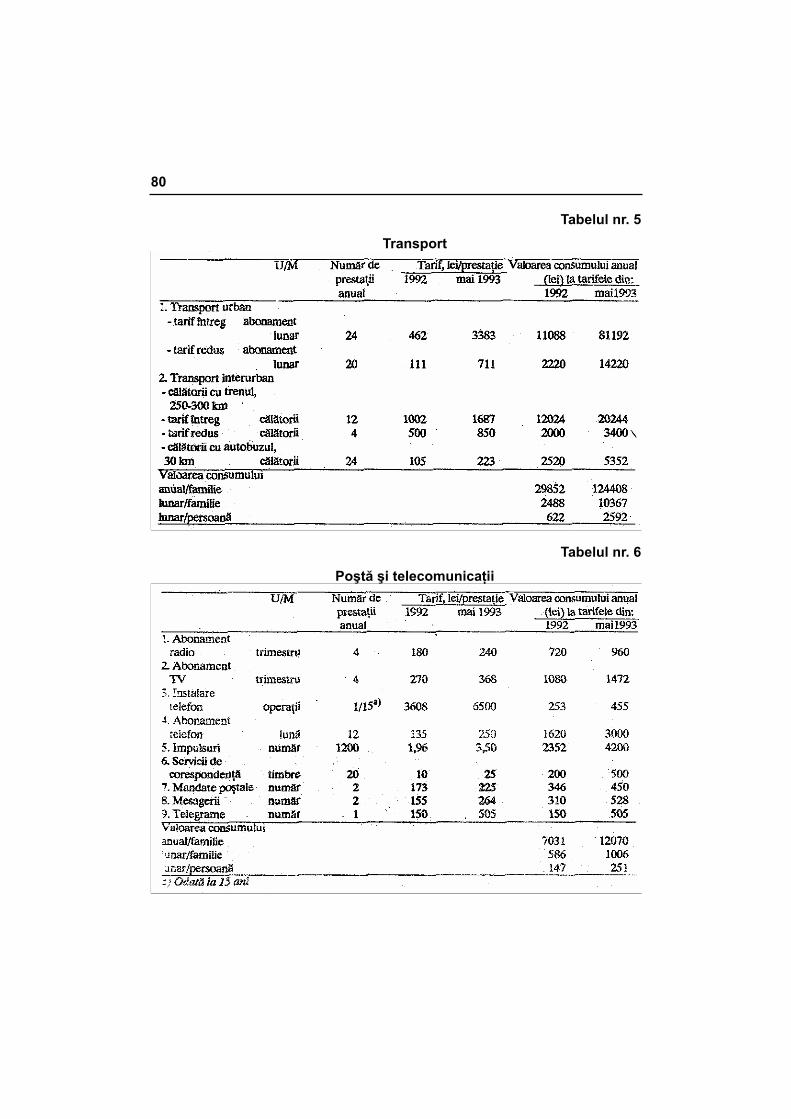
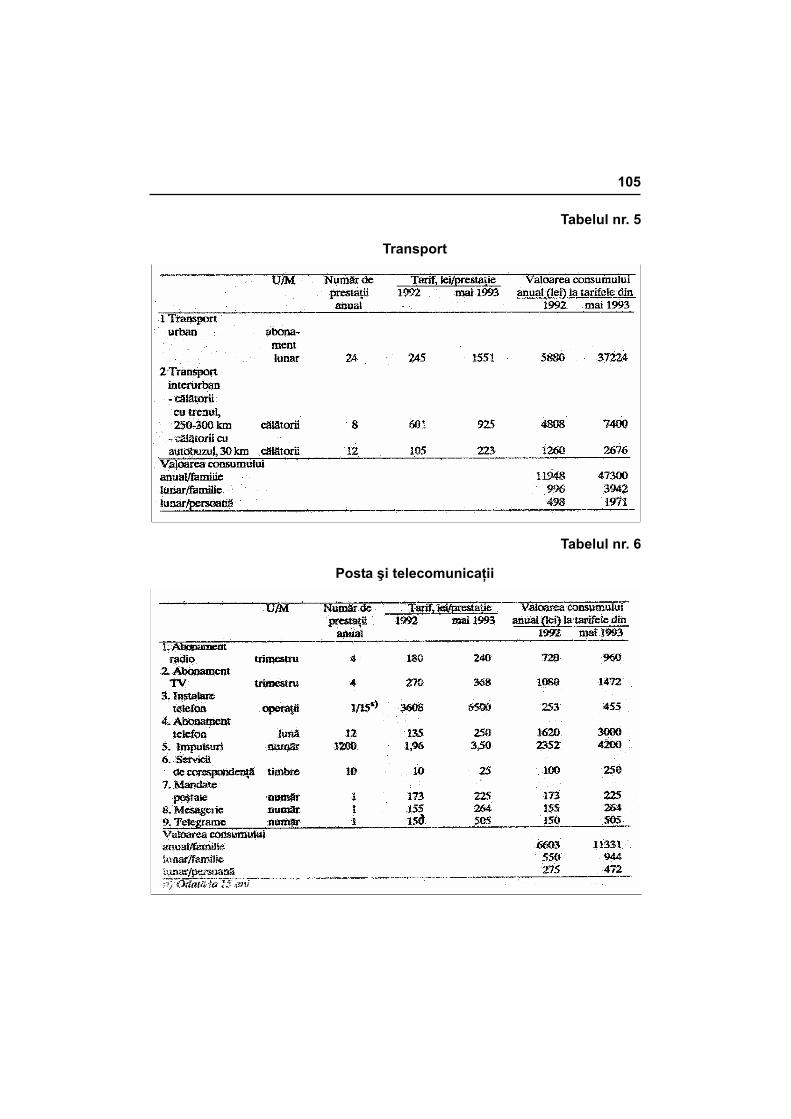
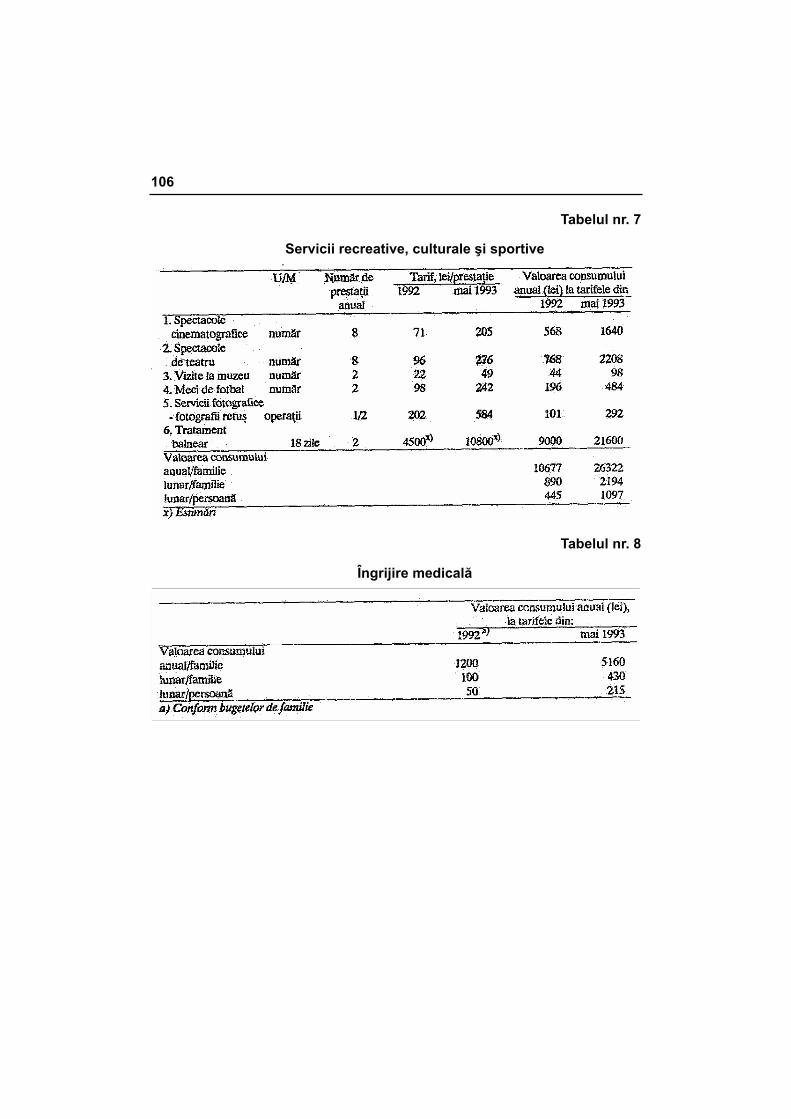
În determinarea coşului şi bugetului de consum s-a avut în vedere o ga-mă de servicii necesare asigurării unui trai civilizat şi anume: 1) reparaţii şi în-treţinerea îmbrăcămintei şi încălţămintei; 2) reparaţii la mobilă, instalaţii sanita-re, articole electrocasnice şi electronice, zugrăvit; 3) apă, canal, salubritate; 4) servicii de igienă personală; 5) transport; 6) poştă şi telecomunicaţii; 7) servicii recreative, culturale şi sportive; 8) servicii de îngrijire medicală. S-a avut, de asemenea, în vedere raptul că în legătură cu utilizarea locuinţei, cea mai mare parte a familiilor plătesc în prezent rate pentru achitarea împrumutului contrac-tat cu ocazia cumpărării acesteia.
În coşul de consum au fost cuprinse 25 de tipuri de servicii, cele care de-ţin peste 0,1% în bugetul, de consum estimat. Acestea reprezintă 90% din va-loarea consumului de servicii. Valoarea consumului a fost calculată analitic, având în vedere necesarul anual de prestaţii pentru serviciile cuprinse în cele 8 grupe. Elementele de calcul sunt prezentate în anexa nr. 3 şi anexa nr. 6.
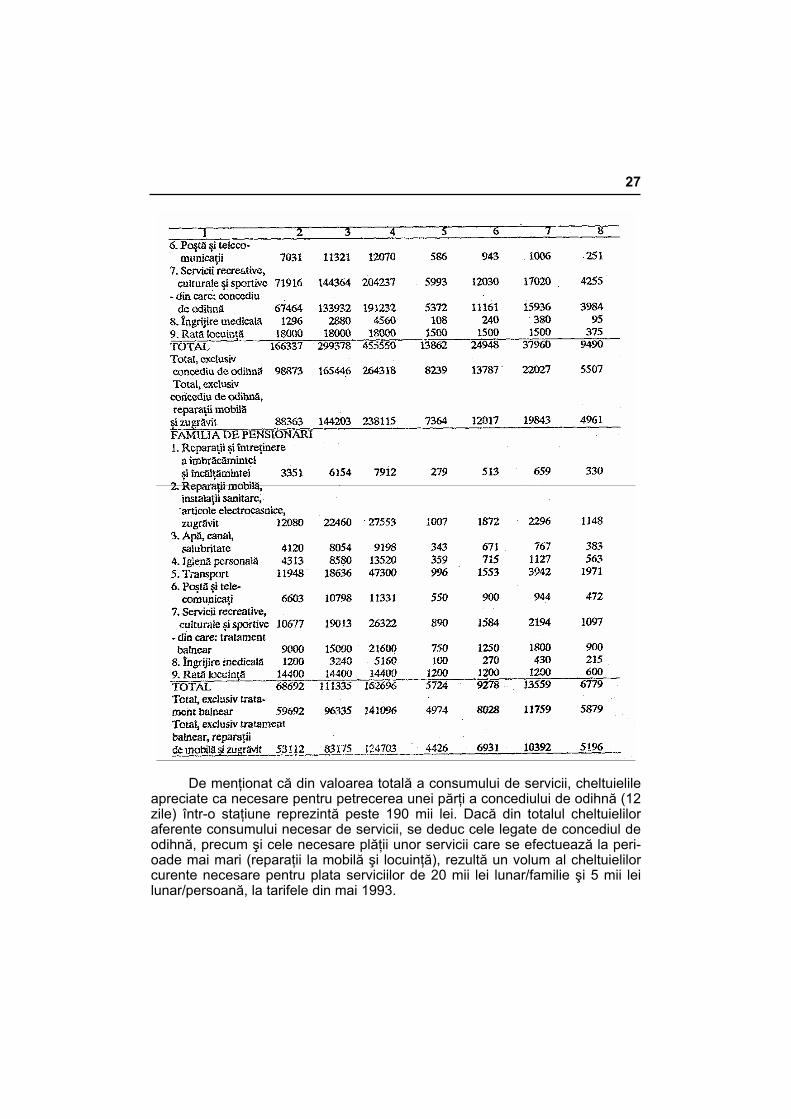
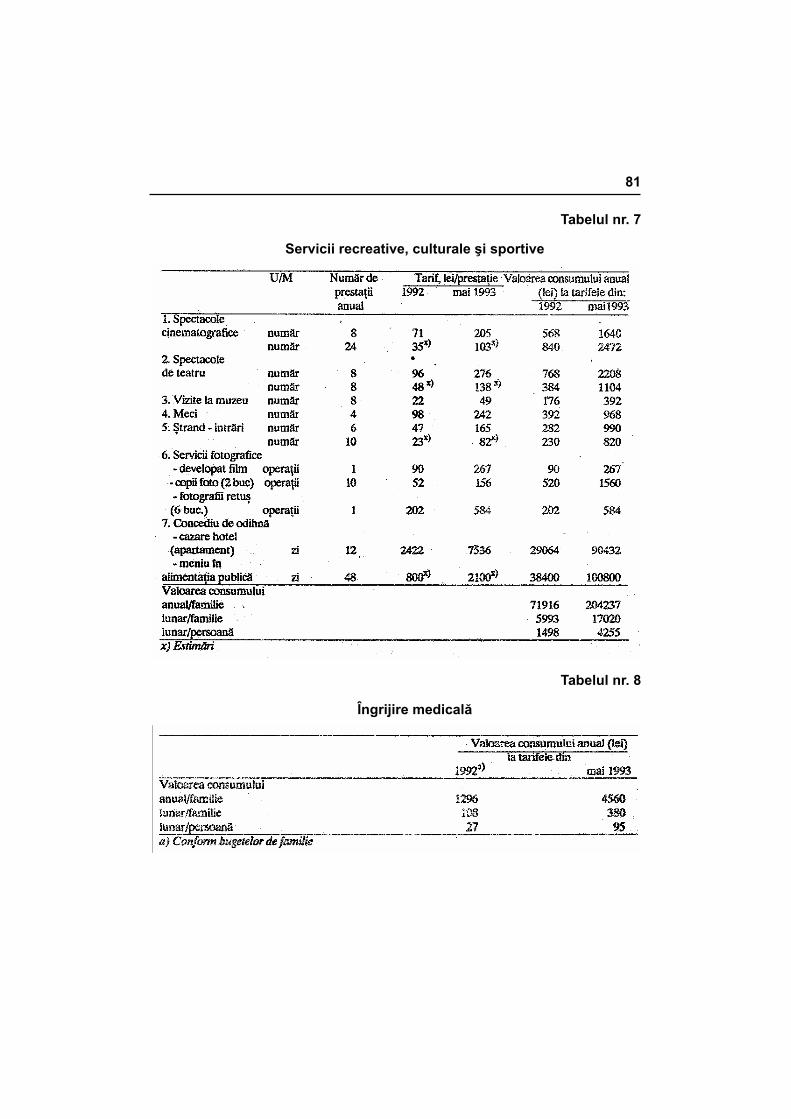
A rezultat că valoarea consumului de servicii apreciat ca necesar pentru o familie de salariaţi compusă din patru persoane, în preţurile din mai 1993, este de 455 mii lei anual şi 38 mii lei lunar, respectiv 9500 lei lunar pe o per-soană (tabelul nr. 7). în cazul unei familii de pensionari compusă din două per-soane, valoarea consumului lunar de servicii este de 13,6 mii lei/familie, res-pectiv 6800 lei/persoană.
Tabelul nr. 7 Valoarea consumului de servicii
27
De menţionat că din valoarea totală a consumului de servicii, cheltuielile
apreciate ca necesare pentru petrecerea unei părţi a concediului de odihnă (12 zile) într-o staţiune reprezintă peste 190 mii lei. Dacă din totalul cheltuielilor aferente consumului necesar de servicii, se deduc cele legate de concediul de odihnă, precum şi cele necesare plăţii unor servicii care se efectuează la peri-oade mai mari (reparaţii la mobilă şi locuinţă), rezultă un volum al cheltuielilor curente necesare pentru plata serviciilor de 20 mii lei lunar/familie şi 5 mii lei lunar/persoană, la tarifele din mai 1993.
5. Bugetul total de consum
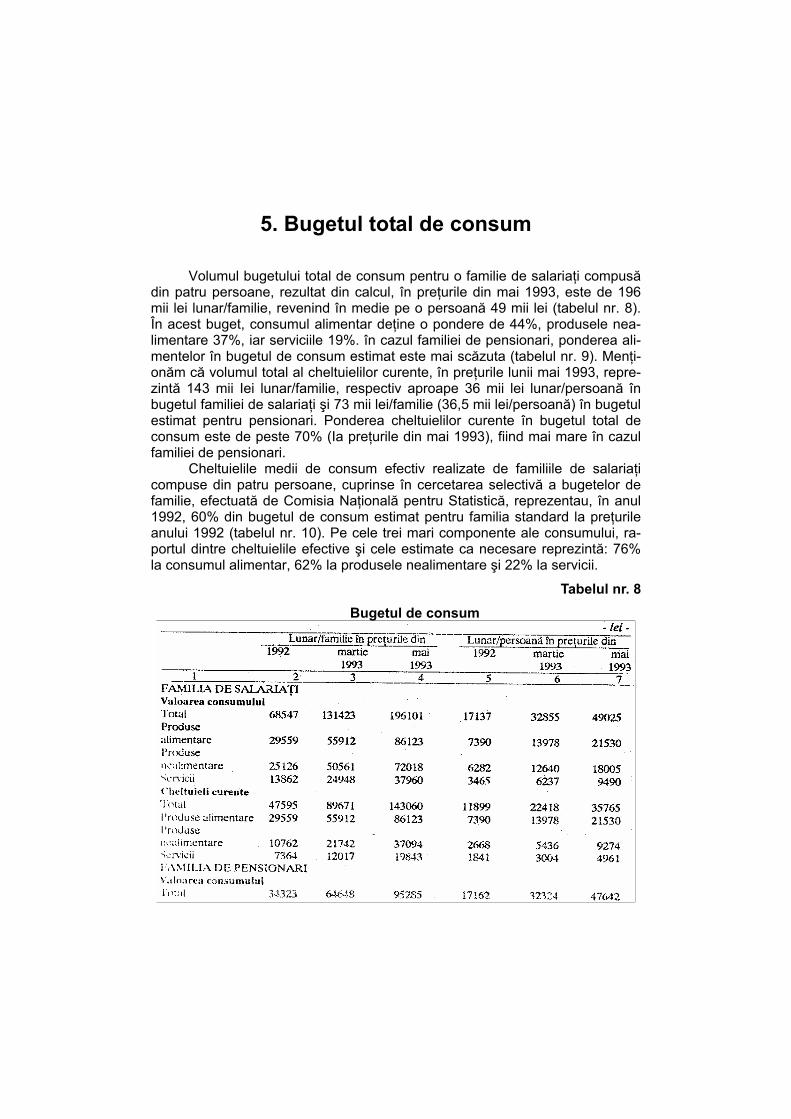
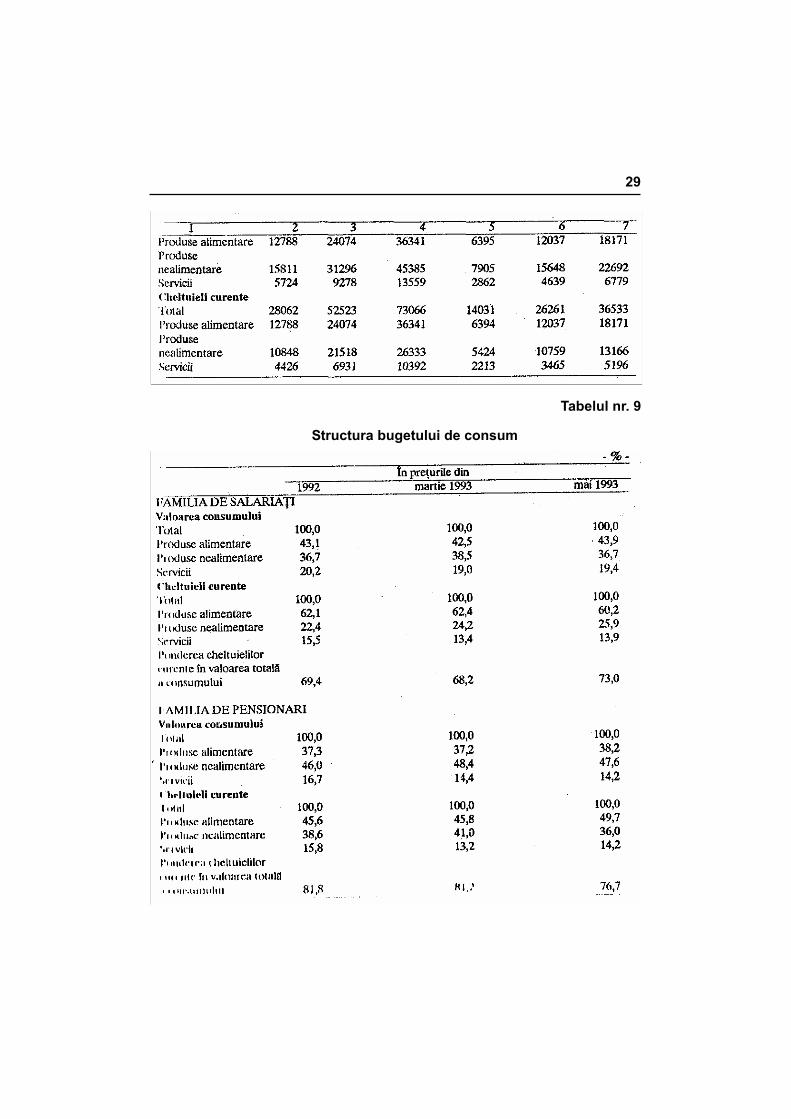
Volumul bugetului total de consum pentru o familie de salariaţi compusă din patru persoane, rezultat din calcul, în preţurile din mai 1993, este de 196 mii lei lunar/familie, revenind în medie pe o persoană 49 mii lei (tabelul nr. 8). În acest buget, consumul alimentar deţine o pondere de 44%, produsele nea-limentare 37%, iar serviciile 19%. în cazul familiei de pensionari, ponderea ali-mentelor în bugetul de consum estimat este mai scăzuta (tabelul nr. 9). Menţi-onăm că volumul total al cheltuielilor curente, în preţurile lunii mai 1993, repre-zintă 143 mii Iei lunar/familie, respectiv aproape 36 mii lei lunar/persoană în bugetul familiei de salariaţi şi 73 mii lei/familie (36,5 mii lei/persoană) în bugetul estimat pentru pensionari. Ponderea cheltuielilor curente în bugetul total de consum este de peste 70% (Ia preţurile din mai 1993), fiind mai mare în cazul familiei de pensionari.
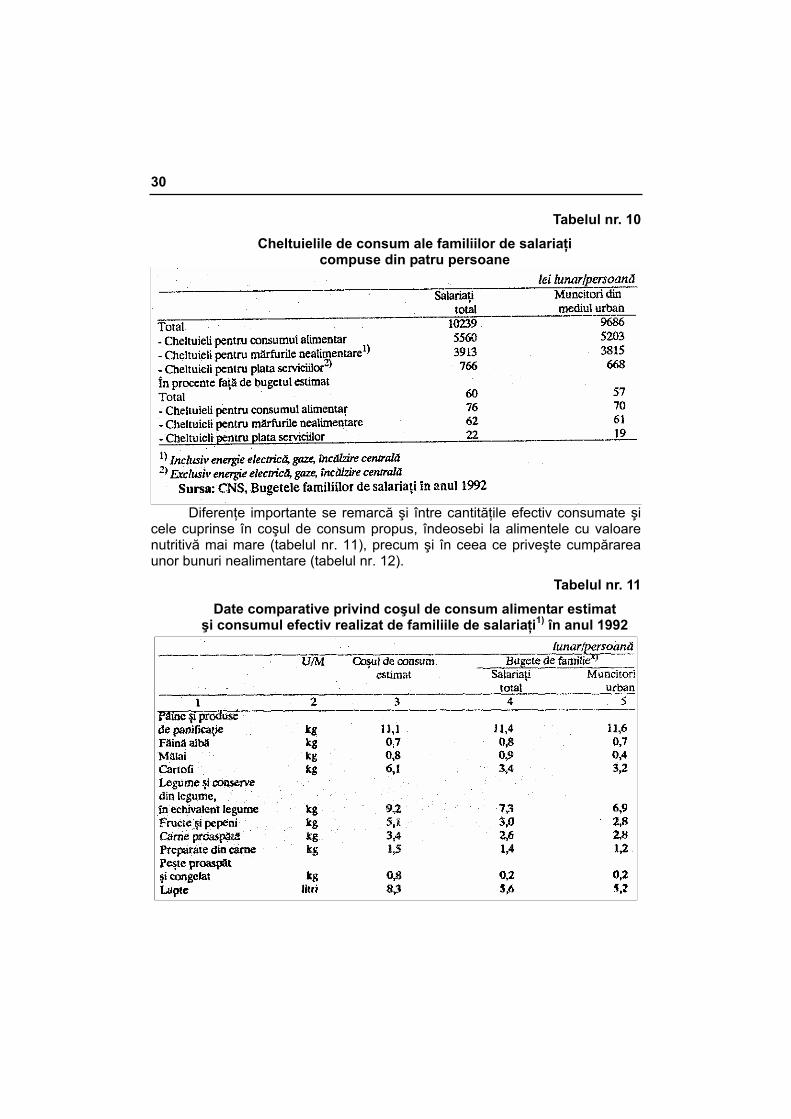
Cheltuielile medii de consum efectiv realizate de familiile de salariaţi compuse din patru persoane, cuprinse în cercetarea selectivă a bugetelor de familie, efectuată de Comisia Naţională pentru Statistică, reprezentau, în anul 1992, 60% din bugetul de consum estimat pentru familia standard la preţurile anului 1992 (tabelul nr. 10). Pe cele trei mari componente ale consumului, ra-portul dintre cheltuielile efective şi cele estimate ca necesare reprezintă: 76% la consumul alimentar, 62% la produsele nealimentare şi 22% la servicii.
Tabelul nr. 8 Bugetul de consum
29
Tabelul nr. 9
Structura bugetului de consum
30
Tabelul nr. 10 Cheltuielile de consum ale familiilor de salariaţi
compuse din patru persoane
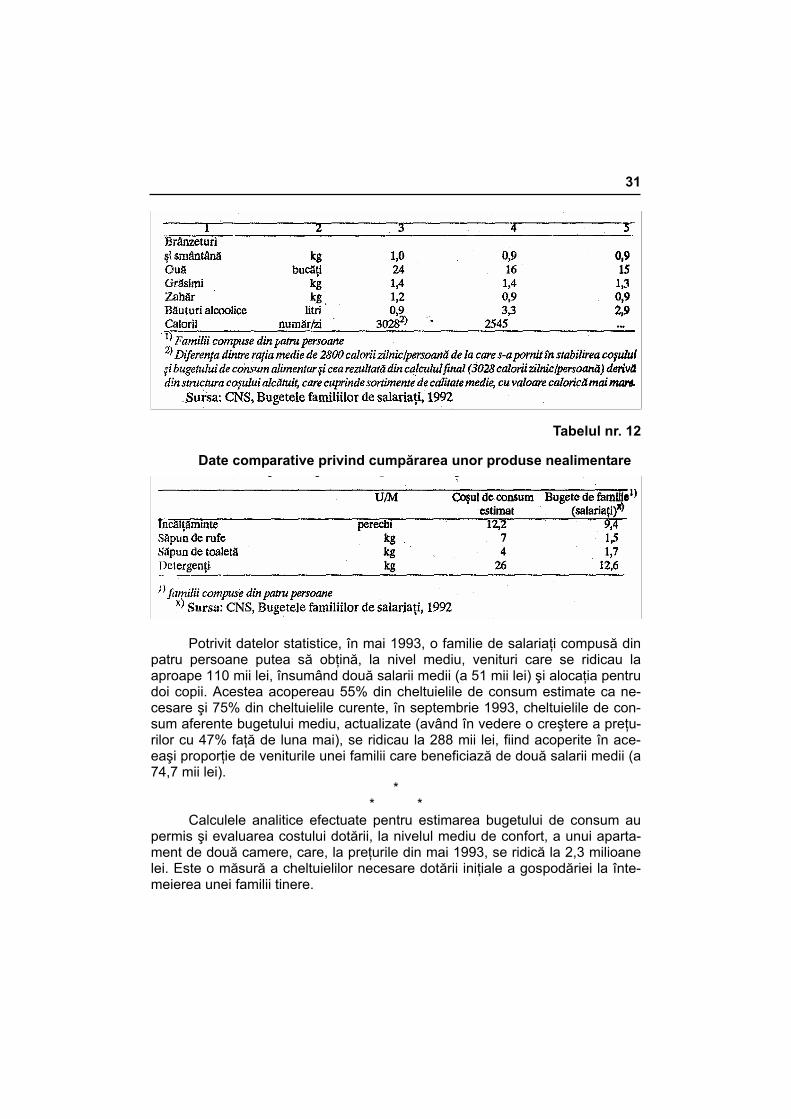
Diferenţe importante se remarcă şi între cantităţile efectiv consumate şi
cele cuprinse în coşul de consum propus, îndeosebi la alimentele cu valoare nutritivă mai mare (tabelul nr. 11), precum şi în ceea ce priveşte cumpărarea unor bunuri nealimentare (tabelul nr. 12).
Tabelul nr. 11 Date comparative privind coşul de consum alimentar estimat
şi consumul efectiv realizat de familiile de salariaţi1) în anul 1992
31
Tabelul nr. 12
Date comparative privind cumpărarea unor produse nealimentare
Potrivit datelor statistice, în mai 1993, o familie de salariaţi compusă din
patru persoane putea să obţină, la nivel mediu, venituri care se ridicau la aproape 110 mii lei, însumând două salarii medii (a 51 mii lei) şi alocaţia pentru doi copii. Acestea acopereau 55% din cheltuielile de consum estimate ca ne-cesare şi 75% din cheltuielile curente, în septembrie 1993, cheltuielile de con-sum aferente bugetului mediu, actualizate (având în vedere o creştere a preţu-rilor cu 47% faţă de luna mai), se ridicau la 288 mii lei, fiind acoperite în ace-eaşi proporţie de veniturile unei familii care beneficiază de două salarii medii (a 74,7 mii lei).
* * *
Calculele analitice efectuate pentru estimarea bugetului de consum au permis şi evaluarea costului dotării, la nivelul mediu de confort, a unui aparta-ment de două camere, care, la preţurile din mai 1993, se ridică la 2,3 milioane lei. Este o măsură a cheltuielilor necesare dotării iniţiale a gospodăriei la înte-meierea unei familii tinere.

32
De asemenea, rezultă că valoarea consumului lunar apreciat ca necesar pentru un copil de vârstă şcolară, în preţurile lunii mai 1993, este de 38,5 mii lei, din care 20 mii lei reprezintă consumul alimentar.
Partea a II-a
COMPONENŢA ŞI VALOAREA COŞULUI DE CONSUM

1. Componenţa şi valoarea coşului de consum pentru o familie de salariaţi
compusă din patru persoane
1.1. Produse alimentare
36
37
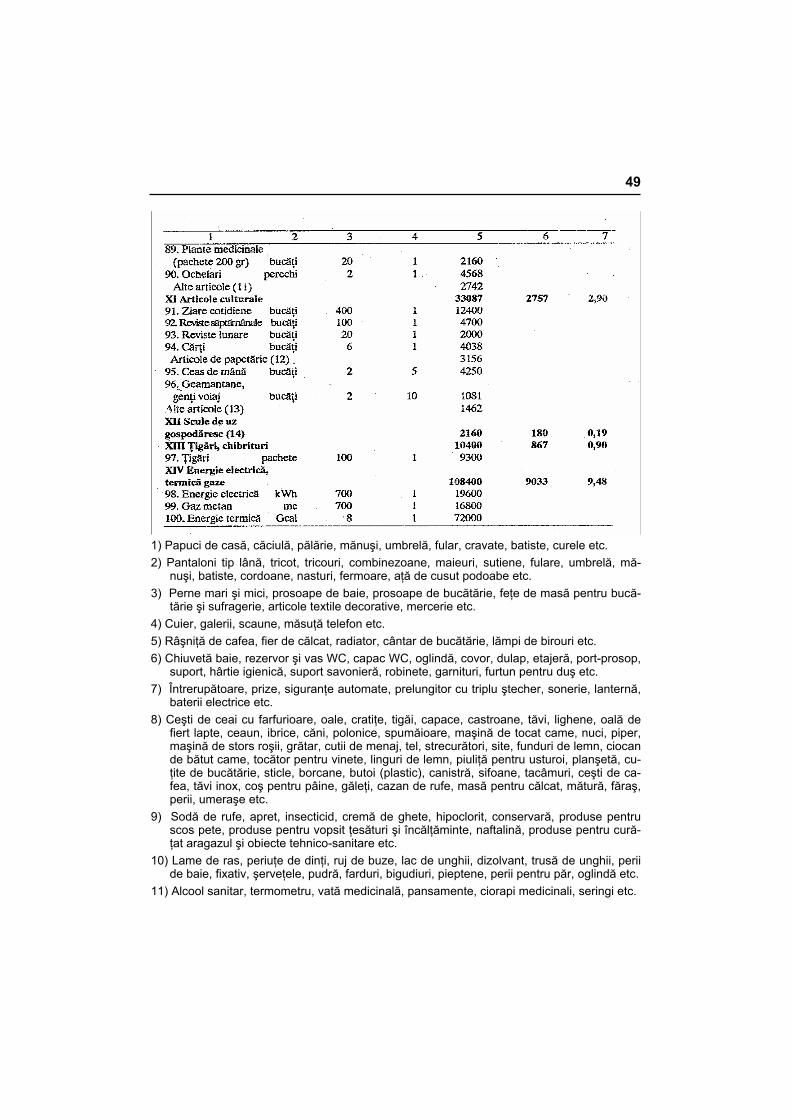
1.2. Produse nealimentare
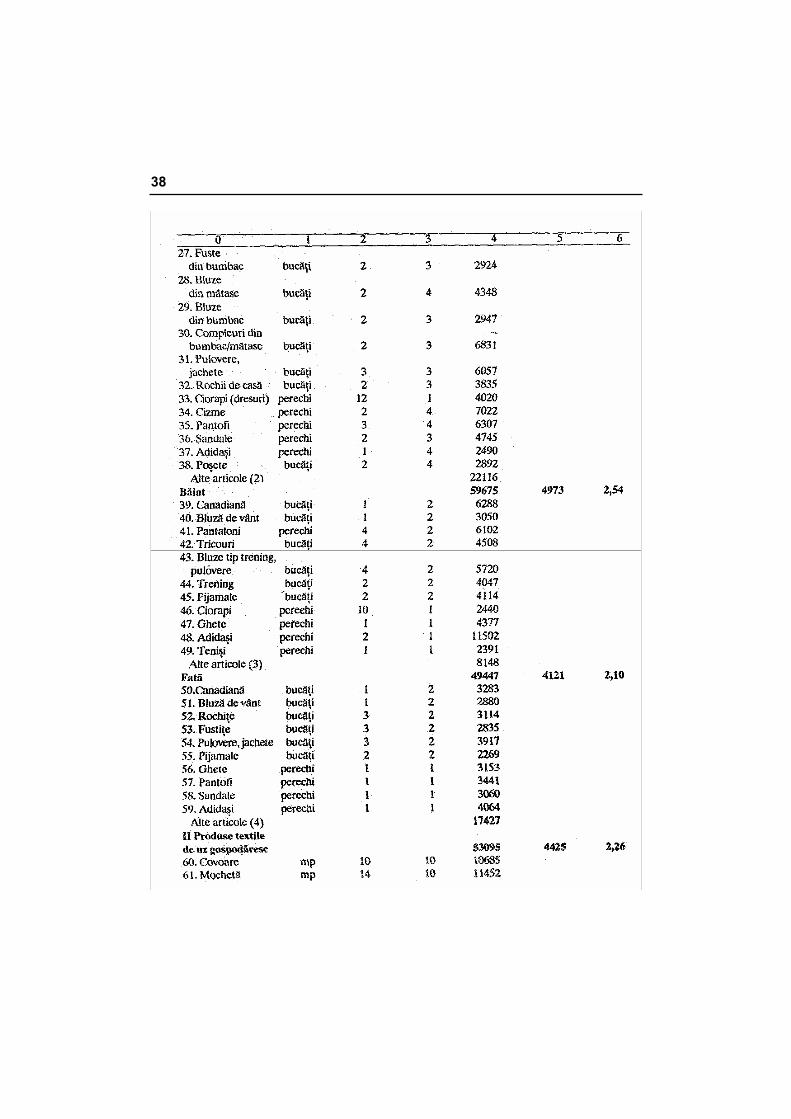
38
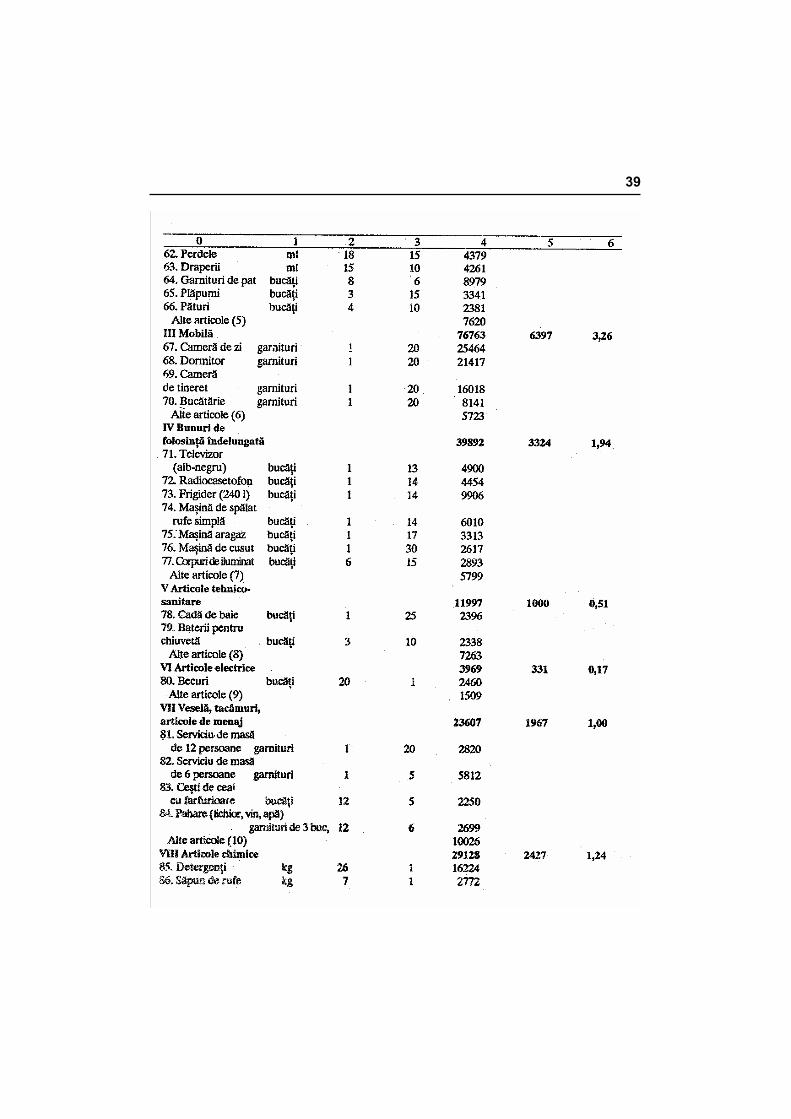
39
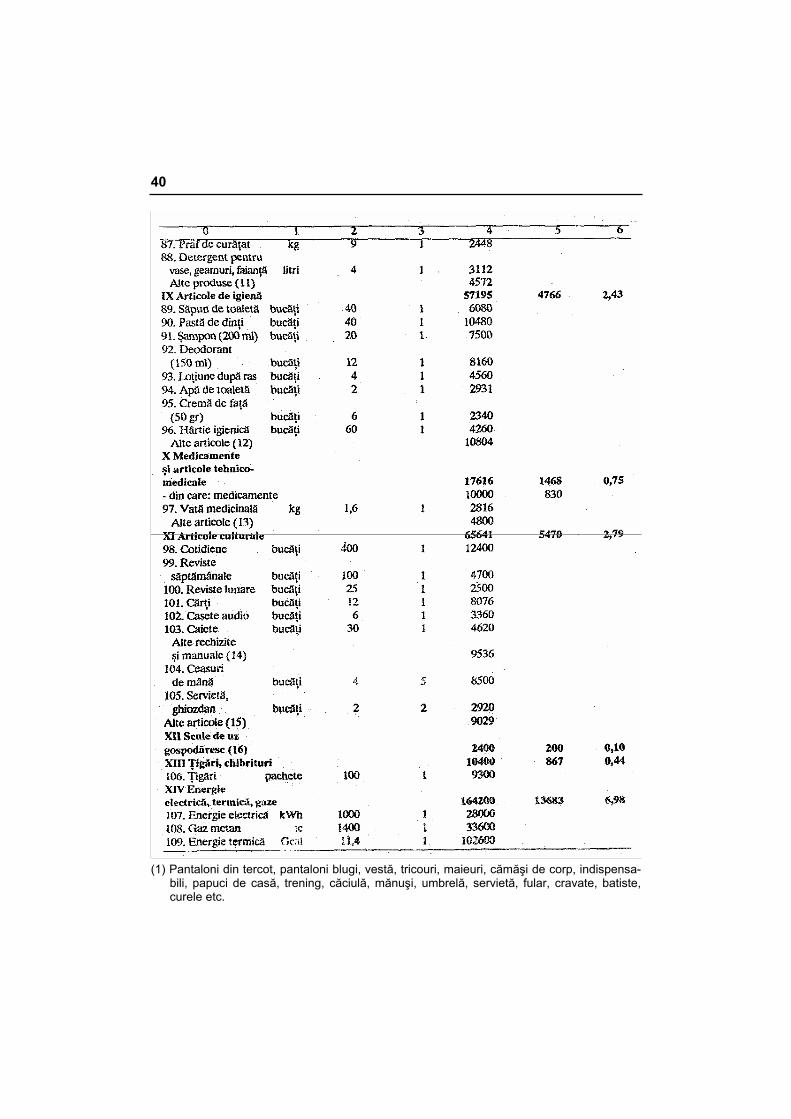
40
(1) Pantaloni din tercot, pantaloni blugi, vestă, tricouri, maieuri, cămăşi de corp, indispensa-
bili, papuci de casă, trening, căciulă, mănuşi, umbrelă, servietă, fular, cravate, batiste, curele etc.
41
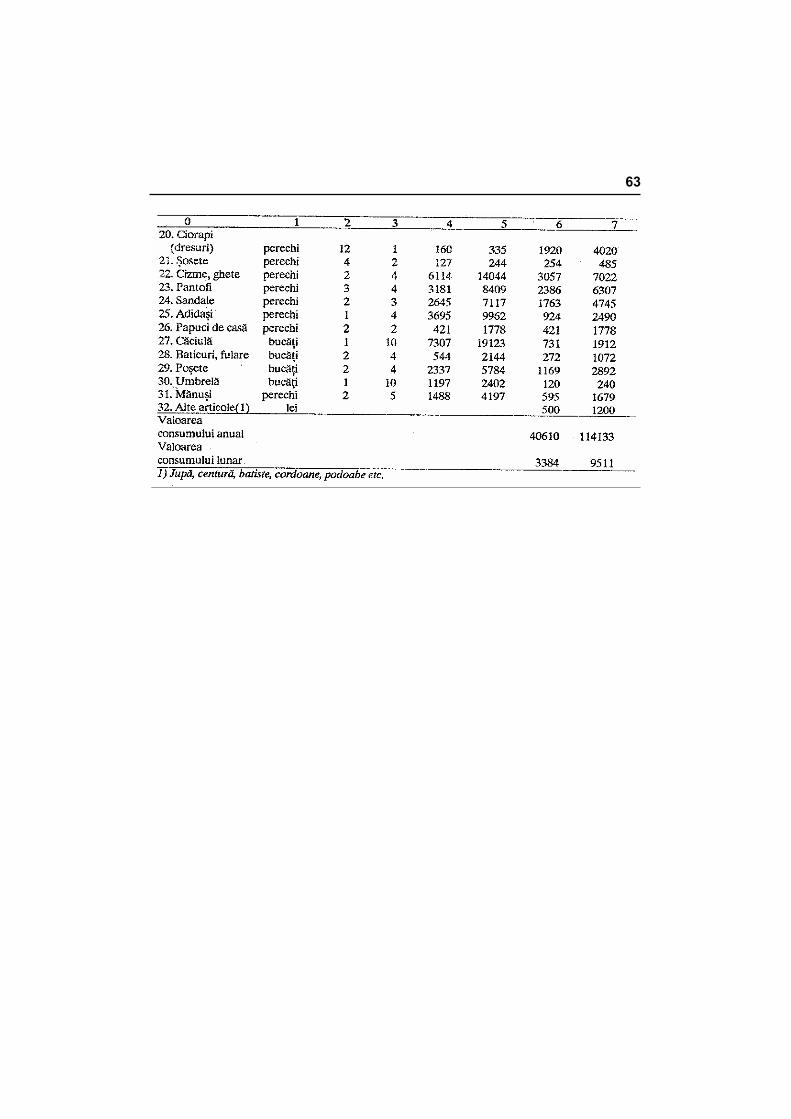
(2) Pantaloni, tricouri, trening, cămăşi de noapte, combinezoane, jupe, maieuri, chiloţi, suti-ene, centură, şosete, papuci de casă, căciulă, baticuri, fulare, umbrelă, mănuşi, cordoa-ne, batiste, podoabe etc.
(3) Cămăşi, pantaloni scurţi, maieuri, chiloţi, papuci de casă, căciulă, mănuşi, fiilor, batiste, curea etc.
(4) Uniformă şcolară, bluze tip trening, tricouri, pantaloni, trening, maieuri, chiloţi, ciorapi (dre-suri), şosete, papuci de casă, căciulite mănuşi, fular, batiste, baticuri, bentiţe, podoabe etc.
(5) Perne, cuverturi, prosoape, feţe de masă, articole textile decorative, produse de mercerie etc.
(6) Măsuţă pentru telefon, comodă TV, cuier, dulăpior pentru baie etc. (7) Aspirator, râşnită de cafea, uscător de păr, fier de călcat, radiator, cântar, lămpi de birou,
aparat de fotografiat etc. (8) Chiuvetă de bucătărie, chiuvete de baie, rezervor şi vas WC, capac WC, baterie pentru
cadă, oglindă de Baie, covor de baie, etajeră de baie, port-prosop, suport pentru hârtie igienică, suport savonieră, robinete, garnituri, furtun pentru duş etc.
(9) întrerupătoare, prize, siguranţe, prelungitoare, sonerie, lanternă, baterii electrice. (10) Oale, cratiţe, tigăi, capace, castroane, tăvi, ligheane, oală de fiert lapte, ceaun, ibrice,
căni, polonice, spumătoare, maşină de tocat came, nucă, piper, maşină de stors roşii, grătar, cutii de menaj, tel, strecurători, site, funduri de lemn, ciocan de bătut carne, tocă-tor pentru vinete, linguri de lemn, piuliţă pentru usturoi, planşetă, cuţite de bucătărie, sti-cle, borcane, butoi (plastic), canistră, sifoane, tacâmuri, ceşti de cafea, tăvi inox, coş pentru pâine, găleţi, cazan de rufe, masă pentru călcat, mătură, făraş, perii, umeraşe etc.
(11) Sodă de rufe, apret, insecticid, cremă de ghete, hipoclorit, conservant, produse pentru scos pete, produse pentru vopsit ţesături şi încălţăminte, naftalină, produse pentru cură-ţat aragazul şi obiecte tehnico-sanitare etc.
(12) Cremă de ras, lame de ras, periuţe de dinţi, ruj, pastă de unghii, fixativ, şerveţele, pu-dră, farduri, bigudiuri, piepteni, perii pentru păr, perii de bate, trusă de unghii, aparat de ras, dizolvant etc.
(13) Plante medicinale, alcool sanitar, ochelari, pansamente, seringi, termometre etc. (14) Stilouri, creioane, pixuri, pastă, cerneală, gumă, linie, echer, compas, penare, ascuţitori,
coperţi, bloc de desen, plicuri, ace cu gămălie, pioneze, hârtie de ambalaj etc. (15) Geamantane, genţi de voiaj, rucsac, portofel, portmoneu, portchei, toc pentru ochelari,
ceas deşteptător, jucării etc. (16) Cleşte, patent, ciocan, fierăstrău, bomfaier, pile, şurubelniţe, metru, ruletă, cântar de mâ-
nă, foarfeci, yală, articole de feronerie, cuie, şuruburi, piuliţe, ace de cusut, andrele etc.
1.3. Servicii
42
43
(1) Curăţat pantaloni, canadiană, palton, pardesiu, juste, jachetă; pingelii pantofi bărbaţi si
de damă) montat flecuri ta pantofi şi cizme de damă, reparaţii mărunte. (2) Spălat părul, ondulat simplu, manichiură, pedichiură. (3) Instalare telefon, corespondenţă, mandate poştale, mesagerii, telegrame. (4) Vizite la muzeu, meciuri, ştrand, servicii fotografice. x) Pentru serviciile prestate la intervale mai mari de un an, la numitorul raportului este indi-
cată perioada la care se prestează serviciul.
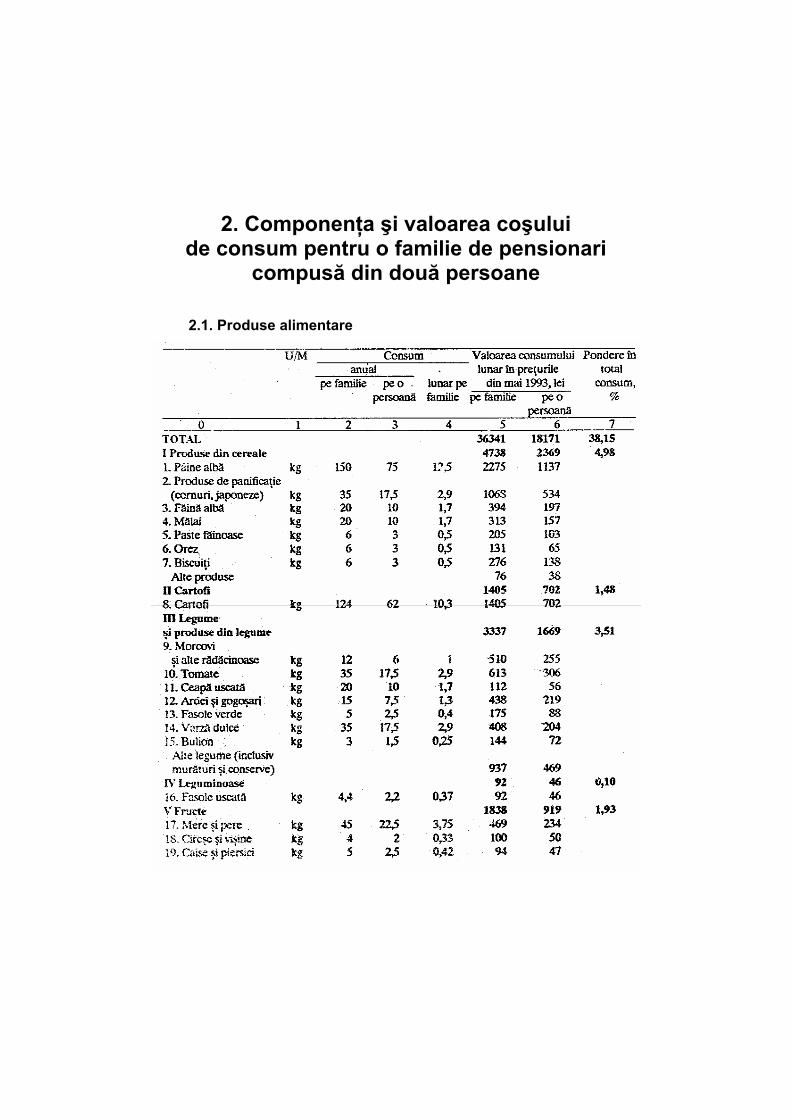
2. Componenţa şi valoarea coşului de consum pentru o familie de pensionari
compusă din două persoane
2.1. Produse alimentare
45
46
2.2. Produse nealimentare
47
48
49
1) Papuci de casă, căciulă, pălărie, mănuşi, umbrelă, fular, cravate, batiste, curele etc. 2) Pantaloni tip lână, tricot, tricouri, combinezoane, maieuri, sutiene, fulare, umbrelă, mă-
nuşi, batiste, cordoane, nasturi, fermoare, aţă de cusut podoabe etc. 3) Perne mari şi mici, prosoape de baie, prosoape de bucătărie, feţe de masă pentru bucă-
tărie şi sufragerie, articole textile decorative, mercerie etc. 4) Cuier, galerii, scaune, măsuţă telefon etc. 5) Râşniţă de cafea, fier de călcat, radiator, cântar de bucătărie, lămpi de birouri etc. 6) Chiuvetă baie, rezervor şi vas WC, capac WC, oglindă, covor, dulap, etajeră, port-prosop,
suport, hârtie igienică, suport savonieră, robinete, garnituri, furtun pentru duş etc. 7) Întrerupătoare, prize, siguranţe automate, prelungitor cu triplu ştecher, sonerie, lanternă,
baterii electrice etc. 8) Ceşti de ceai cu farfurioare, oale, cratiţe, tigăi, capace, castroane, tăvi, lighene, oală de
fiert lapte, ceaun, ibrice, căni, polonice, spumăioare, maşină de tocat came, nuci, piper, maşină de stors roşii, grătar, cutii de menaj, tel, strecurători, site, funduri de lemn, ciocan de bătut came, tocător pentru vinete, linguri de lemn, piuliţă pentru usturoi, planşetă, cu-ţite de bucătărie, sticle, borcane, butoi (plastic), canistră, sifoane, tacâmuri, ceşti de ca-fea, tăvi inox, coş pentru pâine, găleţi, cazan de rufe, masă pentru călcat, mătură, făraş, perii, umeraşe etc.
9) Sodă de rufe, apret, insecticid, cremă de ghete, hipoclorit, conservară, produse pentru scos pete, produse pentru vopsit ţesături şi încălţăminte, naftalină, produse pentru cură-ţat aragazul şi obiecte tehnico-sanitare etc.
10) Lame de ras, periuţe de dinţi, ruj de buze, lac de unghii, dizolvant, trusă de unghii, perii de baie, fixativ, şerveţele, pudră, farduri, bigudiuri, pieptene, perii pentru păr, oglindă etc.
11) Alcool sanitar, termometru, vată medicinală, pansamente, ciorapi medicinali, seringi etc.
50
12) Plicuri, felicitări, pixuri, pastă (rezerve), ace cit gămălie, pioneze, hârtie de scris, caiet, hârtie ambalaj etc.
13) Ceas deşteptător, portofel, portmoneu, port-chei, toc pentru ochelari şah, table, cărţi de joc etc.
14) Cleşte, patent, ciocan, fierăstrău, bomfaier, pile, şurubelniţă, metru, ruletă, cântar de mână, foarfeci, yală, articole de feronerie, cuie, şuruburi, piuliţe, ace de cusut, andrele etc.
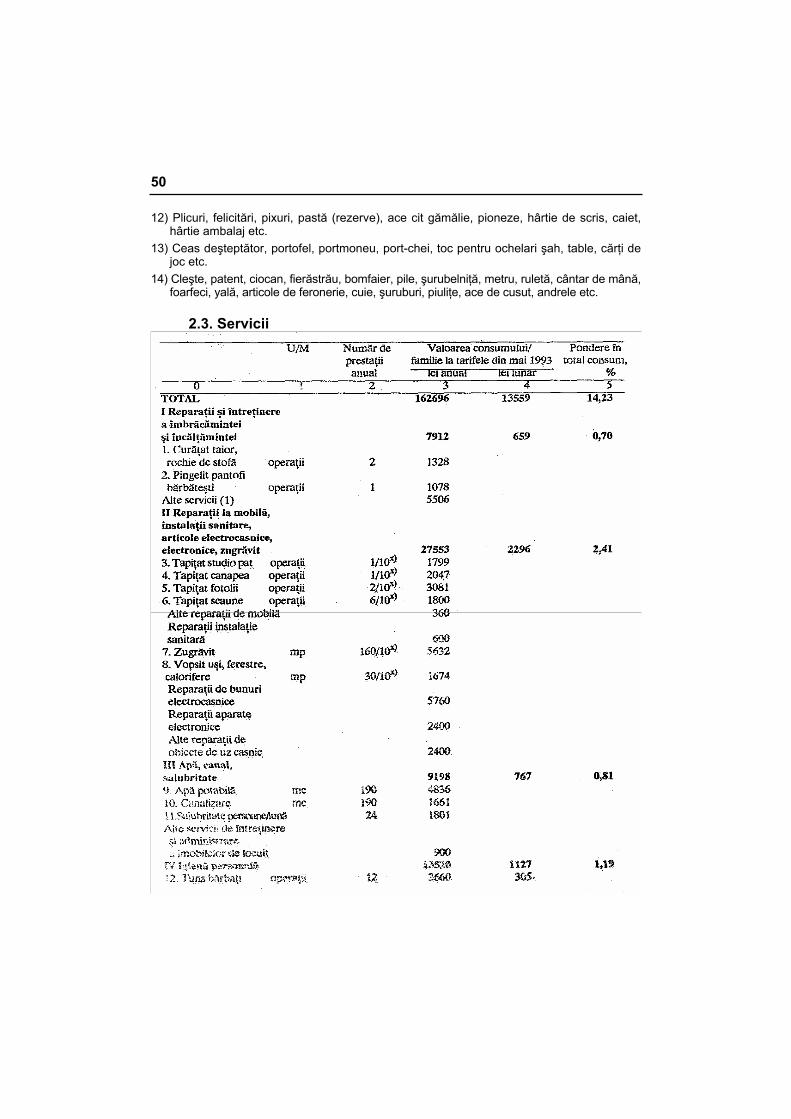
2.3. Servicii
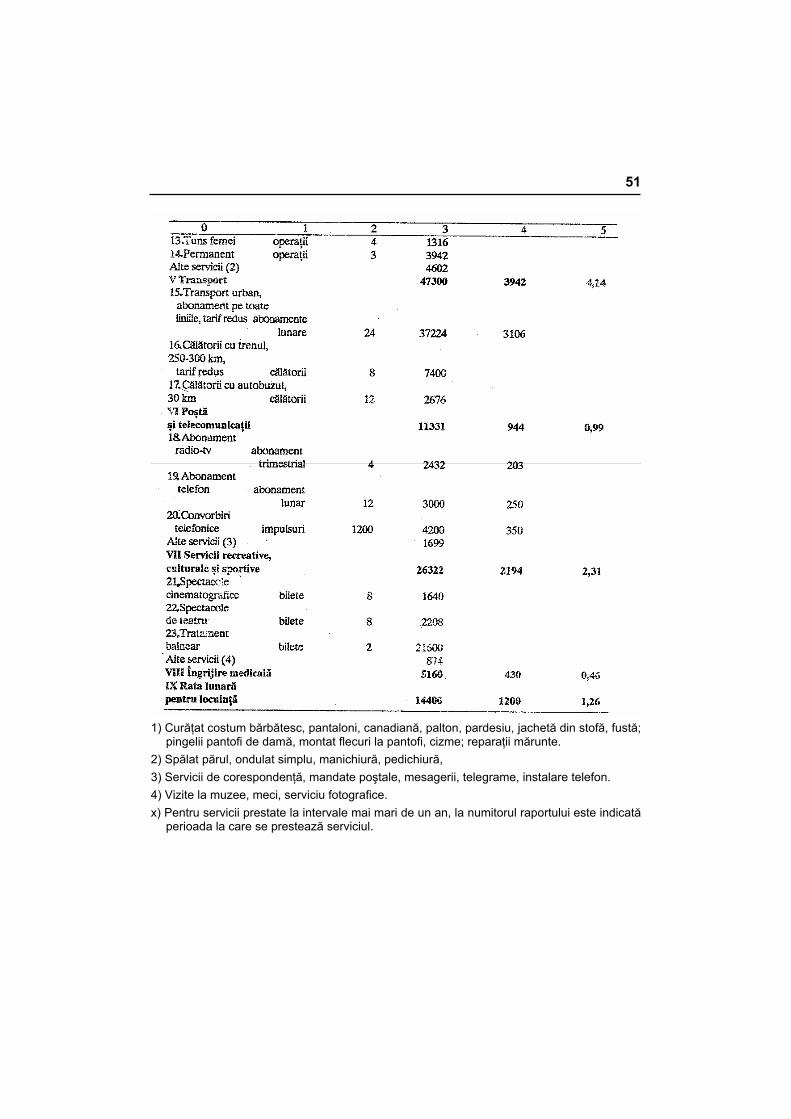
51
1) Curăţat costum bărbătesc, pantaloni, canadiană, palton, pardesiu, jachetă din stofă, fustă;
pingelii pantofi de damă, montat flecuri la pantofi, cizme; reparaţii mărunte. 2) Spălat părul, ondulat simplu, manichiură, pedichiură, 3) Servicii de corespondenţă, mandate poştale, mesagerii, telegrame, instalare telefon. 4) Vizite la muzee, meci, serviciu fotografice. x) Pentru servicii prestate la intervale mai mari de un an, la numitorul raportului este indicată
perioada la care se prestează serviciul.
ANEXE SALARIAŢI
ANEXA nr. 1. PRODUSE ALIMENTARE Tabelul nr. 1. Produse din cereale Tabelul nr. 2. Cartofi Tabelul nr. 3. Legume şi produse din legume Tabelul nr. 4. Leguminoase Tabelul nr. 5. Fructe Tabelul nr. 6. Carne şi produse din carne Tabelul nr. 7. Peşte şi produse din peşte Tabelul nr. 8. Lapte şi produse lactate Tabelul nr. 9. Ouă Tabelul nr. 10. Grăsimi Tabelul nr. 11. Zahăr şi produse din zahăr Tabelul nr. 12. Alte produse alimentare Tabelul nr. 13. Băuturi, cafea
53
Tabelul nr. 1
Produse din cereale
Tabelul nr. 2
Cartofi
54
Tabelul nr. 3
Legume şi produse din legume
Tabelul nr. 4
Leguminoase
55
Tabelul nr. 5
Fructe
Tabelul nr. 6
Carne şi produse din carne
56
Tabelul nr. 7
Peşte şi produse din peşte
Tabelul nr. 8
Lapte şi produse lactate
57
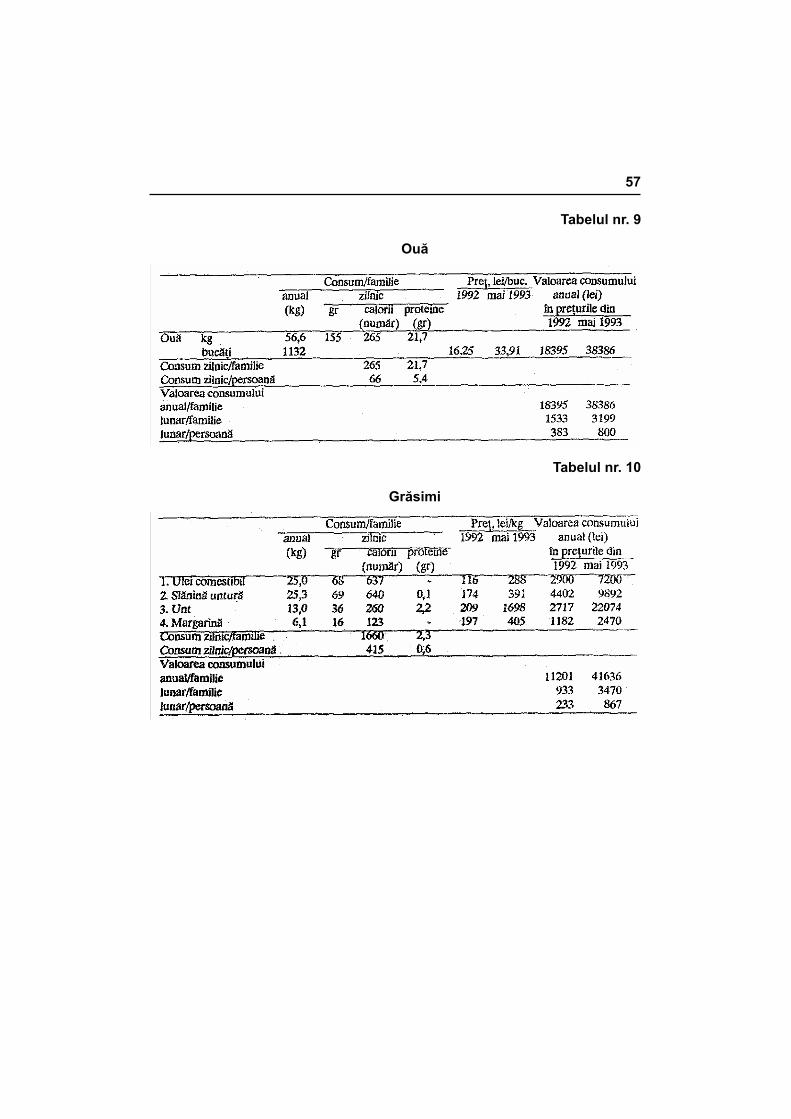
Tabelul nr. 9
Ouă
Tabelul nr. 10
Grăsimi
58
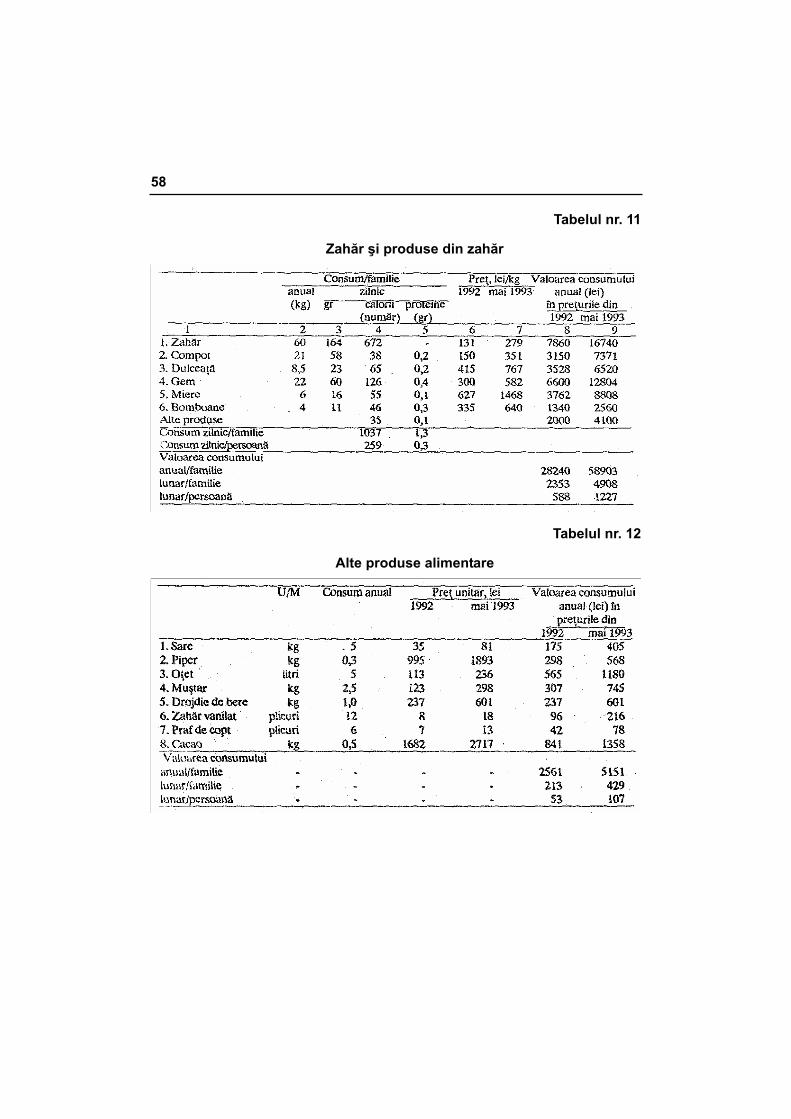
Tabelul nr. 11
Zahăr şi produse din zahăr
Tabelul nr. 12
Alte produse alimentare
59
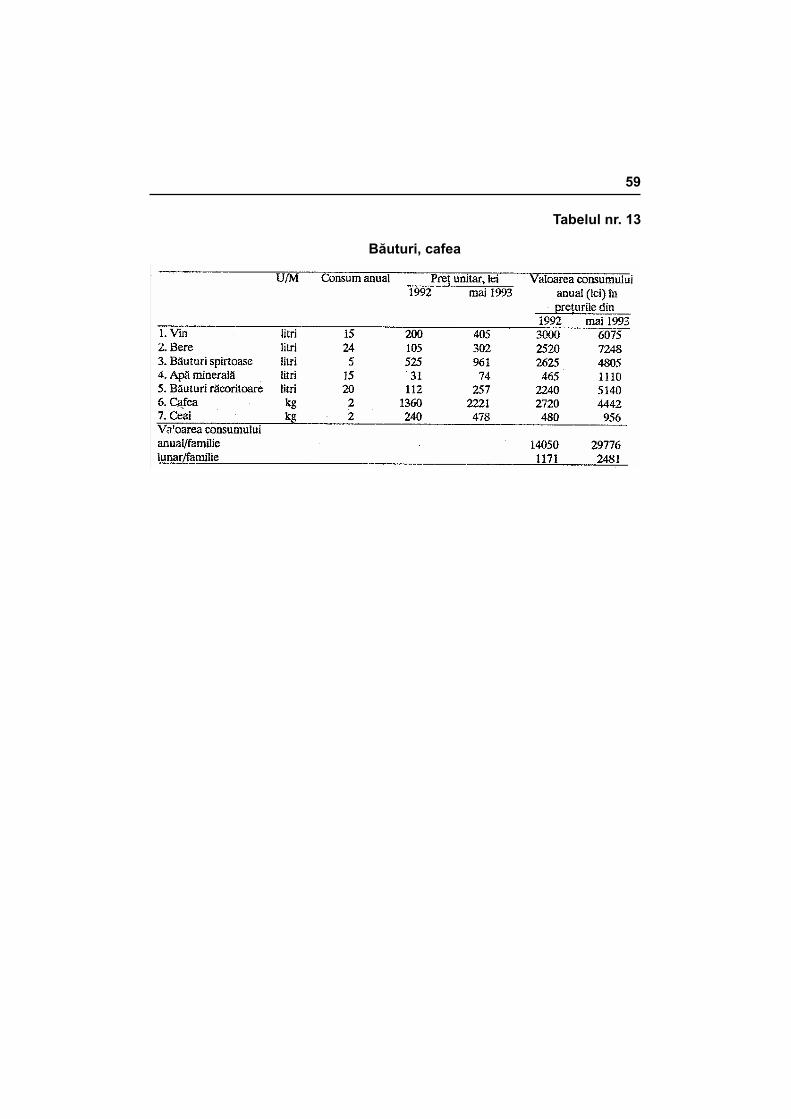
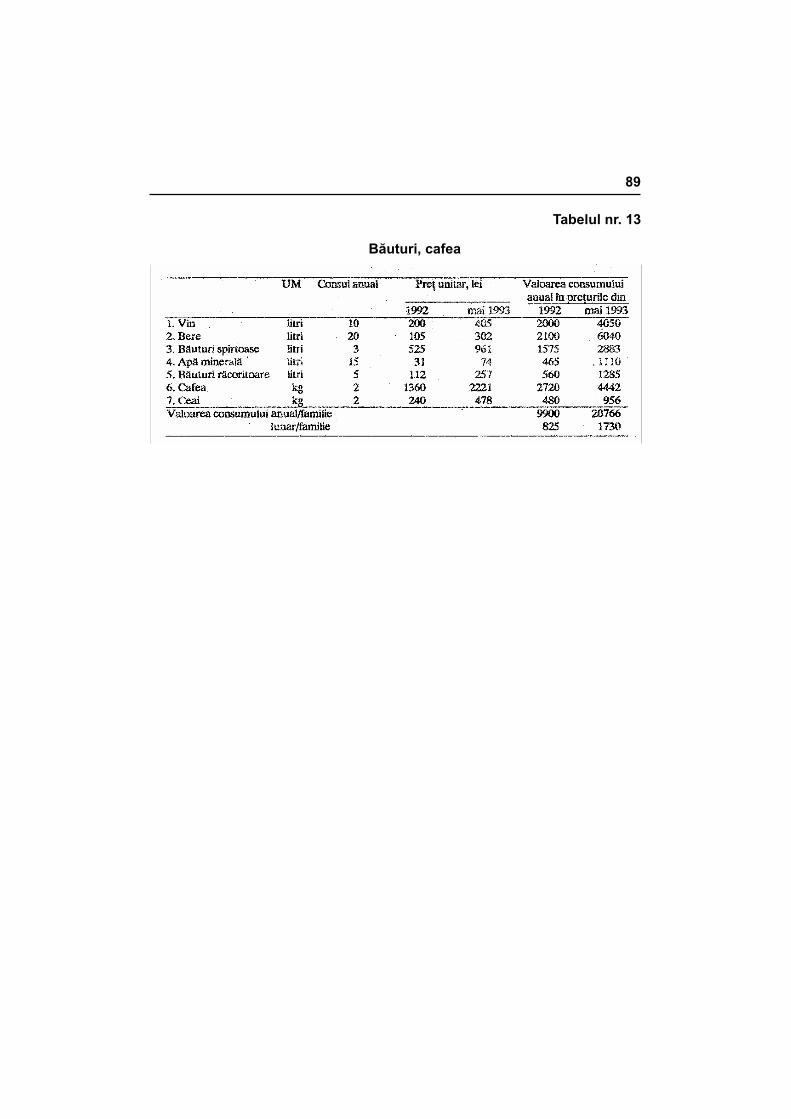
Tabelul nr. 13
Băuturi, cafea
60
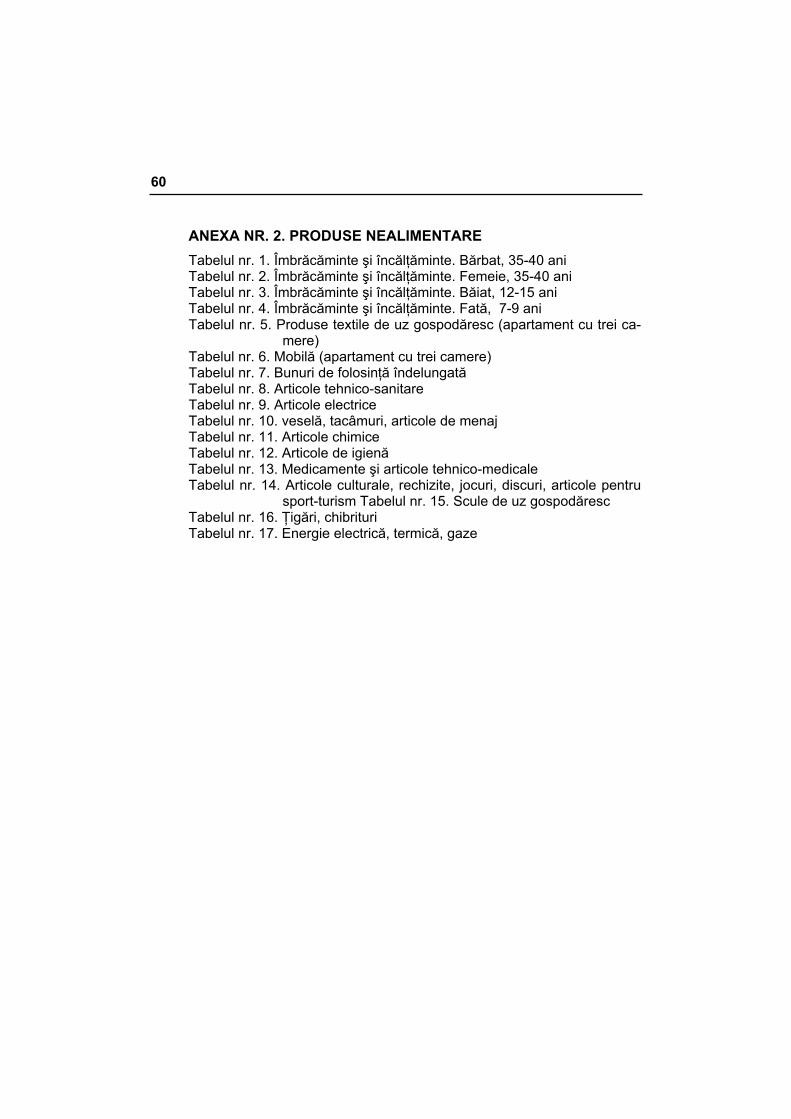
ANEXA NR. 2. PRODUSE NEALIMENTARE Tabelul nr. 1. Îmbrăcăminte şi încălţăminte. Bărbat, 35-40 ani Tabelul nr. 2. Îmbrăcăminte şi încălţăminte. Femeie, 35-40 ani Tabelul nr. 3. Îmbrăcăminte şi încălţăminte. Băiat, 12-15 ani Tabelul nr. 4. Îmbrăcăminte şi încălţăminte. Fată, 7-9 ani Tabelul nr. 5. Produse textile de uz gospodăresc (apartament cu trei ca-
mere) Tabelul nr. 6. Mobilă (apartament cu trei camere) Tabelul nr. 7. Bunuri de folosinţă îndelungată Tabelul nr. 8. Articole tehnico-sanitare Tabelul nr. 9. Articole electrice Tabelul nr. 10. veselă, tacâmuri, articole de menaj Tabelul nr. 11. Articole chimice Tabelul nr. 12. Articole de igienă Tabelul nr. 13. Medicamente şi articole tehnico-medicale Tabelul nr. 14. Articole culturale, rechizite, jocuri, discuri, articole pentru
sport-turism Tabelul nr. 15. Scule de uz gospodăresc Tabelul nr. 16. Ţigări, chibrituri Tabelul nr. 17. Energie electrică, termică, gaze
61
Tabelul nr. 1
Îmbrăcăminte şi încălţăminte. Bărbat, 35-40 ani
62
Tabelul nr. 2
Îmbrăcăminte şi încălţăminte. Femeie, 35-40 ani
63
64
Tabelul nr. 3
Îmbrăcăminte şi încălţăminte. Băiat, 12-15 ani
65
Tabelul nr. 4
Îmbrăcăminte şi încălţăminte. Fată, 7-9 ani
66
Tabelul nr. 5
Produse textile de uz gospodăresc (apartament cu trei camere)
67
Tabelul nr. 6
Mobilă (apartament cu trei camere)
68
Tabelul nr. 7
Bunuri de folosinţă îndelungată
69
Tabelul nr. 8
Articole tehnico-sanitare
70
Tabelul nr. 9
Articole electrice
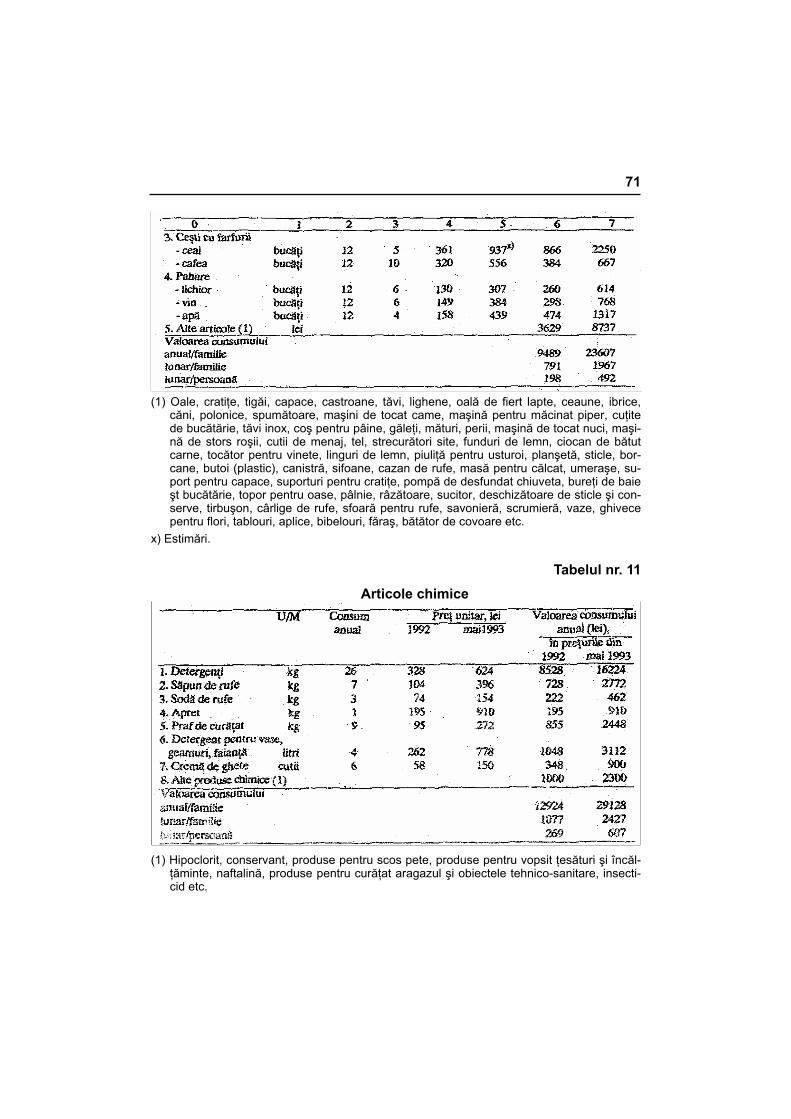
Tabelul nr. 10
Veselă, tacâmuri, articole de menaj
71
(1) Oale, cratiţe, tigăi, capace, castroane, tăvi, lighene, oală de fiert lapte, ceaune, ibrice,
căni, polonice, spumătoare, maşini de tocat came, maşină pentru măcinat piper, cuţite de bucătărie, tăvi inox, coş pentru pâine, găleţi, mături, perii, maşină de tocat nuci, maşi-nă de stors roşii, cutii de menaj, tel, strecurători site, funduri de lemn, ciocan de bătut carne, tocător pentru vinete, linguri de lemn, piuliţă pentru usturoi, planşetă, sticle, bor-cane, butoi (plastic), canistră, sifoane, cazan de rufe, masă pentru călcat, umeraşe, su-port pentru capace, suporturi pentru cratiţe, pompă de desfundat chiuveta, bureţi de baie şt bucătărie, topor pentru oase, pâlnie, râzătoare, sucitor, deschizătoare de sticle şi con-serve, tirbuşon, cârlige de rufe, sfoară pentru rufe, savonieră, scrumieră, vaze, ghivece pentru flori, tablouri, aplice, bibelouri, făraş, bătător de covoare etc.
x) Estimări.
Tabelul nr. 11 Articole chimice
(1) Hipoclorit, conservant, produse pentru scos pete, produse pentru vopsit ţesături şi încăl-
ţăminte, naftalină, produse pentru curăţat aragazul şi obiectele tehnico-sanitare, insecti-cid etc.
72
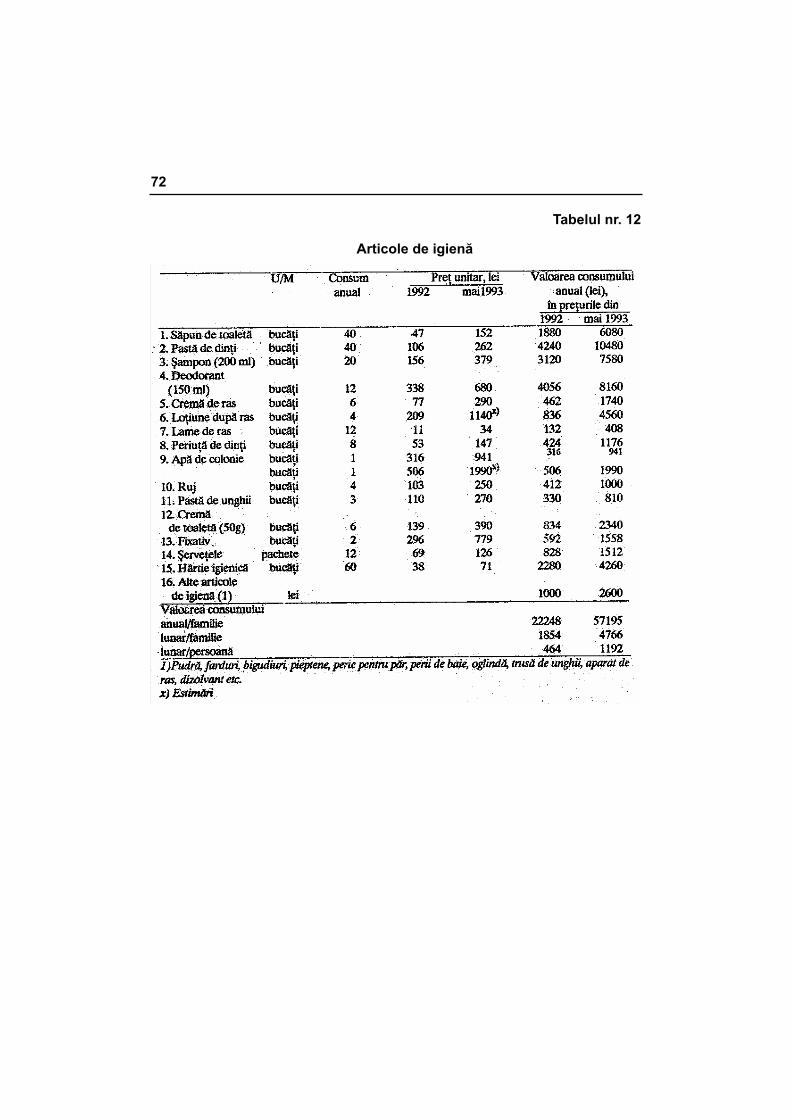
Tabelul nr. 12
Articole de igienă
73
Tabelul nr. 13
Medicamente şi articole tehnico-medicale
74
Tabelul nr. 14
Articole culturale, rechizite, jocuri, discuri, articole pentru sport-turism
Tabelul nr. 15
Scule de uz gospodăresc
75
Tabelul nr. 16
Ţigări, chibrituri
Tabelul nr. 17
Energie electrică, termică, gaze
76
ANEXA NR. 3. SERVICII Tabelul nr. 1. Reparaţii şi întreţinerea îmbrăcămintei şi încălţămintei Tabelul nr. 2. Reparaţii mobilă, instalaţii sanitare, articole electrocasnice,
zugrăvit Tabelul nr. 3. Apă, canal, salubritate Tabelul nr. 4. Igienă personală Tabelul nr. 5. Transport Tabelul nr. 6. Poştă şi telecomunicaţii Tabelul nr. 7. Servicii recreative, culturale şi sportive Tabelul nr. 8. Îngrijire medicală
77
Tabelul nr. 1
Reparaţii şi întreţinerea îmbrăcămintei şi încălţămintei
78
Tabelul nr. 2
Reparaţii mobilă, instalaţii sanitare, articole electrocasnice, zugrăvit
79
Tabelul nr. 3
Apă, canal, salubritate
Tabelul nr. 4
Igienă personală
80
Tabelul nr. 5 Transport
Tabelul nr. 6 Poştă şi telecomunicaţii
81
Tabelul nr. 7
Servicii recreative, culturale şi sportive
Tabelul nr. 8
Îngrijire medicală
82
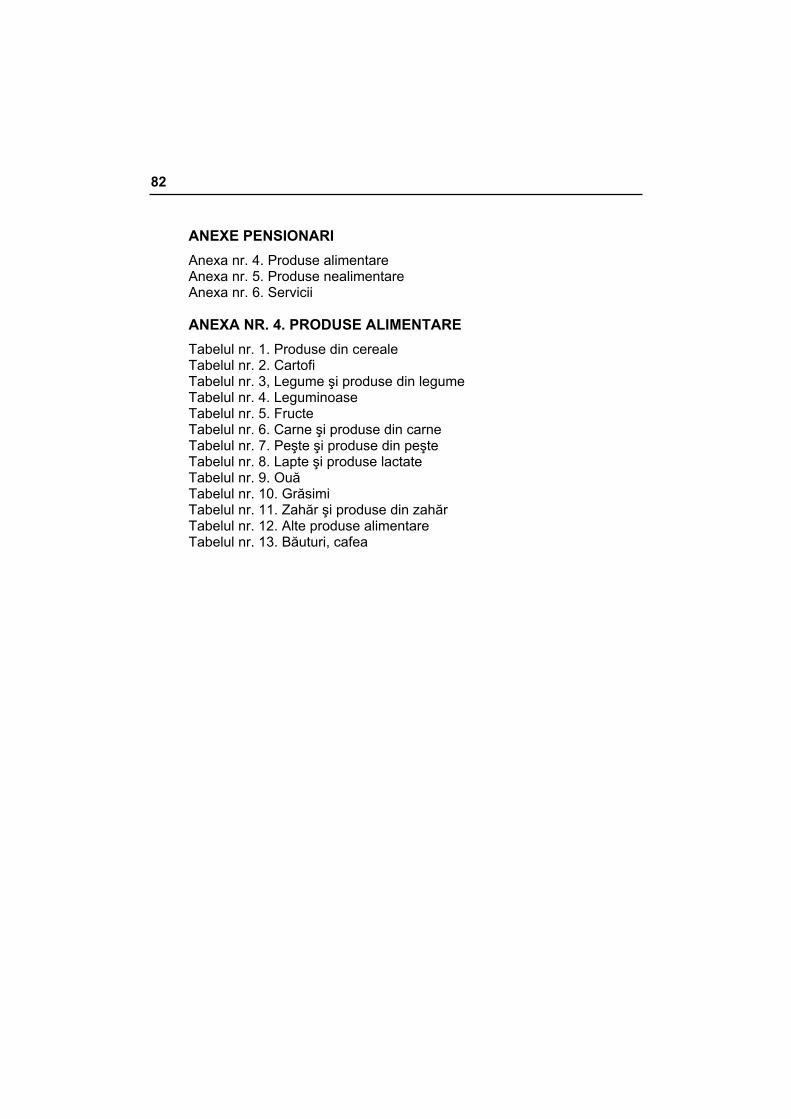
ANEXE PENSIONARI Anexa nr. 4. Produse alimentare Anexa nr. 5. Produse nealimentare Anexa nr. 6. Servicii
ANEXA NR. 4. PRODUSE ALIMENTARE Tabelul nr. 1. Produse din cereale Tabelul nr. 2. Cartofi Tabelul nr. 3, Legume şi produse din legume Tabelul nr. 4. Leguminoase Tabelul nr. 5. Fructe Tabelul nr. 6. Carne şi produse din carne Tabelul nr. 7. Peşte şi produse din peşte Tabelul nr. 8. Lapte şi produse lactate Tabelul nr. 9. Ouă Tabelul nr. 10. Grăsimi Tabelul nr. 11. Zahăr şi produse din zahăr Tabelul nr. 12. Alte produse alimentare Tabelul nr. 13. Băuturi, cafea
83
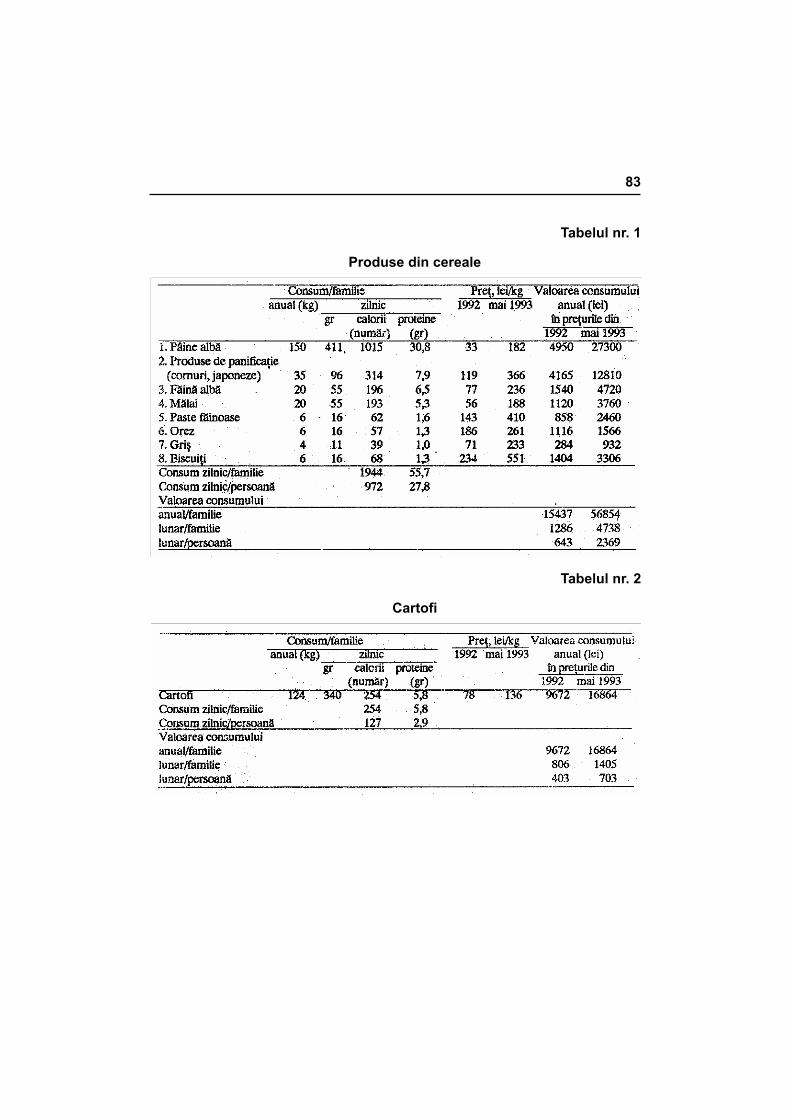
Tabelul nr. 1
Produse din cereale
Tabelul nr. 2
Cartofi
84
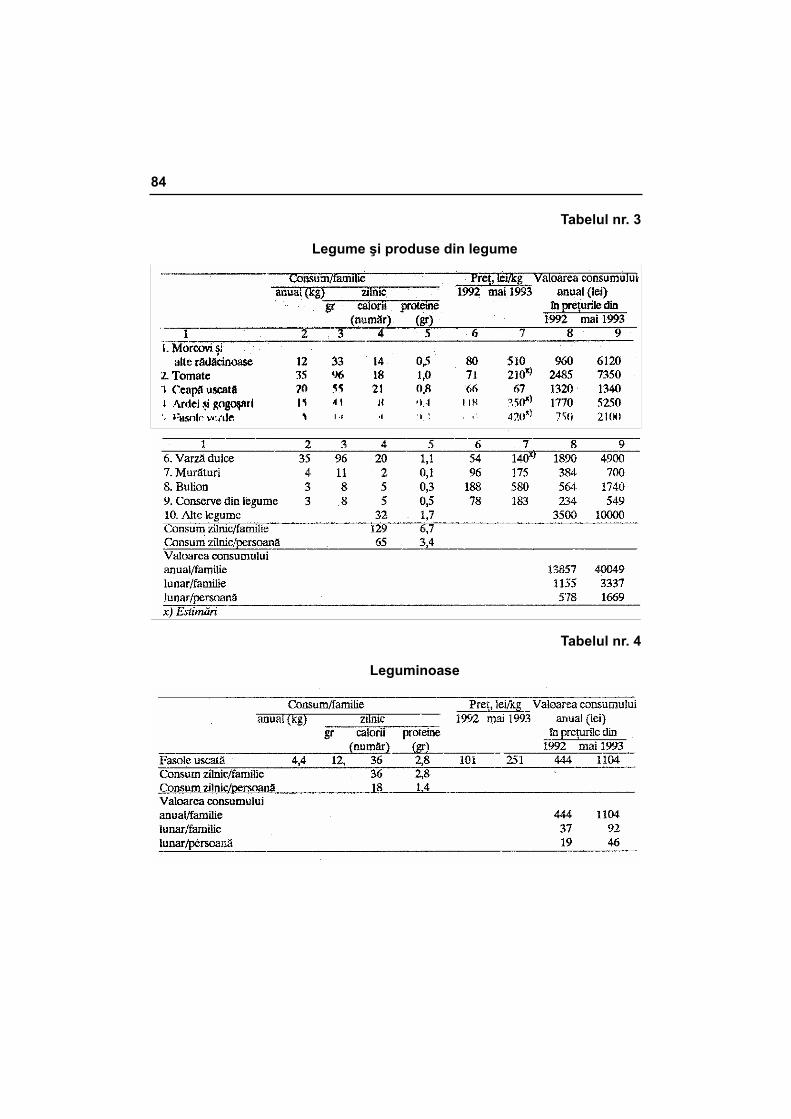
Tabelul nr. 3
Legume şi produse din legume
Tabelul nr. 4
Leguminoase
85
Tabelul nr. 5
Fructe
Tabelul nr. 6
Carne şi produse din carne
86
Tabelul nr. 7
Peşte şi produse din peşte
Tabelul nr. 8
Lapte şi produse lactate
87
Tabelul nr. 9
Ouă
Tabelul nr. 10
Grăsimi
88
Tabelul nr. 11
Zahăr şi produse din zahăr
Tabelul nr. 12
Alte produse alimentare
89
Tabelul nr. 13
Băuturi, cafea
90
ANEXA. NR. 5. PRODUSE NEALIMENTARE Tabelul nr. 1. Îmbrăcăminte şi încălţăminte. Bărbat peste 62 ani Tabelul nr. 2. Îmbrăcăminte şi încălţăminte. Femeie peste 60 ani Tabelul nr. 3. Produse textile de uz gospodăresc (apartament cu două
camere) Tabelul nr. 4. Mobilă (apartament cu două camere) Tabelul nr. 5. Bunuri de folosinţă îndelungată Tabelul nr. 6. Articole tehnico-sanitare Tabelul nr. 7. Articole electrice Tabelul nr. 8. Veselă, tacâmuri, articole de menaj Tabelul nr. 9. Articole chimice Tabelul nr. 10. Articole de igienă Tabelul nr. 11. Medicamente şi articole tehnico-medicale Tabelul nr. 12. Articole culturale Tabelul nr. 13. Scule de uz gospodăresc Tabelul nr. 14. Ţigări, chibrituri Tabelul nr. 15. Energie electrică, termică, gaze
91
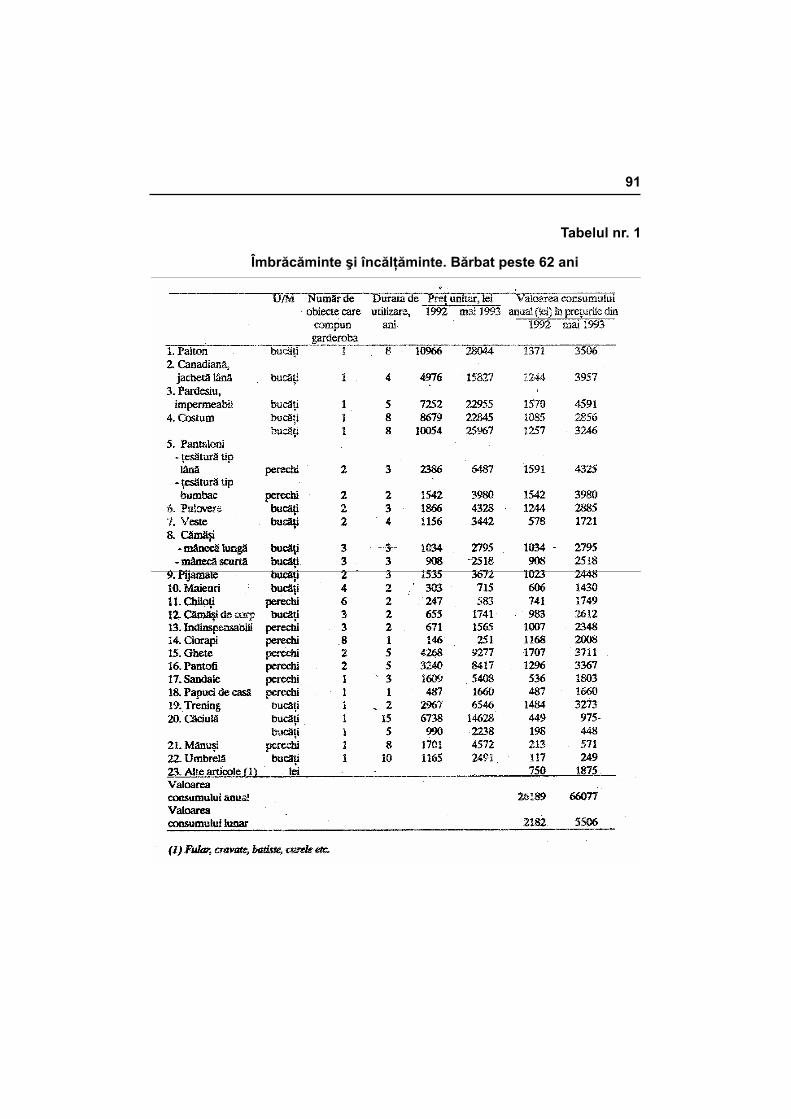
Tabelul nr. 1
Îmbrăcăminte şi încălţăminte. Bărbat peste 62 ani
92
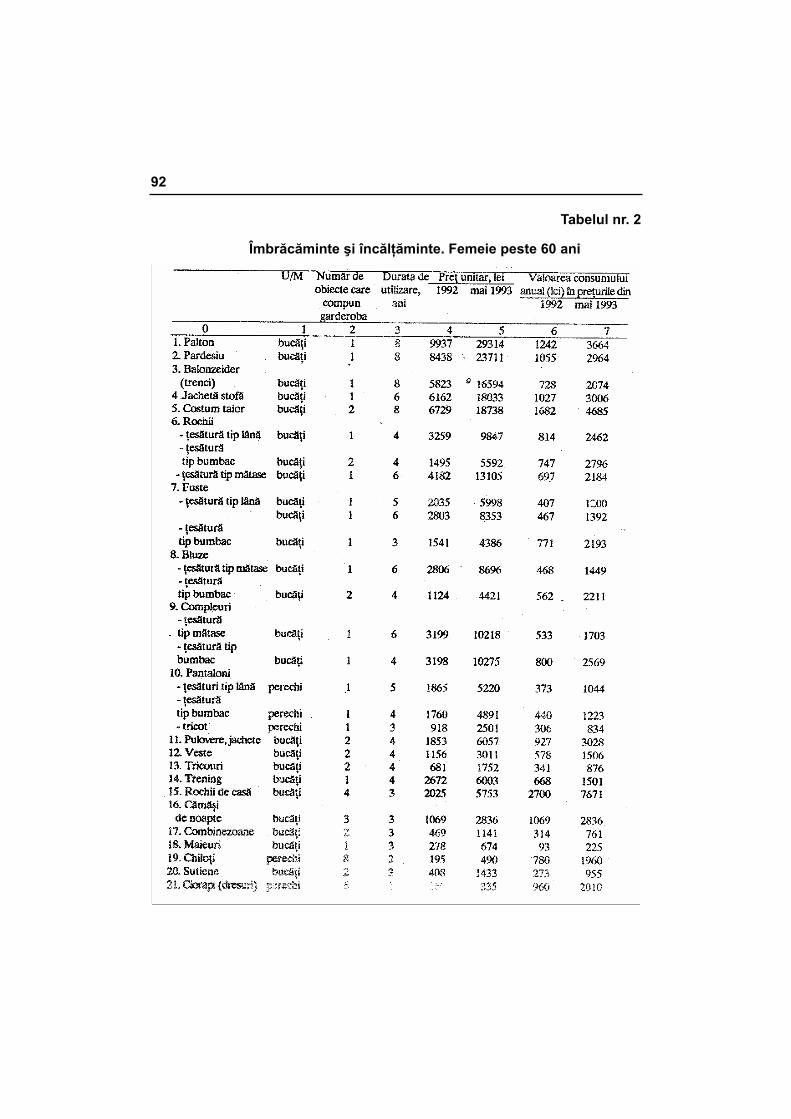
Tabelul nr. 2
Îmbrăcăminte şi încălţăminte. Femeie peste 60 ani
93
Tabelul nr. 3 Produse textile de uz gospodăresc
(apartament cu două camere)
94
Tabelul nr. 4 Mobilă (apartament cu două camere)
Tabelul nr. 5
Bunuri de folosinţă îndelungată
95
Tabelul nr. 6
Articole tehnico-sanitare
Tabelul nr. 7
Articole electrice
96
Tabelul nr. 8
Veselă, tacâmuri, articole de menaj
1) Oale, cratiţe, tigăi. capace, castroane, tăvi, lighean, oală de fiert lapte, ceaun, ibrice, căni,
polonice, spumătoare, maşină de tocat carne, maşină pentru măcinat piper, cuţite de bu-cătărie, tăvi inox, coş pentru pâine, găleţi, mături, perii, maşină de stors roşii cutii de me-naj, strecurătoare, site, fund de lemn, ciocan de bătut came, tocător pentru vinete, linguri de lemn, piuliţă pentru usturoi, planşetă, borcane, sticle, butoi (plastic), bidon, sifon, su-porturi pentru cratiţe, suport pentru capace, topor pentru oase, pâlnie, râzătoare, sucitor, deschizător de sticle şt conserve, tirbuşon, cârlige de rufe, sfoară pentru rufe, savonieră, scrumieră, vaze, ghivece pentru flori, tablouri, aplice, bibelouri, făraş, bătător de covoare etc.
x) Estimări.
97
Tabelul nr. 9
Articole chimice
1) Insecticid, hipoclorit, conservant, produse pentru scos pete, produse pentru vopsit încăl-
ţăminte şi ţesături, naftalină, produse pentru curăţat aragazul şi obiecte sanitare etc.
98
Tabelul nr. 10
Articole de igienă
99
Tabelul nr. 11
Medicamente şi articole tehnico-medicale
Tabelul nr. 12
Articole culturale
100
Tabelul nr. 13
Scule de uz gospodăresc
Tabelul nr. 14
Ţigări, chibrituri
Tabelul nr. 15
Energie electrică, termică, gaze
101
ANEXA NR. 6. SERVICII Tabelul nr. 1. Reparaţii şi întreţinere a îmbrăcămintei şi încălţămintei Tabelul nr. 2. Reparaţii mobilă, Instalaţii sanitare, articole electrocasnice
şi zugrăvit Tabelul nr. 3. Apă, canal, salubritate Tabelul nr. 4. Igienă personală Tabelul nr. 5. Transport Tabelul nr. 6. Posta şi telecomunicaţii Tabelul nr. 7. Servicii recreative, culturale şi sportive Tabelul nr. 8. Îngrijire medicală
102
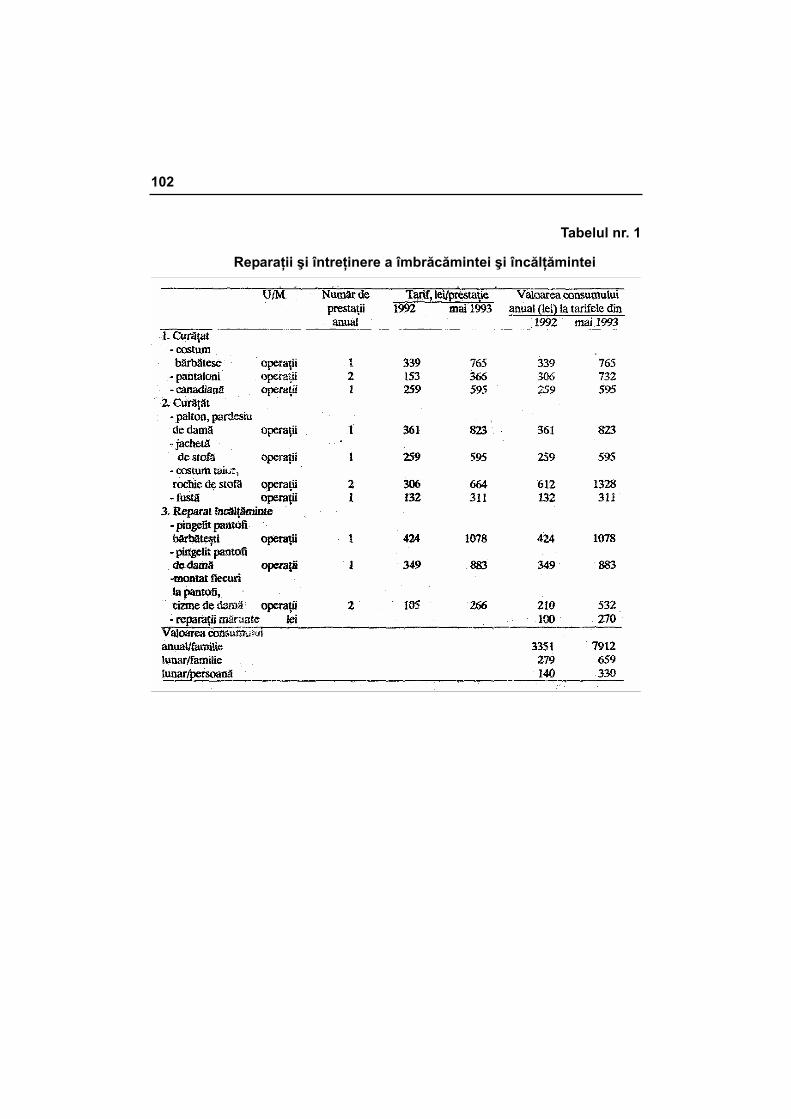
Tabelul nr. 1
Reparaţii şi întreţinere a îmbrăcămintei şi încălţămintei
103
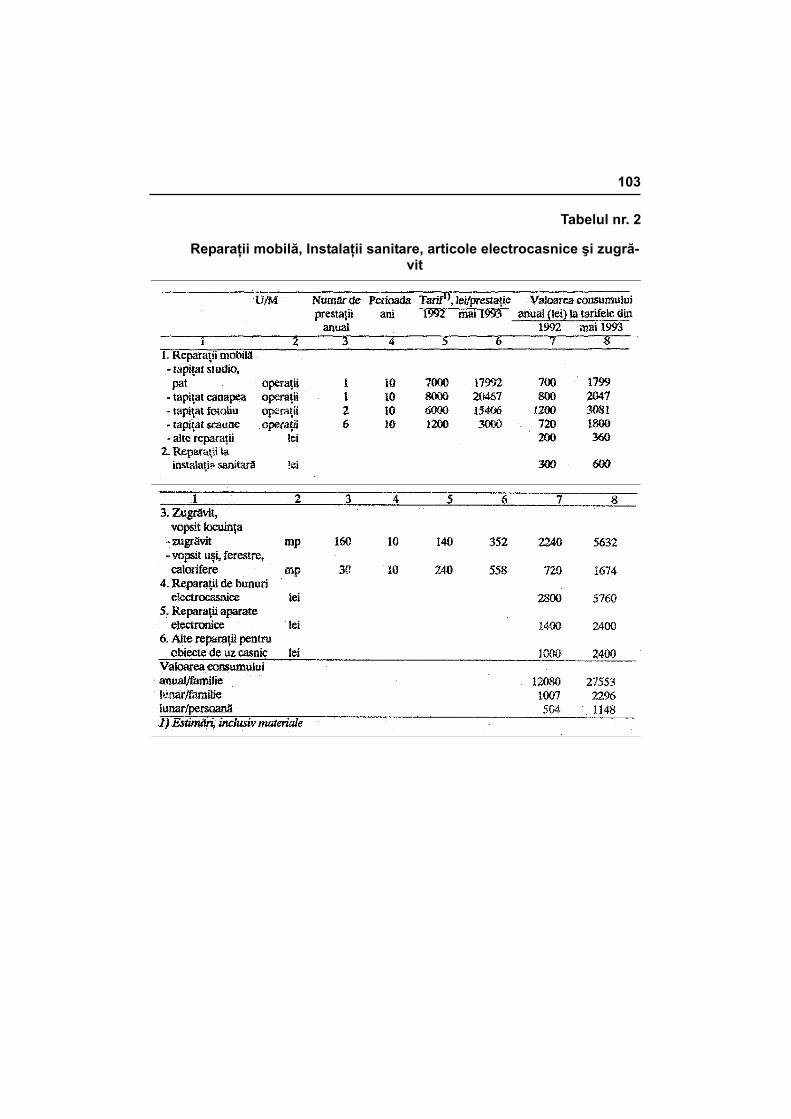
Tabelul nr. 2
Reparaţii mobilă, Instalaţii sanitare, articole electrocasnice şi zugră-vit
104
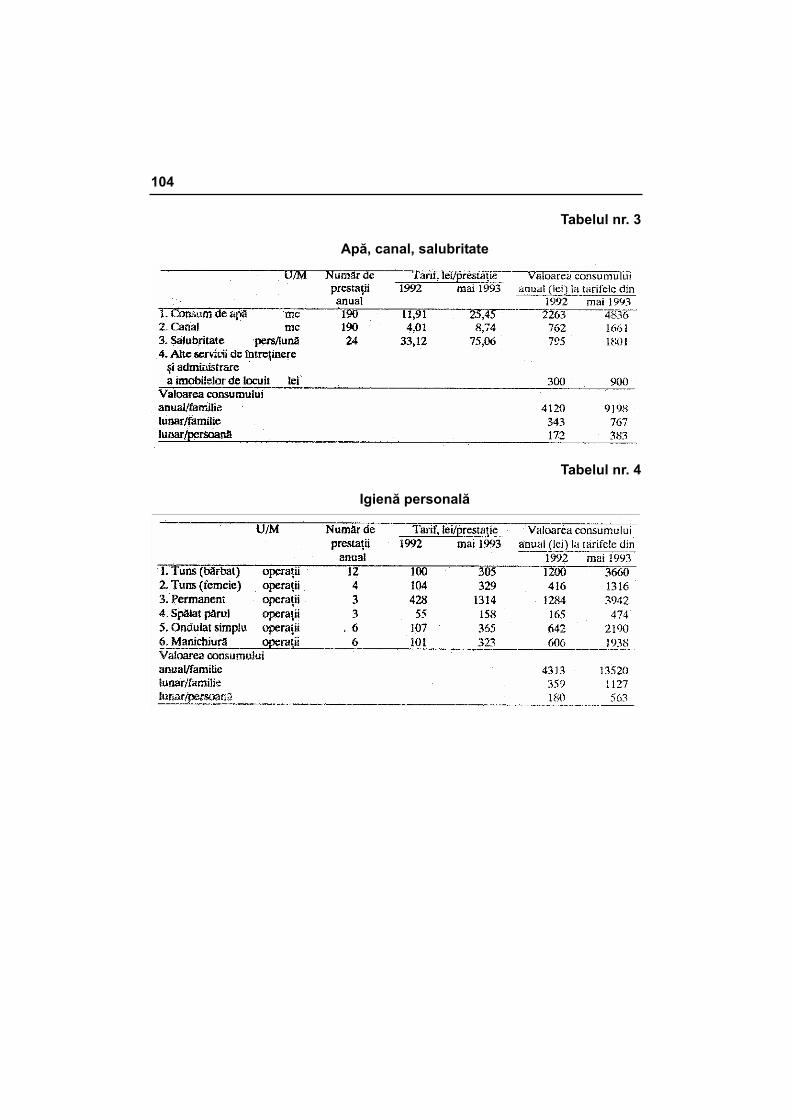
Tabelul nr. 3
Apă, canal, salubritate
Tabelul nr. 4
Igienă personală
105
Tabelul nr. 5
Transport
Tabelul nr. 6
Posta şi telecomunicaţii
106
Tabelul nr. 7
Servicii recreative, culturale şi sportive
Tabelul nr. 8
Îngrijire medicală
ROMANIAN ACADEMY THE NATIONAL INSTITUTE OF ECONOMIC RESEARCH
BUSINESS IN ROMANIA BETWEEN CHALLENGES AND NEW OPPORTUNITIES
Dr. Napoleon POP
CENTRE FOR ECONOMIC INFORMATION AND DOCUMENTATION BUCHAREST, 1993

Recently, the Romanian Government worked out the strategy of the eco-nomic and social reform for the next years, as an expression of the political will and commitment towards a market economy, through a transition period with bearable social costs. The new program is supposed to open a new stage, ac-complishing the systemic reforms characterized by a dynamic legislative and institutional process and trying to bring macroeconomic stability so necessary in order to promote the conditions of a possible recovery of the economy.
Talking about recovery, it is not in our intention to come back to the lev-els of physical output registered before 199 J. I: goes about a recovery taking into consideration the levers offered by the market mechanisms and a proper state intervention in achieving the basic equilibria within which privatization of property and restructuring both the enterprise and the national production are viewed as an unique chance of succeeding in our economic reform.
If we take a look at the specific targets of the continuation, of the re-forms, then we can state that the most important are those dealing with the questions of:
• achieving and consolidation of the macroeconomic stability through an adequate mis of currency, monetary, fiscal and revenue, policy measures, fully correlated with the targets of industrial restructuring:
• deepening the property restructuring through both the acceleration of the privatization process and the support for the development of small and medium sized enterprises;
• imposing a draconic financial discipline at the level of companies; • ensuring the social protection for the most exposed population
categories to the transition costs and difficulties. Another look has to be paid to the specific targets of the economic re-
covery based on an industrial restructuring strategy and which can be de-fined as follows:
• arresting the decrease in the industrial output and reassumption of the economic growth;
• sectoral adjustments based on some priorities in industrial develop-ments;
• reinforcing the exports; • more incentives for foreign investors Specific targets are also set for agriculture where the process of prop-
erty restructuring has to be finished, the still existing monopolistic behaviour in the field of distribution, acquisition and manufacturing of basic agricultural products has to be completely demolished, price liberalization to be fully ac-complished and specific institutions supporting the development of agriculture have to be set up.
What has all this digression to do with the message we want to convey to the businessmen?
110
Beside the fact that this might be a very good question, the digression is very much related with our today endeavour and here are the reasons:
a) The continuation of the economic reform, taken as a serious commit-ment, means stability in the right direction for those businessmen who already started operations in Romania and confidence for those who are trying to start;
b) The continuation of the economic reform, taken as a process in full swing, obviously has to improve business climate in Romania as new legislation, mechanisms, policies and institutions fit for a market economy are to be set up;
c) The advance in reforms puts in a new light business opportunities, which some time ago were considered as impossible to be treated like profit making chances;
d) Coherent developments in a strategic network bring not only a stable future for the business, but also a great deal of their possible diversification and/or deepening;
e) Our macroeconomic stabilization policy is looking for measures foreign businessmen are very well accustomed with, so we are starting to use more and more the same economic language by defining and sensing the exchange rate, inflation, unemployment, labour productivity, budget deficit, profit return on costs etc., that means a better communication and easier negotiations;
f) Our precise interest in enterprise reform and industrial restructuring is opening huge perspectives for business opportunities, commercial and investment involvement, plenty of new areas looking for new partners: improving management behaviour, company restructuring, new developments, investments, know-how, product quality mana-gement, export promotion, new services, distribution, marketing etc.
g) Last but not least, we count very much on new business opportunities creation e.g. looking for a more active involvement of our foreign partners in identifying and convincing ourselves by our own needs.
Hoping that I have convinced the audience about how an economic pro-gram in Romania can induce more interest for business, there are many other pieces of information having relevance to our foreign partners:
Fiscal reform: Fiscal policies will be oriented to simplicity, satisfying mar-ket demands, as stability and predictability to become the most important fea-tures. The degree of fiscality will be balanced and bearable around 30-35%. Starting with the 1st of July, value added tax will be introduced. Starting with 1994, taxation of global income for physical persons will be adopted. Taxes on profit will be correlated with the level of the social capital and the company's own funds, in order to stimulate exports and investments.
Public expenditures: Important financial resources will be released in or-der to sustain public investments in areas of national importance, specific pro-
111
jects in infrastructure, telecommunications, and some other economic activities to be defined.
Competition: Sectoral activities fully sustained by public budget will be deprived of finance if they do not demonstrate economic performances and, anyhow, under those circumstances the budget allocations will be gradually reduced to zero. Starting with the 1st of May 1993, consumer subsidies will be abolished parallel with special measures of social protection for most vulner-able population categories. The Government will adopt a policy of rapid price liberalization by reducing its interference to minimum. The domestic prices should become, in time, comparable with relative international prices through a realistic exchange rate of the leu. The Government will continue to regulate only the prices for natural monopolies and public utilities, but will intervene when there is a risk of practising monopolistic prices. The Government will constantly work for the creation and supervising the competition, a draft of competition protection law being ready to be sent to the Parliament.
Interest rate: Monetary policy is considered by the Government as one of the main anchors for the stabilization program, specific targets in the area be-ing the reduction of the inflationary pressures and inducing real positive ad-justments in the behaviour and activity of economic operators. In this context, the interest rate will remain real positive.
Exchange rate: The exchange rate policy has to bring the domestic - in-ternational price correlation emphasizing on comparative costs, export-oriented developments and greater confidence in the national currency. In this respect, the broadening of the currency market and improvement in its functioning is considered through the further liberalization of the currency transactions and introducing new incentives for currency repatriation and its voluntary conver-sion by the exporters.
Privatization: The Government option - having however in mind some re-strictions concerning the volume of the domestic capital resources, problems related with the privatization process and its socio-psychological components- is for a high pace of privatization. In this respect, besides new selling strategies participation on new investing institutions (as pension fund, other mutual funds, financial institutions), the Government will produce incentives for foreign capital participation in terms or promotion, land lease and land property.
Main sectors of immediate privatization are: agriculture and food indus-try, trade and tourism, transportation, constructions, banking and insurance systems. In the industry sector, out of l700 registered companies with state ca-pital participation, 700 are very big. Here, the process of privatization will take into consideration the proper ratio between restructuring needs and priva-tization possibilities.
So, the existing assets can either be privatized without any previous re-structuring, the case of the companies dealing with consumer goods manufac-turing, or the restructuring at the level of company and/or branch is considered
112
as a prerequisite of the privatization. All in all, around 2000 companies with state capital participation are suggested for a rapid privatization- in the areas which were mentioned above.
Small and medium sized enterprises: The future Romanian economy will consist in a strong private sector represented by SME's. This clear understand-ing comes out from our own experience, both the old and present one, and others' experience. The Government believes that free initiative represented by private entrepreneurship is the core of the transition to market economy. In only a three years period of continuous reforms, the contribution of the private sector to GDP has reached around 25%, employing 3.6 million persons. The private sector is represented today by 380,000 firms and their number is in-creasing.
Being aware of the fact that the private sector is still confronted with some adverse reactions from the part of the public administration and groups of interests and adding to that the scarcity of domestic financial resources, the Government will sustain a significant increase in the number of private entre-preneurs, especially in the production and export oriented areas and will intro-duce new mechanisms and proceedings for the development of SME's, such as: the creation of the Romanian Fund for Guarantying Credits supporting the private sector development, special tax incentives according to the sectoral involvement of free initiative and "Special Financial Assistance" from the local budgets.
Foreign investments: The process of industrial restructuring has to be assisted with substantial efforts in investments, technological innovation and training of labour force. As the national resources are limited, the Government is aware of the dynamic and catalytic role to be played by foreign investors.
In this area, we have to fight for a better image of the real opportunities which should match and exploit the existing liberal legislation, through a more active promotion. At the same time, new amendments to the foreign investment law are under the debates at the Parliament concerning the minimum foreign capital participation, profit repatriation and land property. Also, the Government considers as a vital necessity the establishing of some sectoral priorities for foreign investors, combining the interest for profit making with more economic growth, greater export potential, lowering the pressure for non-important im-ports and developing domestic currency market, and more balanced resource allocations for future growth.
Such priorities for foreign investors are considered in the field of food in-dustry, fertilizers, pesticides, animal food, equipment for agriculture and other supplies for farmers, energy, consumer goods, transportation and other areas of the machine building industry as: assembling vehicles and spare parts for them, pulp and paper equipment, equipment for food, petrochemistry, chemis-try and packing industries. Tourism and banking system is also looked upon as priorities in attracting foreign investors.
113
European Agreements Second part of 1993 will find Romania in the tran-sition period for the association to EC by the entering into force of the interim Agreement with its commercial concessions. The new type of preferentiality is to be looked as real expansion possibilities in our trade.
We are expecting slow but firm effects consisting in export increase, im-port selection, higher foreign demand and greater output, inductive impact on industrial restructuring. inclusive more foreign investments, price stabilization and inflation control, flexibility in credit costs, confidence in the exchange rate and more predictability in offer and demand, in building up business perspective.

ROMANIAN ACADEMY THE NATIONAL INSTITUTE OF ECONOMIC RESEARCH
ROMANIA TRANSITION FROM WHERE - TO WHAT
Dr. Napoleon POP
CENTER FOR ECONOMIC INFORMATION AND DOCUMENTATION BUCHAREST, 1993

ROMANIA TRANSITION FROM WHERE - TO WHAT
Motto: Do not advice the pleasant, but the correct.
SOLON 594 B.C.
Three years have already passed from the moment of the December 1989 Revolution and since Romania has embarked on, in a determined man-ner, the transition process from a hyper centralized planned economy towards a market oriented economic system. In order to understand the present situa-tion and the perspective, we must remind ourselves that the old economic sys-tem simply blew up in a few seconds and, from that moment, a constant proc-ess of building up the legal framework, institutions, politics and mechanisms devoted to the new economic system has been started. This process, some-times a very scrupulous and difficult one tends to put to work Romania's re-sources in a completely new environment, characterized by strong commit-ments, to the political and economic liberties, the respect of the human rights, including those of the persons belonging to minorities, commitments to the principles of market economy.
It is obvious that, in judging our today's performances, they should be amended with our own and with the international experience in transition prob-lems, mainly that part of the experience specific for the transition from strongly centralized and ideologized type of economy to a market economy.
The whole legislative and institutional effort was focused on what we might compare to the changing of an engine. The new one should rely is much as possible on the signals of the offer and demand and having as main reason of functioning the profit and the sustain of social protection.
Also, for this engine, we are striving towards a better use of the fuel we still have e.g. the intelligence of the Romanian people, some natural resources far to be depleted, as the tremendous agricultural and touristic potential, the existence of a relatively diverse economic activities, but with big restructuring needs, a market represented by around 23 million of consumers and, the last but not the least, many private initiatives and healthy ambitions.
Both our realities and that of the others who are tackling with the same situations are facing with some low critical points, demonstrating the existence of some transition costs caused by the process itself we have embarked on and, of course, by the quality of our abilities in mastering that process.
118
The success of our approach must necessarily be correlated with its so-cial costs and, especially, with their supportability from the part of the popula-tion, because the new system towards which we tend our way has to bring as soon as possible the rays of hope for real achievements in our ambitions.
From the legislative and institutional point of view and of their conse-quences on country's economy, Romania has recently went in for a serious examination in front of the contracting parties to GATT, sustaining a thorough review of its Trade Policy Mechanism.
The review was done based on two reports, one prepared by the Roma-nian side and the other set up by the Secretariat of the GATT. In order to be concise I will be quoting from the concluding remarks by the Chairman of the GATT Council:
"The reform efforts required were unparalleled in comparison to the re-structuring normally experienced in market economies. The Romanian authori-ties were to be commended for undertaking them in the context of an unfavor-able external environment, including the collapse of traditional CMEA markets and an economic slowdown in industrial economies. Although much of the le-gal framework for reform had been laid, the restructuring process had essen-tially just started: the steps taken up to now were in the right direction, but the process would be long and difficult, with significant social costs. Inflation was high already and unemployment was approaching 9 per cent. This underlined the need to continue with macroeconomic stabilization, while not weakening the commitment to structural adjustment. Privatization had begun, but its effi-cient functioning required its determined continuation; foreign investment could provide necessary support. Further liberalization of the trade regime was a critical component of the transformation process but the participants recog-nized the decisive steps taken by Romania to reform its trade regime.
With, respect to the observance of the general principles of GATT, Ro-mania's new trade policy was based on full observance of nondiscrimination; openness, and willingness to ensure transparency and predictability in Roma-nia. In return, Romania should receive the same GAIT treatment from all con-tracting parties. Radical changes had taken place in the trade regime. How-ever; lack of economic and human resources and technical capacity limited the ability to keep contracting parties fully informed at the most detailed level".
Assuming the "message" of the last phrase of the quotation it is under-standable why we attach such an importance to this meeting, before the repre-sentatives of the Confederation of the British industry that concerns your cor-rect informing including highly qualified expertize given by the GATT Council.
Considering that in our legislative and institutional process we have reached the level which has been just described to you, now, we are going to see which the path was taken by the economic development.
In 1992, Romanian economy has developed under the conditions gener-ated by the transition period to the market economy, when there was a lack of
119
balance within various sectors and branches, an acute shortage of financial and material resources as well as an "unfavorable international conjuncture. Certain structural changes took place in the economy being determined by the different evolution of some sectors and branches.
1992 economic activity was marked by the decrease in the production of goods and services having major influences in all the fields of social life.
According to the estimations the gross domestic product was 5450 billion lei, decreasing about 15% against 1991, under comparable conditions of prices. The important decline of the industrial production, (- 21,8%) which keeps a prevailing place in the structure of the gross domestic product, reso-lutely influenced the evolution of the whole economy.
Proceeding from the available date, it is estimated a volume of invest-ments of more than 700 billion lei, representing almost 13% of the gross do-mestic product; the private sector contributed with more than a quarter to the formation of the gross domestic product this ratio being higher, than in the pre-vious year (21.5%). A much more accelerated rhythm of the privatization took place in the trade and service fields.
The reduction of the industrial production caused the underutilization of the existing capacities their coverage level varying from 10 to 80%.
At the end of 1992, the economic activities were carried by 859 autono-mous regies, 199902 commercial companies with private capital participation, 7885 commercial companies with state capital participation, 196306 own-account workers (67385 family associations and 128921 independent per-sons), 21056 commercial companies with foreign capital participation (around 600 million dollars).
The transition process was followed by a series of negative social and economic phenomena.
The unemployment was increasing especially in the second half of the year and the yearly inflation rate run over the level of the previous year.
The number of the registered unemployed persons in December 31, 1992 was 929019 (8.4% out of civil active population) persons and it increased by 175.3% compared to the figure registered at the end of last year.
The monthly average rate of inflation was 9.6% as against 10.3% in 1991. In April, June, July and August, the inflation rate was below the monthly average.
Although exports recorded increases, the balance trade ended with an imbalance estimated at 1.4 billion dollars (FOB-CIF convertible currencies) and the budgetary deficit represented 3.6% of the gross domestic product.
In agriculture, the decrease of the production was estimated at 9.2% as against 1991.
The vegetable production was influenced by the fact that from 9300.7 thousand hectares of arable land, 391.6 thousand hectares remained unculti-vated.
120
The vegetable production was below the level of the previous year for grains and sugar beet and was increasing for sunflower, potatoes, vegetables, grapes.
According to the improvement of the yields, it is estimated an increase against 1991 in the sector of animal production.
The reduction of the agricultural production and of the products quantity delivered to the regulatory funds created a deficit of raw materials for their in-dustrialization and for direct consumption.
In 1992, over 1.1 million tons of wheat, 58 thousand tons of barley, 263.6 thousand tons of maize, potatoes, onion as well as some quantities of dairy products and meat were imported.
Retail sales were 1603.3 billion lei, recording a recrease (in real figures) of 17.5% against 1991.
The volume of services rendered to the population represented 837.1 bil-lion lei, 2.3% less than in 1991.
In the retail trade, the private sector holds 44.9% of total sales (against 21.9% in 1991), 40.7% of food products sale (17.2% in 1991) and 47.4% of non-food products sales (25.1% in 1991).
In the field of commercial services for the population, private economic agents achieved 26% of the total value of rendered services, as compared to 16.4% in the previous year.
The increase of exports in 1992 with 13.6% against the previous year, as compared to the increase of imports with 1.5%, determined the improvement of imports coverage degree by exports (81.1% against 72.5% in 1991), bringing the reduction of the trade balance deficit against 1991 (938 million dollars in 1991 -FOB prices).
Moderate evolution of imports in the middle of 1992, at a time when the exports enjoyed good incentives - mainly the decision of the full retention of currency in the hand of the exporters - brought first monthly positive trade bal-ance for the third quarter of the year 1992.
In the foreign trade, the share of private economic agents increased to 26.1% in total exports (against 19.1% in 1991) and to 323% in total imports (against: 17.5% in 1991).
In the existing relationships between Romania and Great Britain a new European dimension will be added starting with this year.
Its substance is given by the European Association Agreement with the EC and the Free Trade Agreement with EFTA member countries which were signed on the 1th of February 1993 in Brussels and on the 10th of December 1992, respectively.
The recent agreements with the EC and EFTA are not contradicting Ro-mania's commitment to the multilateral trading system.
121
These agreements are in line with GATT provisions. Specific trade liber-alization provisions, including asymmetry of implementation, are included in order not to cause trade diversion.
The agreements also reinforce Romania's commitment to GATT rules and disciplines and support the process of economic transition. This would fa-vour economic development and create trade opportunities for all contracting parties.
An essential component of the Government's program is represented by the preparation, implementation and exploitation of the agreements which sup-port. Romania's integration in the -European structures and, through them, in the world economic structures.
The tow agreements are, at the same time, both a recognition of the pro-gress made on by Romania in getting on with the reform process and a com-mitment for their continuation taking into consideration the dimensions con-ferred by the new political, economic, social and cultural cooperation with wes-tern democracies.
The agreements support, from this perspective, the involvement and as-sistance of the European partners represented by the EC and EFTA countries in the process of accomplishing the reforms and the passing through the transi-tion period in Romania, on the ground of the common and clearly stated com-mitments to the democratic principles and to principles of the market economy.
The Government, considering the coming into force, starting with the be-ginning of the second semester of this year, of the stipulations regarding the commercial cooperation of the two agreements and opening of maximum 10 years transition period, within which the commercial integration will be accom-plished, has taken important preparatory actions for the implementation of the agreements.
Among them we may enumerate the improvement of the institutional structures devoted to the technical management of the agreements on a per-manent basis, the creation of the Department for European Integration under the direct subordination of the Prime-Minister, professional training of the com-petent public servants, preparations of the customs system, assistance of the economic agents for their orientation and stimulation in taking the advantages of the free move of the goods.
All these measures are aiming to increase the quality of the business en-vironment, to generate new trade activities and to give more incentives for for-eign investors.
On a medium and long term the action of the Government regarding the European dimension of Romania's external economic relations will concentrate itself upon the pursuing of the legislative and institutional construction neces-sary for advancing in the integration process, obeying to the principles of their harmonization to the norms and standards promoted by our EC and EFTA partners.
122
This is the way how the premises for the gradual passing to the free move of services, labor force and capital will be created and anticipated as new commitments of Romania's real integration into the European structures.
The consistence of the commercial, economic, financial and cultural co-operation will be ensured by an active political dialogue.
Parallel with the actions regarding the easing of the implementation and turning to good account of the integration agreements on the institutional, legis-lative and organizational level, the Government founds its success of the pro-gram of macroeconomic stabilization, considering the agreements as real in-struments and mechanisms destined to support on medium and long term this objective.
Romania being openly confronted with the business cycle and structural tendencies on the markets of our EC and EFTA partners, the Government will support the national restructuring based mainly: on purely economic criteria built in such economic and commercial policies preparing the Romanian econ-omy and society for the ultimate objective to become a member of the EC.
In this context, it is very clear for us that the fluent implementation of the agreements, seen from the perspective of the commitments made by the par-ties, will make the governmental activities more effective for the qualitative functioning of the national social and economic system and Romania may ac-tively contribute to the European processes.
The explicit inclusion of the European dimension in the governmental program determines necessarily the starting of a coordination process of the macroeconomic policies with the EC and EFTA partners through the institu-tions generated by the integration agreements, coordination aiming at regional stability, economic growth, the absorption of the unemployment and keeping under control of the inflation.
The turning into account of the agreements on medium and long term will be done also within balanced policies regarding, at the same time, the gradual improvement of the consistency of a series of economic, financial, monetary and social indicators to those of the EC and EFTA countries and the general development of Romania's international economic relations as a proof of its attachment to the multilateral trade system.
22.02.1993 London,
Confederation of the British Industry
MINISTRY OF AGRICULTURE AND FOOD NATIONAL INSTITUTE OF ECONOMIC RESEARCH
THE INSTITUTE OF AGRICULTURAL ECONOMY
AGRICULTURE AND FOOD INDUSTRY PRESENT
STATUS OF DEVELOPMENT, OBJECTIVES, DIRECTIONS AND MEANS OF ACTION FOR
CONTINUING THE REFORMS IN THE AGRICULTURAL AND FOOD SECTOR
- Underlying study of the governing programme for the period 1993-1996 - (January 1993)
CENTRE OF ECONOMIC INFORMATION AND DOCUMENTATION BUCHAREST, JULY 1993

SUMAR
Introductory Chapter ............................................................................................. 127
FIRST PART
AGRICULTURE AND FOOD INDUSTRY DEVELOPMENT DURING THE PERIOD 1989-1992
1. Ownership and farms restructuring process development ............................... 131 1.1. Ownership breakdown in agriculture in the late 80's............................... 131 1.2. Set up of private ownership and of family peasant household................ 134
1.2.1. The set up of land private ownership............................................. 134 1.2.2. Setup of the production means private ownership......................... 136
1.3. Privatization of agricultural state sector................................................... 137 1.4. Privatization of food industry ................................................................... 140
2. Evolution of agricultural output during 1989-1992 ........................................... 141
3. The agricultural foreign trade between 1989-1992 .......................................... 148
4. The process of setting up and acting in a market economy ............................ 150
SECOND PART
CONTINUATION OF REFORM, TARGETS, TRENDS AND MEANS OF ACTION
1. Targets .............................................................................................................. 155 1.1. Predictable trends in the evolution of the main agricultural products
between 1993-1996 ................................................................................. 155 1.2. The evolution of the industrial food production in 1993-1996 ................. 162 1.3. The increase of the efficiency of the food industry sector
according to the association to the European Community and cooperation at regional and world level ............................................ 163
2. Ways and means of action................................................................................ 165 2.1. Privatization in agriculture and in the food industry................................. 165
2.1.1. Establishing and consolidating the peasant trading household based on family work.............................................................. 165 2.1.2. Privatization of state-owned commercial companies in agriculture and restructuring of their activity ........................................ 167
126
2.1.3. Privatization of the research activity and of the extension activities ................................................................................................... 168 2.1.4. Organization and functioning of the services for agriculture.......... 168 2.1.5. Food industry privatization ............................................................. 171
2.2. Agriculture integration into market economy mechanisms. Agromarkets and market economy institutional system consolidation .... 171 2.2.1. Market economy institutional system consolidation....................... 172
2.3. Agro-markets organization and functioning............................................. 176 2.3.1. Production factors market .............................................................. 176 2.3.2. Land market ................................................................................... 176 2.3.3. Tractors and agricultural machines market.................................... 178 2.3.4. Fertilizers and other chemical market............................................ 178 2.3.5. Labour market ................................................................................ 179 2.3.6. Services market ............................................................................. 179 2.3.7. Agricultural produces market ......................................................... 180
2.4. Research and farmers training ................................................................ 181 2.5. The partnership for agriculture development........................................... 182
2.5.1. Institution of partnership................................................................. 182 2.5.2. Objectives and partnership programs for rural and agriculture development............................................................................................. 183 2.5.3. The partner's types and relations................................................... 185
2.6. Farmers social protection ........................................................................ 185 2.7. The establishment and improvement of juridical framework ................... 187
Introductory Chapter
The present study, prepared by experts in the Ministry of Agriculture and Food, researchers in the Agrarian Economics Institute of the National Institute of Economic Research and researchers in the institutes with similar profile, is meant to help drawing-up the governing programme in achieving one of the main strategic objectives of the economic and social development - food secu-rity of the population-.
The study is based on the analyses on sectors as well as the synthesis worked out and discussed in the Consultative Council for Strategy, Reform and Developmental the Ministry of Agriculture and Food
Starting from the analysis of the phenomena and processes occurred during the period 1990-1992 and assessing the predictable trends, the study is meant to offer necessary elements for carrying out, through the governing pro-gram on 1993-1996 years, the followings:
• the stop of the agricultural and food production falling off, relaunching and developing the agricultural and food sector;
• the improvement of the food security, i.e.: gradual providing for the population's possibility to dispose of larger quantities of foods in order to lead an active and healthy life. In achieving this objective it is taken into account our country's capability (potential) to produce within its boundaries most of the necessary foods for consumption and the meeting of population's solvable demand by increasing the gross domestic product;
• the building-up and development of a lasting agriculture able to pro-duce, under the market economy conditions, the necessary economic surplus for its own development and the participation to the global economic equilibrium, to produce "clean" raw materials ensuring farmers' revenues comparable to those of the other social-economic groups, to support the growth in the quality of farmers' and whole society's life.
To this aim, there are taken into consideration: − the building-up and strengthening of the new agrarian break-down; − the property structure, the farms and services organization structure,
the market mechanisms establishment and the integration of the agriculture in the general economic development by using the ma-croeconomic variables with functions of production and adjustment;
− the increasing of the social labour productivity in the agricultural and food sector by the development of a modern agricultural and food economy. There are kept in view: the retechnologizing of the production apparatus on the entire agricultural and food network, the
128
growth, in intermediary consumptions conversion, the reduction in the costs of the agricultural producers and processed agricultural products, the decrease in the weight owned by the population's expenditures for food;
− the growth in the economic efficiency of the agricultural and food sec-tor based on the integration with the Common Market, with the Repu-blic of Moldavia, on regional and world-wide area.
FIRST PART
AGRICULTURE AND FOOD INDUSTRY DEVELOPMENT DURING THE PERIOD 1989-1992

According to the social-political changes occurred after December 1989, in agriculture and food industry, essential mutations took place in the field of property, in the organization of the activity, in the integration of the agriculture and food industry, in the process of market mechanisms building, in the agricul-tural and. food industry production, with influence upon the food security of the population.
1. Ownership and farms restructuring process development
The main process which took place in agriculture, between 1990 and 1992, was the decollectivization (dissolution of the agricultural production co-operatives), the reorganization of the state enterprises as autonomous units, the abolishment of the imperious centralized planning, being created the prem-ises for lying the whole agriculture on the basis of the private ownership.
The stages and forms in achieving this process were conditioned on the structure of the property and farms existing during the command economy, on the particular features and functions of the different factors of production in ag-riculture.
1.1. Ownership breakdown in agriculture in the late 80's During the post-war years, in agriculture took place a process of nationa-
lization and collectivization, the state and cooperatist property becoming preva-lent. The private property was considerably limited, playing a minor part The ownership break-down in agriculture offers important differentiations from a production factor to another, rrequiring particular ways and methods for its changing.
a/Structure of the landed property. The state ownership was set up by the Romanian state former proper-
ties, the land areas nationalized as effect of the 1945 Agrarian Reform Law and other subsequent laws, and by actions undertaken through hydro-ameliorating works.
The cooperatist ownership was formed mainly through the collectiviza-tion of peasant property.
The private ownership remained especially in the hills and mountains re-gions.
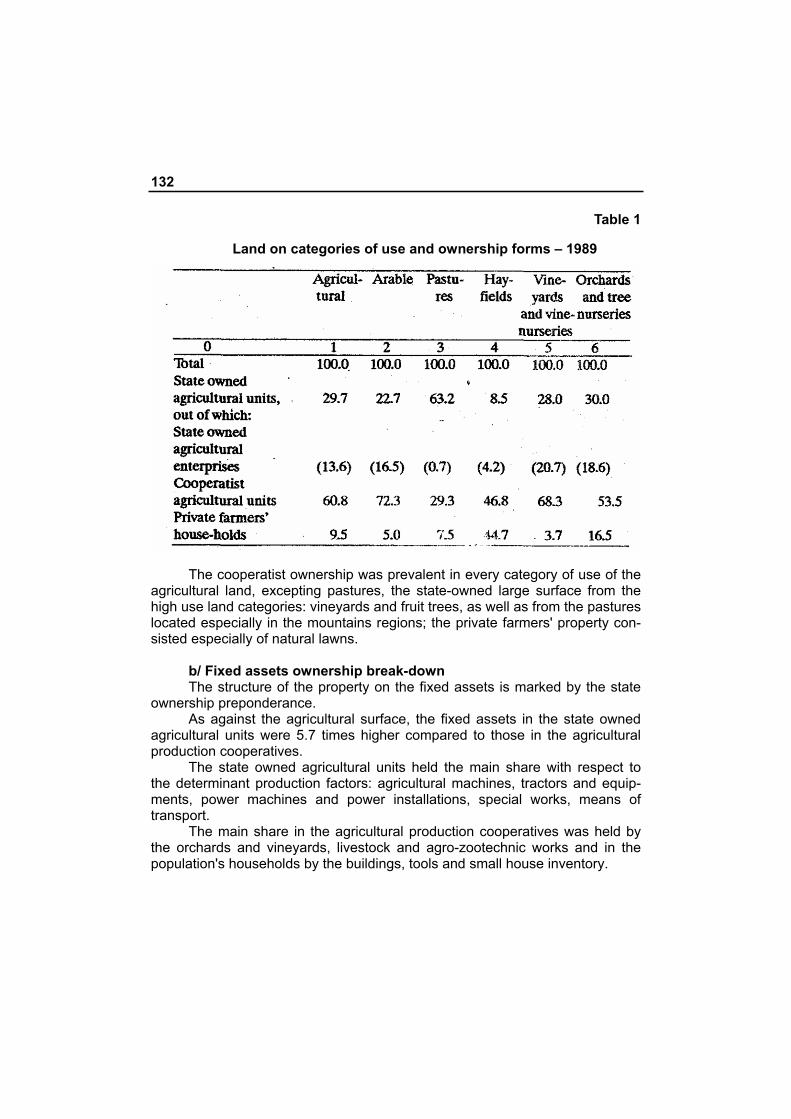
132
Table 1
Land on categories of use and ownership forms – 1989
The cooperatist ownership was prevalent in every category of use of the
agricultural land, excepting pastures, the state-owned large surface from the high use land categories: vineyards and fruit trees, as well as from the pastures located especially in the mountains regions; the private farmers' property con-sisted especially of natural lawns.
b/ Fixed assets ownership break-down The structure of the property on the fixed assets is marked by the state
ownership preponderance. As against the agricultural surface, the fixed assets in the state owned
agricultural units were 5.7 times higher compared to those in the agricultural production cooperatives.
The state owned agricultural units held the main share with respect to the determinant production factors: agricultural machines, tractors and equip-ments, power machines and power installations, special works, means of transport.
The main share in the agricultural production cooperatives was held by the orchards and vineyards, livestock and agro-zootechnic works and in the population's households by the buildings, tools and small house inventory.
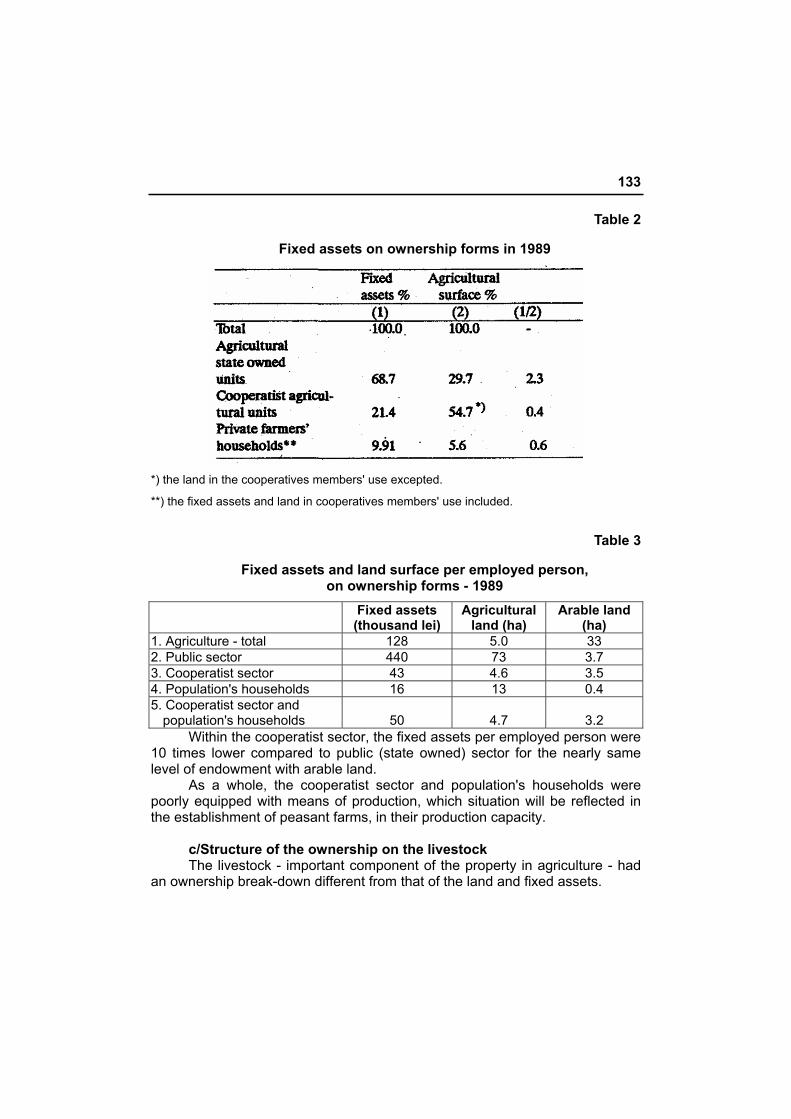
133
Table 2
Fixed assets on ownership forms in 1989
*) the land in the cooperatives members' use excepted.
**) the fixed assets and land in cooperatives members' use included.
Table 3
Fixed assets and land surface per employed person, on ownership forms - 1989
Fixed assets (thousand lei)
Agricultural land (ha)
Arable land (ha)
1. Agriculture - total 128 5.0 33 2. Public sector 440 73 3.7 3. Cooperatist sector 43 4.6 3.5 4. Population's households 16 13 0.4 5. Cooperatist sector and
population's households
50
4.7
3.2 Within the cooperatist sector, the fixed assets per employed person were
10 times lower compared to public (state owned) sector for the nearly same level of endowment with arable land.
As a whole, the cooperatist sector and population's households were poorly equipped with means of production, which situation will be reflected in the establishment of peasant farms, in their production capacity.
c/Structure of the ownership on the livestock The livestock - important component of the property in agriculture - had
an ownership break-down different from that of the land and fixed assets.
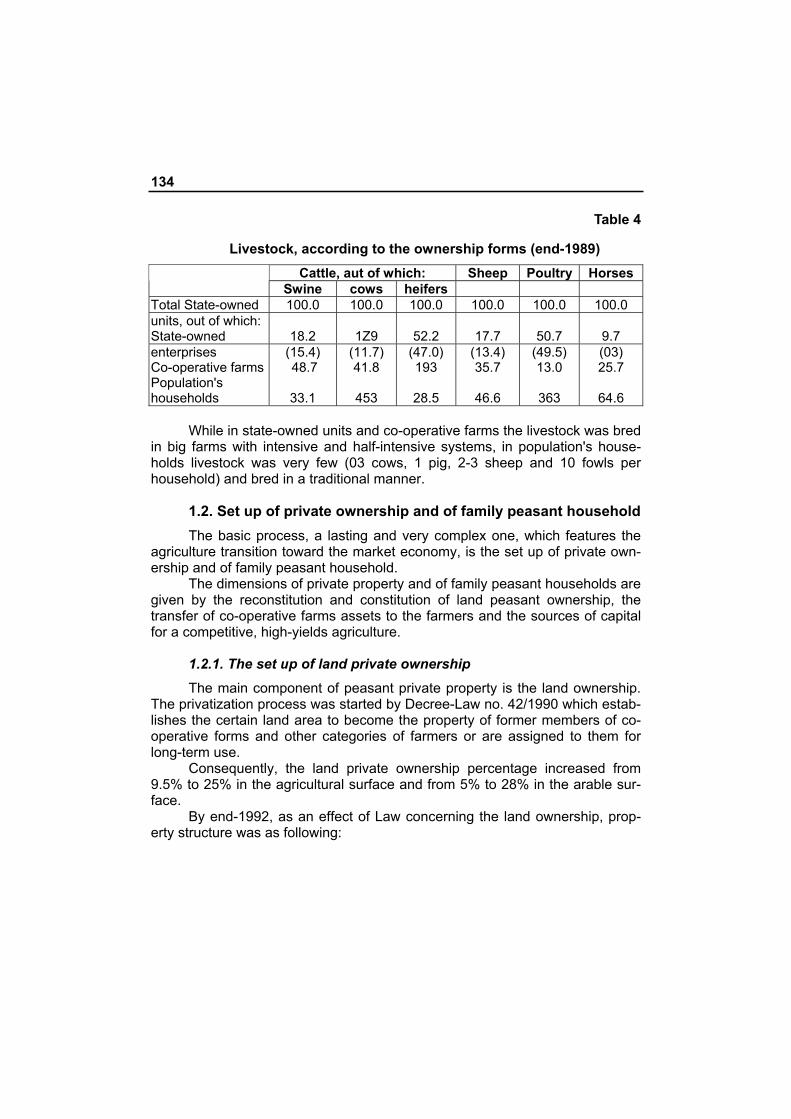
134
Table 4
Livestock, according to the ownership forms (end-1989) Cattle, aut of which: Sheep Poultry Horses
Swine cows heifers Total State-owned 100.0 100.0 100.0 100.0 100.0 100.0 units, out of which: State-owned 18.2 1Z9 52.2 17.7 50.7 9.7 enterprises Co-operative farms Population's households
(15.4) 48.7
33.1
(11.7) 41.8
453
(47.0) 193
28.5
(13.4) 35.7
46.6
(49.5) 13.0
363
(03) 25.7
64.6
While in state-owned units and co-operative farms the livestock was bred
in big farms with intensive and half-intensive systems, in population's house-holds livestock was very few (03 cows, 1 pig, 2-3 sheep and 10 fowls per household) and bred in a traditional manner.
1.2. Set up of private ownership and of family peasant household The basic process, a lasting and very complex one, which features the
agriculture transition toward the market economy, is the set up of private own-ership and of family peasant household.
The dimensions of private property and of family peasant households are given by the reconstitution and constitution of land peasant ownership, the transfer of co-operative farms assets to the farmers and the sources of capital for a competitive, high-yields agriculture.
1.2.1. The set up of land private ownership
The main component of peasant private property is the land ownership. The privatization process was started by Decree-Law no. 42/1990 which estab-lishes the certain land area to become the property of former members of co-operative forms and other categories of farmers or are assigned to them for long-term use.
Consequently, the land private ownership percentage increased from 9.5% to 25% in the agricultural surface and from 5% to 28% in the arable sur-face.
By end-1992, as an effect of Law concerning the land ownership, prop-erty structure was as following:
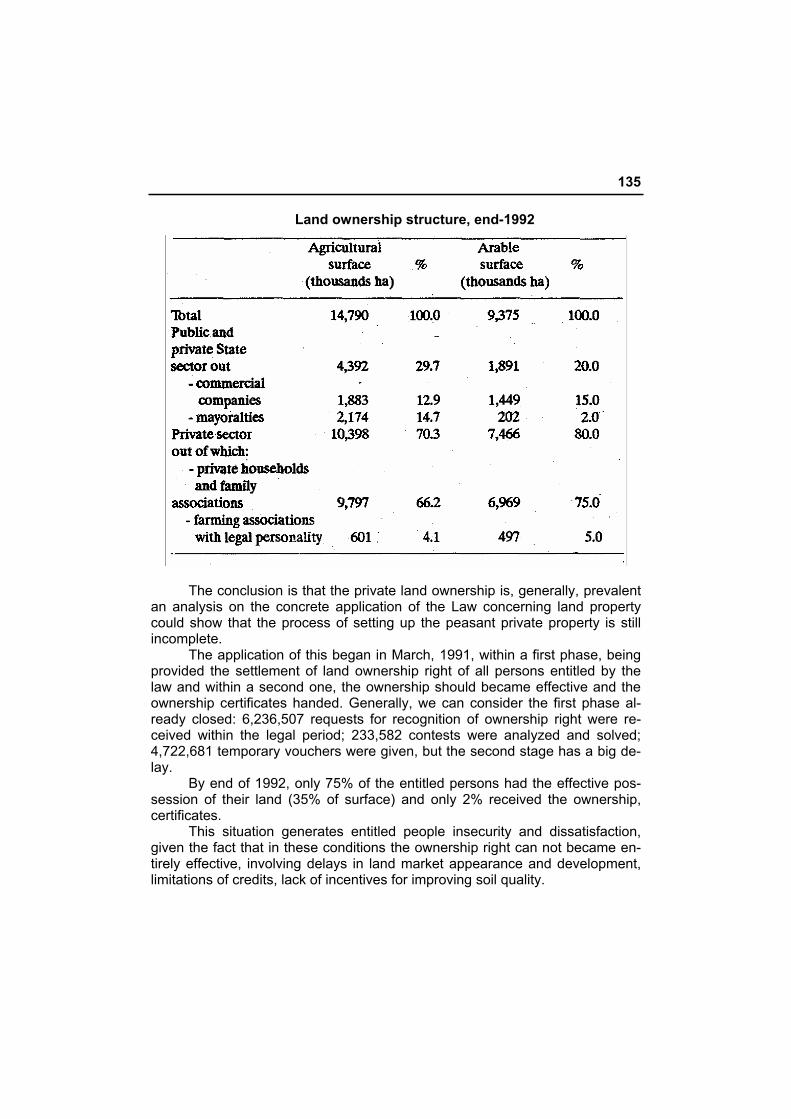
135
Land ownership structure, end-1992
The conclusion is that the private land ownership is, generally, prevalent
an analysis on the concrete application of the Law concerning land property could show that the process of setting up the peasant private property is still incomplete.
The application of this began in March, 1991, within a first phase, being provided the settlement of land ownership right of all persons entitled by the law and within a second one, the ownership should became effective and the ownership certificates handed. Generally, we can consider the first phase al-ready closed: 6,236,507 requests for recognition of ownership right were re-ceived within the legal period; 233,582 contests were analyzed and solved; 4,722,681 temporary vouchers were given, but the second stage has a big de-lay.
By end of 1992, only 75% of the entitled persons had the effective pos-session of their land (35% of surface) and only 2% received the ownership, certificates.
This situation generates entitled people insecurity and dissatisfaction, given the fact that in these conditions the ownership right can not became en-tirely effective, involving delays in land market appearance and development, limitations of credits, lack of incentives for improving soil quality.
136
Consequently, the production had a negative evolution, as well as the costs and prices of agricultural produces.
The causes of delays in setting up the land ownership and in handing the ownership certificates are as following:
− wrong activity of local and districtual commissions; − lack of technical equipment and specialists in topographic
measurements who should measure and mark more than 30 million parcels;
− failure in insurances of the rhythmic monthly payment of specialists, commission members and auxiliary personnel wages;
− -lack of interest of some owners, especially of those living in towns, in participating in the land partition action;
− the high complexity of land property right establishment action, due to both natural and social factors.
1.2.2. Setup of the production means private ownership The primary source of production means private property was the trans-
fer of a part of the former co-operative farms assets to their members. The co-operative farms fixed assets value was very low, only Lei 43,000 per active person and Lei 7,687 per arable hectare. Besides, the buildings, special con-structions and irrigation systems represented 60% in the fixed assets' structure, raising a lot of difficulties in their transfer to the peasant households.
The law concerning land property provides the modalities of the fixed as-sets property transfer. Big disorders in the application of this law led to the diminution of the transferable assets (i.e: evaluation of assets below their value; illegal sale, without observance of auction rules; demolition of buildings and destruction of irrigation systems, vine-yards and orchards; high livestock decrease due to high mortalities and excessive slaughtering; robberies and abuses). The unreasonable prolongation of the activity of the commissions in charge with the liquidation of former co-operative farms patrimony led also to the diminution of this patrimony through payment for the commissions’ mem-bers’ wages, the devaluation of undistributed funds due to inflation. Conse-quently, the family households received small parts of the co- operative assets, both in financial and in-kind terms.
Livestock is part of peasant private property, too. At the end of 1992, 85% of cattle, 89% of sheep, 59% of swine and 56% of poultry were owned by family households.
Also tractors and agriculture machinery are part of private property. There is a trend of quite a fast increase in tractors number: from 6,099 in to 22,021 in 1991 and 30,600 by end October 1992; besides, there is an import number of tractors in the agricultural companies: 4,049 in 1990, 4,533 in 1991 and 10,285 in 1992.
137
The share of tractors owned by the -family households and agricultural companies rose at 24% in the total number in 1992, approaching of the share of state-owned commercial companies in the total number of tractors (28%). These changes occurred within the context of a general decrease of total num-ber of tractors, from 151,745 in 1989 to 135,123 in 1992, as a result of quash-ing a big number of tractors, while quite a few were bought.
The increase in number of the family households' tractors was not ac-companied by a similar increase in number of agricultural machinery, leading to a low of the first in land tilling.
Application of Law concerning land ownership generates some specific process:
a) appearance of small properties - below 1.8 ha in average-which hold few and low-quality equipment. The average size of areas owned by the 511,805 new owners is 0.9 ha;
b) an important area is owned by non-agricultural population (about 1/3 and aged persons (cca. 1/4). The active population owns only approx. 40-45% of the land; this situation rises difficulties regarding the good utilization of this land, production organization and future development of agriculture;
c) the excessive crumbling of land into a very high number of parcels (according to some preliminary estimations about -30 millions) which will have negative effects on irrigation systems use, soil erosion, draining, tilling and production costs. In many cases, land partition was made from top-hill towards valley and in irrigated areas without taking into account the reasonable use of irrigation equipment;
d) the relative small size of family households leads to appearance of partial work-time phenomenon and of requests of employment in agriculture, agricultural services or other activity, in order to increase the revenue;
e) the set up of a big number of peasant households with a low produc-tion capacity (subsistence production), which have limited possibilities of integration within the market economy flows.
1.3. Privatization of agricultural state sector The agricultural State sector contains more kinds of enterprises, with
different activities and functions, and that leads to the necessity of a different approach of the privatization process, both in methods and subjects.
a) Privatization of agricultural commercial companies Pursuant to Law no. 31/1990, 411 agricultural state enterprises were
transformed into agricultural commercial companies. By the end of 1992, these companies held 12.9% of the agricultural land (16.1% of the arable land, 25%
138
of the vine-yards, 5.7% of the pastures and hayfields), 13% of cattle, 50% of swine, 11% of sheep and 44% of poultry; 28% of tractors, 33% of combines. During 1990-1992, both livestock and agricultural machinery (including trac-tors) decreased in absolute expression.
The soil resources, among the most fertile across the country, as well as the material resources existing within this sector, prove a high productive po-tential, important for its contribution to the total agricultural output In 1991, these companies produced 3,033 tons of grains (19%), 137,000 tons of sunflo-wer (27%), 454,000 tons of vegetables (20%), 293,000 tons of grapes (30%),. 430,000 tons of fruits (29%); 341,000 tons of meat (58%), 2,386,000 hi of cow milk (43%), 944 million eggs.
The subject of privatization of these companies is their patrimony of a Lei 500 billion value, consisting mainly land and fixed assets.
In the total agricultural area (1,912,100 ha), 530,000 ha were owned by cca 176,000 persons, who became share-holders. The value of shares given to entitled people is about 15 % of the social capital of all agricultural commercial companies, this percentage being considerably higher if only the 463 compa-nies holding land and therefore having share-holders, are taken into account.
Consequently, the social capital of these companies became, as an ef-fect of Law regarding land ownership, joint - State and private - capital If also the transfer of 30% of the social capital of Private Ownership Funds is taken into consideration, the share of the private capital of agricultural commercial companies holding land is about 50%.
b) Privatization of mechanical services companies There are 508 such companies, which hold the most part of mechanical
means: 48% of tractors, 69% of seeders, 79% of combines. Their main activity consists in running mechanical works for private far-
mers and associations. During 1990-1992, the number of tractors and agricultural machinery and
the volume of the mechanical works decreased. By end-1991, the assets of these companies had a value of Lei 28.6 bil-
lion, out of which: the fixed assets - Lei 26.7 billion and the circulating assets - Lei 1.9 billion.
The privatization of these companies has made as following: − through the transfer of 30% of the social capital of the Private Owner-
ship Funds; − sale of assets; − renting tractors and agricultural machinery to farmers' associations
and companies, through contracts, according to Government Decision no. 1228/1990.
139
c) Privatization in the sector of land reclamation By this time, there are 106 commercial companies running in construc-
tions, mechanization and the sector of land reclamation. They are responsible for the land reclamation systems: more than 3 million hectares of irrigations, more than 3 million hectares of draining works, more than 2 million hectares of works against soil erosion, and 1,270 km of dams. Using these systems, the land reclamation companies can considerably contribute to a high and stable level of agricultural output
During 1990-1992, the land reclamation systems suffered a strong dete-rioration and subutilization.
The ownership, administration and utilization structure in the land recla-mation sector is as following:
IRRIGATIONS: − water equipment of national importance (pumping stations, water
plugs, pression stations, channels, water pipes, protection equipment, related buildings) are owned by the State and managed and operated by land reclamation districtual commercial companies (SCELIF);
− local equipment (pipes, channels, hydrants and antennae) belong to commercial companies with State and private capital (former State Agricultural Enterprises - SAE), are State ownership and managed and maintained by joint-capital agricultural commercial companies;
− local land reclamation systems which belonged to former co- operati-ve farms, achieved by them selves, were taken - part of them - by specialized companies (SCELIF), together with outstanding credits at the moment of transfer, according to Article 33 of Law no. 18/1991, in order to be managed and maintained.
The former co-operative farms which reimbursed the whole investment value of these works, refused to give the to SCELIFS, keeping the ownership of this equipment after their transformation into private association.
DRAININGS: − works of common interest (pumping stations, equipment for removal
of excessive water, main collecting channels and related buildings) belong to the State and are managed, maintained and operated by SCELIFS;
− works against soil erosion, terraces, small buildings and inner channels belonging to commercial companies with joint capital (former SAE), are managed and maintained by these last ones;
− local systems (inner channels and related buildings situated on the land belonging to joint capital commercial companies (former SAE), are owned, managed and operated by these companies;
140
− local systems which belonged to former co-operative farms were transferred to specialized companies (SCELIFS), according to Article 33 Law no. 18/1991.
WORKS AGAINST SOIL EROSION: − works of national social interest as evacuation channels, works for
stopping soil erosion, accumulation dams, and other similar works belong to the State and are managed and maintained by SCELIFS;
− local works against soil erosion as terraces, inner channels, small buildings, belonging to joint capital commercial companies (former SAE) are managed and maintained by these companies;
− local works belonging to former co-operative farms were transferred to SCELIFS, according to Article 33 of Law no. 18/1991.
1.4. Privatization of food industry Food industry activity, managed by Food Department, developed until
1990 within 365 State enterprises. After 1990, through restructuring and reor-ganization of food sector, were established 431 commercial stock companies and an autonomous regie (for tobacco processing activities).
Level of privatization in this field is very low, only 14 assets out of total number of 240 assets proposed for sale being sold.
Only 2 enterprises were entirely privatized: "URSUS" S.A. form Cluj-Napoca (brewery) and "Industria Cărnii" S.A. from Paşcani (meat processing factory), bought by its own employees. Their privatization had as main goal not only to increase employees' economic interest, but also modernization and de-velopment
Food industry enterprises suffered a decrease of their mobilization de-gree and a diminution of resources of gross capitalization. Their monopoly po-sition, the lack of competition and bad adjustment to market economy require-ments led to financial blockage which influenced negatively both their own and farmers activity.
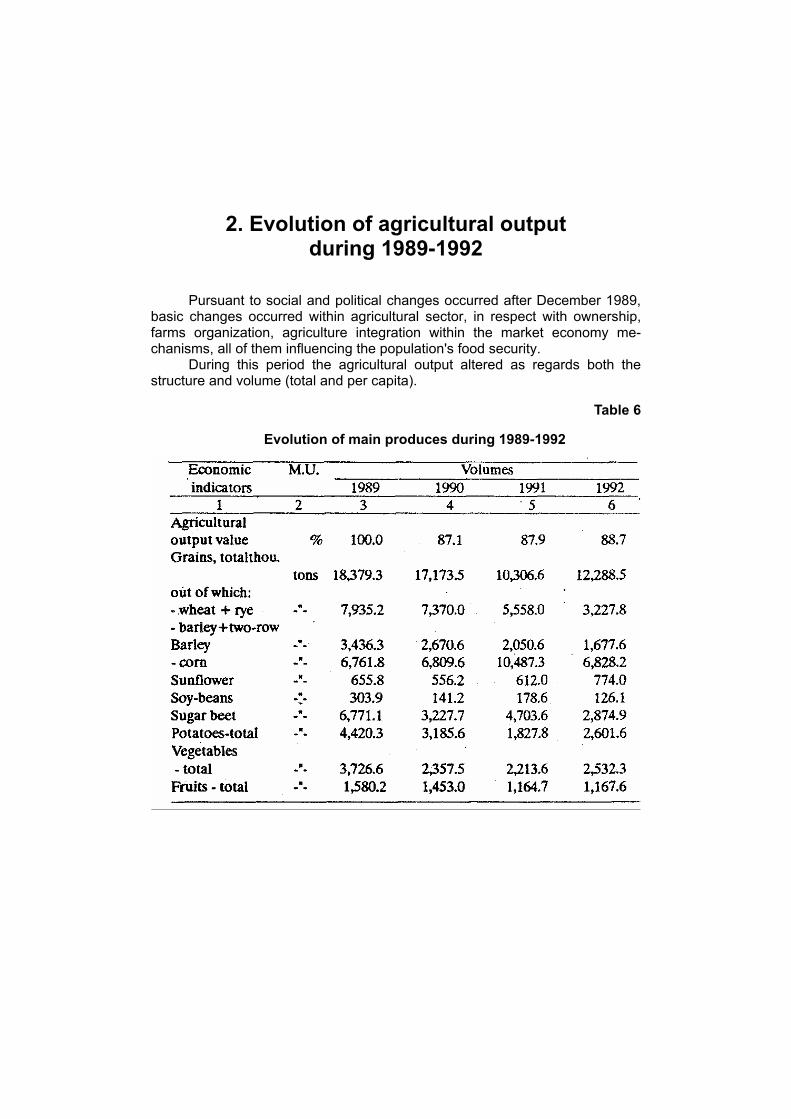
2. Evolution of agricultural output during 1989-1992
Pursuant to social and political changes occurred after December 1989, basic changes occurred within agricultural sector, in respect with ownership, farms organization, agriculture integration within the market economy me-chanisms, all of them influencing the population's food security.
During this period the agricultural output altered as regards both the structure and volume (total and per capita).
Table 6
Evolution of main produces during 1989-1992
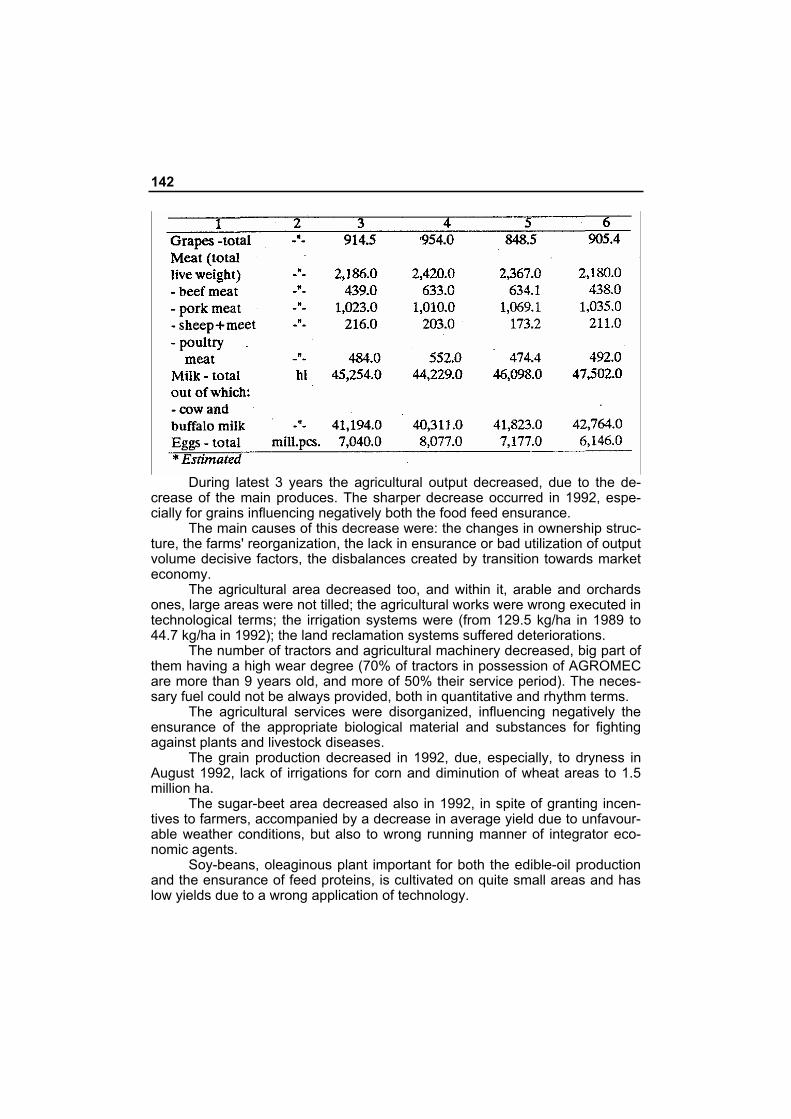
142
During latest 3 years the agricultural output decreased, due to the de-
crease of the main produces. The sharper decrease occurred in 1992, espe-cially for grains influencing negatively both the food feed ensurance.
The main causes of this decrease were: the changes in ownership struc-ture, the farms' reorganization, the lack in ensurance or bad utilization of output volume decisive factors, the disbalances created by transition towards market economy.
The agricultural area decreased too, and within it, arable and orchards ones, large areas were not tilled; the agricultural works were wrong executed in technological terms; the irrigation systems were (from 129.5 kg/ha in 1989 to 44.7 kg/ha in 1992); the land reclamation systems suffered deteriorations.
The number of tractors and agricultural machinery decreased, big part of them having a high wear degree (70% of tractors in possession of AGROMEC are more than 9 years old, and more of 50% their service period). The neces-sary fuel could not be always provided, both in quantitative and rhythm terms.
The agricultural services were disorganized, influencing negatively the ensurance of the appropriate biological material and substances for fighting against plants and livestock diseases.
The grain production decreased in 1992, due, especially, to dryness in August 1992, lack of irrigations for corn and diminution of wheat areas to 1.5 million ha.
The sugar-beet area decreased also in 1992, in spite of granting incen-tives to farmers, accompanied by a decrease in average yield due to unfavour-able weather conditions, but also to wrong running manner of integrator eco-nomic agents.
Soy-beans, oleaginous plant important for both the edible-oil production and the ensurance of feed proteins, is cultivated on quite small areas and has low yields due to a wrong application of technology.
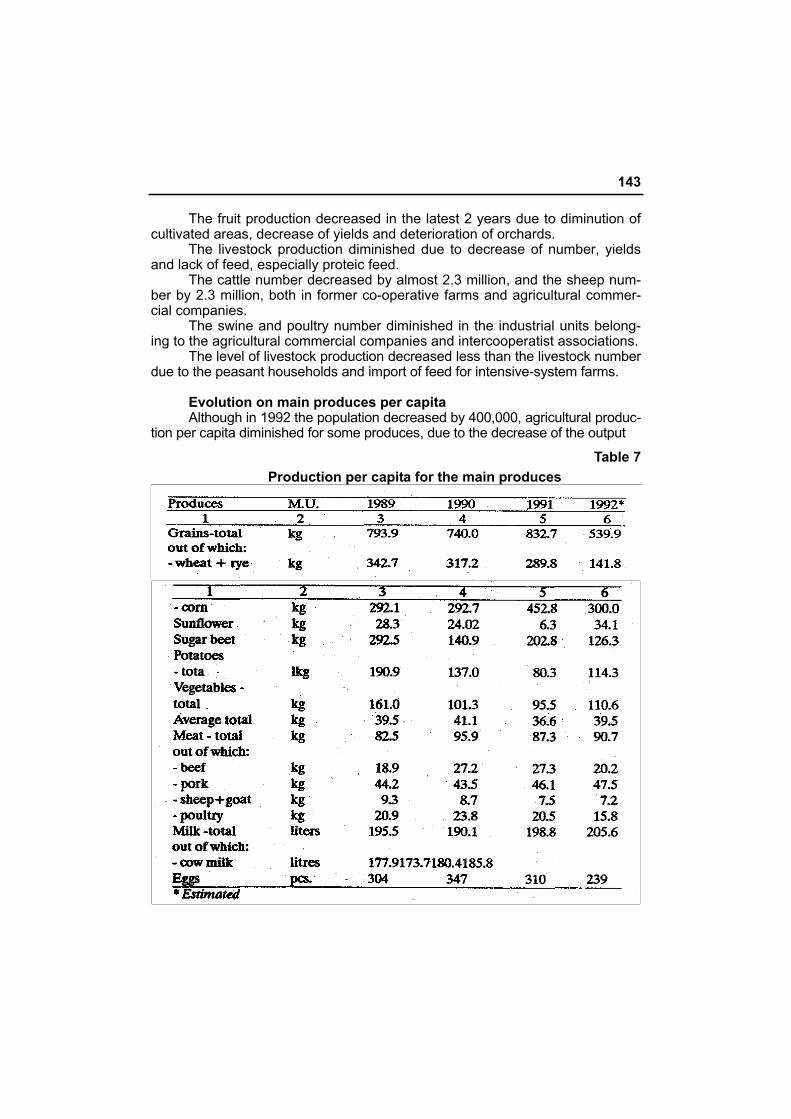
143
The fruit production decreased in the latest 2 years due to diminution of cultivated areas, decrease of yields and deterioration of orchards.
The livestock production diminished due to decrease of number, yields and lack of feed, especially proteic feed.
The cattle number decreased by almost 2.3 million, and the sheep num-ber by 2.3 million, both in former co-operative farms and agricultural commer-cial companies.
The swine and poultry number diminished in the industrial units belong-ing to the agricultural commercial companies and intercooperatist associations.
The level of livestock production decreased less than the livestock number due to the peasant households and import of feed for intensive-system farms.
Evolution on main produces per capita Although in 1992 the population decreased by 400,000, agricultural produc-
tion per capita diminished for some produces, due to the decrease of the output
Table 7 Production per capita for the main produces
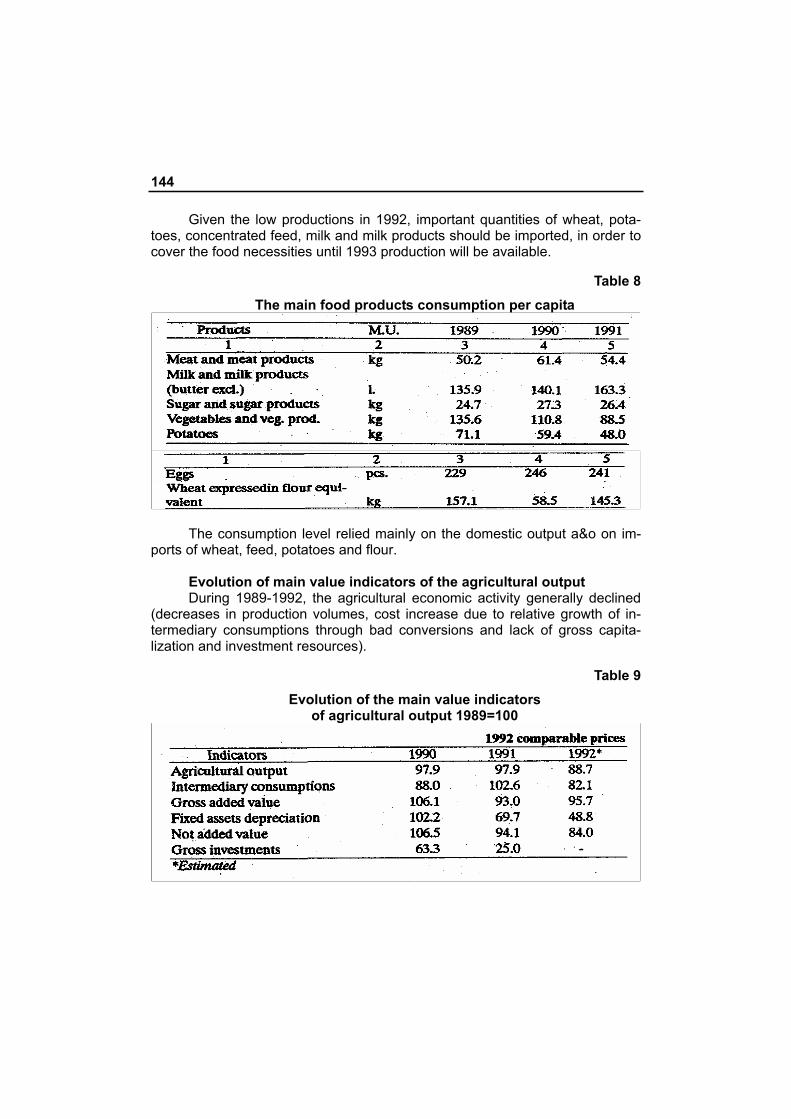
144
Given the low productions in 1992, important quantities of wheat, pota-toes, concentrated feed, milk and milk products should be imported, in order to cover the food necessities until 1993 production will be available.
Table 8 The main food products consumption per capita
The consumption level relied mainly on the domestic output a&o on im-
ports of wheat, feed, potatoes and flour. Evolution of main value indicators of the agricultural output During 1989-1992, the agricultural economic activity generally declined
(decreases in production volumes, cost increase due to relative growth of in-termediary consumptions through bad conversions and lack of gross capita-lization and investment resources).
Table 9 Evolution of the main value indicators
of agricultural output 1989=100
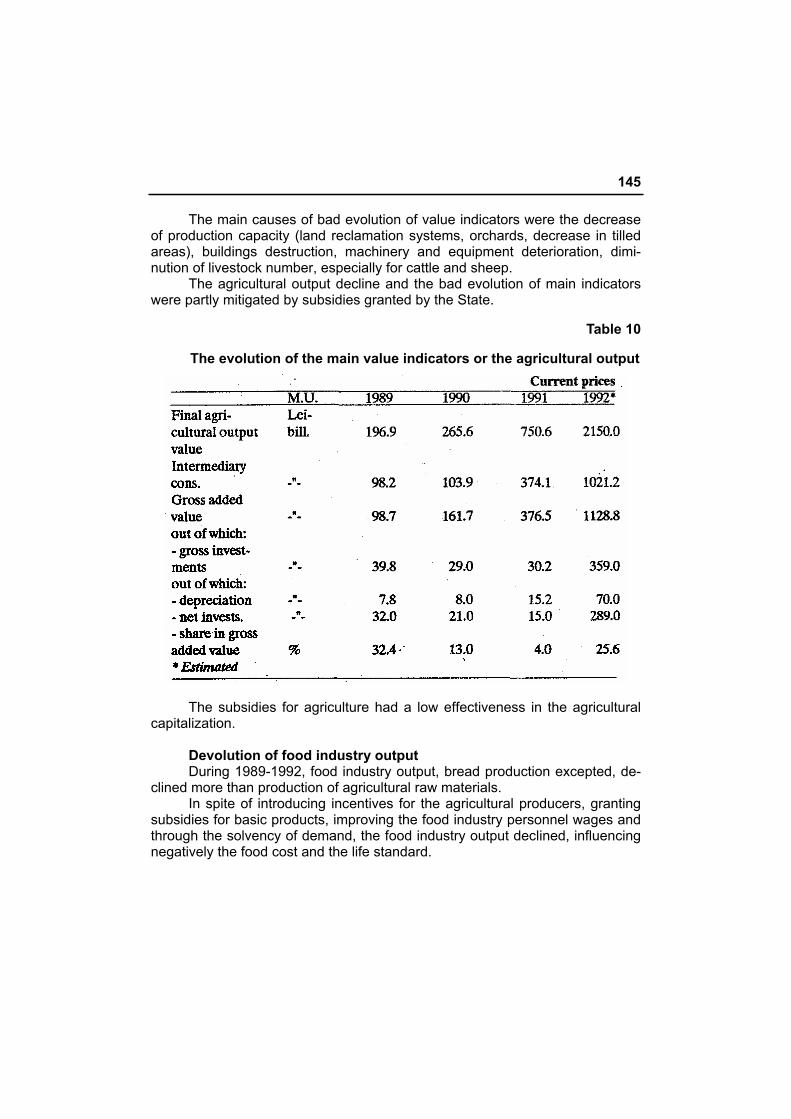
145
The main causes of bad evolution of value indicators were the decrease of production capacity (land reclamation systems, orchards, decrease in tilled areas), buildings destruction, machinery and equipment deterioration, dimi-nution of livestock number, especially for cattle and sheep.
The agricultural output decline and the bad evolution of main indicators were partly mitigated by subsidies granted by the State.
Table 10
The evolution of the main value indicators or the agricultural output
The subsidies for agriculture had a low effectiveness in the agricultural
capitalization. Devolution of food industry output During 1989-1992, food industry output, bread production excepted, de-
clined more than production of agricultural raw materials. In spite of introducing incentives for the agricultural producers, granting
subsidies for basic products, improving the food industry personnel wages and through the solvency of demand, the food industry output declined, influencing negatively the food cost and the life standard.
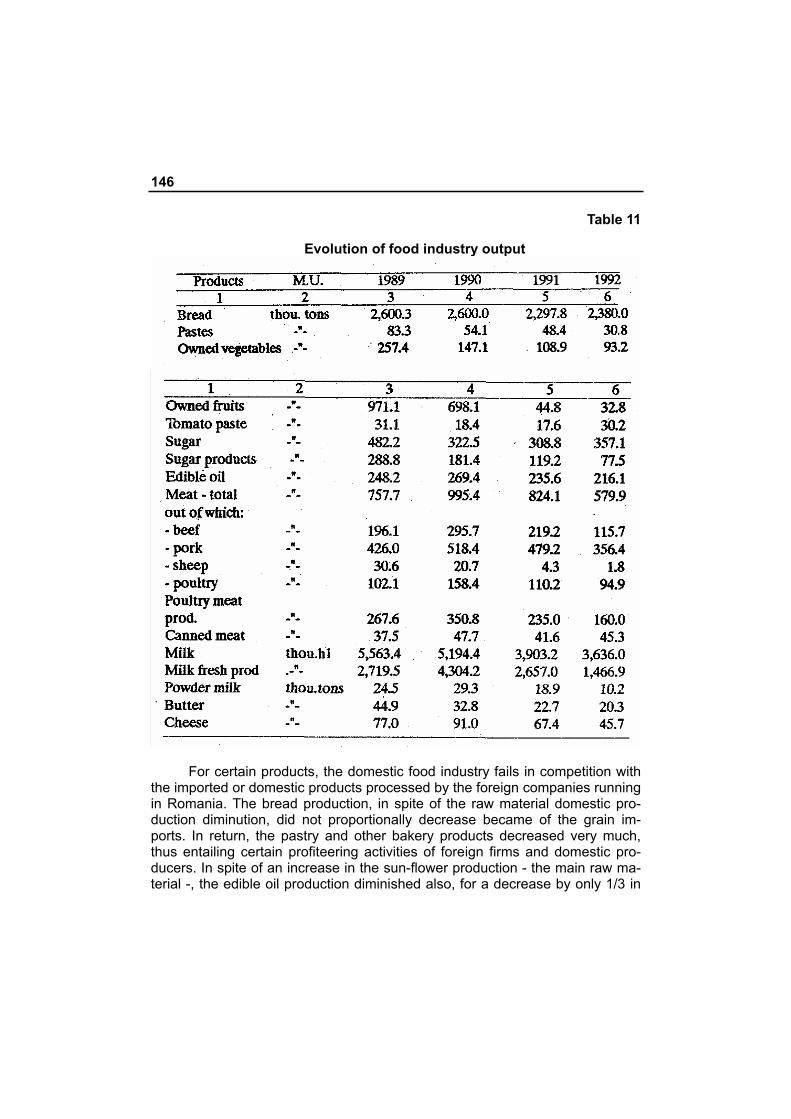
146
Table 11
Evolution of food industry output
For certain products, the domestic food industry fails in competition with
the imported or domestic products processed by the foreign companies running in Romania. The bread production, in spite of the raw material domestic pro-duction diminution, did not proportionally decrease became of the grain im-ports. In return, the pastry and other bakery products decreased very much, thus entailing certain profiteering activities of foreign firms and domestic pro-ducers. In spite of an increase in the sun-flower production - the main raw ma-terial -, the edible oil production diminished also, for a decrease by only 1/3 in
147
the production of vegetables and fruits, the production of canned vegetables and fruits by almost 50%.
For the sugar beet production, in spite of large incentives granted to the producers and subventions to the sugar mills, the domestic production became incompetitive, the respective units suffering blockings and losses, the produ-cers not being concerned with the sugar beet production.
The live (weight) of the meat production recorded a decrease and the diminution in the industrial production of meat and meat products was of 1/3.
In 1992, the milk production increased by 200 thousand his., while the industrial milk production for consumption decreased by 300 thousand his; the diary produce diminished by almost 1/3, the butter production by over 50%, and the cheese production by almost 40%. In most cases being based on state ownership and holding the monopoly, the food industry units seem stiff, not succeeding in adjusting to the market economy mechanisms.
3. The agricultural foreign trade between 1989-1992
During the above period, the agricultural foreign trade has been influ-enced by:
− the failure of the agro-food sector, deepened in 1991 and 1992; − the diminution of food stuff self-supplying, and − the collapse of foreign economic relations with the former CMEA
countries and use of hard currency in trade operations. Taking into account the effects, the above mentioned factors resulted in: − a 16% decrease in the agricultural foreign trade volume in 1992, as
compared to 1989; − a turnover in the export and import ratio by a substantial (13%) de-
crease of exports and a sudden 90.6% increase of imports; − a turnover of the agricultural foreign trade balance from a former sur-
plus to a deficit in 1990-1992. The annual average of the above mentioned deficit was almost 36% of
the whole foreign trade deficit in hard currency, and 52% in 1992. The high agricultural trade deficit between 1990-1992 reflects the big vo-
lume of the imported food resources. As the deficit turned into foreign debt, we may conclude that the most important part of our whole foreign debt during these years has been committed in the procurement of the consumer food stuff.
Therefore, our agriculture foreign trade has turned from a development oriented into a surviving trade, i.e. a consumer one.
Structural alterations on both export and import sides have taken pla-ce in the agricultural foreign trade.
The export analysis shows a general trend of decrease in volume and a change of proportions between crops and animal products. Whereas the export of crops produces keeps on restraining - due to the decline of the agricultural output - the export of animal products is being kept at a high level, particularly due to the export of livestock (especially cattle and sheep), with a negative impact on their number.
With respect to the imports, we further mention the expenditures in hard currency made by our Government in order to procure not only such vital consumer goods (as sugar) and animal food (fodders), but also such goods as alcohol and tobacco.
The volume of expenditures made in respect of the latter- an annual average of US $ 90 million between 1990-1992 exceeded by far the expen-
149
ditures made for the procurement of fodders (US $ 72 million within the same period).
During the said period, the Romanian agriculture benefited from loans and grants from the international financial organizations (IBRD and EBRD), as well as from other governments as: USA, Great Britain, Canada, France, Holland and Austria.
Some of these external resources have been already used, some of them are being implemented.
There are great difficulties in elaborating the projects, aswell as in the relationships between the Agricultural Bank, "Romcereal" and the private farmers.
4. The process of setting up and acting in a market economy
The development of agriculture and of the whole economy reflects a mixture between the structural crisis consequences of the old central planned regime and the transition to a market economy, amplified in this field by deep changes in a short run, yet without property preparing the conditions and the predictable evaluation of the economic and social effects.
Agriculture has abandoned the central planned system before other eco-nomic branches; without previously setting up the market self-regulating mechanisms and the government involvement.
There is a lack of balance between the new agricultural structure set up by giving up the old system, and the existing old structures in other fields of activity. We may also add the problems created by the continuing separation of land ownership from certain decisive production means such as tractors and other agricultural machines, the hydro systems and storage facilities.
The mainly state-owned agricultural commercial companies have used their autonomy not as much for the increase in output at lower costs through efficient conversion of production means, as for request to increase prices and wages.
The remake of small family farms led of to a rebirth of situations and practices to this type of agriculture: small production, a surviving type of production and slight connection with ihe market, a certain behaviour of the farmers - that in most cases does not comply with the trends of a market economy (like the excessive storage of crop, reluctance to ask for credit, use of obsolete means and technologies).
Price liberalization has created unbalanced situations both at the branch level and in its relationship with other branches.
An inflation of costs arose, due to the increase in the distribution costs from the outside branch. As a result, the price index for agricultural produces was 21 times higher at the end of 1992 than in 19S9, and the price index of the industrial output for agriculture was 28 times higher; the inflation has been also influenced by the inefficiency of self distribution costs and the automatic enclosure of the increased costs in prices.
During the said period, the Government has subsidized both the fanners and the food consumers. The subsidies consisted mainly in production factors (proteic fodders, fertilizers, pesticides, Diesel oil, veterinary assistance), finan-cial support through subsidized credit, use of the fiscal system (tax credits and/or tax exemptions).
The above mentioned subsidies have only partly reached their goal, mainly because of the deficiencies in managing and using them. The consumer
151
subsidies meant price limits to such foods tuff, as: bread, fresh milk, butter, edible oil, sugar, and categories of meat and meat products.
Both producer and consumer subsidies have a diminishing trend, re-flecting the "unbudgeting" of the economy.
The lack of balance arising in the agricultural field and in its relationship with other economic sectors were due to: the increase of people income and lack of offer; the collapse of the "agricultural cooperatives" and the land redistribution; the lack of capital and decrease of investment funds out of the public budget; the decrease of the energy resources, particularly the Diesel oil; the non-allocation of minimum quantity of fertilizers and pesticides; deficiencies in utilizing the producing capacities, especially the irrigation and drainage areas, vineyards and fruit-trees plantations; the worsening of economic agents' relationships with their suppliers of spare-parts, seed, etc., the big losses of fixed assets, especially cattle and agro-zootechnical buildings formerly belon-ging to the "agricultural cooperatives"; the decrease of labour efficiency and the increase in production costs.
Although the agricultural and food industry output decreased, and the economic and financial indicators worsened, both the agriculture and food industry benefit from enough natural and human resources, as well as a production technology that may ensure - if utilized efficiently - restoration of these fields and contribute to secure the food problem and to develop the national economy.

SECOND PART
CONTINUATION OF REFORM, TARGETS, TRENDS AND MEANS OF ACTION

1. Targets
The fundamental strategic goal is the establishment of a modern agro-food economy which, based upon the setting up and development of a long lasting agriculture and a market economy, could stop the declining output, lead to a balance between food offer and demand, contribute to solve the food pro-blem.
Due to the potential conditions of our country - enabling to produce al-most all goods necessary to a proper food supply of people - as well as to the availability to face the international challenges, the main option is the multi-lateral development of agriculture.
However, this excludes the autarchic development and Romania partici-pates in the international division of labour within the agricultural field, starting from thetriteria of efficiency and compared advantages.
In order to improve the food consumption, the output is projected to in-crease between 1993-1996, so that at the end period to obtain 800-900 kg ce-reals/inhabitant, 35-46 kg sun-flower beans, 260-300 kg sugar beet, 130-175 kg potatoes, 95-113 kg meat, 240- 285 litres cow milk, 310-390 eggs (all per inhabitant).
1.1. Predictable trends in the evolution of the main agricultural products between 1993-1996
In projecting the structure and evolution of the main agricultural produces between 1993-1996, the following issues have been taken into account:
− the setting up of a proper production structure according to the clima-te conditions and the consumer needs (grain, sun-flower, sugar-beet, vegetables, potatoes, soya fruit, grapes, meat, milk, eggs);
− the stop of the declining of the output in 1993 and its increase in order to ensure the consumption out of the domestic output, linked with the demand;
− the utilization as much as possible of the land resources, the existing material basis and the economic means, to allocate the material resources;
− the means of setting up the agricultural capital and supporting the agricultural development out of the public budget for investment and subsidies to protect crops and animals, train the farmers, make scientific research and procure means of production;
− the changes in the ownership and the process of setting up family farms, agricultural commercial companies and agricultural service.
Considering the phenomena and the whole agricultural process that are taking place, the evolution of new forms of organization and the means to allo-cate material and financial resources, three (3) alternatives (minimum, medium
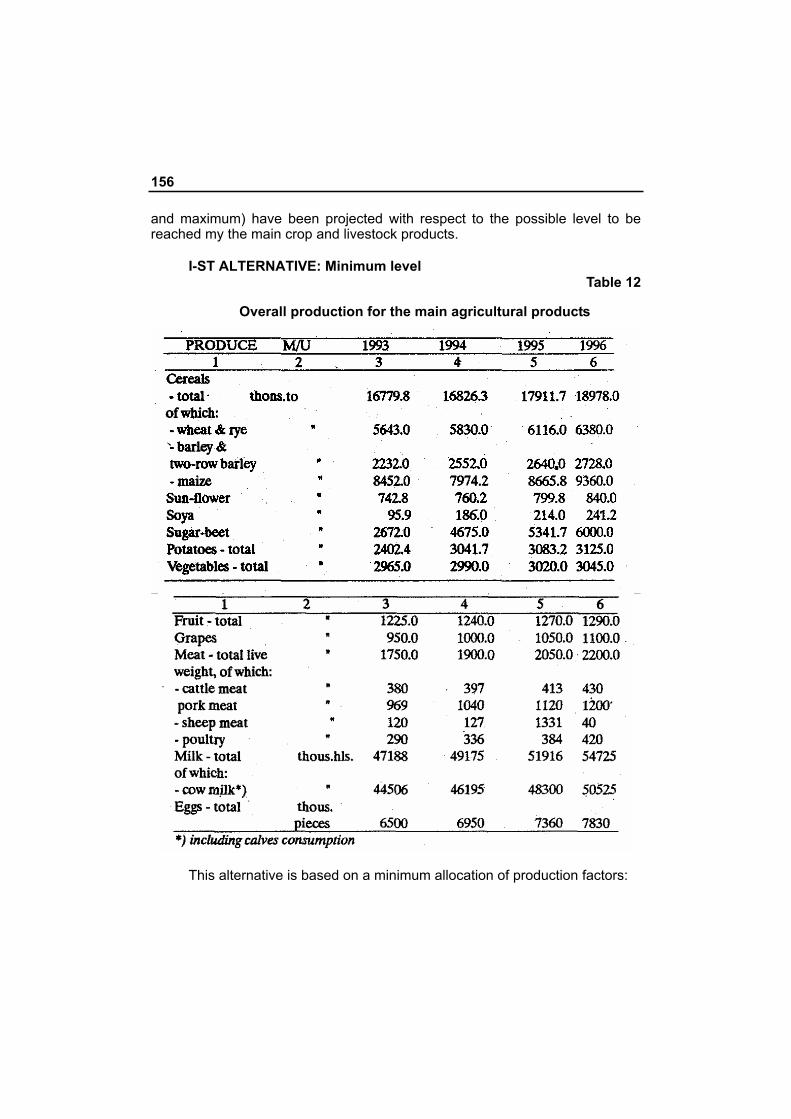
156
and maximum) have been projected with respect to the possible level to be reached my the main crop and livestock products.
I-ST ALTERNATIVE: Minimum level
Table 12
Overall production for the main agricultural products
This alternative is based on a minimum allocation of production factors:
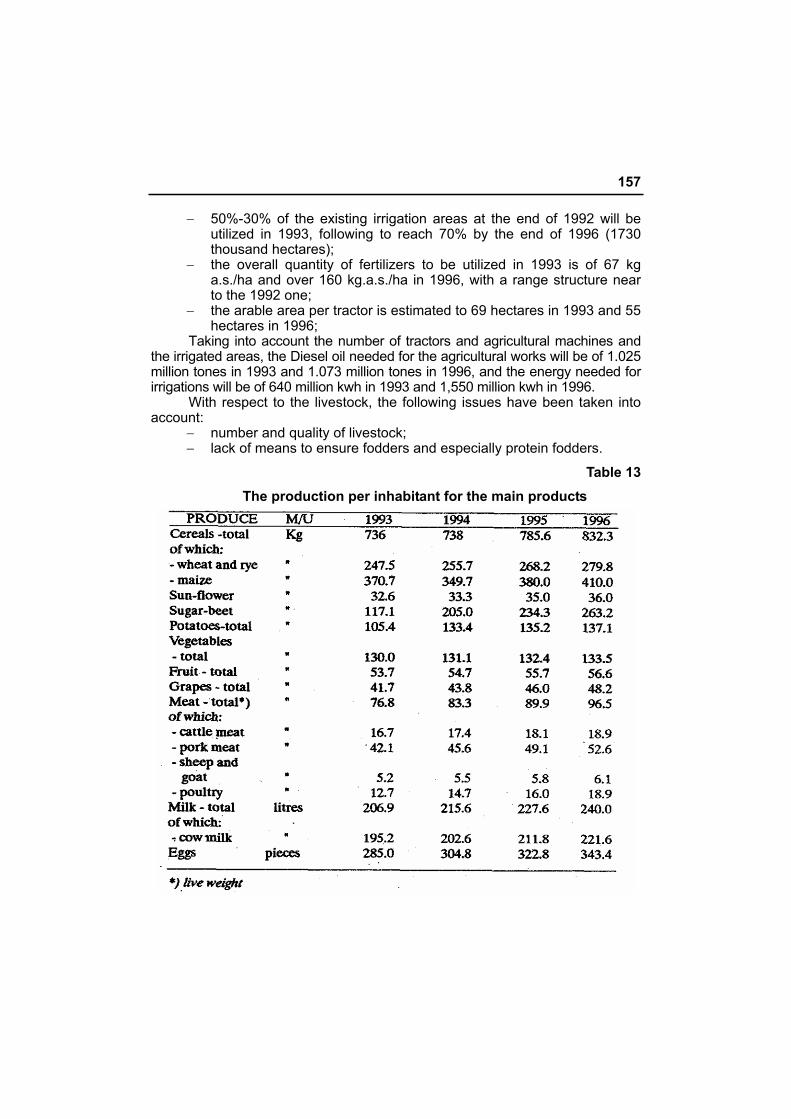
157
− 50%-30% of the existing irrigation areas at the end of 1992 will be utilized in 1993, following to reach 70% by the end of 1996 (1730 thousand hectares);
− the overall quantity of fertilizers to be utilized in 1993 is of 67 kg a.s./ha and over 160 kg.a.s./ha in 1996, with a range structure near to the 1992 one;
− the arable area per tractor is estimated to 69 hectares in 1993 and 55 hectares in 1996;
Taking into account the number of tractors and agricultural machines and the irrigated areas, the Diesel oil needed for the agricultural works will be of 1.025 million tones in 1993 and 1.073 million tones in 1996, and the energy needed for irrigations will be of 640 million kwh in 1993 and 1,550 million kwh in 1996.
With respect to the livestock, the following issues have been taken into account:
− number and quality of livestock; − lack of means to ensure fodders and especially protein fodders.
Table 13 The production per inhabitant for the main products
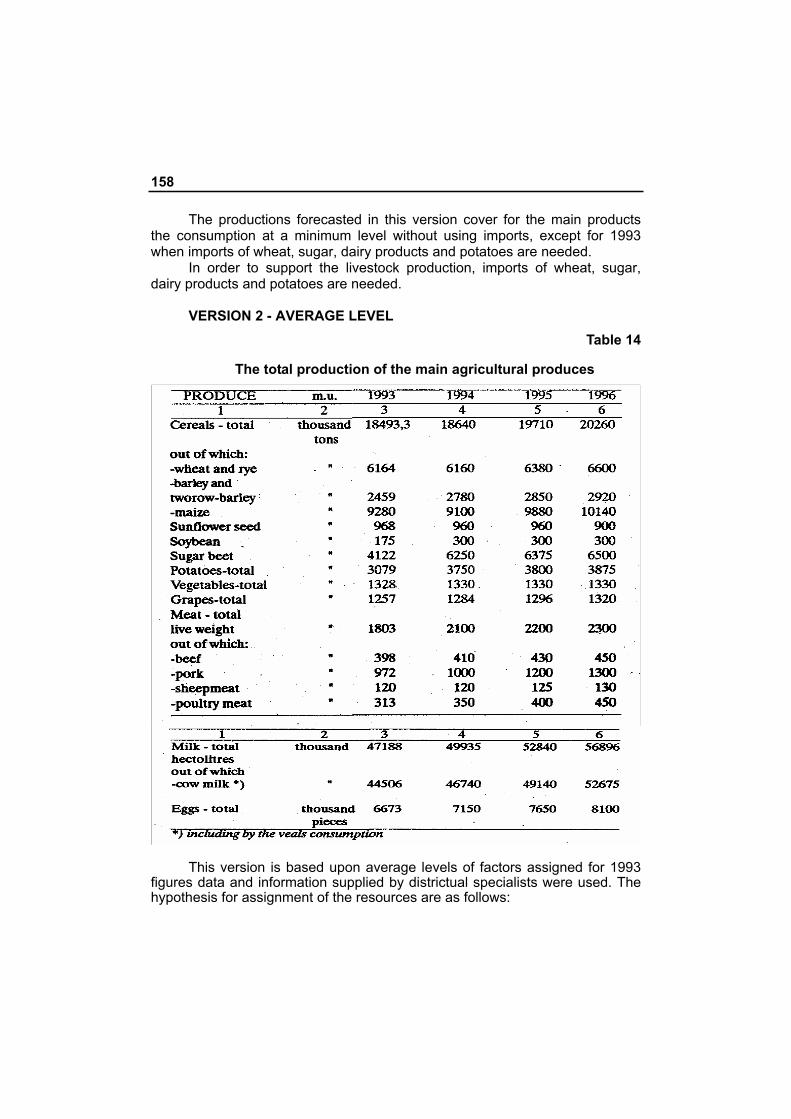
158
The productions forecasted in this version cover for the main products the consumption at a minimum level without using imports, except for 1993 when imports of wheat, sugar, dairy products and potatoes are needed.
In order to support the livestock production, imports of wheat, sugar, dairy products and potatoes are needed.
VERSION 2 - AVERAGE LEVEL
Table 14
The total production of the main agricultural produces
This version is based upon average levels of factors assigned for 1993
figures data and information supplied by districtual specialists were used. The hypothesis for assignment of the resources are as follows:
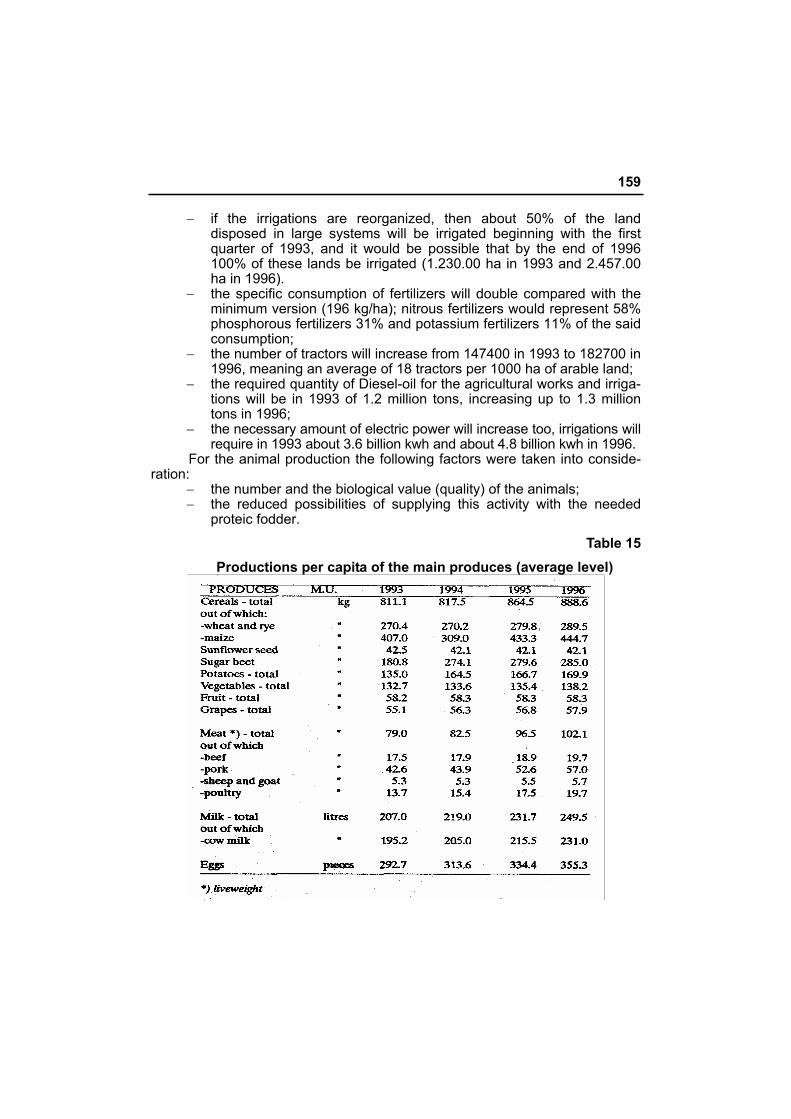
159
− if the irrigations are reorganized, then about 50% of the land disposed in large systems will be irrigated beginning with the first quarter of 1993, and it would be possible that by the end of 1996 100% of these lands be irrigated (1.230.00 ha in 1993 and 2.457.00 ha in 1996).
− the specific consumption of fertilizers will double compared with the minimum version (196 kg/ha); nitrous fertilizers would represent 58% phosphorous fertilizers 31% and potassium fertilizers 11% of the said consumption;
− the number of tractors will increase from 147400 in 1993 to 182700 in 1996, meaning an average of 18 tractors per 1000 ha of arable land;
− the required quantity of Diesel-oil for the agricultural works and irriga-tions will be in 1993 of 1.2 million tons, increasing up to 1.3 million tons in 1996;
− the necessary amount of electric power will increase too, irrigations will require in 1993 about 3.6 billion kwh and about 4.8 billion kwh in 1996.
For the animal production the following factors were taken into conside-ration:
− the number and the biological value (quality) of the animals; − the reduced possibilities of supplying this activity with the needed
proteic fodder.
Table 15 Productions per capita of the main produces (average level)
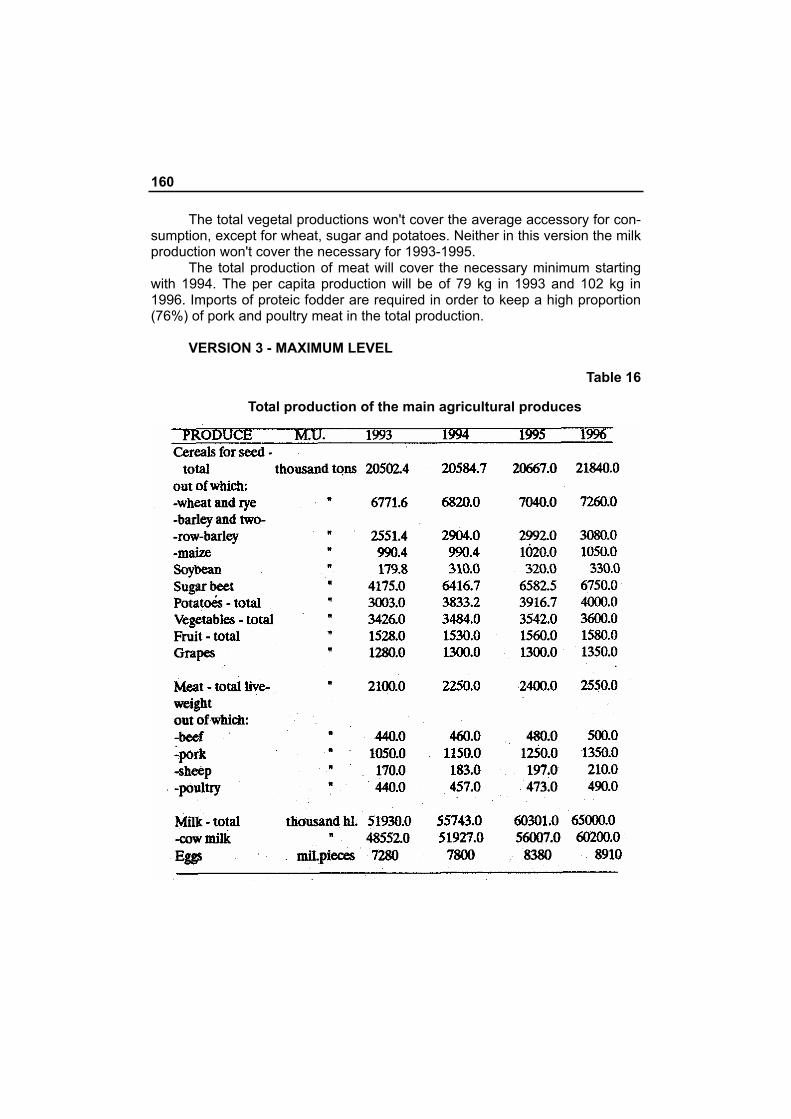
160
The total vegetal productions won't cover the average accessory for con-sumption, except for wheat, sugar and potatoes. Neither in this version the milk production won't cover the necessary for 1993-1995.
The total production of meat will cover the necessary minimum starting with 1994. The per capita production will be of 79 kg in 1993 and 102 kg in 1996. Imports of proteic fodder are required in order to keep a high proportion (76%) of pork and poultry meat in the total production.
VERSION 3 - MAXIMUM LEVEL
Table 16
Total production of the main agricultural produces
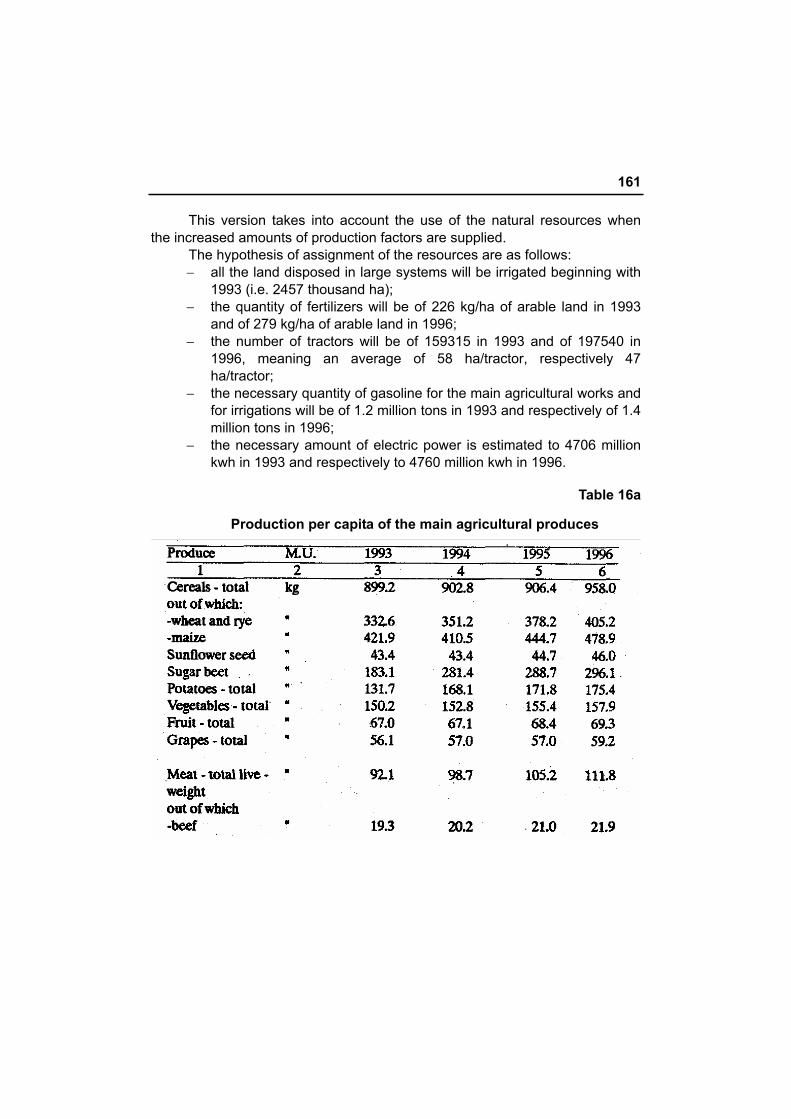
161
This version takes into account the use of the natural resources when the increased amounts of production factors are supplied.
The hypothesis of assignment of the resources are as follows: − all the land disposed in large systems will be irrigated beginning with
1993 (i.e. 2457 thousand ha); − the quantity of fertilizers will be of 226 kg/ha of arable land in 1993
and of 279 kg/ha of arable land in 1996; − the number of tractors will be of 159315 in 1993 and of 197540 in
1996, meaning an average of 58 ha/tractor, respectively 47 ha/tractor;
− the necessary quantity of gasoline for the main agricultural works and for irrigations will be of 1.2 million tons in 1993 and respectively of 1.4 million tons in 1996;
− the necessary amount of electric power is estimated to 4706 million kwh in 1993 and respectively to 4760 million kwh in 1996.
Table 16a
Production per capita of the main agricultural produces
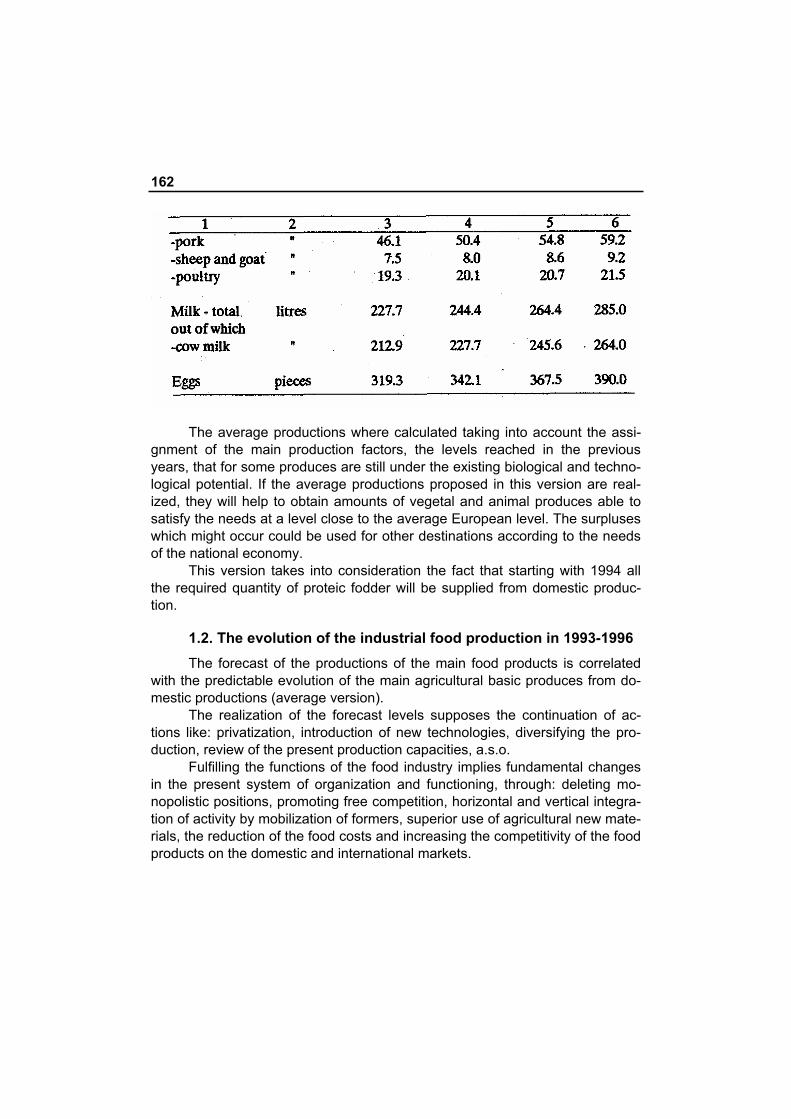
162
The average productions where calculated taking into account the assi-
gnment of the main production factors, the levels reached in the previous years, that for some produces are still under the existing biological and techno-logical potential. If the average productions proposed in this version are real-ized, they will help to obtain amounts of vegetal and animal produces able to satisfy the needs at a level close to the average European level. The surpluses which might occur could be used for other destinations according to the needs of the national economy.
This version takes into consideration the fact that starting with 1994 all the required quantity of proteic fodder will be supplied from domestic produc-tion.
1.2. The evolution of the industrial food production in 1993-1996 The forecast of the productions of the main food products is correlated
with the predictable evolution of the main agricultural basic produces from do-mestic productions (average version).
The realization of the forecast levels supposes the continuation of ac-tions like: privatization, introduction of new technologies, diversifying the pro-duction, review of the present production capacities, a.s.o.
Fulfilling the functions of the food industry implies fundamental changes in the present system of organization and functioning, through: deleting mo-nopolistic positions, promoting free competition, horizontal and vertical integra-tion of activity by mobilization of formers, superior use of agricultural new mate-rials, the reduction of the food costs and increasing the competitivity of the food products on the domestic and international markets.
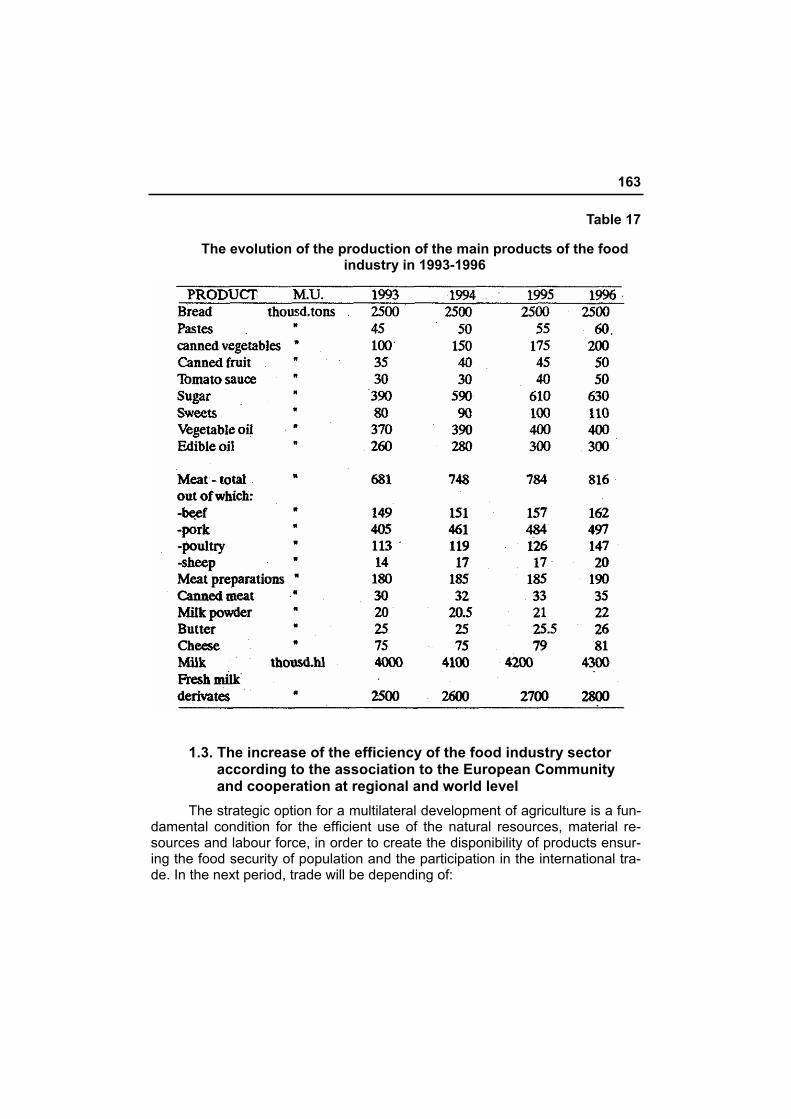
163
Table 17
The evolution of the production of the main products of the food industry in 1993-1996
1.3. The increase of the efficiency of the food industry sector according to the association to the European Community and cooperation at regional and world level
The strategic option for a multilateral development of agriculture is a fun-damental condition for the efficient use of the natural resources, material re-sources and labour force, in order to create the disponibility of products ensur-ing the food security of population and the participation in the international tra-de. In the next period, trade will be depending of:
164
− the entering into force of the Agreement of association of Romania to the European Communities and of the Agreement establishing a free trade area between Romania and the EFTA countries;
− the integration of Romania with the Republic of Moldavia; − international agricultural trade with the Arab countries, with countries
of the Black Sea area and countries from the former CMEA, as well as with the U.S., Japan, China.
The Romanian agriculture must be oriented and designed for its partici-pation in the international trade according to the following:
− the production of the most efficient products, at a competitive level on the international market, leading to the increase of exports and consolidation of the balance of payments;
− exporting the surplus of food products must create foreign exchange reserves ment to ensure importation of critical items in the domestic agriculture (required by the increase and diversification of the consumption of the population and the needs of proteic fodder);
− the potential demand from external markets on medium and long term could by supplied with the export of wheat and maize (grains), sunflower edible oil, fresh and canned fruit and vegetables, wines, meat and meat preparations;
− export production of biological material (such as seed, material for planting, first-rate livestock, biotechnologies), taking into consideration the technological and scientific potential and the highly-qualified labour force of our country;
− the specific orientation towards the European Community by preparing the agriculture to participate to the integration in the Euro-pean Economic Area; this means: *) specialization of the productions of those items subjects to the European Agreement in large stable quantities for export, at international standard levels, *) financial cooperation with institutions and private firms in the EC, ment to attack new foreign investors, to introduce new technologies, to mod-ernize scientific research, to introduce new capacities in the food industry and infrastructure of the agriculture, *) approximation of laws referring to agriculture; *) the integration with the Republic of Molda-via requires complex measures such as: restructuring and mutual adaptation of agro-products, common investments, financial solidarity, unification of customs legislation with reference to agriculture and mutual economic cooperation, etc.; *) continuing the financial cooperation with the IMF, IBRD, EBRD in order to obtain credits needed for the lasting development of the agriculture.
2. Ways and means of action
2.1. Privatization in agriculture and in the food industry The main way of action in order to create the new structure of agriculture
is the privatisation, which determines the forms of ownership and the restruc-turing of the production.
2.1.1. Establishing and consolidating the peasant trading household based on family work
The process of establishing and consolidating the peasant household based on the family work is a long-lasting and a complex one, supposing cohe-rent measures to be taken in its development
a) The speeding up of the process of putting in possession and granting of the ownership titles. To this end the following are taken into consideration:
− the enforcement of the Decisions of the Government no. 725 and 730 adopted at the end of 1992;
− payment from the budget for an increased number of topographs (5000 in 1993), specialization courses for about 100 more persons (especially farming engineers and other agricultural staff);
− insurance of the financing for paying the specialists, members of the local commissions and auxiliary staff, as well as for the necessary equipment, estimated at about 8.7 billion lei for 1993; until approval of the 1993 budget, these funds will be made available monthly for starting the activity; for the coming years these funds will be modified according to the volume of the activity and to the evolution of the salaries in the economy and will be retrieved from the sums paid as fees by the new land- owners when they receive the ownership titles;
− completion of the existing legislation by adopting the Law of the lease, the Law of establishing the Agency for rural development and planning, the Law of general cadaster and real-estate advertising, the Law of agricultural credit;
− solving the situations where the coefficient of reducing the land had been too high (over 30%) by compensation with land from the state-owned units if reserves exist, else how cash compensation will be made. The application of the above mentioned measures, together with the enforcement of the Government Decision no. 728/Nov.10, 1993 will lead to the issuing of about 80% of the ownership titles until 1995, the rest of 20% referring to special cases needing to be solved in Court.
166
Until the ownership titles or the official reports are issued, the local com-mission will inscribe on the reverse of the ownership certificates, the surfaces and the lots upon which the ownership rights have been established and the putting into possession done.
According to this certificate, the owner has all the rights and obligations given by the ownership title, except for the right of selling (alienation the land. The estimative putting in possession will be completed by the 1st of June 1993, in order to assure the cultivation of the entire arable surface.
The putting into possession will be finalized after precise measurements, on this basis the official reports will be completed and the ownership titles is-sued.
Until the ownership titles are issued, the official reports of putting in pos-session give to the owners the rights and obligations given by the ownership titles.
All above mentioned provisions will be settled by a Government Deci-sion.
b) The improvement of the supply with modern equipment and high-quality biological material. The improving of the poor condition in which most of the peasant households are, supposes actions as the following:
− the industry must produce new types of tractors and agricultural tools adapted to the new structure; fertilizers and pesticides are to be produced in sufficient quantities and forms available; materials for specific constructions are to be supplied;
− the research institutes and the joint ventures must produce and supply to the peasant household the required quantities of high quali-ty seed, planning material and livestock;
− granting facilities and priorities in producing the needed materials and tools.
c) The increase of the size of the peasant households by buying land or by leasing
With the purpose of enforcing the provisions of the Law of the land, refer-ring to the regime of buying and selling land, in order to prevent speculation and taking land from the poorest categories of peasants, the Agency for Rural Development and planning must keep under control the land market.
Taking into consideration the fact that the leasing process will be more dynamic than the process of buying and selling of the land, the legal framework protecting both owners and leaseholders must be created and enforced.
d) The organization of a co-operative system of peasant households fun-ctioning on the principles of a market economy.
Rural co-operation is ment to contribute to the support and consolidation of the peasant households based on the growth of the productivity of work, effi-ciency of the economic activity and co-operative solidarity.
167
Based on the principles of a market economy, rural co-operation might be organized in the following fields:
− in the sphere of primary production: associations for common land processing and breeding etc.;
− in the sphere of supply, co-operatives dealing the supply of biological material, fodder, chemical substances, fuel, construction materials, spare parts etc;
− in the sphere of processing primary products: co-operatives for producing bread, dairy produce, canned fruit and vegetables, processing of natural fibers etc.;
− in the field of storage and trade: warehouses for cereals, fruit, vegeta-bles, meat products etc.;
− in the sphere of services: co-operatives for mechanization of the land work, household constructions, houses etc.;
− in the sphere of banking activity: co-operatives for savings or for granting preferential credits;
− in the sphere of insurances: co-operatives for insurances of the productions, risks insurances, co-operatives for the social protection of fanners and their families, including pensions for invalidity or limit of age.
2.1.2. Privatization of state-owned commercial companies in agriculture and restructuring of their activity
Agricultural commercial companies are the most suitable forms for land exploitation, being close to the requirements of a modern agriculture compa-rable with the one in the developed countries; these companies benefit of the advantages of concentrated production and of a high potential (land, biological, technical, material and human potential). In the given situation of our agricul-ture, commercial companies might represent a strong support of the public au-thorities in assuring stable food resources for the urban population and for other needs. They can also adapt their production to the requirements and norms arising from the association to the EC.
In the new conditions of development of the agriculture, the structure of the production of these commercial companies must be modified in order to supply those products which are critical or for which there is a strong export demand through state commands and to supply also biological material, seed, and high quality livestock for the development of peasant households. In the strategy for agriculture, the commercial companies play a very important part, saving to the general progress of this sector and to the adjustment of the offer of agricultural products.
Carrying on the privatisation of the agricultural commercial companies implies the following:
168
− privatization of the management The managerial contracts concluded with each commercial company will stimulate initiatives, the commercial sense, will strengthen the responsibility of the managers, will encourage performance through incentives given to the staff that contributed directly to such performance;
− selling of stocks and assets according to Law 58/1991; − for medium and small range units (as patrimony and number of staff),
the method of direct selling to the personnel will be applied. For 1993, the small companies irrespective of the ownership of the capi-
tal and those companies with preponderant private capital are priorities for the privatisation.
2.1.3. Privatization of the research activity and of the extension activities
Scientific laboratory research and experimental fields from the research institutes, research and didactic farms will be organized as autonomous units. The activity of extensions will be organized as a services on a commercial ba-sis.
2.1.4. Organization and functioning of the services for agriculture The organization of the service activity is very important for a modern ag-
riculture. a) In the sector of mechanization: The units for mechanization of the land work are indispensable in the
process of the production modernization, in increasing the productivity of the work and in decreasing the expenses for mechanization, the main activities of these units are: providing works on order or on a contractual basis, repairing and reconditioning of spare parts etc.
The carrying on of the assessment of the patrimony, in order to avoid under-evaluation or over-evaluation.
The issue of privatization of AGROMEC S.A must be linked to the re-duced number of tractors and their technical conditions, as well as of the other machinery, considering the need of cultivating all the arable land in most effi-cient conditions. If these tractors and machinery are sold to individual farmers, than an important volume of work will remain unaffected and the volume of production would be low and charged with high costs (individual farmers can obtain only 10 ha/tractor/year compared to the 90ha/tractor/year performed by AGROMEC). Solutions chosen for privatisation must also consider these side effects.
The following version might be taken into consideration:
169
VERSION I − selling the units for mechanization to the employees, payment being
made in agricultural products in a 6 years period considering prices in equivalent wheat at the moment of the conclusion of the selling and purchasing contract
In this situation: − the units for mechanization will have the obligation to perform only
the necessary works of the land in order to be able to make the due payments in products for the machines they have bought; these products might be used for forming the consumption stocks in the transitional period until new forms of agricultural exploitations are created;
− AGROMEC would remain a commercial company with preponderent state-owned capital, performing the following activities: technical and material supplying of the units for mechanization, repairing and conditioning specialized works such as: harvesting with combines, spreading chemical substances (chemifying), works needing heavy tractors, by using the existing staff and machinery.
VERSION II − granting stocks on the certificates of ownership to the employees of
these units and to the farmers of the area covered by the respective AGROMEC, limited to 30% of the capital allocated to the Private Ownership Fund;
− selling stocks to the employees in the conditions provided by Law 58/1991 and to the farmers.
The fact that the stockholders are just the employees and farmers of the area of the AGROMEC makes possible their participation to the management of the unit, the increase of their interest in the efficient' organization of work, the control of this activity, on a contractual basis, they can perform works with the owned machinery on their land.
VERSION III − the selling of the small size AGROMEC to the employees (by the
MEBO method). The interest of these new owners in the best use and self repairing of the tractors and machinery deriving from their quality of owners may lead to the improvement of activities in this field.
b) In the sector of land reclamation administration In this sector there are commercial companies for constructions, mecha-
nization and administration of land reclamation. The main directions for action
170
of these companies are as follows: administration of the existing land reclama-tion works, finalization of the undergoing ones, modernization of the irrigation systems in order to reduce the specific water and electric power; insurance of the activity of marketing and services for specific equipment for irrigations as well as for other equipment owned by private fanners or associations.
The following version are proposed for privatization of this sector: VERSION I The land reclamation activities of national interest, commonly used by all
farmers, which consist of water collection machineries, pump and pressure sta-tions, sewerage, hydrotechnical constructions and water conduction instal-lations, guard dikes of strategical nature for flood and ice lengthways Danube, and soil erosion prevention, will remain state-owned and will be administrate as Regies Autonomous; land reclamation activities of local interest, taken by commercial companies from state production co-operatives, together with out-standing credits granted by the Stat to the former landowners, will be adminis-trate by commercial companies, their privatisation being carried out only by share sale (after the giving back settlement of capital portion played off by the former landowners); specialized companies for land reclamation activities, mechanization and transport, are subject to privatisation, by share and assets sale, renting, leasing and letting.
VERSION II Taking into consideration the strategically nature of land reclamation ac-
tivities, many hydro-improving systems being used by several judets (regional district), is it necessary to establish Land Reclamation Administration National Regie, as State monopoly, who will be responsible for the administration and functioning of public interest works which serve all local land reclamations, irrespective of their ownership.
The National Regie, through its territorial systems, will guide and control irrigations made by land beneficiaries and, at their request, will let them its own irrigation equipment, ents.
Irrigation activity (rain wings removal) in the next 3-6 years cannot be carried out by system employees, given their insufficient number, therefore these works will be provided by the beneficiary.
c) Providing seeds and seedling Seeds and selling contracting, conditioning and marketing are carried out
by specialized commercial companies, with branches at judets level. In the long-run, spreading and continuation of privatisation process are
provided, through share and assets sale.
171
d) Plants protection The forecasting, supervision and control of activities will be put into
practice by Plants Protection Regional Inspectorates, which are public insti-tutions.
Pesticides supply and control of plants disease and pests will be car-ried out by actual territorial Plants Protection Centers, which will turn into commercial companies.
e) Sanitary-veterinary field Specialized staff, remunerated from central administration budget, will
perform livestock health survey, prevention and control of animals disease, as well as of those which could affect the human beings, indemnity area protec-tion against disease of great dissemination, as well as of public health, by pro-viding qualitative and wholesome produces and fodders.
Sanitary-veterinary police, whose specialists are remunerated from the central administration budget, will provide enforcement and observance control of Sanitary-veterinary law norms, and strategically program for prevention and survey of, and control of animals disease.
Veterinary assistance privatisation can be put into practice through sur-geries, clinics, pharmacies and specialized laboratories.
Medicines and products for veterinary use supply and sale activities, deratization and knocker's trade are subjects of privatisation.
2.1.5. Food industry privatization Taking into account the diversity of food industry units and the necessity
for providing normal development of agricultural process manufacturing, the privatisation process have to be realized step-by-step in the following ways and forms:
− the small enterprises will be privatized by: sale to private investors or to employees, by MEBO method; by assets or share sale;
− the big enterprises will be privatized by joint ventures; − the big enterprises with sub-units located in one or several districts,
can be spread in view of sub-units sale to their own employees or other investors.
Pending privatization, the management contract is to be used.
2.2. Agriculture integration into market economy mechanisms. Agromarkets and market economy institutional system consolidation
The settlement of food security problem is organically dependent of the foundation of the market economy institutional system, which will ensure agri-
172
culture development by the help of macroeconomics variables with production functions (mainly the capital) and with regulation functions (prices, credits, taxes, charges, subsidies). The consolidation Of market economy institutional and organizational system, as well as of the appropriate legal framework, will guide economic agents behavior to carry out the desirable objectives.
2.2.1. Market economy institutional system consolidation The social and economic reform which lead to market economy institu-
tions and mechanisms creation and market forces coming into action (private sector development, trade and prices liberalization, labour market spreading, wages liberalization and social-safety net improvement, financial market spreading and foreign exchange market liberalization) has come characteristic features in agriculture:
− a higher rank of privatization than other sectors and the existence of some umbalances, within the branch - non- concordances between the new structure of both ownership and works and the agricultural services system (mechanization, irrigations, plants an animals protection), as well as off-branch, caused by the maintenance of the economic agents with monopoly nature, which provide inputs to agriculture or acquisition and sale agricultural production;
− prices liberalization for most products, maintenance of fixed prices level and their defective negotiations system, as well as subsidized prices for some products, have as result distortions and lack of balances on agroproduct markets functioning;
− for the agrofood - product markets regulation, despite all interventions to partially subsidize fuel, fertilizers, seeds, interests etc., a high inflationary trend has shown. The main cause was inflation due to, the unbalance between demand and supply, as well as costs. The inflation due to costs was caused by off- branch input prices increase, defective conversion of intermediary consumptions, organizational and administrative level of the agricultural works, as well as the inadaptability of the marketing and acquisition activity to intervening changes within the agricultural structure;
− the foreign exchange market liberalization generates the umbalance for agricultural produces prices and brakes the forming of capital for agricultural works and other economic agents;
− the financial market spreading positively influences agricultural markets functioning. Yet, peasant farms have a low rank of "monetary capacity", because of the subsidies and credits granted through the economic agents' integrate role, carrying out of some agricultural budget, and the non-existence of a taxation system for farms, lands, patrimony and revenues.
173
The stoppage of the agricultural production decline, the inflation reduc-tion and outrunning of the existing umbalances necessitate a system of market stabilizers to be used, as follows: production programs to correlate supply and demand, utilization of macroeconomics variables with regulation functions - prices, credits and interests, financial instruments - taxes, charges, mecha-nisms of subsidies setting-up and utilization, as well as funds provided for per-formance indemnity.
These stabilizers, utilization is conceived to ensure market mechanisms become institutional until 1995.
a) Production programs The inception and key element for markets stabilization consists of
strategical produces programs for food security. These produces are: wheat, maize, sugar beet, sunflower, soya, meat, milk, eggs, as well as proteic fodders.
The production programs have to be settled taking into account the inter-nal, demand, as well as the external market and. have to be supported by pro-duction factors insurance and concerted action of all macroeconomics vari-ables with regulation functions.
b) Production factors, agricultural produces and service prices Step-by step the prices liberalization, respectively providing conditions
for prices settlement on demand and supply-basis, constitute the main orienta-tion.
The agriculture's insertion within market economy is supposed to institute a new price system, which will combine the liberalization with the public influ-ence interventionism. Within this price system can be distinguished:
− the orientative price, different from region to region, as starting basis for price negotiations for agroproducts marketing;
− the intervention price, which means the minimum tresh-hold market prices. By touching this tresh-hold, the governmental bodies intervene; they are guaranteed prices;
− the "treshold" prices means the minimum allowed prices of an imported product from third countries.
On the short-run, the subsidies reduction process will continue for the production factors (fertilizers, pesticides, seed and proteic fodder) and agri-culturalfood produces (bread, milk, sugar, oil, some meat products) as well as for services.
c) Credits The credit constitutes a basic source for production program fulfillment
and for demand and supply ratio balancing, taking into consideration the actual status of the agriculture status and the agricultural production's peculiarities. The granting credits for farmers has to be differentiated in relation with the na-
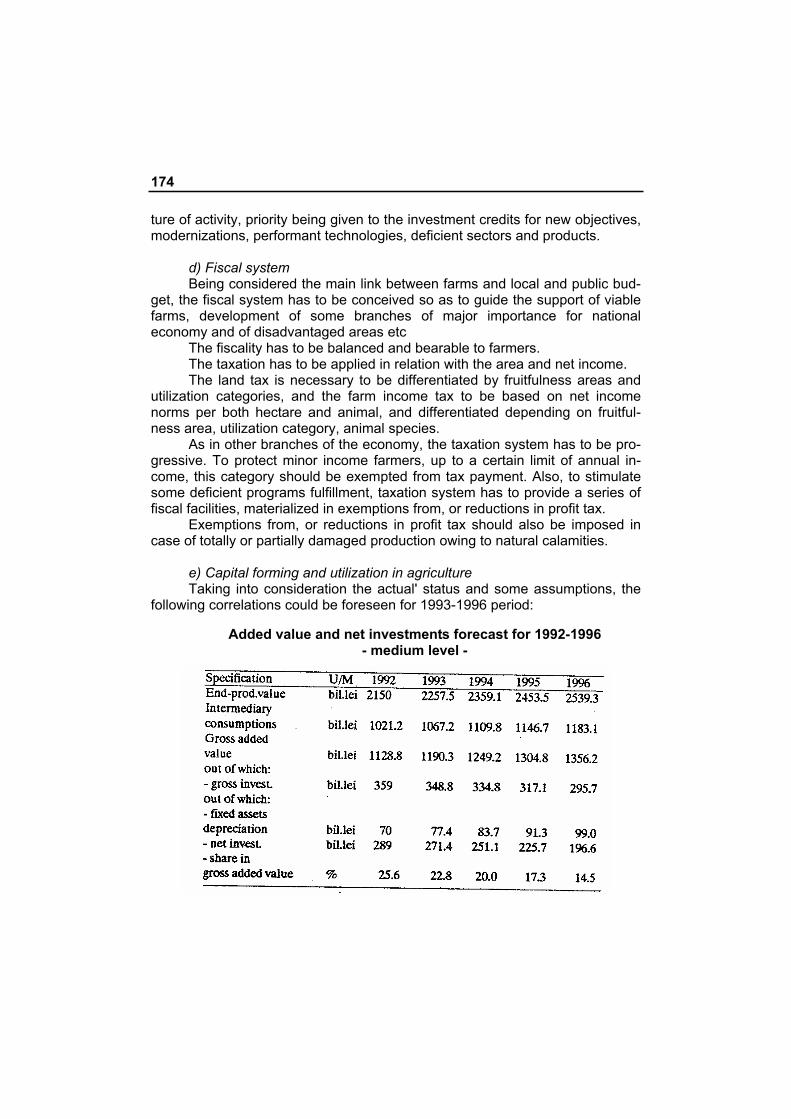
174
ture of activity, priority being given to the investment credits for new objectives, modernizations, performant technologies, deficient sectors and products.
d) Fiscal system Being considered the main link between farms and local and public bud-
get, the fiscal system has to be conceived so as to guide the support of viable farms, development of some branches of major importance for national economy and of disadvantaged areas etc
The fiscality has to be balanced and bearable to farmers. The taxation has to be applied in relation with the area and net income. The land tax is necessary to be differentiated by fruitfulness areas and
utilization categories, and the farm income tax to be based on net income norms per both hectare and animal, and differentiated depending on fruitful-ness area, utilization category, animal species.
As in other branches of the economy, the taxation system has to be pro-gressive. To protect minor income farmers, up to a certain limit of annual in-come, this category should be exempted from tax payment. Also, to stimulate some deficient programs fulfillment, taxation system has to provide a series of fiscal facilities, materialized in exemptions from, or reductions in profit tax.
Exemptions from, or reductions in profit tax should also be imposed in case of totally or partially damaged production owing to natural calamities.
e) Capital forming and utilization in agriculture Taking into consideration the actual' status and some assumptions, the
following correlations could be foreseen for 1993-1996 period:
Added value and net investments forecast for 1992-1996 - medium level -
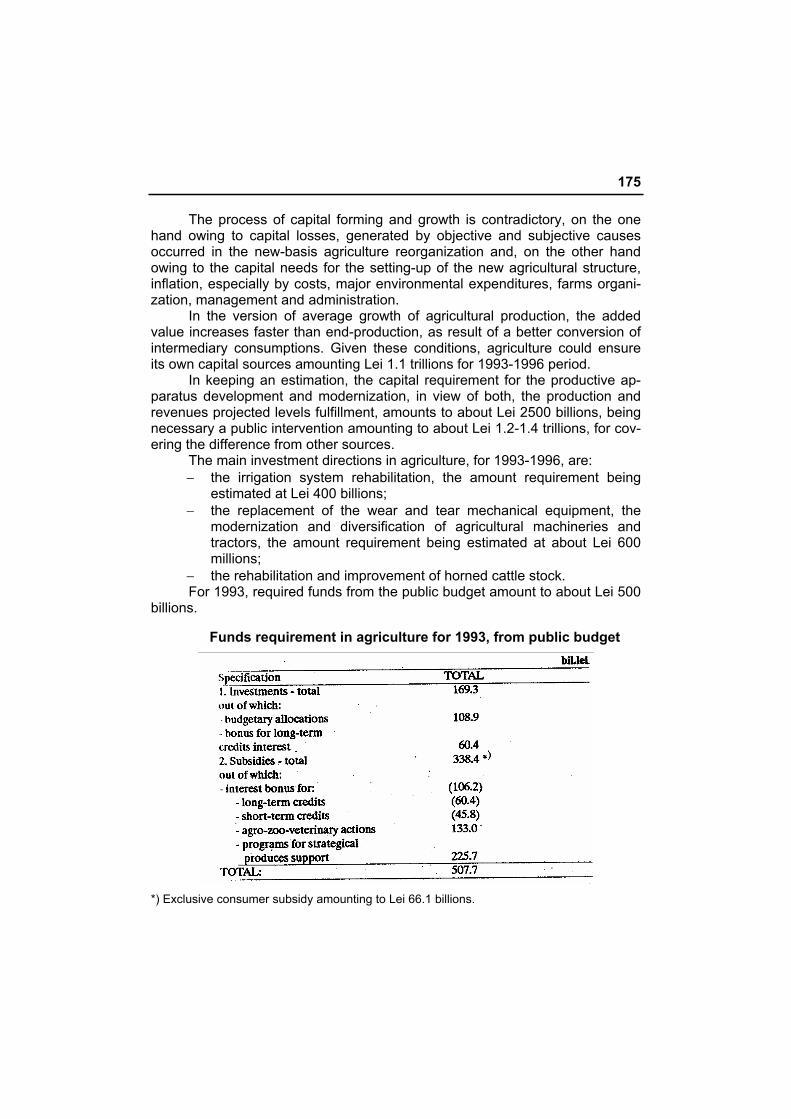
175
The process of capital forming and growth is contradictory, on the one hand owing to capital losses, generated by objective and subjective causes occurred in the new-basis agriculture reorganization and, on the other hand owing to the capital needs for the setting-up of the new agricultural structure, inflation, especially by costs, major environmental expenditures, farms organi-zation, management and administration.
In the version of average growth of agricultural production, the added value increases faster than end-production, as result of a better conversion of intermediary consumptions. Given these conditions, agriculture could ensure its own capital sources amounting Lei 1.1 trillions for 1993-1996 period.
In keeping an estimation, the capital requirement for the productive ap-paratus development and modernization, in view of both, the production and revenues projected levels fulfillment, amounts to about Lei 2500 billions, being necessary a public intervention amounting to about Lei 1.2-1.4 trillions, for cov-ering the difference from other sources.
The main investment directions in agriculture, for 1993-1996, are: − the irrigation system rehabilitation, the amount requirement being
estimated at Lei 400 billions; − the replacement of the wear and tear mechanical equipment, the
modernization and diversification of agricultural machineries and tractors, the amount requirement being estimated at about Lei 600 millions;
− the rehabilitation and improvement of horned cattle stock. For 1993, required funds from the public budget amount to about Lei 500
billions.
Funds requirement in agriculture for 1993, from public budget
*) Exclusive consumer subsidy amounting to Lei 66.1 billions.
176
The public budget share provided for the agricultural investments will be materialized through the budgetary allocations and bonuses for long-term cred-its interest
The subsidies will mainly be allocated for: − production factors support for strategical produces (wheat, maize,
sunflower, sugar beet, soya, potatoes, meat, pork meat, fowl, cow milk).
The subsidies will be provided to cover the price differences for seed and seedling, fertilizers and pesticides, irrigation water, proteic fodders.
− agro-zoo-veterinary actions (reclamation of acid soils, disease and pests control within vegetable and livestock sector, activities of national interest, reproduction, including animal selection;
− bonuses for production and investment credits interest
2.3. Agro-markets organization and functioning The agriculture and agro-food system development can be put into prac-
tice only by considering the agro-markets organization and functioning, which consists of production factors market, services market, as well as agricultural produces market
2.3.1. Production factors market The production factors market in agriculture, written down in the general
mechanism of macroeconomics' variables with production funaions and with regulation functions, has a series of characteristics, caused by the peculiarities of production and economic processes met within the branch. These peculia-rities have in view all the components of both, market and production factors - land market, fixed assets market, circulating assets market, labour market, as well as capital market
2.3.2. Land market As the land ownership constitutes the key element of whole social sys-
tem in agriculture, generating the complex of individual, group and national in-terests, the land is subject to a special and apart market.
At present, the land market is limited owing to ownership titles, not granted yet, most of the land being sold by illegal practices - purchase, espe-cially of in-housing area land, as well as leasing.
The land market creation necessitates the establishment of some direct and implicit links between ownership subject, through its elements - posses-sion, utilization, arrangement and life interest, and farms and other economic agents acting within the market economy.
177
The land market organization the requests taking into consideration of every land ownership element and of the ownership as a whole, as well as the different functioning forms, focusing on the regulation of economic processes launched, by means of the macroeconomics variables.
a) The agricultural lands sale and purchase will be extended according to ownership titles granting, mainly on the basis of areas owned by the untied to agriculture owners or by old people. The processes are contradictory, consi-sting in, on the one hand, the concentration of land ownership, and farms, fa-voring the modern techniques and technologies utilization, the production and productivity increase and, on this basis, the increase of economic potential un-der the conditions of free competition, and, on the other hand, the peril of land dispossession for some peasant categories and the appearance of some. con-flictual situations, the transfer of some development sources created in agricul-ture to other non-agricultural sectors, the increase of production costs for indi-viduals and of the pressure on sale prices for agroproducts, influencing the population food cost, ultimately.
The prevention of negative effects of the land purchase and sale would impose that the Development and Rural Reclamation Agency, apart from its duties, settled through Land Law, shall control the evolution of the land market prices, the settle orientative prices on areas, land categories etc and the act for creation of family work-based farms.
b) The leasing is outlined as a more ample and dynamic process, in comparison with the land sale and purchase. The leasing doesn't change the ownership structure and. offers the advantage that the payment for land exploi-tation is made from revenues, fostering production and the concern for net in-come, for profit. The organization of this segment would impose the establish-ment of the legal framework, which will settle the leasing establishment and payment, responsibilities and rights of contracting parties, thus conflictual situa-tions being avoided, irrational land exploitation, pressures on production costs owing to lease etc.
c) The transfer of land ownership by means of shares provide their own-ers to participate in the decision-making process regarding areas and patri-mony exploitation in farms, revenues capitalization and life interest distribution, including dividends. This market aspect has occurred, as a result of some spe-cial laws, in relation with state-taken lands, others than those for expropriation, which former owners have received shares for, and this aspect is subject to spreading, as a result of the commercial companies privatisation by share sale. This aspect loses its autonomous nature, the shares and their transfer regard-ing portions of whole commercial companies patrimony. The functioning effec-tiveness of such market means:
− correct evaluation of lands and patrimony; − advantages capitalization of production concentration;
178
− orientation, by means of dividends and other market stabilizers, of shareholders behavior for performance.
2.3.3. Tractors and agricultural machines market The machinist role is not diminished by changes which take place in ag-
riculture. On the contrary, performant agriculture is based on machinist. The main characteristics of tractors and agricultural machines market es-
tablishment and development are given by: − relatively strong demand, influenced by reduced level of agriculture
technical endowment and advanced wear and tear degree of tractors, agricultural machines, existing installations;
− demand diversification, having in view, on the one hand, the existence of commercial companies, producers associations which request tractors and agricultural machines of high capacity and, on the other hand, the existence of family households, which request adapted machines and equipments for low scale production;
− need to diversify to a greater extent the machinist, in relation with agricultural production structure and areas peculiarities.
The farmers precarious economic status determines the main capital sources for technical endowment is granted through credit with reimbursement and interest support facilities.
On the short-run, until full liberalization of agricultural produce prices, the public intervention is requested to regulate tractors and agricultural machines market in the sense that their prices will be correlated with agricultural pro-duces prices to remove monopoly trends.
2.3.4. Fertilizers and other chemical market The technical progress carried out through chemistry suffers influences
from, on the one hand, the existence of some industrial capacities yielding the requested quantities for almost all chemical categories, on the other hand, the dependence on resource imports, especially for potassium and phosphor fertil-izers.
The chemicals supply and demand are subject to these two characteris-tic imposing at chemistry, as well as the agriculture level, measures and action in relation with domestic possibilities and international market conjuncture.
As the chemicals production depends, on a great extend, on resources import and world market price, it is requested, at least on the short and medium term, to support their utilization through a subsidies system for farmers -reduced prices, credits or other facilities.
179
2.3.5. Labour market The labour market in agriculture is settled up and comes into action at
one with changes which take place within agriculture and national economy. It has in view over one quarter out of country's employed population.
The labour market's main feature consists in emphasing the partial time phenomenon, labour force underuse, hidden unemployment.
On a global surplus background, the labour surplus within some agricul-tural sectors, periods of the year, regions and zones, farms, coexists with the deficit within other sectors, these lack of balances exercising influences over production, labour employment ratio, earned revenues. To these, other structu-ral umbalances are added - age, sex, training, which will put a mark on the labour market in future.
The labour market establishment and development request economic, institutional, legal, informational and vocational measures and action such as: - establishment of new jobs in agriculture and non-agricultural sectors from the rural area;
− labour re-training and multi-training for increasing of the agricultural employment ratio and/or non-agricultural sectors;
− wages relations settlement for the private agriculture, minimum guaranteed wage setting up for the employed labour force, including day-workers, establishment of social security contribution, social safety norms, including unemployed workers;
− wages payment within state-owned commercial companies and joint ventures, in relation with labour productivity;
− the organization of institutional system for agricultural labour market administration and functioning - specialized agencies for labour force orientation, enlistment and hiring;
− the organization of informational system regarding labour supply and demand in agriculture.
2.3.6. Services market
The services market establishment is caused by two contradictory trends:
a) Farms trend to endow themselves with all requested means for the carrying on of production process.
b) Detachment trend of some activities and their autonomy under the form of agricultural services.
First of all, this last trend results from the following activities nature: ma-jor land reclamation works (major irrigations system, drainage, soil erosion pre-vention), electric power supply, plants and animals endemic disease control, biological substantial processing. In the second place, it results from the follow-ing activities organization and development efficiency: decrease of me-
180
chanization expenditures, avoiding over endowment and underutilization of ag-ricultural machines, effectiveness of public utilization for investment objectives, superior economic effects owning to services quality etc
Services automatization takes place under different organizational forms: autonomous regies, state-owned and private commercial companies, produ-cers-associations etc.
Functioning mechanisms of services market will be different, in relation with their role and nature within productive and economic processes in agricul-ture.
In the case of agricultural works mechanization, for example, taking into account trends shown within developed countries agriculture, it is necessary to maintain and their coming into action on the competition and performance ba-sis. On the short run, tariffs have to be supported through credits, subsidized interests and other fiscal facilities; tariffs liberalization would take places in cor-relation with agroproducts price liberalization.
In the case of irrigations, water cost be subsidized in a different manner, depending on the products which is used for, subsidized having as sources public budget and contributions of water and agroproducts user-agents.
2.3.7. Agricultural produces market Existing umbalances on foodstuffs market, caused mainly by the lower
production level in comparison with demand and by costs inflation, can be counteracted by using the following instruments: production programs, corre-lated with demand, prices, credits, taxes, charges, subsidies.
The utilization of these instruments have to take into account, for each of them, the following objectives:
− demand covering; − capital establishment by profit; − farmers incentives for technological innovations, production
processes rationalization and costs cut; − economic agents incentives for post-crop activities, superior
capitalization of raw materials, products improving, costs cut and competition rise.
Under the conditions of agricultural produce prices liberalization, for or-ganization and functioning of agricultural produce markets of major importance for food security, the state intervention is necessary, by the following ways and means:
− providing of orders for economic agents; − production factors support, by means of subsidies, credits with bonus
interest; − prices' negotiations by the governmental organisms, economic
agents and farmers organizations;
181
− establishment of the intervention stock for supporting the population supply and farmers revenues;
− establishment and utilization of the intervention prices in case basic products surplus cannot be absorbed by the market.
For each produce specific ways and instruments shall be used.
2.4. Research and farmers training The achievement of the strategical objectifs regarding foods security can
be touched through the intensive use of existing scientifical potential from the design research units, the putting into practice of the performant domestic and international results and the raising farmers training effectiveness.
The research and education units play a decisive role in progress gener-ating and spreading process. Within 34 existent research units in agriculture, the activity is carried out by 2831 research, workers and 4608 employees - helping staff, by using a total area of 178,6 thousandth ha agricultural land, out of which 33.7 thousands ha for proper research. Also, 5 teaching farms are functioning. So, Romania has a technical and scientific potential whose proper capitalization can contribute to the agriculture development, the modernization and effectiveness, the advantages scope, especially of relative-ones, thus our country could take part into international division of labour and to integration processes of agriculture, at European and world level.
The scientific activity in laboratories and experimental fields within the in-stitutions and research stations and teaching farms shall be financed from the state budget or other contracting sources and the production activity shall be achieved by commercial companies system.
Our country has abundant labour resources which represent chances for the setting up of a lasting agriculture as well as some features which dimini-shing their productive force. There is a well trained and competent engineering body, a vocational staff as well as a researching potential within research insti-tutes and universities.
The peasantry human resources show a high female ratio, an aging process, a low level of training especially the former state production coopera-tives members) regarding the modern technologies, the management and ad-ministration of agricultural processing and low level of employment
The rising of the productive potential of human resources in agriculture could be carried out by the governmental and nongovernmental institutions through specific economic and financial instruments, as follows:
− the organization of training courses by the agricultural chambers in the field of vegetables, breeding, management and administration of farms, financed from public budget and farmers financial contributions;
182
− the organization of training courses in various trades and services needed in rural economy in order to reduce part time work and to rise revenues;
− the organization of extension consulting system in processing, mar-keting, management and juridical fields by research institutes, universities and agricultural chambers;
− the reorganization of medium and higher education curricula for adapting them to the new structure of agriculture;
− the managerial training of commercial companies, autonomous units and rural associations leaders;
− the organization of special courses in computers, marketing and juridical fields;
− the organization of a high level training with the assistance of international institutions in the fields of survey, management marke-ting and computers.
2.5. The partnership for agriculture development
2.5.1. Institution of partnership The processes and changes in agriculture require the setting up of a
partnership mechanism which would associates public and private sector for carrying out a lasting agriculture within the framework of a global rural devel-opment strategy.
For the substantiation of partnership mechanism creation-as a legal co-operation between public and private sector - it should take into consideration the followings:
− the diversity of social processes which are developing in agriculture and in rural environment;
− the complexity of connections between agriculture and sectors running upstream and downstream, as well as the economic life of ru-ral communities;
− the environment protection and rural environment. The creation of partnership mechanism would have to help to:
− the mobilization of experience and resources of various public and private institutions;
− the adaptation of agricultural and rural policy to the specific local and regional conditions;
− the correlation between local, regional and national development; − the efficient utilization of the public and private sector possibilities.
The functioning of partnership system would be realized through cooperation between the following institutional forms:
183
− public administration and other public bodies; − farms and other state or private entities; − professional associations and other lobbies. The institutional partnership for rural communities and agriculture deve-
lopment would follow to be organized under the public sector partnership from a partnership form to join public and private sector.
The public sector partnership could be inter or within the public admini-stration.
The inter public administration partnership will have in view the coopera-tion agreements between various levels of administration, i.e. between central, regional and local or municipal administration.
Within the public administration partnership will have in view the coope-ration between the same level territorial administrations; it should also involve the cooperation between ministries, public and other similar bodies having the same level.
The partnership which joins public and private sector should constitute a mutual cooperation form in order to correlate agriculture and rural development objectives.
2.5.2. Objectives and partnership programs for rural and agriculture development
The partnership means the assessment of agriculture and rural develop-ment objectives and programs, as well as the responsibilities, financial alloca-tions and other resources, taking into consideration the risks and advantages in a certain period of time. The objectives should have in view, both at local or regional level and at national level, the integration within a global perspective. In the transition period these objectives could by:
A. The improvement of farmers and rural population living standard and participation to the general rising of life quality, the achievement of this objec-tive supposes:
− improvement and assurance of revenues using measures of market and prices policy (rising of marketing efficiency over all market levels; utilization of a market stabilizers - production programs for main products, inflation jeopardizing through prices by sustaining production factors prices, fiscal measures etc.);
− improvement of revenues through structural development and measures in the production field (enhancement of farm household; avoidance of both excessive concentration and dissipation of farm households; rising of cooperation between farms by using the rural cooperatives farms; modernization of technologies; productivity rising and costs reducing; reinforcement of management; compensations for calamities etc.);
184
− farmers welfare rising (improvement of work and accommodation conditions; rising of professional and general skills, providing of reports and social economic assistance; social security);
− living standard improvement in rural communities (reducing of regio-nal disparities; reinforcement of infrastructure, housing, amusement and general level skills; activities diversity and conditions for combining revenues).
B. Population and economic supply with necessary goods quantities at reasonable prices
The accomplishment of this objective could be carried out by measure referring to:
− the multilateral development at national, regional and local level taking into consideration the advantages of climatic and economic conditions in dividing by zones and specializing the processes;
− the reinforcement of vegetables and foods processing output- respec-tively, passing from extensive to intensive system by promoting the technical progress to its main directions - land productive potential rising using land reclamation works; the extension of machine works, chemical products using; application of biological sciences outcomes, especially in genetic and nourishing fields; the promotion of bioenergineering and biotechnologies;
− the organization of the agricultural activity, manufacturing and sale of produces on the grounds of integration, competition and profitableness.
C. Performing of "clean" foods and harmonization between agriculture and environment
It should have in view: − the designing and application of a new technical progress in
agriculture which shall remove the disadvantages of the industrial products quality on the basis of a potential biological factors influence increasing by using bioengineering and biotechnologies in foods and vegetables;
− the reassessment of farms' sizes and rehabilitation of big breeding units;
− the utilization of pesticides, fertilizers, water and agricultural technolo-gies on the grounds of standards for limiting and eliminating pollution;
− the establishing of a fiscal penalties system based on "polluter pays principal" as well as price and a fiscal incentives system in favour of "clean" foods output;
− the matching of public and economic agents efforts for the output rehabilitation in order to reduce and eliminate the pollution effects, ru-ral environment improvement
185
D. Joining of agriculture to regional, European and worldwide integration The achievement of this target implies programs which shall have in
view: − adaptation of an output breakdown with respect to external demand; − competition and comparable advantages; − alignment to internal products quality standards; − long and medium term external agreements.
2.5.3. The partner's types and relations The partnership is a vast legal system with different forms of organiza-
tion, complex, economic, financial and juridical relations. With respect to the level of decision, the partners could be: the central public administration (exe-cutive power) and sectorial (ministries and similar bodies), the nongovern-mental organizations (The Agency for Rural Development and Arrangement, professional unions of producers, employers unions, rural cooperatives federa-tions, trade unions, insurance national unions, agricultural chambers union, economic agents specialized in one or certain groups of products (National Of-fice for cereals, etc). At this stage, the partnership decides and surveys the achievement of agriculture and environment development programs according to the general objectives of the economic and social development.
At the regional level, on the basis of the decentralization and local admi-nistration autonomy, the relations between the partners are to be established based on the decisional components, taking into consideration the conditions and regional characteristic features and within regions interferences.
At the local level, the partnership shall have in view the local administra-tion and the diversity of private and public economic agents from the agricul-ture, industry, services and rural infrastructure.
The whole partnership system should be designed based on the partici-pation (agreement) to the establishing of programs, decision making and their fulfillment, having as fundamental criteria the economic and social efficiency, through the establishment of favorable relationship between efforts and out-come.
2.6. Farmers social protection The social protection has as main objectives the disparities reduction be-
tween farmers and other social categories revenues and rising of living stan-dard.
For farmers, the protection should be demanded from two points of view: individual and social protection. The individual protection is reached through property and labour.
186
Towards the promotion of an unitary social protection policy for the whole population of rural communities able to create similar conditions between urban and rural life, it is necessary to:
− consider rural environment as a defined social one according to its own necessities and requirements;
− draw up a general strategy for the increase of the possibilities of using labour force and the generating of investment efforts, targeted towards the poverty reasons and means for then-elimination;
− elaborate and promote a social protection general legislation which exceeds the arbitrary delimitations between rural and urban population.
The farmer constitutes the major category in rural environment which has to be social protected, therefore it shall be established:
− a subsidies system for disadvantageous farmer revenues; − a non-interest bearing credits system or low interest bearing credits; − a specific incomes taxation for specific farmers categories; − an allowances system for special situations: -Isolation; − housing improvement; - young families. The part time workers in agriculture constitute a special category of acti-
ve population with different needs and aspirations comparing to other econo-mic and social groups. The social protection measures have to prevent to put this social category, which is a demographic and social stability factor, into a disadvantaged position.
It is necessary to carry out a whole protection against the social risks: a) an unitary protection system for unemployed and employed farmers
able to preserve their dignity, labour capacity and family relationship (work injuries, disease, oldness, family, maternity);
b) the recognition of the professional disease including into the legisla-tion a "general clause" to contain the definition of adisease; the assessment of a financial parity with specific industrial disease;
c) a special allowance system for special situations; for motherless chil-dren and special education;
d) the chances equalization for the social promotion through the estab-lishment of a performable education and a cultural system;
e) a demographic compensations mechanism to allow "in expansion" re-gions to help "decreasing" regions, in order to distribute to everybody the same effort and the state to assist through the subsidies and fis-cal measures;
f) the calamity: a legal agricultural security system to comprise three procedures: indemnities; establishment of a Guaranty National Fund against calamities; aids for special credits using bonus taxes and for the assurance against agricultural risks.
187
The social security programs, assurance, social protection as whole or partially modified, could be carried out within the context of decisions and ad-ministration decentralization and the transfer of responsibilities to the local au-thorities. In this way it could be issued and encouraged the local initiative and improved the regional economic cooperation.
In decentralization process, there are redefined financial resources: − the transfer of certain taxes from the central state bodies to the local
authorities; − a larger access for the local bodies to the regional and local human
and economic resources utilization. The role of public powers in the new social policy consists in the mobili-
zation of the partially used resources and the decentralization of administration. The public power has the general responsibilities of social policy and its appli-cation depending on the constitutional, legal and social system.
In the framework of the general policy there are assessing priorities and norms, the leading principles as guarantees, the given conditions to the social performances in order to assure an efficient administration of centralized pro-grams; it is necessary as well, to adapt the programs to the local conditions.
The nongovernmental bodies, foundations, trade unions, cooperatives and other groups acting in the social field could be important partners in the assessment of the social policy strategy. The partnership allows combination of human and financial resources provided by different sources, necessary to reach the objectives of the social policy in rural and agricultural sector.
2.7. The establishment and improvement of juridical framework The Ministry of Agriculture and Food, as specialized body of the central
state administration has fulfilled its competencies given by law, in order to as-sure the strategy and the achievement of Government economic and social Reform Program, into agriculture and food sector.
For the achievement of the above mentioned, the ministry has assessed and initiated for adoption and respectively promotion to the Government, a lar-ge number of projects and Governmental Decisions and Laws, which constitute the apropriate juridical framework for carrying out of agricultural and food spe-cific activities.
Thus, at the Ministry of Agriculture and Food initiative, they have been adopted the Law no. 18/1991, regarding Land ownership, Law no. 36/1991 re-garding agricultural companies and other association forms in the agriculture field.
Also, the Ministry of Agriculture and Food has contributed to the promo-tion and adoption of several laws necessary for the reform and movement to market economy in agriculture, such as: Law no. 31/1991 regarding commer-cial companies, Law no. 15/1990 regarding the organization of several state
188
companies as autonomous units and commercial companies and Law no. 58/1991 regarding commercial companies privatisation,
Since the initial stage of Landownership Law project elaboration, the Ministry of Agriculture and Food has wished and insisted about the necessity, that in the same time or immediately after this law issuance, to be adopted by Parliament a package of laws strictly needed for the reform implementation, in agriculture privatisation field.
It deemed necessary that this laws packing to contain: survey and im-movable advertising Law, leasing Law, organization and functioning of Rural Arrangement and Development Agency Law and agricultural credit Law.
In order to assist the farmers, the Ministry of Agriculture and Food is drawing up the Law regarding the farmers social security system .against ca-lamity and the law regarding the state assistance for agriculture rehabilitation and development (subsidies and other facilities).
For ongoing agriculture reform, the Ministry of Agriculture and Food has elaborated a legislative program, which comprises priority laws to be submitted to the Parliament, for adoption in 1993-1996 period.
This program contains the following laws: − Land reclamation Law; − Law regarding performing, quality control, marketing and seeds and
seedling utilization, as well as kinds registering and protection; − Law regarding administration, organization and utilization of lawns; − Vineyard and wine Law, − Breeding Law; − Law regarding slaughter and sanitary slaughter conditions; − Fish and fishing Law, − Law regarding the alcohol and alcoholic drinks monopoly and
excises; − Fruit-growing Law, − Law regarding assistance for mountain area households; − Performing and marketing foodstuff Law; − Law regarding plants and woods protection, sanitary quarantine and
sanitary products regime. The adoption of these laws by the Parliament in the near future will com-
plete the legal framework for carrying out in an organized manner of agricul-tural and food activities.
In order to achieve its responsibilities, the Ministry of Agriculture and Fo-ods has in view the unitary application of the norms and laws on the partner-ship basis, has relations with its domestic and external partners, being the Sta-te representative within the relationship with the foreign investors and inter-national organizations in its specific area.
189
In the same time, the Ministry of Agriculture and Foods cooperates with other governmental bodies, such as: the Ministry of Finance, the Ministry of Industry, the Ministry of Transports, the Ministry of Trade, Ministry of Justice and with other local state bodies, district councils, local councils and munici-palities.
Also, the Ministry coordinates and controls the activity of agricultural and foods general directorates and agricultural centers.
In order to carry out the. control and coordination specific activity, it was necessary the elaboration of the Law draft regarding the organization of agri-cultural Chambers, "which further will assure the technical assistance so nec-essary for the farmers and agricultural economic agents.
The Ministry of Agriculture and Food carries out a permanent partnership activity with state-owned or part state-owned economic agents or private ones, providing them with specialized technical assistance, directly or through its ter-ritorial bodies cresting some facilities and incentives allowed by law.
In the context of the structural changes in the economic and social life, it should impose to organize and to set-up law courts, to have as goal to solve the litigations issued from farmers relationships and the defense of their other rights. This kind of law courts could be set-up by law.

UNIVERSITE DE PARIS (Laboratoire d'Economie Sociale)
INSTITUT NATIONAL DE LA STATISTIQUE ET DES ETUDES ECONOMIQUES
Avec le concours du CNRS
et du Ministère de l'Enseignement supérieur et de la Recherche
CINQUIEME COLLOQUE DE COMPTABILITE NATIONALE de l'Association de Comptabilité nationale
Paris, 12,13,14 décembre 1993
LA TRANSITION ET LA MODELISATION MACROECONOMIQUE
Emilian DOBRESCU
Institut National de Recherche Economique de l'Académie Roumaine
2, Rue Uruguay B1. 8-Ap. 2, Sector l
71266, Bucarest Roumanie
Session no. 2: Pays en transition

La transition et la modélisation macroéconomique
Académicien Emilian Dobrescu
Abstract: This paper presents an experimental macromodel of the Romanian transition economy. It is based on the aggregate demand and supply confrontation. The demand - either the consumption or the investment one - is determined by behavioural functions. A double production function is resorted to for the supply, namely – the Cobb-Douglas type one and another dependent on the available energy resources; the actual GNP is in line with the lowest of these two determinants. Given the break between the real economy and the nominal one, both constant and current prices are used. The macromodel was tested in 1991 and 1992. The paper mentions main development directions of the macromodel: the sectorial dismantling; the reflection of the implications entailed by the arrears (the cyclical summing up of a considerable amount of due payments between the economic agents) and the "dollarization" of a sizable part of the transactions; the taking into account of the hidden economy.
Dans les conditions de la transition du système centralisé aux mécanis-
mes de marché, la modélisation se heurte à des difficultés spécifiques, prove-nant de l'instabilité des comportements économiques, de l'apparition des ruptu-res des tendances, du caractère hybride des données statistiques. (1)
1) Ces conditions ont prédéterminé ou, dans tout cas, ont influencé beaucoup de solutions méthodologiques qu'on a adopté dans l'élaboration d'un macromodèle expérimentai de l'économie roumaine. On a eu ainsi recours à un degré élevé d'agrégation: centré sur la confrontation entre la demande et l'offre globale, le macromodèle opère avec des indicateurs annuels, au niveau de l'économie nationale. La demande - tant celle de consommation que celle d'investissements - est déterminée par des fonctions de comportement En ce qui concerne l'offre, il faut retenir que certaines capacités productives sont par-tiellement arrêtées ou mises complètement hors fonctionnement, dans le con-texte des processus d'ajustement structural et le degré de chargement des autres est affecté par l'insuffisance des ressources; dans le cas de la Rouma-nie, les hydrocarbures et les autres porteurs d'énergie s'imposent comme les plus sévères restrictions. C'est pourquoi le macromodèle en appelle à une double fonction de production: l'une dépendant du capital fixe et de la main- d'oeuvre disponible et l'autre dépendant du volume de l'énergie primaire qui peut être obtenue de l'intérieur et de l'importation. Le produit intérieur brut ef-fectif s'aligne à la moindre de ces deux déterminations.
194
On a dû tenir compte aussi du fait que les flux monétaires, fortement dy-namisés par la réforme, se greffent sur des structures techniques-matérielles relativement rigides, se produisant ainsi une certaine fracture entre l'économie nominale et l'économie réelle. Dans certains segments du macromodèle on utilise les prix constants et même certains indicateurs physiques (plus rele-vants dans l'investigation de l'économie réelle) et dans d'autres, on recourt à des prix courants (indispensables dans l'analyse de l'économie nominale).
2) Le macromodèle réunit, dans un système de 45 relations (1-41 plus 13-16 bis), trois catégories de grandeurs: exogènes calculées, exogènes op-tionelles et endogènes.
2.1. La première catégorie est séparément déterminée, y compris par l'utilisation des modèles spécialisés:
ut - le poids du capital mis définitivement hors fonctionnement dans le to-tal du capital existant au début de l'année.
tK2 - le capital mis temporairement hors fonctionnement, comme effet des processus d'ajustement structural de l'économie.
tN2 - les stocks compris dans tK2 . Eot - le volume de ressources énergétiques (pétrole, gaz naturels, char-
bon, hydro-énergie, autres ressources), qui peuvent être assurées de la pro-duction interne. L'indicateur est exprimé en unités énergétiques conventionnel-les (équivalent pétrole ou houille).
h - le prix de base (constant) de l'unité énergétique conventionnelle qui peut être obtenue de l'importation, en dollars.
etP~ - l'indice des prix d'importation par rapport au niveau de base h, pour les ressources énergétiques.
Bt - le solde de la balance commerciale en dollars, prix courants, dont l'estimation doit avoir en vue les sources accessibles de crédit extern.
mt - l'importation spécifique de produits intermédiaires (sans les ressour-ces énergétiques), évaluée en dollars par unité monétaire de PIB, tant les prix externes que ceux internes étant constants.
ytP~ - l'indice des prix d'importation (par rapport au niveau de base pris en calcul pour mt), pour le groupe des produits intermédiaires.
gt - la consommation spécifique de ressources énergétiques estimée par unité monétaire de PIB, en prix constants.
tL2 - le nombre de chômeurs provenant de l'arrêt des capacités producti-ves représentées par tK2
Lt - la population active. Xmaxt - l'exportation maximum possible, en dollars, prix courants. Lors de
la détermination de cet indicateur, on tient compte tant de l'évolution prévisible des processus internes que de la conjoncture des marchés internationaux.
195
0tP~ - l'indice général des prix, anticipé par les firmes, par rapport à l'année
précédente. k21t et k23t - les poids du secteur privé et du secteur d'Etat dans le total du
capital utilisé.
xtP~ - l'indice des prix externes à l'exportation. ∗ta - le taux moyen d'amortissement pour le capital fixe utilisé.
2.2. Comme instrument pour tester la cohérence de la politique macro-
économique, le modèle contient une série de variables optionnelles. Mrt - les autres importations (outre les ressources énergétiques et les
produits intermédiaires), en dollars, prix courants. t23τ - le coefficient des taxes et impôts payés par des firmes au budget
de l'administration publique calculé comme taux moyen par rapport au PIB, en prix courants.
drt - le taux réel d'intérêt pour les crédits d'investissements. Cgt - autres frais de l'administration publique, excepté les salaires payés
au personnel rémunéré par des fonds budgétaires, les transferts vers les mé-nages et firmes.
t13τ - le coefficient des taxes et impôts payés par les ménages au budget de l'administration publique, calculé comme taux moyen par rapport à leurs revenus provenus du travail et du capital
w2t et w3t - le revenu provenu du travail dans le secteur des firmes et de l’administration publique, calculé en moyenne par personne employée. Pour la détermination de ces indicateurs on prend en considération toutes les formes de revenus rattachés au travail fourni.
L3t - le nombre de salariés rémunérés par les fonds du budget de l'admi-nistration publique.
fit - le taux moyen du revenu provenu du capital pour les ménages; y sont inclus les dividendes, autres formes de participation et, généralement, tous les revenus rattaches au capital et qui arrivent directement aux ménages.
t31τ - le coefficient des transferts gratuits (de toute catégorie) du budget de l'administration publique vers les ménages, calculé comme moyenne par rapport aux revenus bruts de ce budget
T32t - le volume des transferts gratuits (subventions, allocations budgétai-res, autres facilités) du budget de l'administration publique vers le secteur des firmes.
f3t - le taux moyen du revenu provenu du capital pour la propriété d'Etat et qui se constitue en source pour le budget de l'administration publique.
196
2.3. Par la résolution du système d'équations de comportement et comp-tables, pour chaque groupe de variables exogènes (de calcul et optionnelles) on obtient une série d'indicateurs dérivés.
∗∆ tK2 - le capital fixe qui résulte du processus d'investissement réalisé pendant la période précédente et continué pendant l'année courante (en prix de 1990).
K2t - le capital total, en prix courants. K2t - le capital total utilisé, dont tN~2 représente les stocks. Et - le volume total des ressources énergétiques disponibles de l'intérieur
et de l'importation (en unités énergétiques conventionnelles). Emt - le volume des ressources énergétiques disponibles de l'importation
(en unités énergétiques conventionnelles). Met - les importations de ressources énergétiques, évaluées en dollars,
prix courants. Mt - les importations totales, exprimées en dollars, prix courants. Myt - les importations de produits intermédiaires, calculées en dollars,
prix courants. Xt - le volume des exportations, exprimé en dollars, prix courants.
∗tK2 - le capital utilisé, exprimé dans les prix sur la base desquels on a
déterminé la fonction de production, c'est-à-dire, les prix de 1990. ∗tY2 - le produit intérieur brut, en prix constants, résulté de la fonction de
production; celui-ci caractérise l'offre potentielle, dans les conditions des capa-cités utilisées.
L2t - la main-d'oeuvre disponible pour le secteur des firmes. ∗etY - le produit intérieur brut en prix constants, réalisable dans le cadre
de la restriction énergétique définie par les grandeurs Et cet gt; comme ∗qtY , cet
indicateur évalue l'offre potentielle, en respectant la restriction mentionnée. ∗tY - le produit intérieur brut effectif, en prix constants;, son niveau satis-
fait les deux restrictions (de capacité productive et d'énergie).
tL~2 - la main-d'oeuvre employée par le secteur des firmes.
tλ - le degré de non-utilisation des capacités productives comme effet de la restriction énergétique.
I2t - la formation brute du capital. 0tb - le taux anticipé du profit des firmes, dont le niveau influence les dé-
cisions d'investissements. Ab2t - l'excédent brut d'exploitation des firmes, défini comme total de
l'excédent net et de l'amortissement.
197
0tdn - l'intérêt nominal anticipé.
tdn - l'intérêt nominal effectif. 02 tI - la variation du volume des stocks.
N2t - le volume des stocks. bt - le taux effectif du profit des firmes qui résulte du groupe donné des
variables optionnelles. Ct - la demande agrégée au niveau de l'économie nationale. C1t - les frais des ménages. V1t - les revenus nets des ménages.
01tV - les revenus bruts des ménages.
S1t - l'épargne des ménages. V3t - les revenus nets du budget de l'administration publique.
03tV - les revenus bruts du budget de l'administration publique.
tP~ - l'indice général effectif des prix internes, par rapport à l'année pré-cédente.
90tP~ - l'indice général des prix, par rapport au 1990.
ot - le taux de change (exprimé en lei par rapport à un dollar). Yt - le produit intérieur brut, en prix courants.
t2∆ - le solde financier du secteur des firmes.
t3∆ - le solde du budget de l'administration publique.
t4∆ - la modification des ressources monétaires pour l'ensemble de l'économie.
∗tL - le total de la main-d'oeuvre employée dans l'économie.
rt - le taux du chômage calculé par rapport à la population active. 3) Le système d'équations de comportement et comptables du macro-
modèle se présente comme suit: 1. 3212 557809877315857503110614202 D.D.D.D..K ot +−+−=∆ ∗
)t()t()t()t(to bIbIbIbIbID 423222122 −−−− ++++=
)t()t()t()t( bIbIbIbID 423222121 432 −−−− +++=
)t()t()t()t( bIbIbIbID 423222122 1694 −−−− +++=
)t()t()t()t( bIbIbIbID 423222123 64278 −−−− +++=
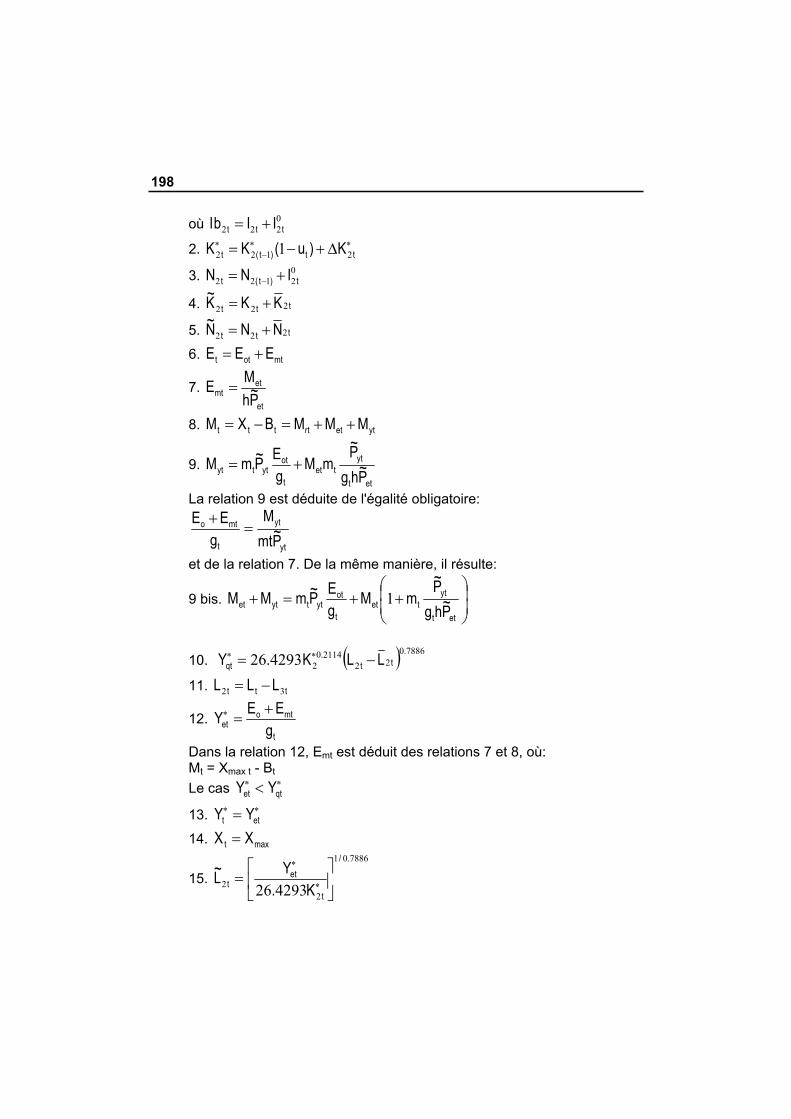
198
où 0222 ttt IIbI +=
2. ∗∗−
∗ ∆+−= tt)t(t K)u(KK 2122 1
3. 02122 t)t(t INN += −
4. ttt KKK~ 222 +=
5. ttt NNN~ 222 +=
6. mtott EEE +=
7. et
etmt P~h
ME =
8. ytetrtttt MMMBXM ++=−=
9. ett
yttet
t
otyttyt P~hg
P~mM
gEP~mM +=
La relation 9 est déduite de l'égalité obligatoire:
yt
yt
t
mto
P~mtM
gEE
=+
et de la relation 7. De la même manière, il résulte:
9 bis. ⎟⎟⎠
⎞⎜⎜⎝
⎛++=+
ett
yttet
t
otyttytet P~hg
P~mM
gEP~mMM 1
10. ( ) 7886022
211402429326
.tt
.qt LLK.Y −= ∗∗
11. ttt LLL 32 −=
12. t
mtoet g
EEY +=∗
Dans la relation 12, Emt est déduit des relations 7 et 8, où: Mt = Xmax t - Bt Le cas ∗∗ < qtet YY
13. ∗∗ = ett YY
14. maxt XX =
15. 788601
22 429326
./
t
ett K.
YL~ ⎥⎦
⎤⎢⎣
⎡= ∗
∗
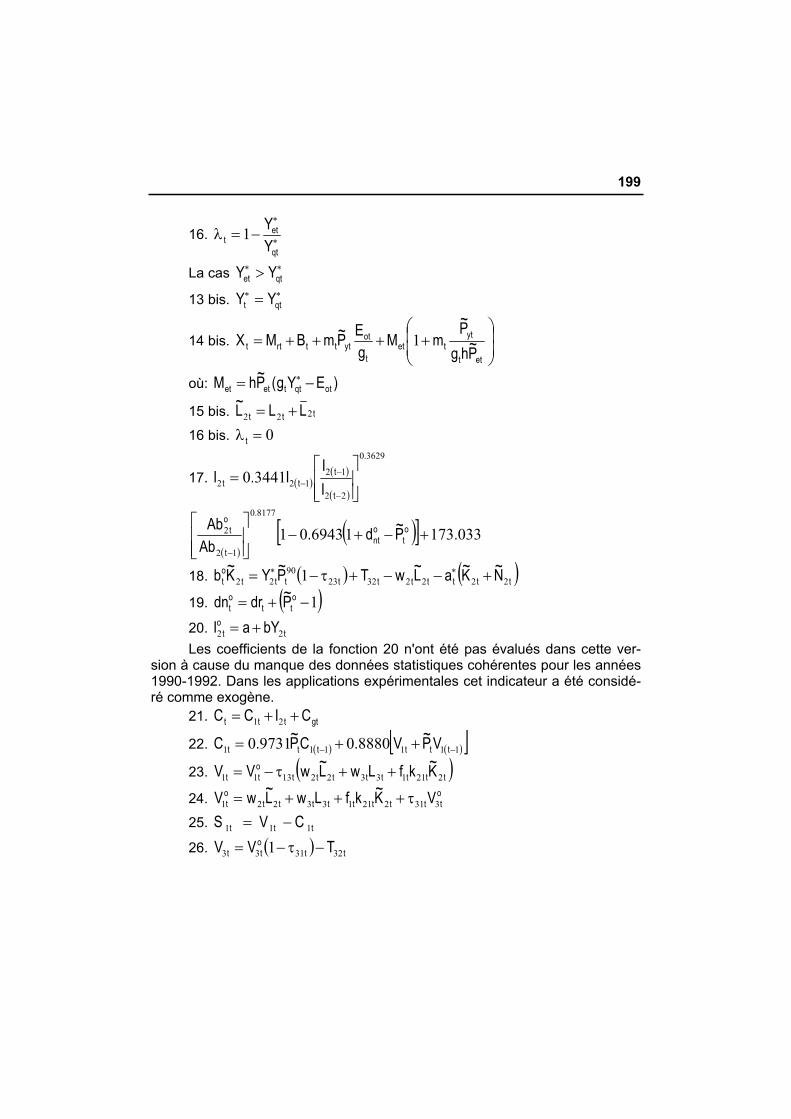
199
16. ∗
∗
−=λqt
ett Y
Y1
La cas ∗∗ > qtet YY
13 bis. ∗∗ = qtt YY
14 bis. ⎟⎟⎠
⎞⎜⎜⎝
⎛++++=
ett
yttet
t
otytttrtt P~hg
P~mM
gEP~mBMX 1
où: )EYg(P~hM otqttetet −= ∗
15 bis. ttt LLL~ 222 +=
16 bis. 0=λ t
17. ( )( )
( )
36290
22
12122 34410
.
t
ttt I
II.I
⎥⎥⎦
⎤
⎢⎢⎣
⎡=
−
−−
( )( )[ ] 0331731694301
81770
12
2 .P~d.Ab
Ab ot
ont
.
t
ot +−+−⎥⎥⎦
⎤
⎢⎢⎣
⎡
−
18. ( ) ( )ttttttttttot N~K~aL~wTP~YK~b 22223223
9022 1 +−−+τ−= ∗∗
19. ( )1−+= ott
ot P~drdn
20. to
t bYaI 22 += Les coefficients de la fonction 20 n'ont été pas évalués dans cette ver-
sion à cause du manque des données statistiques cohérentes pour les années 1990-1992. Dans les applications expérimentales cet indicateur a été considé-ré comme exogène.
21. gtttt CICC ++= 21
22. ( ) ( )[ ]111111 8880097310 −− ++= tttttt VP~V.CP~.C
23. ( )ttttttttott K~kfLwL~wVV 221133221311 ++τ−=
24. ottttttttt
ot VK~kfLwL~wV 331221133221 τ+++=
25. ttt CVS 111 −=
26. ( ) ttott TVV 323133 1 −τ−=
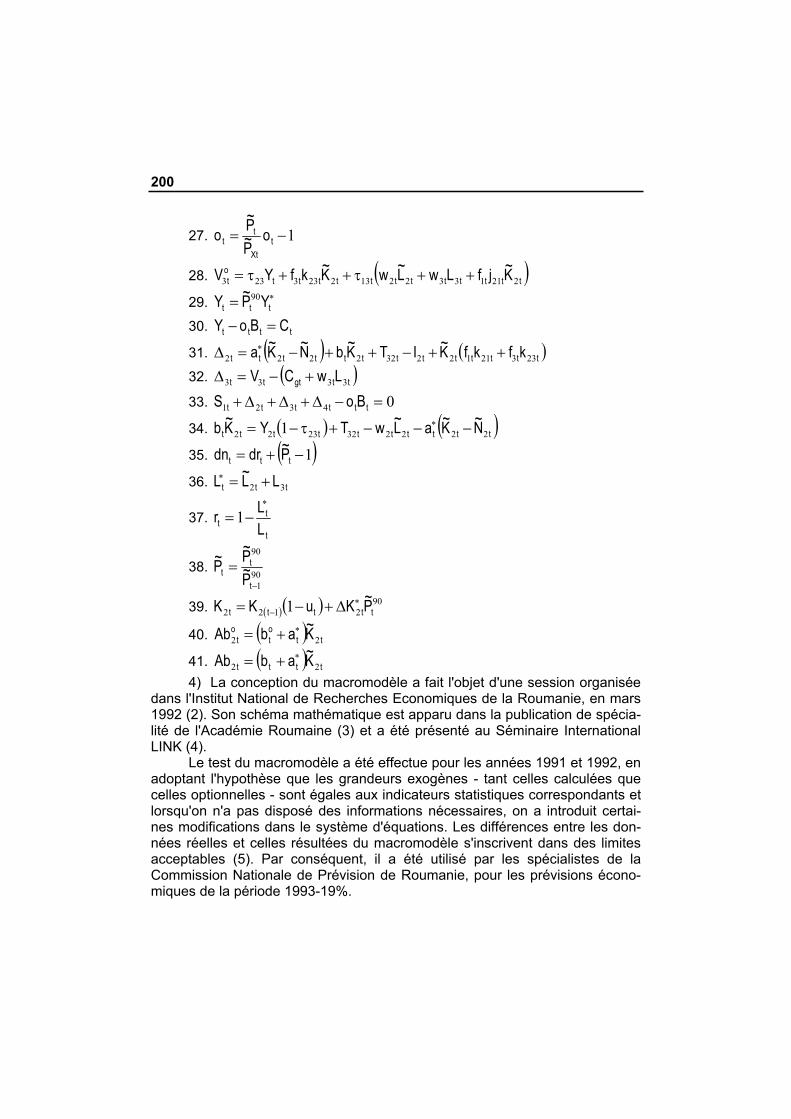
200
27. 1−= tXt
tt o
P~P~o
28. ( )ttttttttttttot K~jfLwL~wK~kfYV 22113322132233233 ++τ++τ=
29. ∗= ttt YP~Y 90
30. tttt CBoY =−
31. ( ) ( )ttttttttttttt kfkfK~ITK~bN~K~a 23321122322222 ++−++−=∆ ∗
32. ( )ttgttt LwCV 3333 +−=∆
33. 04321 =−∆+∆+∆+ tttttt BoS
34. ( ) ( )tttttttttt N~K~aL~wTYK~b 2222322322 1 −−−+τ−= ∗
35. ( )1−+= ttt P~drdn
36. ttt LL~L 32 +=∗
37. t
tt L
Lr∗
−=1
38. 90
1
90
−
=t
tt P~
P~P~
39. ( )( ) 902122 1 ttttt P~KuKK ∗
− ∆+−=
40. ( ) ttot
ot K~abAb 22
∗+=
41. ( ) tttt K~abAb 22∗+=
4) La conception du macromodèle a fait l'objet d'une session organisée dans l'Institut National de Recherches Economiques de la Roumanie, en mars 1992 (2). Son schéma mathématique est apparu dans la publication de spécia-lité de l'Académie Roumaine (3) et a été présenté au Séminaire International LINK (4).
Le test du macromodèle a été effectue pour les années 1991 et 1992, en adoptant l'hypothèse que les grandeurs exogènes - tant celles calculées que celles optionnelles - sont égales aux indicateurs statistiques correspondants et lorsqu'on n'a pas disposé des informations nécessaires, on a introduit certai-nes modifications dans le système d'équations. Les différences entre les don-nées réelles et celles résultées du macromodèle s'inscrivent dans des limites acceptables (5). Par conséquent, il a été utilisé par les spécialistes de la Commission Nationale de Prévision de Roumanie, pour les prévisions écono-miques de la période 1993-19%.
201
5) La version actuelle a un caractère expérimental, représentant un point de départ pour de nouvelles élaborations. A mentionner les principales directions de développement du macromodèle:
− l'augmentation de son autonomie, en rendant endogènes certaines des grandeurs actuelles exogènes (calculées et optionnelles);
− la représentation du PIB par branches, en utilisant des fonctions de production spécifiques, certaines équations d'équilibre intersectoriel, ainsi que des corrélations économétriques entre la structure de la consommation finale et la demande;
− la désagrégation du secteur des firmes, se constituant au moins trois sous-groupes: a) les régies autonomes; b) les sociétés commerciales à capital intégral ou prépondérant d'Etat; c) les firmes à capital intégral ou prépondérant privé, parce que - tel que l'expérience démontre - non seulement les régimes de leur fonctionnement, mais aussi leurs fonctions objectif sont essentiellement différentes;
− la représentation de la fiscalité par ses formes principales: la taxe à la valeur ajoutée, l'impôt sur le profit, l'impôt sur les revenus personnels, les droits de douane etc.;
− la mise en évidence des implications des "arriéré" (les paiements res-tants des entreprises tant dans les relations entre elles qu'à l'égard du budget et du système bancaire) et de la "dollarisation" de l'économie (une partie significative des transactions internes se déroule en devises);
− la prise en calcul de l'économie noninregistrée qui - dans les conditions de la transition - gagne des dimensions considérables et les barrières qui la délimitent de l'économie inrégistrée deviennent très labiles;
− l'utilisation, lors de la détermination des paramètres des fonctions économétriques, de certaines estimations d'expertise technique-économique et des investigations sociologiques; parce que la régression statistique s'avère insuffisante à cause du caractère hybride des séries de données (étant composés des grandeurs antérieures et postérieures au moment du déclenchement de la transition, ces séries - même étant homogénisées du point de vue méthodologique - expriment des comportements et mécanismes différents du point de vue structural).
Il est évident, donc, que le progrès de la modélisation pendant la période de la transition est conditionné non seulement par la résolution des problèmes d'ordre technique et informationnel, mais aussi par l'élaboration d'une théorie macroéconomique adéquate à cette phase historique (ne s'agissant pas seulement d'une simple adaptation des paradigmes traditionnels).
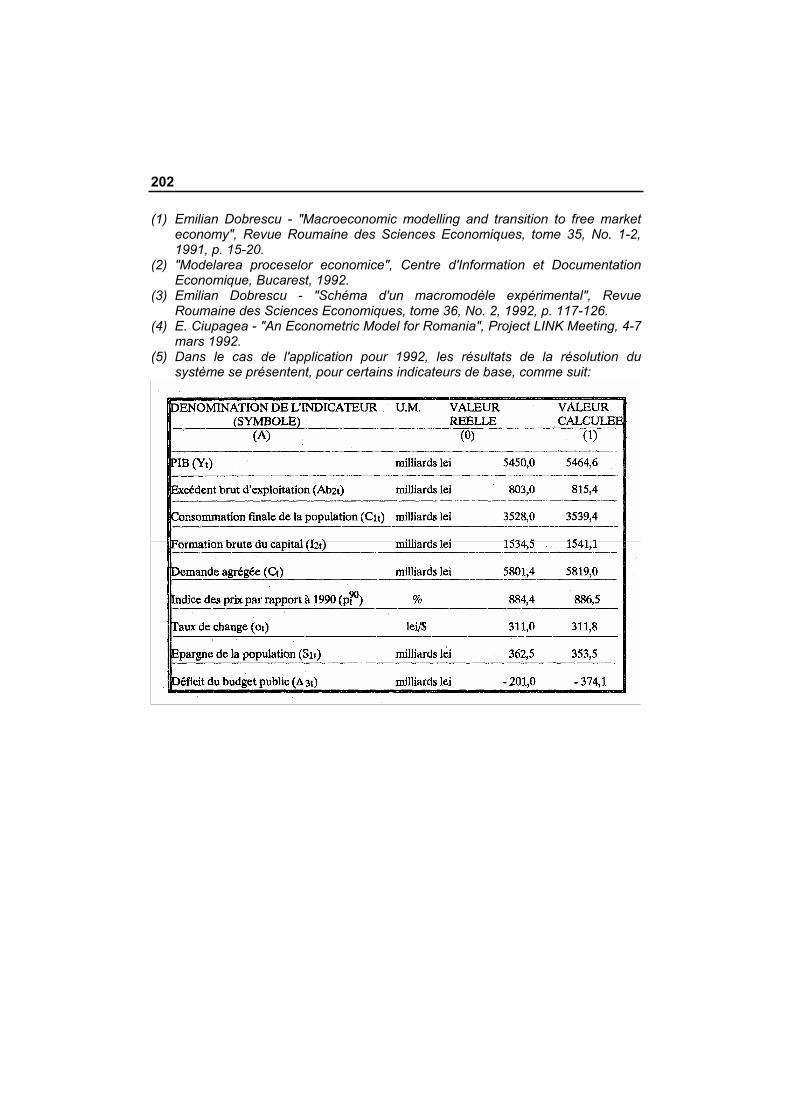
202
(1) Emilian Dobrescu - "Macroeconomic modelling and transition to free market economy", Revue Roumaine des Sciences Economiques, tome 35, No. 1-2, 1991, p. 15-20.
(2) "Modelarea proceselor economice", Centre d'Information et Documentation Economique, Bucarest, 1992.
(3) Emilian Dobrescu - "Schéma d'un macromodèle expérimental", Revue Roumaine des Sciences Economiques, tome 36, No. 2, 1992, p. 117-126.
(4) E. Ciupagea - "An Econometric Model for Romania", Project LINK Meeting, 4-7 mars 1992.
(5) Dans le cas de l'application pour 1992, les résultats de la résolution du système se présentent, pour certains indicateurs de base, comme suit:
INDEX DE AUTORI
Constantin GRIGORESCU, 5 (XXVIII) Emilian DOBRESCU, 191 (XXVIII) Georgeta DUMITRESCU, 5 (XXVIII)
Maria MOLNAR, 5 (XXVIII) Maria POENARU, 5 (XXVIII) Napoleon POP, 107, 115 (XXVIII)