ingineria - siar.rosiar.ro/wp-content/uploads/2016/10/ria-nr.40-2016_3-septembrie.pdf · În timp...
TRANSCRIPT
se distr ibuie gr atuit ca supli m en t al r evistei au totestnr. 40 / septembrie 2016
SIAR eSte membRă
InteRnAtIonAlfedeRAtIon ofAutomotIveenGIneeRInGSocIetIeS
euRopeAnAutomobIleenGIneeRScoopeRAtIon
Ingineriaautomobilului Societatea
Inginerilorde Automobiledin România
RegistrulAutoRomân
Cercetări privind articulația cardanică din sistemul de direcție Alimentarea cu GPL a
motorului unui autocamion Stand pentru cercetări de fiabilitate a cutiilor de viteze
Optimizarea circulației rutiere într-o intersecție pe DN73 Evaluarea toxicității traficului urban
26 – 29 Octombrie 2016Universitatea „Transilvania” BraşovCONAT 2016
BAZELE ANALIZEI ACCIDENTELOR RUTIERE
Autori: Marin MARINESCU, Octavian ALEXA
Editura Academiei Tehnice MilitareAnul apariției: 2016ISBN: 978-973-640-244-9
Lucrarea se adresează studenților din Academia Tehnică Militară care urmează programe de studii în domeniul „Ingineria autovehiculelor” și își propune să pună la dispoziția acestora elementele de bază ale dinamicii participanţilor la trafic implicaţi în evenimente rutiere şi să ofere modele simple de analiză şi reconstrucţie a acestor evenimente. Fără a avea pretenţii de precizie ridicată în reconstrucţia evenimentelor rutiere, autorii au dorit ca, în urma parcurgerii textului, cititorul să poată să-şi formeze opinii de bază privind problematica acestui fenomen complex. Pentru a se ajunge la analize cu un grad ridicat de acuratețe, modelele matematice necesare sunt mult mai complexe.
În cuprinsul lucrării, autorii parcurg următoarele capitole:• Accidentele rutiere şi siguranţa circulaţiei• Influenţa interacţiunii pneu – cale de rulare asupra siguranţei circulaţiei rutiere. • Bazele dinamicii autovehiculului• Caracteristicile constructive şi dinamice ale autovehiculelor• Maniabilitatea şi stabilirea autovehiculelor• Coliziunea autovehiculelor• Factorul uman în evenimentele rutiere• Analiza accidentului de circulaţie
ALTERNATIVE PROPULSION FOR AUTOMOBILES
Autor: Cornel STAN
Springer International Publishin, Swizerland, 2016Anul apariției: 2016ISBN: 978-3-319-31929-2ISBN 978-3-319-31930-3 (eBook)
ALTERNATIVE ANTRIEBE FÜR AUTOMOBILESpringer Verlag, Berlin, HeidelbergAnul apariției: 2015ISBN: 978-3-662-48511-8ISBN: 978-3-662-48512-5 (eBook)
The book presents – based on the most recent research and development results worldwide - the perspectives of new propulsion concepts such as electric cars with batteries and fuel cells, and furthermore plug in hybrids with conventional and alternative fuels. The propulsion concepts are evaluated based on specific power, torque characteristic, acceleration behaviour, specific fuel consumption and pollutant emissions. The alternative fuels are discussed in terms of availability, production, technical complexity of the storage on board, costs, safety and infrastructure.The book presents summarized data about vehicles with electric and hybrid propulsion.The propulsion of future cars will be marked by diversity – from compact electric city cars and range extender vehicles for suburban and rural areas up to hybrid or plug in SUV´s, Pick up´s and luxury class automobiles.
3
Ingineria automobilului Nr. 40 / septembrie 2016
CONAT LA DIMENSIUNEA INTERNAŢIONALĂ A DEZVOLTĂRII AUTOMOBILELORINTERNATIONAL MAGNITUDE IN AUTOMOTIVE ENGINEERING FOR CONAT CONGRESS
În timp ce populaţia Terrei a depăşit 7,4 miliarde de oameni, şi numărul automobilelor a crescut în mod vertiginos, depăşind la ora actuală 1,2 mili-
arde! Mai îngrijorător este însă un alt aspect, şi anume concentrarea crescândă a populaţiei şi prin urmare a vehiculelor în mega-centre urbane, cu peste douăzeci de milioane de locuitori fiecare. Această polarizare nu duce numai la creşterea densităţii traficului, cu
toate problemele inerente, ci şi la pericolul imanent al infectării aerului atmosferic cu concentraţii dăunătoare de bioxid de carbon, monoxid de carbon, oxizi de azot şi particule. În multe oraşe din lume au fost create zone urbane ecologice, în care accesul vehiculelor cu emisii de parti-cule şi funingine peste limitele stabilite prin legi este interzis. Pe de altă parte, limita emisiei de bioxid de carbon a automobilelor va fi coborâtă în următorii patru ani la 95 grame /km, în perioada imediat următoare la 50 grame /km, iar până în anul 2050 – dar se pare că acest orizont va fi în curând foarte scurtat – la 20 grame /km. Această limită nu se referă la fiecare automobil, ci este media emisiilor pentru gama de modele produse de o marcă – Porsche, Ford sau Nissan. Iar 20 grame /km înseamnă un consum de 0,88 litri benzină /100 km – acesta ar trebui să fie consumul mediu pe flotă! Deci producţia unui SUV sau Pick-up cu motor cu ardere internă obligă la fabricarea a douăzeci de automobile electrice, fără emisie locală de bioxid de carbon. Pe de altă parte, scandalul internaţional actual provocat de nerespectarea limitelor de emisii de oxizi de azot, care vizează concernul Volkswagen dar şi alte firme de renume pun în discuţie chiar existenţa motoarelor diesel.Din perspectiva emisiilor de bioxid de carbon şi de oxizi de azot, zilele motoarelor cu ardere internă pentru automobile par a fi numărate! În ultimul timp se constată o ofensivă puternică a automobilelor electrice, ofensivă fabricată în special de politicieni şi de mass media. Procentele actuale de vânzări şi studiile de perspectivă nu confirmă o asemenea dezvoltare la un nivel cât de cât considerabil. Automobilele electrice contribuie bineînţeles la scăderea concentraţiei locale de bioxid de carbon, oxizi de azot şi particule în zone urbane, energia electrică este produsă însă, la nivel mondial, în cea mai mare parte pe bază de combus-tibili fosili – deci problema emisiilor nu este rezolvată, ci doar deplasată. Pe de altă parte, scenariul de viitor cu pile de combustibil alimentate cu hidrogen este pus sub semnul întrebării nu numai datorită complexităţii şi a preţurilor acestor sisteme – producţia mondială de hidrogen fiind practic bazată pe combustibili fosili cum ar fi petrolul şi gazul metan, cu emisiile aferente de bioxid de carbon sau particule la locul de producţie. Concepţia despre un automobil universal, cu un sistem de propulsie unic
este în contradicţie cu condiţiile naturale, economice, tehnice şi sociale la nivel mondial. Viitorul automobilelor va fi marcat de diversitate pe baze modulare – de la vehicule electrice compacte în Tokio şi maşini de teren în Alpi până la Pick-up în Texas. În altă ordine de idei, un automobil nu este şi nu va fi niciodată un înveliş al unui anumit sistem de propulsie, electric sau de alt gen. Un automobil trebuie să corespundă mai multor cerinţe – putere, consum de energie, emisii, siguranţa activă şi pasivă, conectivitate, climatizare, confort, deplasare autonomă.Ingineria automobilului devine, din perspectiva acestor exemple, pe deoparte mult mai complexă, pe de altă parte mult mai specializată decât până acum, implicând multe domenii noi de cercetare şi dezvoltare. Este cu atât mai îmbucurător faptul că a XII ediţie a Congresului CONAT, organizat de Universitatea Transilvania la Braşov între 25-28 octombrie 2016, va fi marcată tocmai de aceste aspecte: în plan orizontal, la nivel de secţiuni iese în evidenţă complexitatea, în plan vertical, la nivel de lucrări se remarcă specializarea. Titlurile secţiunilor vorbesc de la sine:• Soluţii inovative pentru vehicule motorizate • Automobilele şi ecologia• Sisteme de transport şi trafic • Metode de cercetare avansate • Vehi-cule grele şi vehicule speciale • Material, producţie şi logistică • Analiza accidentelor.În aceste secţiuni vor fi tratate teme precum: sisteme viitoare de mobi-litate, noi sisteme de propulsie, studii de aerodinamică a automobilului, optimizarea traficului în zone urbane, noua legislaţie privind cicluri reale de testare.Desfăşurarea concomitentă a unui Congres studenţesc de automobile este o iniţiativă deosebit de binevenită a organizatorilor CONAT. În această ediţie a CONAT vor fi prezentate peste 200 de lucrări naţionale şi internaţionale, selectate de un comitet de specialişti de renume. Este remarcabil faptul că aceste lucrări vor fi publicate într-un volum editat de prestigioasa editură Springer Nature, facilitând difuzarea internaţională a acestui eveniment. Internaţionalitatea congresului este subliniată însă şi de către autorii expunerilor plenare printre care se numără preşedinţi şi vicepreşedinţi de la SAE International, Renault România şi Schaeffler Deutschland. Congresul CONAT se încadrează cu brio în activităţile internaţionale de cercetare şi dezvoltare a automobilelor moderne.Doresc să le urez organizatorilor şi autorilor mult succes, iar participan-ţilor împlinirea aşteptărilor!
Prof. Dr. Ing. Habil. Dr. h. c. Cornel STAN
SUMAR „INGINERIA AUTOMOBILULUI“ NR. 40
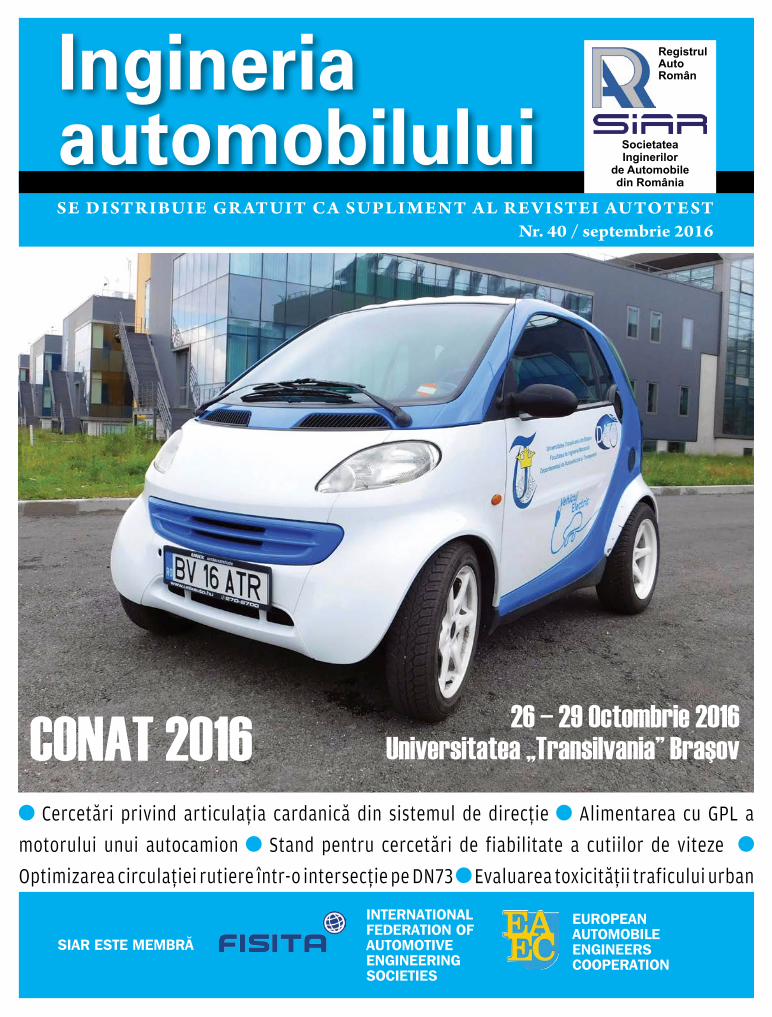
Coperta 1 – Automobil electric realizat de studenții Universității „Transilvania” din Braşov
3 CONAT LA DIMENSIUNEA INTERNAŢIONALĂ A DEZVOLTĂRII AUTOMOBILELOR / INTERNATIONAL MAGNITUDE IN AUTOMOTIVE ENGINEERING FOR CONAT CONGRESS5 INTERVIU CU DOMNUL PROF. UNIV. DR. ING. IOAN VASILE ABRUDAN, RECTORUL UNIVERSITĂŢII „TRANSILVANIA” DIN BRAŞOV / INTERVIEW WITH MR. PROFESSOR IOAN VASILE ABRUDAN, RECTOR OF „TRANSILVANIA” UNIVERSITY OF BRAŞOV7 EXPERIMENTAL AND NUMERICAL INVESTIGATION ON TORSIONAL FAILURE OF CARDAN JOINT OF AN INTERMEDIATE STEERING SHAFT / CERCETĂRI NUMERICE ŞI EXPERIMENTALE PRIVIND DEFECTAREA ARTICULAŢIEI CARDANICE DIN COMPUNEREA UNUI ARBORE INTERMEDIAR DIN SISTEMUL DE DIRECŢIE13 EXPERIMENTAL INVESTIGATIONS ASPECTS
13 OF THE FUELLING A TRUCK DIESEL ENGINE WITH LPG / ASPECTE ALE INVESTIGAŢIILOR EXPERIMENTALE ASUPRA ALIMENTARII CU GPL A UNUI MOTOR DIESEL DE AUTOCAMION16 THE DEVELOPMENT OF AN EXPERIMENTAL TEST STAND FOR DIAGNOSIS OF GEARBOX RELIABILITY / DEZVOLTAREA UNUI STAND EXPERIMENTAL PENTRU DIAGNOZA DE FIABILITATE A CUTIILOR DE VITEZE20 THE INCREASE OF THE SERVICE LEVEL OF A ROAD INTERSECTION BY TRANSFORMING IT INTO A ROUNDABOUT INTERSECTION / CREŞTEREA NIVELULUI DE SERVICIU AL UNEI INTERSECŢII RUTIERE PRIN TRANSFORMAREA ACESTEIA ÎN INTERSECŢIE CU SENS GIRATORIU24 URBAN TRAFFIC TOXICITY INDEX EVALUATION / ASUPRA UNUI INDICE DE EVALUARE A TOXICITĂŢII TRAFICULUI URBAN
4
Ingineria automobilului Nr. 40 / septembrie 2016
RegistRul Auto Român
Director generalGeorge-Adrian DINCĂ
Director tehnicCristian Viorel BUCUR
Director economicMihaela GHEORGHE
Director dezvoltareGabriel Florentin TUDORACHE
Şef Birou Comunicare şi Redacţie Revistă Auto test
Roxana NICA
RedactoriRadu BUHĂNIŢĂ
Emilia PETREGeorge DRUGESCU
Gabriel MANOLE
Contact:Calea Griviţei 391 A,
sector 1, cod poştal 010719, Bucureşti, România
Tel/Fax: 021/202.70.17E-mail: [email protected]
www.rarom.rowww.autotestmagazin.ro
siAR
ContactFacultatea de TransporturiUniversitatea Politehnica
BucureştiSplaiul Independenţei 313
Sala JC 005, Cod poştal 060042, sector 6, Bucureşti, România
Tel/Fax: 021/316.96.08E-mail: [email protected]
www.ingineria-automobilului.rowww.siar.ro
TIPARs.C. tiPogRAFiA PRoDCom s.R.l.
Str. Lt. Col. Dumitru Petrescu nr. 20Târgu-Jiu
Reproducerea integrală sau parţială a textelor şi imaginilor se face numai cu acordul Revistei Auto Test,
a Registrului Auto Român.
soCietAteA ingineRiloR De AutomoBile Din RomâniAPreşedinte: Conf. dr. ing. Adrian ClenCi, Universitatea din Piteşti
Preşedinte de onoare: Prof. dr. ing. eugen negRuŞ, Universitatea Politehnica din BucureştiVicepreşedinte: Prof. dr. ing. Cristian AnDReesCu, Universitatea Politehnica din Bucureşti
Vicepreşedinte: Prof. dr. ing. nicolae BuRnete, Universitatea Tehnică din Cluj-NapocaVicepreşedinte: Prof. dr. ing. Anghel CHiRu, Universitatea „Transilvania” din Braşov
Vicepreşedinte: Prof. dr. ing. Victor oȚĂt, Universitatea din CraiovaVicepreşedinte: Prof. dr. ing. ioan tABACu, Universitatea din Piteşti
Secretar General: Prof. dr. ing. minu mitReA, Academia Tehnică Militară din Bucureşti
Redactor şef: Prof. Dr. -Ing. habil. Prof. E. h. Dr. h.c. Cornel stAn West Saxon University of Zwickau, Germany
Redactor şef executiv: Prof. dr. ing. nicolae isPAs, Universitatea „Transilvania” BraşovRedactori‑şefi adjuncţi:
Prof. dr. ing. Radu CHiRiAC, Universitatea Politehnica din BucureştiProf. dr. ing. ion CoPAe, Academia Tehnică Militară din Bucureşti
Conf. dr. ing. Ştefan tABACu, Universitatea din PiteştiRedactori:
Conf. dr. ing. george DRAgomiR, Universitatea din OradeaConf. dr. ing. ilie DumitRu, Universitatea din Craiova
Conf. dr. ing. marin mARinesCu, Academia Tehnică Militară din BucureştiConf. dr. ing. Adrian sACHelARie, Universitatea Tehnică „Gh. Asachi” din Iaşi
S.l. dr. ing. marius BĂŢĂuŞ, Universitatea Politehnica din BucureştiS.l. dr. ing. Cristian ColDeA, Universitatea Tehnică din Cluj-Napoca
secretar de redacţie: Prof. dr. ing. minu mitReA, Secretar General SIAR
AVL România – gerolf stRoHmeieRRegistrul Auto Român – RAR – george‑Adrian DinCĂ
Renault Technologie Roumanie – Pascal CAnDAuUniunea Națională a Transportatorilor Rutieri din România – UNTRR – Florian miHuȚ
Colegiul De ReDACŢie
Comitetul De onoARe Al siAR
Comitetul ŞtiinȚiFiCProf. Dennis AssAnis
University of Michigan, Michigan, United States of America
Prof. Rodica A. BĂRĂnesCuUniversity of IIlinois at Chicago College of
Engineering, United States of America
Prof. nicolae BuRneteUniversitatea Tehnică din Cluj-Napoca, România
Prof. giovanni CiPollAPolitecnico di Torino, Italy
Dr. Felice e. CoRCioneEngines Institute, Naples, Italy
Prof. georges DesComBesConservatoire National des Arts et Metiers de Paris,
France
Prof. Cedomir DuBoKAUniversity of Belgrade Serbia
Prof. Pedro esteBAnInstitute for Applied Automotive Research
Tarragona, Spain
Prof. Radu gAiginsCHiUniversitatea Tehnică „Gh. Asachi” din Iaşi,
România
Prof. Berthold gRÜnWAlDTechnical University of Darmstadt, Germany
Eng. eduard goloVAtAi‑sCHmiDtSchaeffler AG & Co. KG Herzogenaurach, Germany
Prof. Peter KuCHARUniversity for Applied Sciences, Konstanz, Germany
Prof. mircea oPReAnUniversitatea Politehnica din Bucureşti, România
Prof. nicolae V. oRlAnDeARetired Professor, University of Michigan Ann Arbor, M.I., USA
Prof. Victor oȚĂtUniversitatea din Craiova, România
Prof. Pierre PoDeVinConservatoire National des Arts et Metiers de Paris, France
Prof. Andreas seelingeRInstitute of Mining and Metallurgical Machine, Engineering, Aachen, Germany
Prof. ulrich sPiCHeRKalrsuhe University, Karlsruhe, Germany
Prof. Cornel stAnWest Saxon University of Zwickau, Germany
Prof. Dinu tARAZAWayne State University, United States of America
Prof. michael ButsCHUniversity of Applied Sciences, Konstanz, Germany
Ingineria automobilului: an apariţie ediţia tipărită 2006 (ISSN 1842 – 4074) / ediţia electronică 2007 (ISSN 2284 – 5690). Serie nouă a Revistei Inginerilor de Automobile (RIA), tipărită în perioada 1990-2000 (ISSN 1222-5142)
SIAR publică online Romanian Journal of Automotive Engineering ISSN 2457 – 5275

5
Ingineria automobilului Nr. 40 / septembrie 2016
INTERVIU CU DOMNUL PROF. UNIV. DR. ING. IOAN VASILE ABRUDAN, RECTORUL UNIVERSITĂŢII „TRANSILVANIA” DIN BRAşOVINTERVIEW WITH MR. PROFESSOR IOAN VASILE ABRUDAN,RECTOR OF „TRANSILVANIA” UNIVERSITY OF BRAşOVStimate domnule Rector, Universitatea Transil-vania din Brașov reprezintă unul dintre cei mai importanți furnizori naționali de programe de studii universitare de formare a specialiștilor în domeniul ingineriei. Mediul economic și social românesc a evoluat dramatic și a determinat schimbări majore în structura și dezvoltarea industriei românești. Cum apreciați adaptarea învățământului universitar ingineresc la aceste schimbări?Universitatea „Transilvania” din Braşov este instituția de învățământ superior din Braşov, care, prin oferta de educație, prin rezultatele cercetării ştiințifice, prin calitatea cadrelor didactice, a absolvenților şi prin numărul de studenți reprezintă una dintre universitățile mari ale României, fiind şi cea mai mare şi mai performantă universitate din Regiunea 7 Centru. Universitatea cuprinde optsprezece facultăți, un număr de peste 19 000 de studenți şi aproximativ 750 de cadre didactice titulare. Nouă din cele 18 facultăți furnizează programe de studiu în domeniul ştiințelor inginereşti, unele dintre acestea fiind unice la nivel național. Caracterul ştiințific eterogen al ofertei educaționale a Universității noastre a devenit în timp un avantaj incontestabil regăsit în formarea interdiscipli-nară a unei părți din absolvenți, dar şi în rezultatele remarcabile obținute de cercetarea ştiințifică interdisciplinară.Evoluția mediului economic şi social din România, mai ales după anul 2005, a determinat eforturi remarcabile de adecvare a ofertei noastre educaționale nu numai la exigențele naționale ci şi la cele, mult mai complexe, ale Uniunii Europene.Adaptarea învățământului universitar ingineresc la schimbările mediului economic este un proces continuu, aşa cum şi modificările din viața reală sunt continue. Evident că de multe ori răspunsul învățământului univer-sitar ingineresc braşovean la schimbările din mediul economic/social este reactiv. Idealul spre care tindem este ca, cel puțin în unele aspecte, cali-tatea absolvenților noştri şi rezultatele cercetării ştiințifice să fie elemente care să impună unele transformări vizibile în mediul economic şi social, adică răspunsul Universității noastre la aceste provocări să fie proactiv.Posibilitatea de a lucra în mari companii internaționale în țară sau chiar peste hotare - cu importante beneficii materiale, iar pe de altă parte - cerințele specifice unei cariere în învățământul universitar - sunt factori care nu încurajează în această perioadă păstrarea celor mai buni absolvenți în învățământul superior din România. Ce instrumente au la îndemână universitățile românești pentru a-și păstra și consolida un corp performant de cadre didactice universitare?Politica referitoare la resursa umană este o prioritate în cadrul strate-giei de dezvoltare a Universității. Atragerea celor mai buni absolvenți în comunitatea cadrelor didactice ale Universității Transilvania din Braşov este un obiectiv important al departamentelor şi facultăților noastre. În
condițiile ofertei salariale mult mai generoase venite dinspre mediul economic privat, național sau european, mai ales pentru absolvenții ingi-neri, motivarea acestora începe în primii ani de studii universitare prin cultivarea şi dezvoltarea pasiunii pentru profesie. Continuarea pregătirii prin studii de master şi doctorat poate deter-mina potențarea acestei motivații şi orientarea precisă a absolventului către domenii specifice în care acesta să atingă un nivel de excelență. Tocmai atingerea acestui nivel de excelență permite ca, prin integrarea în proiecte de cerce-tare ştiințifică, tânărul cadru didactic, provenit din rândul absolvenților de elită ai Universității, să beneficieze de o ofertă salarială suplimentară substanțială, comparabilă sau superioară celei din mediul economic.Având în vedere informațiile pe care le dețineți, cum apreciați gradul de absorbție în economia
României a absolvenților de studii universitare inginerești din universi-tatea dumneavoastră?Absolvenții ingineri se integrează relativ mulțumitor, în unități economice zonale şi naționale. Astfel, la nivelul anului 2015, prin activitățile derulate prin Centrul de Informare, Consiliere şi Orientare a Carierei, prin orga-nizarea evenimentului Zilele Carierei, participarea la evenimente de tip Târguri de carieră, prin implementarea proiectului Podiumul Compa-niilor (proiect realizat cu participarea a 21 de companii naționale sau multinaționale), cu prezența permanentă a angajatorilor din zonă, prin organizarea conferinței Absolvenții în Fața Companiilor - AFCo, cu un număr sporit de participanți-companii şi absolvenți, prin reuniunea bianuală a „Consiliului partenerilor economici şi culturali”, organizată cu scopul evaluării relației mediului economic şi cultural cu Universitatea, dar şi prin dezvoltarea proiectelor de diplomă şi disertație în colaborare cu mediul economic, peste 80% din absolvenții studiilor de licență şi de master, în inginerie, s-au integrat cu succes în unități economice.O parte dintre cadrele didactice universitare susțin că una dintre dificultățile importante întâmpinate în formarea unor foarte buni ingineri o constituie nivelul mediocru de pregătire al absolvenților de liceu. Cum considerați ca ar putea fi ridicat nivelul învățământului liceal, mai ales din liceele cu profil tehnologic (tehnic), cele care la un moment dat furnizau un număr important de candidați la examenele de admitere în universitățile politehnice?Calitatea absolvenților cu examen de bacalaureat care acced spre programe de studiu ale Universității Transilvania din Braşov poate influența nivelul profesional al absolvenților Universității noastre. Prin creşterea atractivității programelor de studii în inginerie (în special datorită ofer-telor de locuri de muncă în domeniu) şi implicit creşterea concurenței pentru admiterea la aceste programe, pot fi selectați candidați cu pregătire preuniversitară mai bună. O altă cale utilizată în Universitatea noastră este aceea de organizare de cursuri gratuite de pregătire pentru bacalaureat,
6
Ingineria automobilului Nr. 40 / septembrie 2016
la matematică şi limba română, la care pot participa toți elevii de liceu interesați, iar ulterior, în primul an de facultate, la materiile de cultură generală (matematică, fizică) la care candidații admişi prezintă deficiențe. Cum apreciați rolul cercetării științifice universitare în domeniul ingin-eriei, integrarea acesteia în ansamblul cercetării științifice naționale?Cercetarea ştiințifică ocupă un loc principal în strategia de dezvoltare a Universității Transilvania din Braşov, fiind unul dintre pilonii majori de creştere şi dezvoltare instituțională pentru orizontul 2014-2020. Ne propunem ca prin programe integrate de dezvoltare a resursei umane să valorificăm şi să onorăm tradiția şcolii braşovene în domenii de cercetare consacrate, dar şi să susținem pătrunderea în câmpuri de cercetare emer-gente, cu un potențial ridicat de inovare. Principalele noastre atuuri sunt date de infrastructura de cercetare modernă, potențialul resursei umane şi spectrul variat al domeniilor de cercetare. Prin utilizarea inteligentă a acestor vectori urmărim consolidarea domeniilor de cercetare interdisci-plinare şi poziționarea proactivă în raport cu dinamica mediului economic şi industrial. Considerăm astfel, că, prin acțiunile şi direcțiile de creştere, Universitatea Transilvania din Braşov acționează ca un partener strategic pentru agenții economici şi ca pol de excelență în colaborarea academică națională şi internațională.O legătură strânsă de colaborare între industrie și universități permite exploatarea eficientă a resurselor și competențelor disponibile în aceste instituții. Cum apreciați relațiile de cooperare dintre Universitatea Transilvania din Brașov și mediul economic, social și cultural din România? Cum considerați că poate fi intensificată această cooperare?Tradiția economică şi culturală a Braşovului, dar şi dezvoltarea recentă a zonei în domeniul industrial (aproape 50% din PIB-ul județului Braşov), turistic (cel mai important județ turistic din Regiunea Centru), sportiv (județul din țară cu cea mai modernă infrastructură pentru sporturile de iarnă), medical (oraşul cu cele mai mari investiții în sectorul medical privat, după Bucureşti), alături de investițiile recente în viața socio-cultu-rală a oraşului, reprezintă un complex de factori favorabil pentru dezvol-tarea şi aprofundarea legăturilor Universității Transilvania din Braşov cu mediul economic, cultural şi social, zonal şi național.Dezvoltarea relației cu mediul economic şi socio cultural a fost o prio-ritate majoră a managementului Universității din ultimii ani. Astfel, a fost constituit şi operaționalizat „Consiliul partenerilor economici şi cultu-rali” ai Universității Transilvania din Braşov, a fost amenajată o zonă de interacțiune directă între reprezentanții principalelor companii din zonă şi studenții universității (,,Podiumul companiilor”), iar universitatea s-a implicat în peste 200 de parteneriate cu autoritățile locale, regionale sau naționale şi cu companii sau instituții din mediul economic şi socio-cultural. De asemenea, acordarea de asistență tehnică şi servicii de cerce-tare sau efectuarea de studii pentru mediul privat şi pentru autorități sau instituții publice au reprezentat o constantă a ultimilor ani.Pornind de la necesitatea dezvoltării vieții culturale a Braşovului, Univer-sitatea a inițiat acțiuni şi programe prin care să devină un pol cultural al oraşului, cum ar fi „Stagiunea de Concerte a Universității Transilvania”, începând cu anul universitar 2014-2015, sau deschiderea, la 1 octombrie 2015, a Centrului Multicultural al Universității Transilvania şi a continuat tradiția evenimentelor literare şi muzicale organizate cu precădere de cele două facultăți de profil.În general, firmele consideră insuficientă pregătirea practică a studenților acumulată pe durata studiilor. Ținând cont ca SIAR reunește, în prezent, mai ales cadre didactice universitare din domeniul ingineriei autovehiculelor, am dori să știm care este aprecierea dumneavoastră generală privind pregătirea absolvenților universităților din România; de asemenea, cum este implicată Universitatea Transilvania din Brașov în dezvoltarea de proiecte destinate dobândirii abilităților practice de către studenți?Problema pregătirii practice a absolvenților programelor de studii din
domeniul ştiințelor inginereşti este cunoscută, iar rezolvarea ei este de competența Agenției Române de Asigurare a Calității în Învățământul Superior. Atât timp cât perioada de practică este redusă la circa doua săptămâni pe an pe parcursul ciclului de licență, pregătirea practică a absolvenților va avea de suferit. Cu toate acestea, un important pas înainte în sensul adecvării pregătirii practice a studenților la cerințele impuse de dinamica mediului economic național şi european îl constituie dezvoltarea proiectului, finanțat din fonduri structurale, ”Parteneriat trans-național universități-întreprinderi pentru practica studenților”. Obiectivele proiec-tului au fost reprezentate de creşterea relevanței stagiilor de practică prin promovarea unor rețele de colaborare între universități şi întreprinderi din Uniunea Europeană, de valorificare a oportunităților de formare în cadrul acestor rețele prin stagii de practică de calitate, în sprijinul tranziției de la şcoală la viața activă. Pe termen mediu şi lung proiectul va contribui la promovarea unei culturi naționale privind organizarea şi evaluarea practicii studențeşti, inclusiv în domeniul ingineresc, oferind un model de rețea națională integrată în rețelele similare la nivel european, ca referință la nivel național pentru organizarea practicii studențeşti în colaborare cu întreprinderi din țară şi străinătate. Obiectivele specifice au fost reprezen-tate de: stabilirea de parteneriate cu întreprinderi din țară şi străinătate în vederea organizării de stagii de practică în conformitate cu curriculum-ul aprobat pentru specializări tehnice şi umaniste; elaborarea de materiale suport pentru a facilita efectuarea de stagii de practică de calitate, cu credite transferabile, cu trasabilitate ce va facilita recunoaşterea acesteia ca etapă de studiu la nivel european; organizarea de stagii de practică (450 studenți) în întreprinderi din Uniunea Europeană. Scopurile finale ale proiectului au fost reprezentate de preluarea celor mai bune practici identificate pe parcurs, în cadrul colaborării pe durata proiectului, de exploatare a experienței fiecărui partener şi de rafinarea cadrului organizatoric în care se desfăşoară activitatea de practică a studenților.Domnule Rector, în perioada 26 – 29 octombrie 2016 Universi-tatea Transilvania din Brașov găzduiește a 12-a ediție a Congresul Internațional de Inginerie a Autovehiculelor și Transporturilor - CONAT 2016, organizat de SIAR – Societatea Inginerilor de Auto-mobile din România și de Universitatea Transilvania din Brașov prin Departamentul Autovehicule și Transporturi, în parteneriat cu SAE (Society of Automotive Engineers - USA) sub patronajul FISITA (Fédération Internationale des Sociétés d’Ingénieurs des Techniqués de l’ Automobile). Vă rugăm să expuneți câteva aprecieri asupra acestui moment special în comunitatea academică, științifică și industrială, de specialitate, din România.Domeniul „Ingineria Autovehiculelor” este reprezentativ pentru Univer-sitatea noastră, fapt recunoscut şi în rapoartele evaluărilor internaționale care au avut ca obiect Universitatea Transilvania din Braşov. Catedra de Autovehicule (Automobile şi Tractoare, Autovehicule şi Motoare, Auto-vehicule şi Transporturi – în denumiri succesive) este cea mai veche din țară, la fel ca specializarea ”Autovehicule Rutiere”.A XII-a ediție a Congresului CONAT se circumscrie în aceeaşi îndelun-gată tradiție, prima ediție CONAT fiind consemnată în anul 1965.Congresul CONAT 2016 se va bucura de o valoroasă participare din țară şi străinătate însemnând în acelaşi timp şi un eveniment ştiințific internațional pentru studenții din domeniile „Ingineriei Autovehiculelor” şi „Ingineriei Transporturilor”.Sunt sigur că Universitatea Transilvania din Braşov va fi în acest an o gazdă primitoare pentru participanții la CONAT 2016, iar a 12-a ediție a Congresul Internațional de Inginerie a Autovehiculelor şi Transporturilor va rămâne un eveniment ştiințific de referință în cronologia manifestărilor ştiințifice din domeniu.Vă mulțumim și vă urăm mult succes în dificila, dar nobila dumnea-voastră misiune!
7
Ingineria automobilului Nr. 40 / septembrie 2016
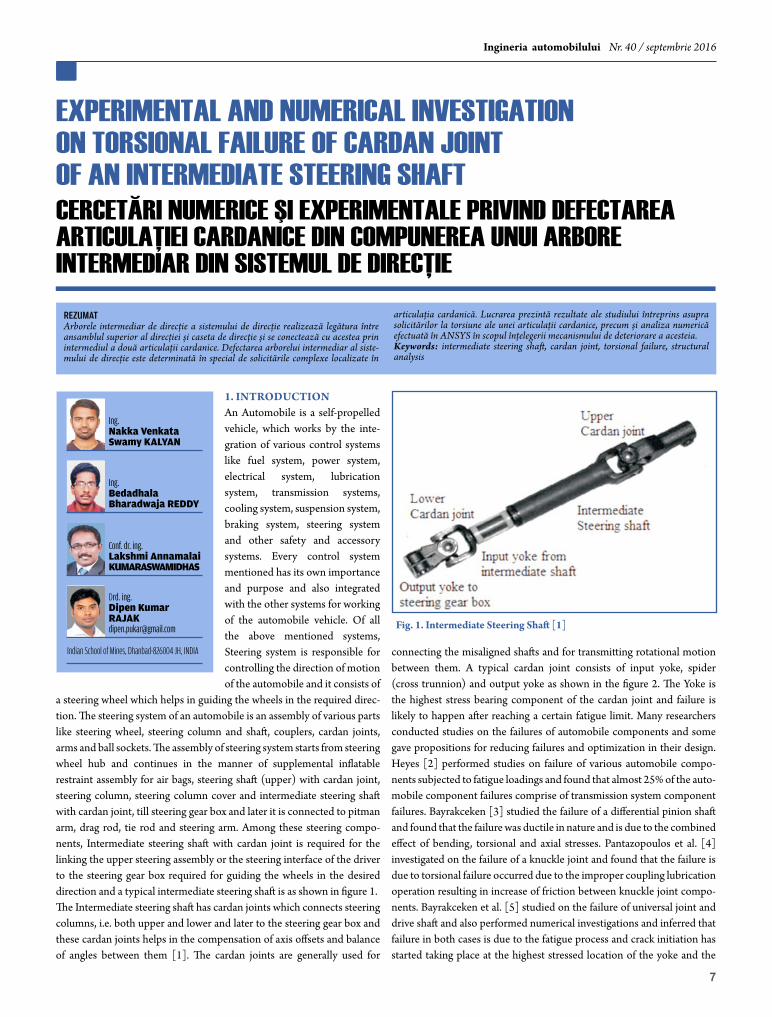
1. intRoDuCtionAn Automobile is a self-propelled vehicle, which works by the inte-gration of various control systems like fuel system, power system, electrical system, lubrication system, transmission systems, cooling system, suspension system, braking system, steering system and other safety and accessory systems. Every control system mentioned has its own importance and purpose and also integrated with the other systems for working of the automobile vehicle. Of all the above mentioned systems, Steering system is responsible for controlling the direction of motion of the automobile and it consists of
a steering wheel which helps in guiding the wheels in the required direc-tion. The steering system of an automobile is an assembly of various parts like steering wheel, steering column and shaft, couplers, cardan joints, arms and ball sockets. The assembly of steering system starts from steering wheel hub and continues in the manner of supplemental inflatable restraint assembly for air bags, steering shaft (upper) with cardan joint, steering column, steering column cover and intermediate steering shaft with cardan joint, till steering gear box and later it is connected to pitman arm, drag rod, tie rod and steering arm. Among these steering compo-nents, Intermediate steering shaft with cardan joint is required for the linking the upper steering assembly or the steering interface of the driver to the steering gear box required for guiding the wheels in the desired direction and a typical intermediate steering shaft is as shown in figure 1.The Intermediate steering shaft has cardan joints which connects steering columns, i.e. both upper and lower and later to the steering gear box and these cardan joints helps in the compensation of axis offsets and balance of angles between them [1]. The cardan joints are generally used for
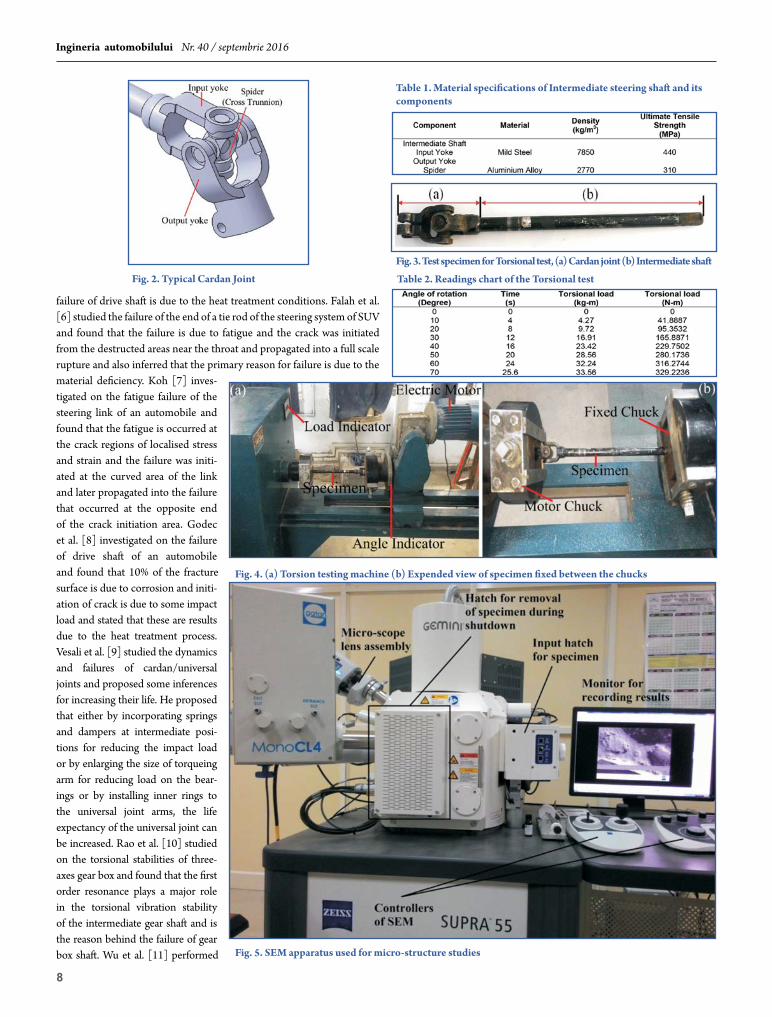
connecting the misaligned shafts and for transmitting rotational motion between them. A typical cardan joint consists of input yoke, spider (cross trunnion) and output yoke as shown in the figure 2. The Yoke is the highest stress bearing component of the cardan joint and failure is likely to happen after reaching a certain fatigue limit. Many researchers conducted studies on the failures of automobile components and some gave propositions for reducing failures and optimization in their design. Heyes [2] performed studies on failure of various automobile compo-nents subjected to fatigue loadings and found that almost 25% of the auto-mobile component failures comprise of transmission system component failures. Bayrakceken [3] studied the failure of a differential pinion shaft and found that the failure was ductile in nature and is due to the combined effect of bending, torsional and axial stresses. Pantazopoulos et al. [4] investigated on the failure of a knuckle joint and found that the failure is due to torsional failure occurred due to the improper coupling lubrication operation resulting in increase of friction between knuckle joint compo-nents. Bayrakceken et al. [5] studied on the failure of universal joint and drive shaft and also performed numerical investigations and inferred that failure in both cases is due to the fatigue process and crack initiation has started taking place at the highest stressed location of the yoke and the
EXPERIMENTAL AND NUMERICAL INVESTIGATION ON TORSIONAL FAILURE OF CARDAN JOINT OF AN INTERMEDIATE STEERING SHAFTCERCETĂRI NUMERICE şI EXPERIMENTALE PRIVIND DEFECTAREA ARTICULAŢIEI CARDANICE DIN COMPUNEREA UNUI ARBORE INTERMEDIAR DIN SISTEMUL DE DIRECŢIErezumatArborele intermediar de direcție a sistemului de direcție realizează legătura între ansamblul superior al direcției şi caseta de direcție şi se conectează cu acestea prin intermediul a două articulații cardanice. Defectarea arborelui intermediar al siste-mului de direcție este determinată în special de solicitările complexe localizate în
articulația cardanică. Lucrarea prezintă rezultate ale studiului întreprins asupra solicitărilor la torsiune ale unei articulații cardanice, precum şi analiza numerică efectuată în ANSYS în scopul înțelegerii mecanismului de deteriorare a acesteia.Keywords: intermediate steering shaft, cardan joint, torsional failure, structural analysis
Fig. 1. intermediate steering shaft [1]
Indian School of Mines, Dhanbad-826004 JH, INDIA
Ing.Bedadhala Bharadwaja REDDY
Drd. ing. Dipen Kumar [email protected]
Ing. Nakka Venkata Swamy KALYAN
Conf. dr. ing. Lakshmi Annamalai KUMARASWAMIDHAS
8
Ingineria automobilului Nr. 40 / septembrie 2016
failure of drive shaft is due to the heat treatment conditions. Falah et al. [6] studied the failure of the end of a tie rod of the steering system of SUV and found that the failure is due to fatigue and the crack was initiated from the destructed areas near the throat and propagated into a full scale rupture and also inferred that the primary reason for failure is due to the material deficiency. Koh [7] inves-tigated on the fatigue failure of the steering link of an automobile and found that the fatigue is occurred at the crack regions of localised stress and strain and the failure was initi-ated at the curved area of the link and later propagated into the failure that occurred at the opposite end of the crack initiation area. Godec et al. [8] investigated on the failure of drive shaft of an automobile and found that 10% of the fracture surface is due to corrosion and initi-ation of crack is due to some impact load and stated that these are results due to the heat treatment process. Vesali et al. [9] studied the dynamics and failures of cardan/universal joints and proposed some inferences for increasing their life. He proposed that either by incorporating springs and dampers at intermediate posi-tions for reducing the impact load or by enlarging the size of torqueing arm for reducing load on the bear-ings or by installing inner rings to the universal joint arms, the life expectancy of the universal joint can be increased. Rao et al. [10] studied on the torsional stabilities of three-axes gear box and found that the first order resonance plays a major role in the torsional vibration stability of the intermediate gear shaft and is the reason behind the failure of gear box shaft. Wu et al. [11] performed
Fig. 2. typical Cardan Joint
Fig. 3. test specimen for torsional test, (a) Cardan joint (b) intermediate shaft
table 1. material specifications of intermediate steering shaft and its components
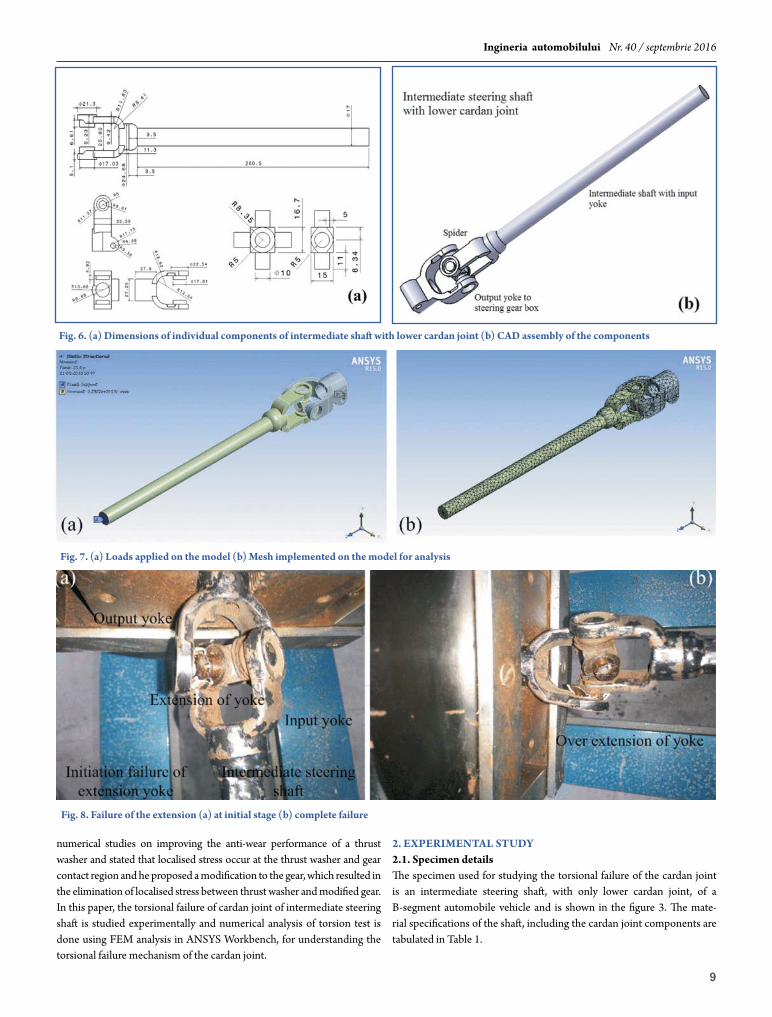
Fig. 4. (a) torsion testing machine (b) expended view of specimen fixed between the chucks
Fig. 5. sem apparatus used for micro‑structure studies
table 2. Readings chart of the torsional test
9
Ingineria automobilului Nr. 40 / septembrie 2016
numerical studies on improving the anti-wear performance of a thrust washer and stated that localised stress occur at the thrust washer and gear contact region and he proposed a modification to the gear, which resulted in the elimination of localised stress between thrust washer and modified gear.In this paper, the torsional failure of cardan joint of intermediate steering shaft is studied experimentally and numerical analysis of torsion test is done using FEM analysis in ANSYS Workbench, for understanding the torsional failure mechanism of the cardan joint.
2. eXPeRimentAl stuDY2.1. specimen detailsThe specimen used for studying the torsional failure of the cardan joint is an intermediate steering shaft, with only lower cardan joint, of a B-segment automobile vehicle and is shown in the figure 3. The mate-rial specifications of the shaft, including the cardan joint components are tabulated in Table 1.
Fig. 6. (a) Dimensions of individual components of intermediate shaft with lower cardan joint (b) CAD assembly of the components
Fig. 7. (a) loads applied on the model (b) mesh implemented on the model for analysis
Fig. 8. Failure of the extension (a) at initial stage (b) complete failure
10
Ingineria automobilului Nr. 40 / septembrie 2016
2.2. torsion test setupThe specimen, i.e. intermediate steering shaft of the B-segment automo-bile vehicle, is subjected to torsion test using the Torsion testing machine at ISM laboratory, shown in figure 4 (a). The specimen is fitted in the machine, between the two screw tightening chucks of the machine, as shown in the figure 4 (b). One of these chucks is a fixed chuck and other is rotated by means of an electric motor, for applying torsional load, i.e. moment. The torsional load is applied by gradual increment at one end of the specimen, till the cardan joint is completely failed. The readings for every 100 angle rotation of the motor chuck, which takes 4 sec time, were taken and tabulated in Table 2. These readings were later used for deter-mining the stress-strain characteristics and strain energy absorption of the specimen in ANSYS R15 Workbench software at ISM CAD laboratory.2.3. micro‑structure characteristicsThe test specimen after completion of the torsion test is further investi-gated for studying the micro-structure of the failed extension of the yoke of cardan joint. The micro-structure of the failed region of extension of the yoke of cardan joint is studied under the Scanning Electron Micro-scope (SEM, Model: ZEISS, SPURA 55, Germany), as shown in figure 5, at ISM laboratory.3. numeRiCAl stuDY3.1. CAD modelThe CAD model required for numerical investigation is prepared from the dimensions of the test specimen using CATIA V5R19. The dimensions
of the intermediate shaft with input yoke, spider and output yoke to steering gear box are shown in figure 6 (a). These parts are created in Part module of CATIA V5R19 and later these individual parts are assembled in Assembly module with constraints required for the fixation of the cardan joint as shown in figure 6 (b). The assembly of intermediate shaft and other cardan joint components are later imported into ANSYS R15 Workbench for numerical investigation.3.2. simulation of torsion testThe CAD assembly of the intermediate steering shaft is imported into ANSYS R15 Workbench software for simulating the torsion test, by applying the torsion load and boundary conditions. The analysis of the torsion test is performed in Static Structural module of ANSYS R15 Workbench [12]. The torsion load or moment is applied to the output yoke, same as experiment, with exact numerical data that is taken during the torsion experiment, i.e. readings of Table 1. The element used for the meshing of the model is higher order tetrahedron (3D element) and the mesh size of the model is program controlled and fine mesh size is selected for getting accurate results. Figure 7 (a) and (b) shows the loads and boundary conditions applied on the model and meshed view of the model implemented for the analysis.4. Results AnD DisCussion4.1. torsion test resultsThe failure of the cardan joint of intermediate steering shaft, due to torsional load, is found to be initiated at a load of 32.24 kg-m (316.2744
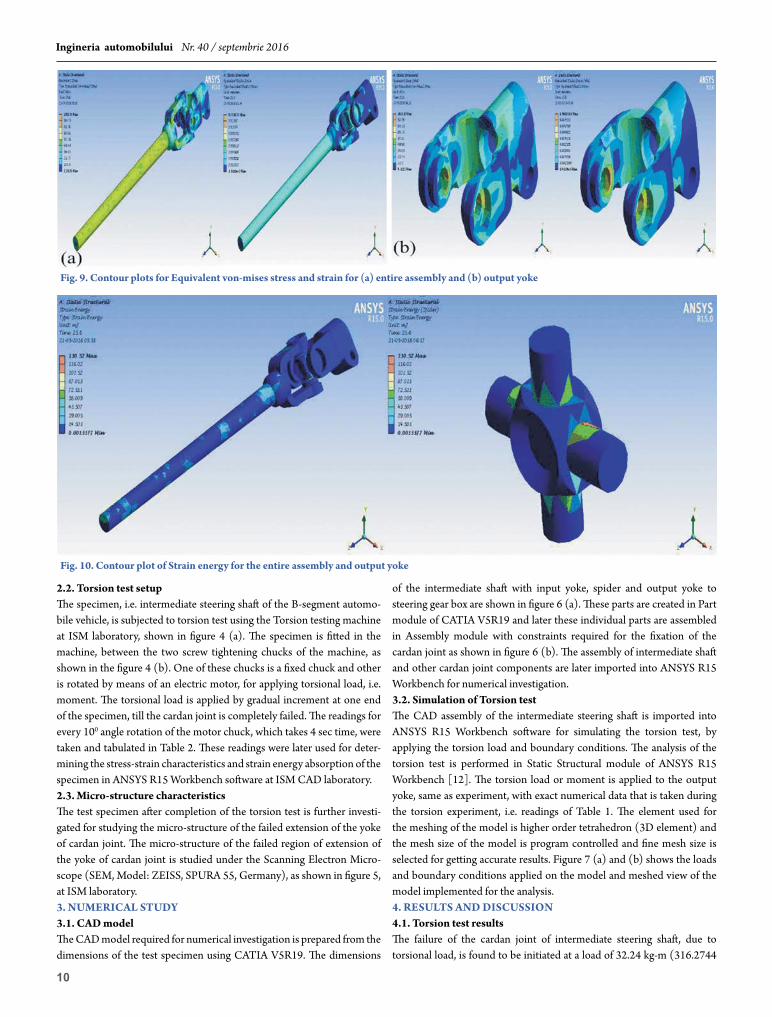
Fig. 9. Contour plots for equivalent von‑mises stress and strain for (a) entire assembly and (b) output yoke
Fig. 10. Contour plot of strain energy for the entire assembly and output yoke
11
Ingineria automobilului Nr. 40 / septembrie 2016
N-m), after rotating an angle of 600 in 24 seconds and a complete failure is observed at a load of 33.56 kg-m (329.2236 N-m) at angle of 700. It is observed that the failure of the cardan joint is taken place at the extension of the yoke, which gives support to the spider. The crack initiation was observed at the open end of the extension, as shown in figure 8 (a) and it gradually propagated into complete failure of the extension of the yoke, after further application of load. The complete failure of the extension of yoke is like petals of a flower and is as shown in figure 8 (b).4.2. simulation resultsThe analysis in the ANSYS Workbench is carried out for equivalent von-mises stress and strain and strain energy characteristics of the assembly of intermediate steering shaft with lower cardan joint. The contours of
the equivalent von-mises stress and strain, obtained from the results, inferred that the maximum equivalent von-mises stress was 1028.8 MPa at a strain of 0.013031 mm/mm, for the entire assembly and found that this maximum equivalent von-mises stress and strain are at output yoke of the cardan joint and is as shown in the figure 9. The strain energy char-acteristics of the assembly and spider are as shown in the figure 10. And the maximum strain energy absorption is observed in the spider of the cardan joint. Hence, from these inferences, further numerical investiga-tion is performed on spider for strain energy characteristics and on the output yoke for stress-strain characteristics.The results of the analysis of the spider of the cardan joint shows that the maximum strain energy was absorbed by it rather than the input or output
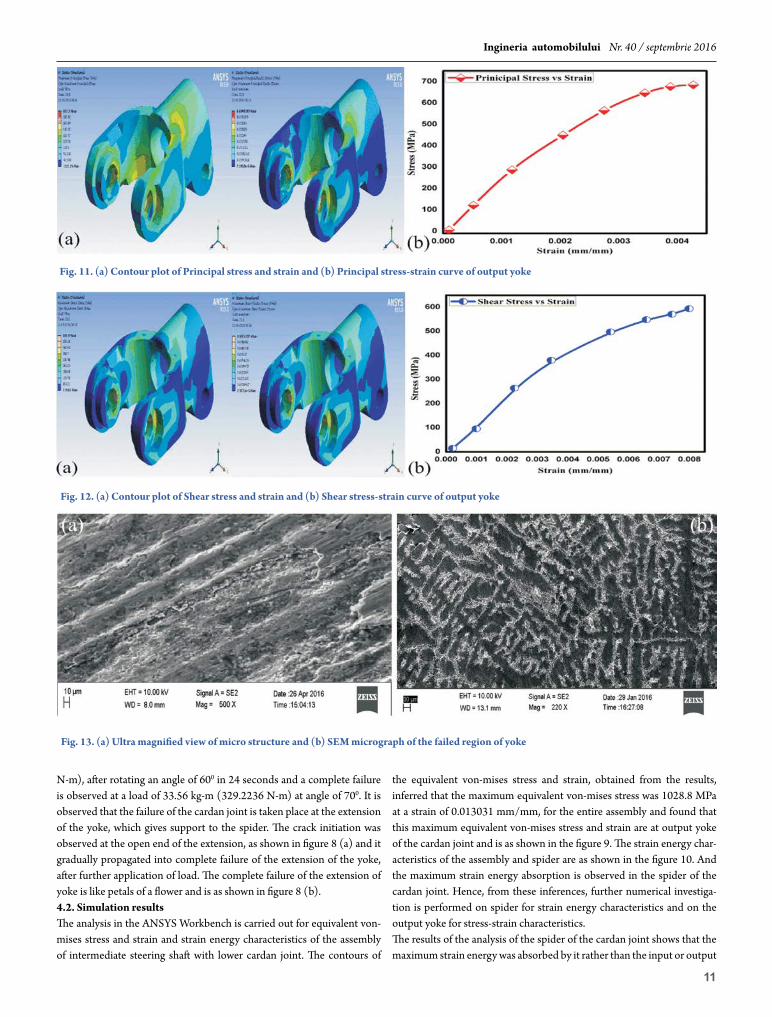
Fig. 11. (a) Contour plot of Principal stress and strain and (b) Principal stress‑strain curve of output yoke
Fig. 12. (a) Contour plot of shear stress and strain and (b) shear stress‑strain curve of output yoke
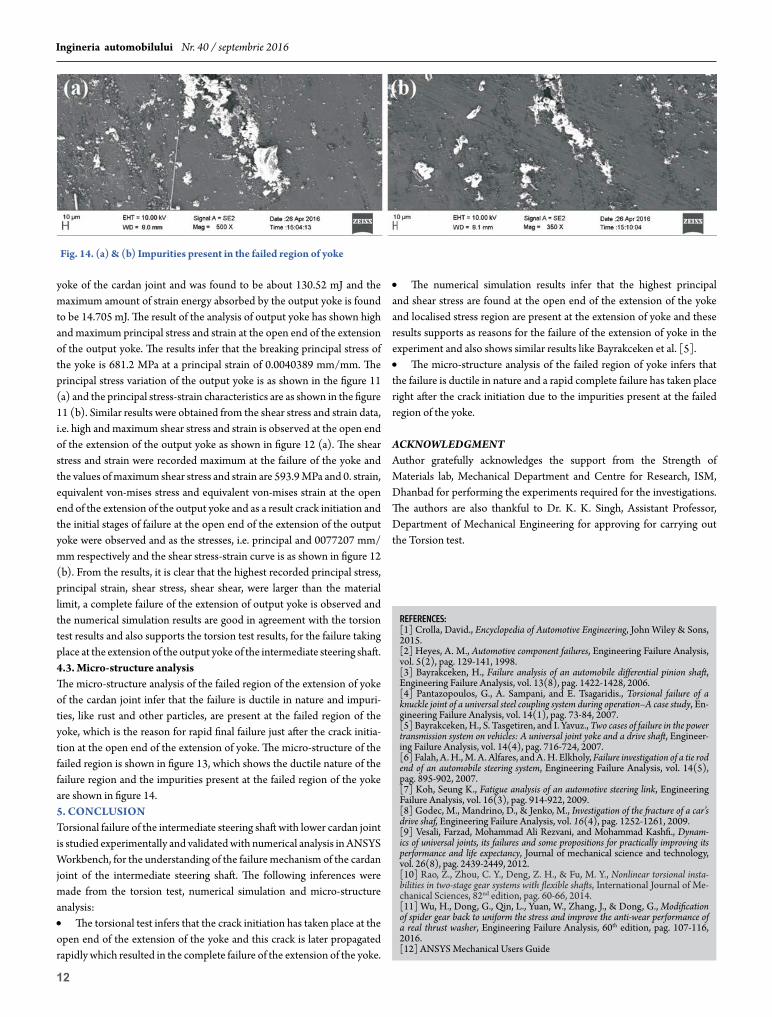
Fig. 13. (a) ultra magnified view of micro structure and (b) sem micrograph of the failed region of yoke
12
Ingineria automobilului Nr. 40 / septembrie 2016
yoke of the cardan joint and was found to be about 130.52 mJ and the maximum amount of strain energy absorbed by the output yoke is found to be 14.705 mJ. The result of the analysis of output yoke has shown high and maximum principal stress and strain at the open end of the extension of the output yoke. The results infer that the breaking principal stress of the yoke is 681.2 MPa at a principal strain of 0.0040389 mm/mm. The principal stress variation of the output yoke is as shown in the figure 11 (a) and the principal stress-strain characteristics are as shown in the figure 11 (b). Similar results were obtained from the shear stress and strain data, i.e. high and maximum shear stress and strain is observed at the open end of the extension of the output yoke as shown in figure 12 (a). The shear stress and strain were recorded maximum at the failure of the yoke and the values of maximum shear stress and strain are 593.9 MPa and 0. strain, equivalent von-mises stress and equivalent von-mises strain at the open end of the extension of the output yoke and as a result crack initiation and the initial stages of failure at the open end of the extension of the output yoke were observed and as the stresses, i.e. principal and 0077207 mm/mm respectively and the shear stress-strain curve is as shown in figure 12 (b). From the results, it is clear that the highest recorded principal stress, principal strain, shear stress, shear shear, were larger than the material limit, a complete failure of the extension of output yoke is observed and the numerical simulation results are good in agreement with the torsion test results and also supports the torsion test results, for the failure taking place at the extension of the output yoke of the intermediate steering shaft. 4.3. micro‑structure analysisThe micro-structure analysis of the failed region of the extension of yoke of the cardan joint infer that the failure is ductile in nature and impuri-ties, like rust and other particles, are present at the failed region of the yoke, which is the reason for rapid final failure just after the crack initia-tion at the open end of the extension of yoke. The micro-structure of the failed region is shown in figure 13, which shows the ductile nature of the failure region and the impurities present at the failed region of the yoke are shown in figure 14.5. ConClusionTorsional failure of the intermediate steering shaft with lower cardan joint is studied experimentally and validated with numerical analysis in ANSYS Workbench, for the understanding of the failure mechanism of the cardan joint of the intermediate steering shaft. The following inferences were made from the torsion test, numerical simulation and micro-structure analysis:• The torsional test infers that the crack initiation has taken place at the open end of the extension of the yoke and this crack is later propagated rapidly which resulted in the complete failure of the extension of the yoke.
• The numerical simulation results infer that the highest principal and shear stress are found at the open end of the extension of the yoke and localised stress region are present at the extension of yoke and these results supports as reasons for the failure of the extension of yoke in the experiment and also shows similar results like Bayrakceken et al. [5].• The micro-structure analysis of the failed region of yoke infers that the failure is ductile in nature and a rapid complete failure has taken place right after the crack initiation due to the impurities present at the failed region of the yoke.
ACKNOWLEDGMENT Author gratefully acknowledges the support from the Strength of Materials lab, Mechanical Department and Centre for Research, ISM, Dhanbad for performing the experiments required for the investigations. The authors are also thankful to Dr. K. K. Singh, Assistant Professor, Department of Mechanical Engineering for approving for carrying out the Torsion test.
Fig. 14. (a) & (b) impurities present in the failed region of yoke
references:[1] Crolla, David., Encyclopedia of Automotive Engineering, John Wiley & Sons, 2015. [2] Heyes, A. M., Automotive component failures, Engineering Failure Analysis, vol. 5(2), pag. 129-141, 1998.[3] Bayrakceken, H., Failure analysis of an automobile differential pinion shaft, Engineering Failure Analysis, vol. 13(8), pag. 1422-1428, 2006.[4] Pantazopoulos, G., A. Sampani, and E. Tsagaridis., Torsional failure of a knuckle joint of a universal steel coupling system during operation–A case study, En-gineering Failure Analysis, vol. 14(1), pag. 73-84, 2007.[5] Bayrakceken, H., S. Tasgetiren, and I. Yavuz., Two cases of failure in the power transmission system on vehicles: A universal joint yoke and a drive shaft, Engineer-ing Failure Analysis, vol. 14(4), pag. 716-724, 2007.[6] Falah, A. H., M. A. Alfares, and A. H. Elkholy, Failure investigation of a tie rod end of an automobile steering system, Engineering Failure Analysis, vol. 14(5), pag. 895-902, 2007.[7] Koh, Seung K., Fatigue analysis of an automotive steering link, Engineering Failure Analysis, vol. 16(3), pag. 914-922, 2009.[8] Godec, M., Mandrino, D., & Jenko, M., Investigation of the fracture of a car’s drive shaf, Engineering Failure Analysis, vol. 16(4), pag. 1252-1261, 2009.[9] Vesali, Farzad, Mohammad Ali Rezvani, and Mohammad Kashfi., Dynam-ics of universal joints, its failures and some propositions for practically improving its performance and life expectancy, Journal of mechanical science and technology, vol. 26(8), pag. 2439-2449, 2012.[10] Rao, Z., Zhou, C. Y., Deng, Z. H., & Fu, M. Y., Nonlinear torsional insta-bilities in two-stage gear systems with flexible shafts, International Journal of Me-chanical Sciences, 82nd edition, pag. 60-66, 2014.[11] Wu, H., Dong, G., Qin, L., Yuan, W., Zhang, J., & Dong, G., Modification of spider gear back to uniform the stress and improve the anti-wear performance of a real thrust washer, Engineering Failure Analysis, 60th edition, pag. 107-116, 2016.[12] ANSYS Mechanical Users Guide
13
Ingineria automobilului Nr. 40 / septembrie 2016
1. intRoDuCtionLiquefied petroleum gas is a fuel which generally consists of a mixture of 2 hydrocarbons, propane and butane, in different ratios. Because of its good burning properties and because of the price liquefied petroleum gas is a very good alternative fuel for the compression ignition engine. The LPG properties, comparative with the diesel fuel properties are presented in the table 1.Density – because of a lower density of liquid LPG, the mass of the same volume of fuel is lower, 503 kg/m³ for LPG and 800-840 kg/m³ for diesel fuel [1], leading to a lower autonomy for the vehicle fuelled with LPG.The vaporization heat– LPG needs a lower quantity of heat to vaporize than diesel fuel 420 kJ/kg to 465
kJ/kg for diesel fuel [1], allowing to vaporize faster and to consume less local heat in the case of direct injection in the combustion chamber. The LPG self ignition temperature is higher than the diesel fuel self igni-tion temperature, 481 ºC – propane, 544 ºC – butane, 355ºC diesel fuel [1], which emphasizes the worsening of self ignition properties. Therefore fuelling a diesel engine with LPG requires the use of specific methods.The flame temperature of LPG lower than the diesel fuel flame tempera-ture leads to an important reduction in nitrogen oxides emissions.The LPG lower heating value higher than diesel fuel lower heating value ensures an increase in the amount of heat released during the combustion of fuel for the same fuel quantity.The extremely low cetane number of LPG underlines its very low self ignition properties. Therefore to fuel a diesel engine with LPG involves
specific methods. In this paper the authors chose to fuel the engine by Diesel-Gas method, which consists of gaseous LPG injection in the intake manifold of the engine.Results of a compression ignition engine fuelled with LPG are presented by (Qi et. al. 2007) in the work [2]. The authors experimented direct injection of a LPG-diesel fuel mixture (with the help of a nitrogen tank) with different proportions: 0, 10, 20, 30, 40 %, leading to a decrease in the pollutant emissions of the engine. In the work [3] (Vijayabalan et. al. 2009) the authors decreased the level of the nitrogen oxides emission fuelling the diesel engine with LPG. Although the level of nitrogen oxides emission decreased, the level of unburned hydrocarbons increased. To reduce this emission the authors used a glow plug [3]. The same solution was found by [4], but in this case the engine was fuelled with methane. An increase of the level of unburned hydrocarbon emission was obtained also in [5, 6]. To reduce the level of the unburned hydrocarbons emission the authors used exhaust gas recirculation. In the work [7] by fuelling a four cylinders diesel engine with LPG an increase in the engine efficiency with 4% was obtained, when the engine functioned at full load. At partial loads the efficiency of the engine increased with increasing substitute ratio of the diesel fuel with LPG [7]. Also the smoke emission level was with 40-60% lower than in the case of the standard engine, fuelled with diesel fuel [7]. The reduction of the smoke emission level by fuelling a compression ignition engine with LPG is presented also in the work [8]. This paper presents experimental results of a truck compression ignition engine fuelled with LPG using Diesel-Gas method, which consists of
EXPERIMENTAL INVESTIGATIONS ASPECTS OF THE FUELLING A TRUCK DIESEL ENGINE WITH LPGASPECTE ALE INVESTIGAŢIILOR EXPERIMENTALE ASUPRA ALIMENTARII CU GPL A UNUI MOTOR DIESEL DE AUTOCAMIONrezumatObiectivul principal al cercetărilor efectuate şi prezentate în lucrare constă în redu-cerea emisiilor poluante ale unui autocamion echipat cu un motor cu aprindere prin compresie prin alimentarea cu gaz petrolier lichefiat (GPL) şi prin utilizarea unei cantități de gaze de eşapament recirculate, fără diminuarea performanțelor motorului. Un obiectiv specific a fost stabilirea unei corelații între ponderea înlocuirii motorinei cu GPL şi adaptările necesare pentru optimizarea regimurilor investigate cu scopul de a limita solicitarea motorului şi de a reduce consumul de combustibil şi nivelul emisiilor poluante. Bancul de încercări a fost adaptat pentru a permite alimentarea motorului cu gaz petrolier lichefiat. Motorul utilizat este un motor de autocamion u o capacitate de 10,34 dm3. Regimul de lucru investigat corespuns la 55% sarcină şi 1450 rpm, iar
rapoartele de substituție energetică ale combustibilului diesel cu GPL au fost situate între 0 şi 30%.Keywords: emission, EGR, oxides, smoke, pressure.Abreviations:LPG - liquefied petroleum gas;rpm - revolutions per minute;A/F - air to fuel ratio;CC - cetane number;xc - the substitute ratio;mLPG - the LPG dose;mdieselfuel - the diesel fuel dose;Hi - the caloric heating value.
Universitatea Politehnica din București, Spl. Independenței, Nr. 313, 60042 București, România
Prof. dr. ing. Constantin PANĂ
S.l. dr. ing. Alexandru CERNAT
Drd.ing. Ionel MIRICĂ
Asist. dr. ing. Nikolaos Cristian NUȚ[email protected]
Prof. dr. ing. Niculae NEGURESCU
table 1. lPg properties, comparative with diesel fuel [1]
14
Ingineria automobilului Nr. 40 / septembrie 2016
gaseous LPG injection in the intake manifold of the engine, the LPG-air homogeneous mixture being ignited by the diesel fuel spray prior injected in the combustion chamber of the engine.2. eXPeRimentAl stuDYThe experimental study was carried out on a ROMAN D2156MTN 8 truck compression ignition engine, with 6 cylinders in line displacement, fuelled with LPG using the Diesel-Gas method. The Diesel-Gas method consists in gaseous LPG injection in the intake manifold of the engine. Therefore the homogeneous mixture of air-LPG is ignited by the flame which appears in the diesel fuel jet. In the table 2 are presented the main engine specifications and performances.The test bed equipments consist of: Roman D 2156 MTN 8 diesel engine, Hoffman eddy current dyno, Kistler piezoelectric pressure transducer, AVL data acquisition system, , AVL Dicom 4000 gas analyzer and opaci-meter, Optimass masic fuel flow meter, Meriam volumes air flow meter, thermocouples and thermo-resistances to measure the temperature, gravimetric system for diesel fuel consumption measuring and gas leaks detector. The test bed diagram is presented in the figure 1. The measure-ments were carried out at 55% load regimen and 1450 rpm.3. tHe WoRKing PRoCeDuReFirst was determined the reference, fuelling the engine with diesel fuel, then the diesel fuel cyclic dose was decreased, and the LPG cyclic dose was increased. The engine power was maintained the same like in the case of fuelling with diesel fuel. The energetic substitute ratio has the mathematical relation presented in equation 1.
(1)
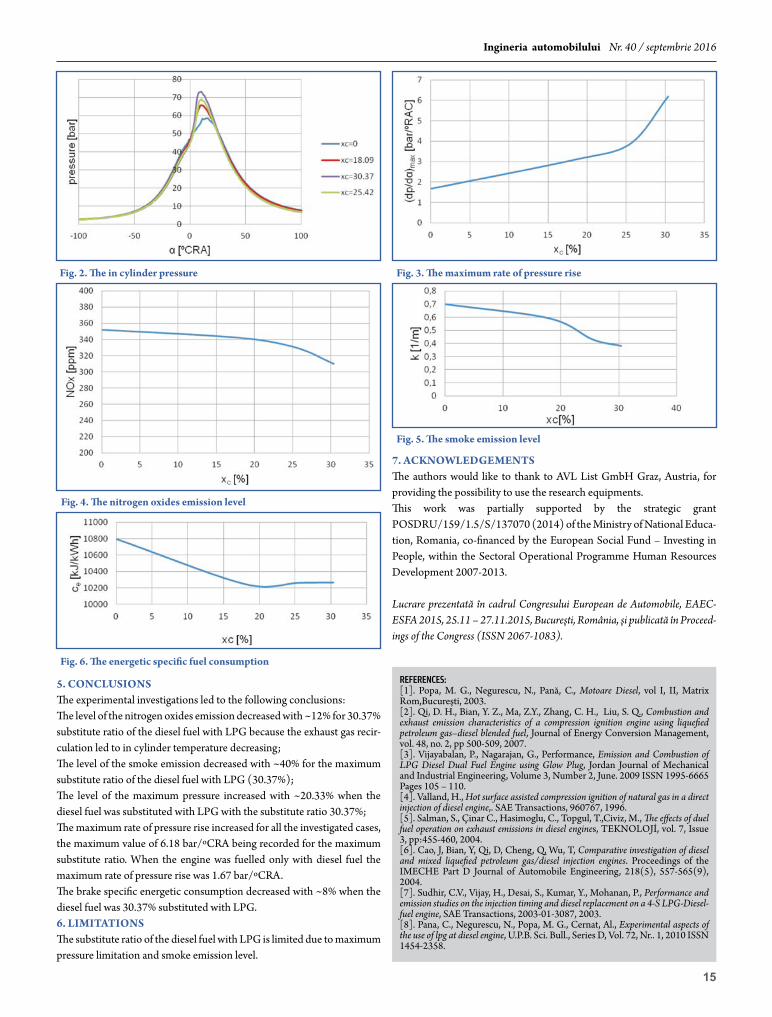
where: mLPG [kg]- the LPG dose;mdieselfuel [kg]-the diesel fuel dose;Hi [kJ/kg]- the caloric heating value.The investigated energetic substitute ratio of the diesel fuel with LPG was situated between [0-30.37] %.In order to reduce the nitrogen oxides emission exhaust gases recirculation was used. The exhaust gas recirculation quantity is defined as a percentage occupied by the gases in the total amount of intake air admitted in the engine. The exhaust gas recirculation quantity was 2.34% form the total amount of air consumed by the engine.4. Results4.1. in cylinder pressureThe pressure inside the cylinder increased for all the substitution ratios of diesel with LPG investigated. This can be explained by the intensifica-tion of the burning process due to the presence of LPG-air mixture in the
combustion chamber. The figure 2 shows the measured in cylinder pres-sure for the investigated cases.The maximum rate or pressure rise increased for all the investigated cases because of a higher flame speed in the homogeneous mixture or air-LPG. The figure 3 presents the maximum rate of pressure rise for the investigated cases.4.2 The nitrogen oxides emissionThe nitrogen oxides emission level decreased for the entire investigated substitute ratios of diesel fuel with LPG because the combustion temper-ature decreases when exhaust gas recirculation is used. The exhaust gas recirculation quantity was 2.34% form the total amount of air consumed by the engine. Figure 4 presents the nitrogen oxides emission level.4.3 The smoke emissionThe smoke emission level decreased for all the investigated substitute ratios because when LPG is present in the combustion chamber the burning rate of diffusive mixtures (controlled by the mixing process) decrease and the burning rate of preformed mixtures increase. The figure 5 presents the measured smoke emission level, evaluated by the coeffi-cient of absorption k.4.4 The fuel consumptionThe energetic specific fuel consumption decreased for the substitute ratios of diesel fuel with LPG. Figure 6 presents the energetic specific fuel consumption versus the substitute ratio.
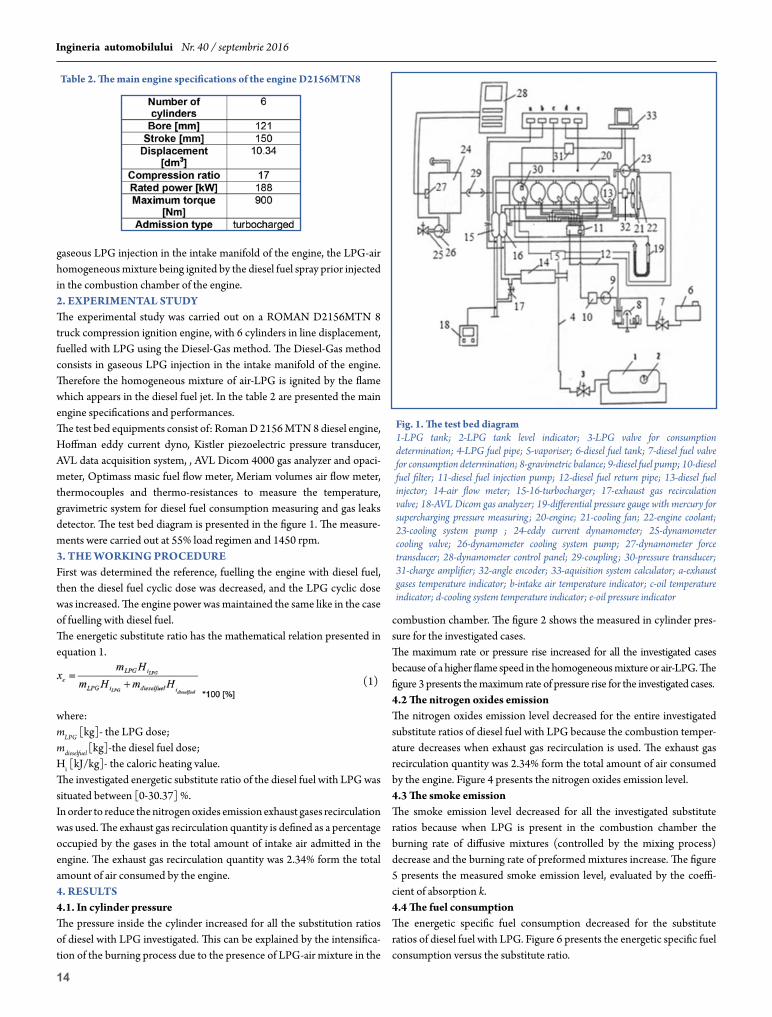
Fig. 1. The test bed diagram1-LPG tank; 2-LPG tank level indicator; 3-LPG valve for consumption determination; 4-LPG fuel pipe; 5-vaporiser; 6-diesel fuel tank; 7-diesel fuel valve for consumption determination; 8-gravimetric balance; 9-diesel fuel pump; 10-diesel fuel filter; 11-diesel fuel injection pump; 12-diesel fuel return pipe; 13-diesel fuel injector; 14-air flow meter; 15-16-turbocharger; 17-exhaust gas recirculation valve; 18-AVL Dicom gas analyzer; 19-differential pressure gauge with mercury for supercharging pressure measuring; 20-engine; 21-cooling fan; 22-engine coolant; 23-cooling system pump ; 24-eddy current dynamometer; 25-dynamometer cooling valve; 26-dynamometer cooling system pump; 27-dynamometer force transducer; 28-dynamometer control panel; 29-coupling; 30-pressure transducer; 31-charge amplifier; 32-angle encoder; 33-aquisition system calculator; a-exhaust gases temperature indicator; b-intake air temperature indicator; c-oil temperature indicator; d-cooling system temperature indicator; e-oil pressure indicator
table 2. The main engine specifications of the engine D2156mtn8
15
Ingineria automobilului Nr. 40 / septembrie 2016
5. ConClusionsThe experimental investigations led to the following conclusions:The level of the nitrogen oxides emission decreased with ~12% for 30.37% substitute ratio of the diesel fuel with LPG because the exhaust gas recir-culation led to in cylinder temperature decreasing; The level of the smoke emission decreased with ~40% for the maximum substitute ratio of the diesel fuel with LPG (30.37%);The level of the maximum pressure increased with ~20.33% when the diesel fuel was substituted with LPG with the substitute ratio 30.37%;The maximum rate of pressure rise increased for all the investigated cases, the maximum value of 6.18 bar/ºCRA being recorded for the maximum substitute ratio. When the engine was fuelled only with diesel fuel the maximum rate of pressure rise was 1.67 bar/ºCRA.The brake specific energetic consumption decreased with ~8% when the diesel fuel was 30.37% substituted with LPG.6. limitAtionsThe substitute ratio of the diesel fuel with LPG is limited due to maximum pressure limitation and smoke emission level.
7. ACKnoWleDgementsThe authors would like to thank to AVL List GmbH Graz, Austria, for providing the possibility to use the research equipments.This work was partially supported by the strategic grant POSDRU/159/1.5/S/137070 (2014) of the Ministry of National Educa-tion, Romania, co-financed by the European Social Fund – Investing in People, within the Sectoral Operational Programme Human Resources Development 2007-2013.
Lucrare prezentată în cadrul Congresului European de Automobile, EAEC-ESFA 2015, 25.11 – 27.11.2015, Bucureşti, România, şi publicată în Proceed-ings of the Congress (ISSN 2067-1083).
Fig. 2. The in cylinder pressure Fig. 3. The maximum rate of pressure rise
Fig. 4. The nitrogen oxides emission level
Fig. 5. The smoke emission level
Fig. 6. The energetic specific fuel consumption
references:[1]. Popa, M. G., Negurescu, N., Pană, C., Motoare Diesel, vol I, II, Matrix Rom,Bucureşti, 2003.[2]. Qi, D. H., Bian, Y. Z., Ma, Z.Y., Zhang, C. H., Liu, S. Q., Combustion and exhaust emission characteristics of a compression ignition engine using liquefied petroleum gas–diesel blended fuel, Journal of Energy Conversion Management, vol. 48, no. 2, pp 500-509, 2007.[3]. Vijayabalan, P., Nagarajan, G., Performance, Emission and Combustion of LPG Diesel Dual Fuel Engine using Glow Plug, Jordan Journal of Mechanical and Industrial Engineering, Volume 3, Number 2, June. 2009 ISSN 1995-6665 Pages 105 – 110.[4]. Valland, H., Hot surface assisted compression ignition of natural gas in a direct injection of diesel engine,. SAE Transactions, 960767, 1996.[5]. Salman, S., Çinar C., Hasimoglu, C., Topgul, T.,Civiz, M., The effects of duel fuel operation on exhaust emissions in diesel engines, TEKNOLOJİ, vol. 7, Issue 3, pp:455-460, 2004.[6]. Cao, J, Bian, Y, Qi, D, Cheng, Q, Wu, T, Comparative investigation of diesel and mixed liquefied petroleum gas/diesel injection engines. Proceedings of the IMECHE Part D Journal of Automobile Engineering, 218(5), 557-565(9), 2004.[7]. Sudhir, C.V., Vijay, H., Desai, S., Kumar, Y., Mohanan, P., Performance and emission studies on the injection timing and diesel replacement on a 4-S LPG-Diesel-fuel engine, SAE Transactions, 2003-01-3087, 2003.[8]. Pana, C., Negurescu, N., Popa, M. G., Cernat, Al., Experimental aspects of the use of lpg at diesel engine, U.P.B. Sci. Bull., Series D, Vol. 72, Nr.. 1, 2010 ISSN 1454-2358.
16
Ingineria automobilului Nr. 40 / septembrie 2016
1. geneRAl elements oF DiAgnosis in geARBoXSupervision of the operation of the car and its components in operation through specific process parameters of operation, vibrations, tempera-ture etc., is recognized as an impor-tant way to increase reliability, oper-ating efficiency, reduce the cost of production and operation. Purpose of use of installation or monitoring
systems is to verify the normality, to detect any deviations or to provide decision support information and interventions of disconnection or stop and for diagnostics. These decisions can be located on a character, vehicle or equipment [5]. On the other hand, the decision may follow immediately the information, it’s finding in the sense in which turning off major consequences immediate avoid; sometimes timely information let a decision to program a repair, replacement or allow without stopping operation.A definition of monitoring can be summed up thus: the information status of functioning in a given system, by means of adequate observa-tions of instruments and appliances for measuring, for surveillance and intervention for correction.By analogy with other areas, technical systems diagnosis is to identify operation faults and their causes, based on data obtained from checking, supervision or monitoring.The functions of the monitoring system can be:- protection or preventive (surveillance, interruption and alarm) with automatic stopping operation if the status so requires components;- analysis and diagnosis, determining the causes of changes of status and through it with the main selection predictive changes status, in their evolution, the prevention of defects, by establishing the most effective intervention solutions for eliminating the causes of failure.A suite of possible failures in the operation of motor vehicles within the scope of monitoring is indicated in Table 1, in conjunction with their evolution in time or the evolution of the entire system to malfunction and break. It is noteworthy that the methodological separation of gradual failures and sudden failures depends not only on time but also target data processing conditions for monitoring, surveillance human conditions of
the system etc. [1]. Thus, a sudden failure can occur in seconds, but in hours; a gradual failure in minutes, but in months. An exhaustive picture of the parameters for which we recommend moni-toring in gearboxes case is indicated in Table 2.2. AnAlYsis oF ACoustiC signAls AnD ViBRAtions. DeteRministiC AnD RAnDom signAlsDevelopments in time of the signal from the noise and vibration seen can be classified as deterministic or random.Deterministic signals can be expressed through explicit mathematical relationships and random signals should be expressed in terms of prob-ability and statistical averages.From a practical standpoint, deterministic signals produce a discrete line-arly frequency spectrum.When the spectral lines have a harmonic shape, meaning they are multi-ples of some fundamental frequencies, the signal is depicted as being deterministic. A typical example of a periodically signal is the vibration of rotating shaft.When there is no relationship between the various components of harmonic frequency, the deterministic signal is described as almost peri-odic or quasi periodically.It is also important to note that it would be more appropriate to consider the total amount of energy in transition than average power (power is the energy/time unit), which is a parameter for more continuous signals.
THE DEVELOPMENT OF AN EXPERIMENTAL TEST STAND FOR DIAGNOSIS OF GEARBOX RELIABILITYDEZVOLTAREA UNUI STAND EXPERIMENTAL PENTRU DIAGNOZA DE FIABILITATE A CUTIILOR DE VITEZErezumatAnaliza defectelor si a modului de defectare se plasează într-un domeniu complex. Evaluarea vibrațiilor contribuie la determinarea tipurilor caracteristice de defecte, a efectului şi modului lor de manifestare în funcționare, precum şi a modelelor mate-matice specifice. Monitorizarea vibraţiilor unui sistem tehnic oferă informații utile despre starea
acestuia şi, după caz despre nevoia unei intervenții rapide pentru înlăturarea defec-tului existent sau scoaterea temporară/permanentă din uz a întregului echipament. Standul de testare propus a fost proiectat şi realizat în vederea identificării în regim de laborator a posibilelor defecte specifice cutiei de viteze prin tehnici vibroacustice neintrusive.Keywords: experimental test stand, vibrations, diagnosis reliability, gearbox
Universitatea Tehnică din Cluj-Napoca, B-dul Muncii, Nr. 103-105, 400641, Cluj-Napoca, România
Prof. dr. ing. Nicolae FILIP
Drd. ing. Alexandru-Vlad [email protected]
table 1. Possible failure in the functioning of the transmission gear
table 2. Recommendation regarding the parameters for gearbox monitoring

17
Ingineria automobilului Nr. 40 / septembrie 2016
Signal analysis techniques can be classified into four categories:- analysis of amplitude signal;- time-domain analysis individual signals;- frequency domain analysis individual signals;- dual signal analysis in time domain or frequency domain.Analysis of amplitude and time domain analysis provides information about the signal and therefore require only analysis tools can be straight-forward, while analyses in the field of dual frequency signal and dual signal provides very detailed information about the signal and therefore require specialized expertise and tools of analysis quite sophisticated [3].Signal analysis techniques that are commonly used to quantify a signal measurer shall be summarized in Figure 1. Sometimes only the total amplitude of the signal is of real interest. Researches and experiments on performance of a certain important pieces of a car often provides clues to establish whether or not to continue to the next levels [2].The probability density function P(x) represents the probability p(x)dx as a signal x(t) to be in the field of x at x+dx domain. The two functions are expressed by:
(1)
where: α is the variable of integration.P(x)=1 when the upper limit of integration represents the maximum amplitude of the signal; the field in which the probability density func-tion has to be unified at all times. Differencing equation 1 we see that the probability density function is the probability distribution function of the slope:
(2)
Another important application of amplitude analysis is the study of the distribution of values of discrete events ends or extremes.Quite often are not Gaussian distributions and we can notice a reduced inclination. Information about statistics is therefore necessary to tilt the distribution. The average value of the distribution is the first statistical element given by equation:
(3)
The mean square is the second element of the given statistical equation:
(4)
Distribution inclination is the third item. Conventional is given in a non-dimensional form by:
(5)
or
(6)
Inclination is a measure of the probability density function symmetry. A function which is symmetrical to the middle has an incidence to 0, positive inclination at the left and the right negative. For the analysis of inclined distributions are available different types of probability distri-bution functions. These include: the log-normal distribution, smoothly
Fig. 2. The gearbox logic diagram
Fig. 1. signal analysis
18
Ingineria automobilului Nr. 40 / septembrie 2016
squares distribution, student distributions, Maxwell distributions and Weibull distributions [2].3. tRee AnAlYsis - DeteRmine PossiBle FAults AnD DiAgnosis oF ReliABilitYStructural increasing analysis provides the ability to diagnose system faults on components for the entire system (Figure 2).It will analyze the failure of components of the toothed wheel transmission. Despite the obvious simplicity of such mechanical systems, though possible destruction modes and their mechanisms are very numerous.Mainly degradation of gears transmissions may occur due to:- destruction of the toothed wheel through various mechanisms;- wear or failure of rolling or sliding bearings;- destruction of sealing systems and as a result of total or partial loss of lubricant;- spline shaft wear;- destruction of transmission shafts by fatigue;- carcasses corrosion and the appearance of cracks through which it can drain the lubricant;- lubricants degradation as a result of other types of faults in the items listed above.A first observation on the degradation in general of a mechanical system with transmission gears is that it may fail more often due to damages that occur with rolling bearings than following a failure gears.Although both cogwheels and bearings are subjected to variable voltage contact, bearings are more sensitive to hard particles that may exist in the lubricant due to scaling them during running-in or as a result of the destruction of metal surfaces in contact [8]. It may be considered generally as 49% of the causes of gears transmission failure are caused by damage to bearings, 41%, due to the toothed wheel failure and 16% are other causes.Besides the main destruction mechanisms of cogwheels and bearings can be damaged as a result of causes such as: errors of bearings alignment, shafts and gear wheels (which causes about 19% of the total damage); processing errors (about 6% of faults); thermal instability of elements (in particular the unwanted dilatation of shafts on what are mount bearings and carcasses are installed them, about 9% of faults); torsion vibrations [6] occasional unexpected overloads (approximately 13% of the faults) resulting in the destruction of the bearings or toothed wheels; overloads caused by various types of elastic couplings, drive-shafts, electric motors with excessive startup couples; interior or exterior contamination or lubricants (approximately 25% of the failures).4. Design AnD DeVeloPment oF eXPeRimentAl test stAnDAchieving of experimental testing stand for the gearbox has been devel-oped in the following stages:- Conception- Design- structure calculation in terms of stability and resistance;- sizing drive couplings and the dynamic brake;- Execution- manufacture of frame, the couplings and connecting elements;- the positioning of the elements according to the axes of rotation related to geometric characteristics (parallelism, angles, horizontal, verticality);Experimental test stand design research was conducted in the first phase modeled with AutoCAD and can thus determine the whole of it.Calculation of moment is presented based on torsion strength and speed on the electric engine.
From the physical expression of power known as:
(7)
In uniform circular motion:
(8)
From relationships 7, 8, result:
(9)
Considering
the relationship 9 can be written:
(10)
whereMt - torsion moment [Nm]P - power [W]n - revolution speed [rot/sec]Take into consideration the main characteristics of the electric engine (1.5 kW, 1425 rpm), and the results recorded in the following measurements
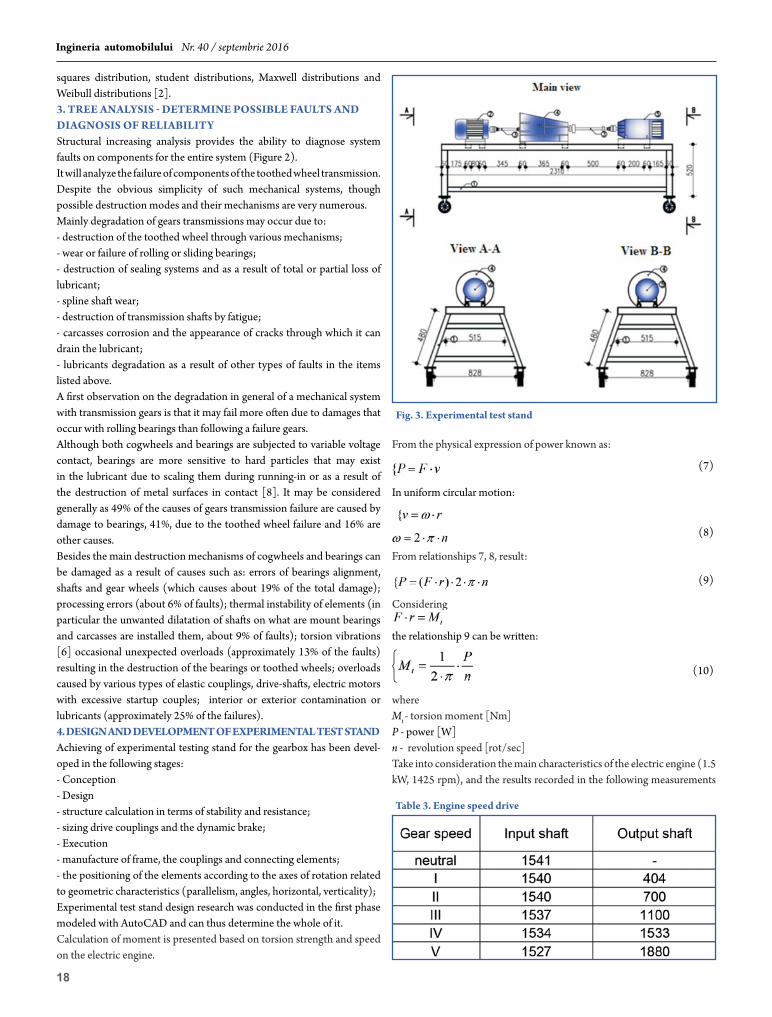
Fig. 3. experimental test stand
table 3. engine speed drive
19
Ingineria automobilului Nr. 40 / septembrie 2016
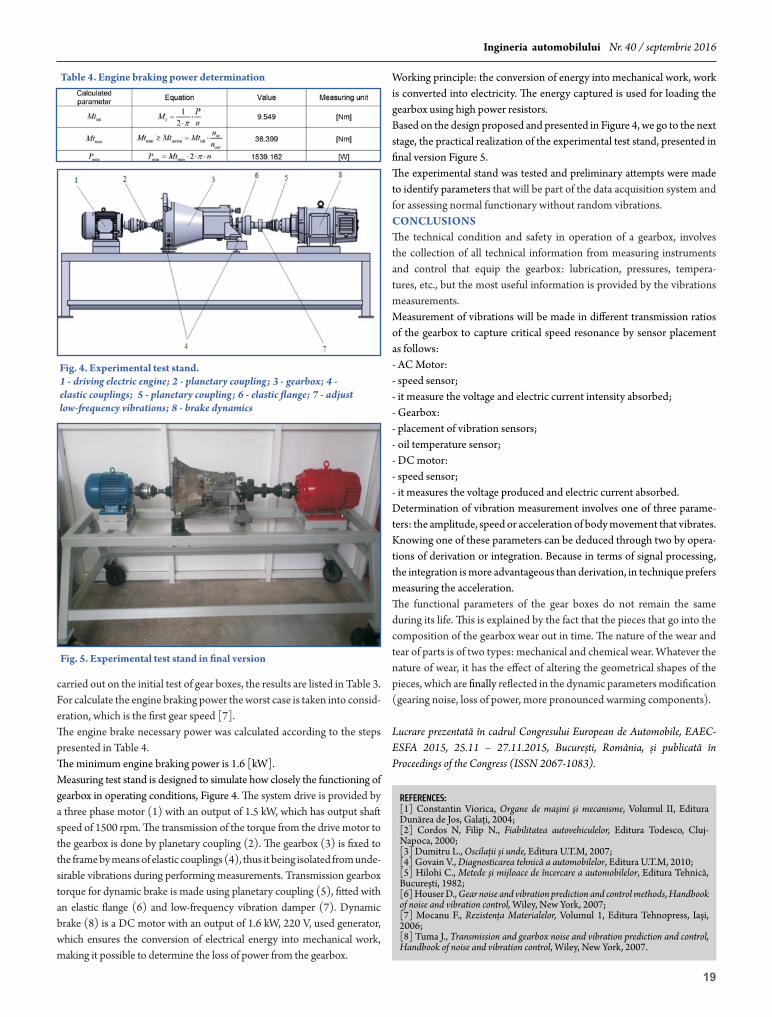
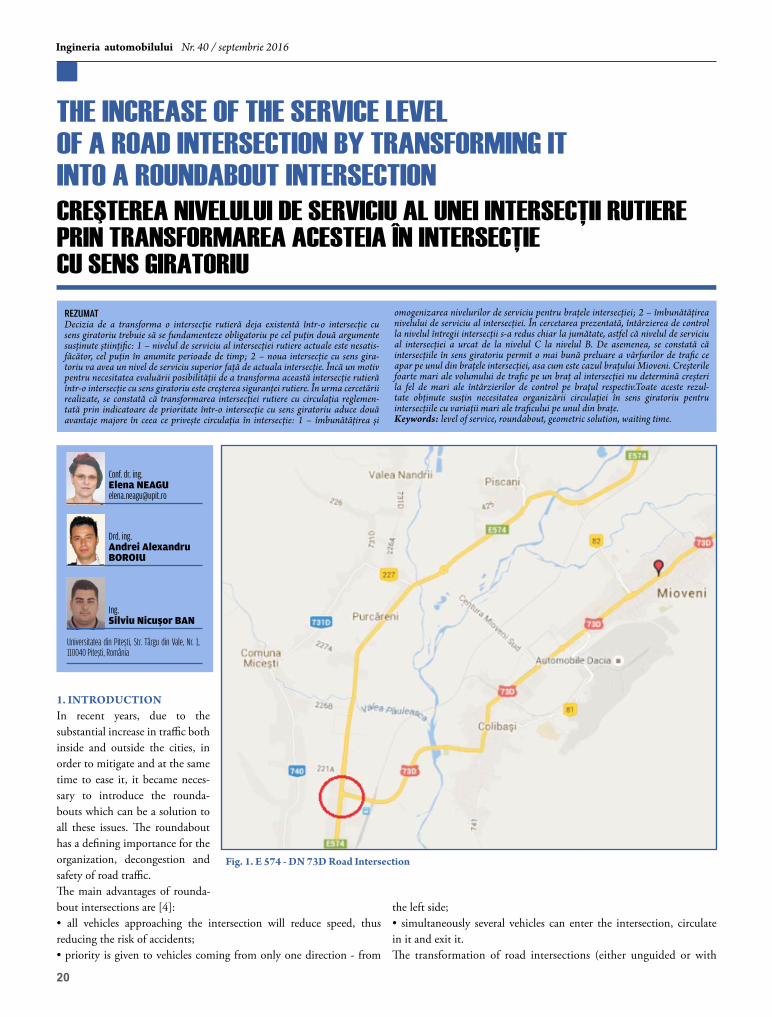
carried out on the initial test of gear boxes, the results are listed in Table 3.For calculate the engine braking power the worst case is taken into consid-eration, which is the first gear speed [7].The engine brake necessary power was calculated according to the steps presented in Table 4.The minimum engine braking power is 1.6 [kW].Measuring test stand is designed to simulate how closely the functioning of gearbox in operating conditions, Figure 4. The system drive is provided by a three phase motor (1) with an output of 1.5 kW, which has output shaft speed of 1500 rpm. The transmission of the torque from the drive motor to the gearbox is done by planetary coupling (2). The gearbox (3) is fixed to the frame by means of elastic couplings (4), thus it being isolated from unde-sirable vibrations during performing measurements. Transmission gearbox torque for dynamic brake is made using planetary coupling (5), fitted with an elastic flange (6) and low-frequency vibration damper (7). Dynamic brake (8) is a DC motor with an output of 1.6 kW, 220 V, used generator, which ensures the conversion of electrical energy into mechanical work, making it possible to determine the loss of power from the gearbox.
Working principle: the conversion of energy into mechanical work, work is converted into electricity. The energy captured is used for loading the gearbox using high power resistors.Based on the design proposed and presented in Figure 4, we go to the next stage, the practical realization of the experimental test stand, presented in final version Figure 5.The experimental stand was tested and preliminary attempts were made to identify parameters that will be part of the data acquisition system and for assessing normal functionary without random vibrations.ConClusionsThe technical condition and safety in operation of a gearbox, involves the collection of all technical information from measuring instruments and control that equip the gearbox: lubrication, pressures, tempera-tures, etc., but the most useful information is provided by the vibrations measurements.Measurement of vibrations will be made in different transmission ratios of the gearbox to capture critical speed resonance by sensor placement as follows:- AC Motor: - speed sensor;- it measure the voltage and electric current intensity absorbed;- Gearbox: - placement of vibration sensors;- oil temperature sensor;- DC motor: - speed sensor;- it measures the voltage produced and electric current absorbed.Determination of vibration measurement involves one of three parame-ters: the amplitude, speed or acceleration of body movement that vibrates. Knowing one of these parameters can be deduced through two by opera-tions of derivation or integration. Because in terms of signal processing, the integration is more advantageous than derivation, in technique prefers measuring the acceleration.The functional parameters of the gear boxes do not remain the same during its life. This is explained by the fact that the pieces that go into the composition of the gearbox wear out in time. The nature of the wear and tear of parts is of two types: mechanical and chemical wear. Whatever the nature of wear, it has the effect of altering the geometrical shapes of the pieces, which are finally reflected in the dynamic parameters modification (gearing noise, loss of power, more pronounced warming components).
Lucrare prezentată în cadrul Congresului European de Automobile, EAEC-ESFA 2015, 25.11 – 27.11.2015, Bucureşti, România, şi publicată în Proceedings of the Congress (ISSN 2067-1083).
table 4. engine braking power determination
Fig. 4. experimental test stand.1 - driving electric engine; 2 - planetary coupling; 3 - gearbox; 4 - elastic couplings; 5 - planetary coupling; 6 - elastic flange; 7 - adjust low-frequency vibrations; 8 - brake dynamics
Fig. 5. experimental test stand in final version
references:[1] Constantin Viorica, Organe de maşini şi mecanisme, Volumul II, Editura Dunărea de Jos, Galaţi, 2004;[2] Cordos N, Filip N., Fiabilitatea autovehiculelor, Editura Todesco, Cluj-Napoca, 2000;[3] Dumitru L., Oscilaţii şi unde, Editura U.T.M, 2007;[4] Govain V., Diagnosticarea tehnică a automobilelor, Editura U.T.M, 2010;[5] Hilohi C., Metede şi mijloace de încercare a automobilelor, Editura Tehnică, Bucureşti, 1982;[6] Houser D., Gear noise and vibration prediction and control methods, Handbook of noise and vibration control, Wiley, New York, 2007;[7] Mocanu F., Rezistenţa Materialelor, Volumul 1, Editura Tehnopress, Iaşi, 2006;[8] Tuma J., Transmission and gearbox noise and vibration prediction and control, Handbook of noise and vibration control, Wiley, New York, 2007.
20
Ingineria automobilului Nr. 40 / septembrie 2016
1. intRoDuCtionIn recent years, due to the substantial increase in traffic both inside and outside the cities, in order to mitigate and at the same time to ease it, it became neces-sary to introduce the rounda-bouts which can be a solution to all these issues. The roundabout has a defining importance for the organization, decongestion and safety of road traffic. The main advantages of rounda-bout intersections are [4]:• all vehicles approaching the intersection will reduce speed, thus reducing the risk of accidents;• priority is given to vehicles coming from only one direction - from
the left side;• simultaneously several vehicles can enter the intersection, circulate in it and exit it.The transformation of road intersections (either unguided or with
THE INCREASE OF THE SERVICE LEVEL OF A ROAD INTERSECTION BY TRANSFORMING IT INTO A ROUNDABOUT INTERSECTIONCREşTEREA NIVELULUI DE SERVICIU AL UNEI INTERSECŢII RUTIEREPRIN TRANSFORMAREA ACESTEIA ÎN INTERSECŢIE CU SENS GIRATORIUrezumatDecizia de a transforma o intersecție rutieră deja existentă într-o intersecție cu sens giratoriu trebuie să se fundamenteze obligatoriu pe cel puțin două argumente susținute ştiințific: 1 – nivelul de serviciu al intersecției rutiere actuale este nesatis-făcător, cel puțin în anumite perioade de timp; 2 – noua intersecție cu sens gira-toriu va avea un nivel de serviciu superior față de actuala intersecție. Încă un motiv pentru necesitatea evaluării posibilității de a transforma această intersecție rutieră într-o intersecție cu sens giratoriu este creşterea siguranței rutiere. În urma cercetării realizate, se constată că transformarea intersecției rutiere cu circulația reglemen-tată prin indicatoare de prioritate într-o intersecție cu sens giratoriu aduce două avantaje majore în ceea ce priveşte circulația în intersecție: 1 – îmbunătățirea şi
omogenizarea nivelurilor de serviciu pentru brațele intersecției; 2 – îmbunătățirea nivelului de serviciu al intersecției. În cercetarea prezentată, întârzierea de control la nivelul întregii intersecții s-a redus chiar la jumătate, astfel că nivelul de serviciu al intersecției a urcat de la nivelul C la nivelul B. De asemenea, se constată că intersecțiile în sens giratoriu permit o mai bună preluare a vârfurilor de trafic ce apar pe unul din brațele intersecției, asa cum este cazul brațului Mioveni. Creşterile foarte mari ale volumului de trafic pe un braț al intersecției nu determină creşteri la fel de mari ale întârzierilor de control pe brațul respectiv.Toate aceste rezul-tate obținute susțin necesitatea organizării circulației în sens giratoriu pentru intersecțiile cu variații mari ale traficului pe unul din brațe.Keywords: level of service, roundabout, geometric solution, waiting time.
Universitatea din Piteşti, Str. Târgu din Vale, Nr. 1, 110040 Piteşti, România
Drd. ing.Andrei Alexandru BOROIU
Conf. dr. ing. Elena [email protected]
Ing. Silviu Nicușor BAN
Fig. 1. e 574 ‑ Dn 73D Road intersection
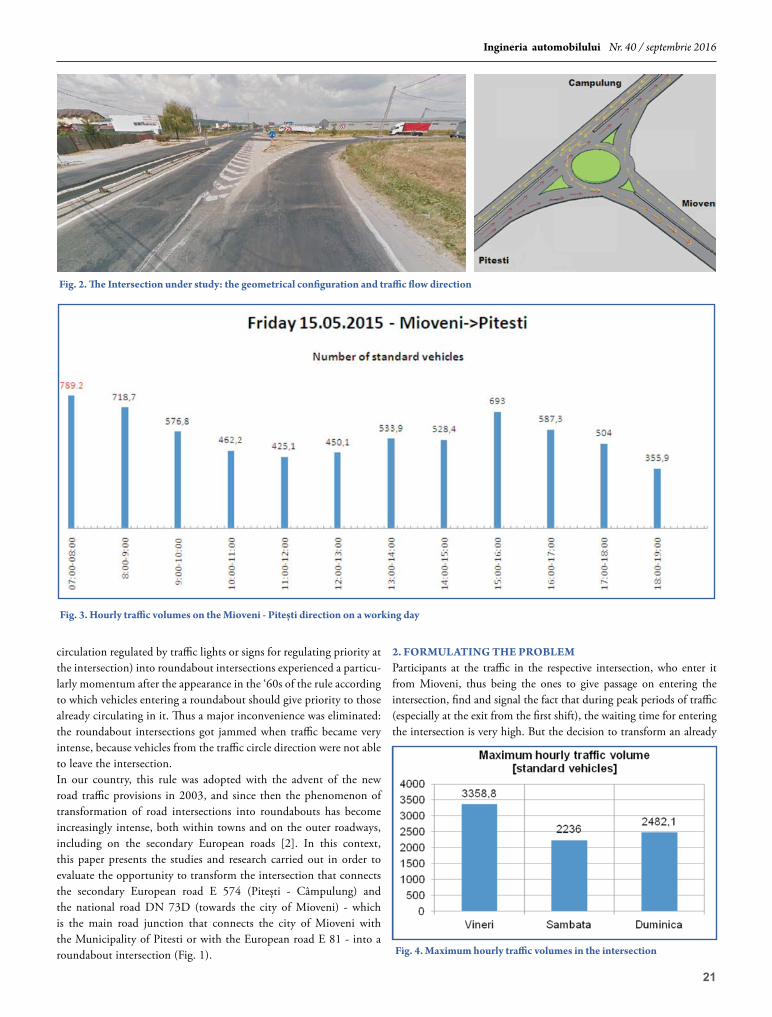
21
Ingineria automobilului Nr. 40 / septembrie 2016
circulation regulated by traffic lights or signs for regulating priority at the intersection) into roundabout intersections experienced a particu-larly momentum after the appearance in the ‘60s of the rule according to which vehicles entering a roundabout should give priority to those already circulating in it. Thus a major inconvenience was eliminated: the roundabout intersections got jammed when traffic became very intense, because vehicles from the traffic circle direction were not able to leave the intersection.In our country, this rule was adopted with the advent of the new road traffic provisions in 2003, and since then the phenomenon of transformation of road intersections into roundabouts has become increasingly intense, both within towns and on the outer roadways, including on the secondary European roads [2]. In this context, this paper presents the studies and research carried out in order to evaluate the opportunity to transform the intersection that connects the secondary European road E 574 (Pitești - Câmpulung) and the national road DN 73D (towards the city of Mioveni) - which is the main road junction that connects the city of Mioveni with the Municipality of Pitesti or with the European road E 81 - into a roundabout intersection (Fig. 1).
2. FoRmulAting tHe PRoBlemParticipants at the traffic in the respective intersection, who enter it from Mioveni, thus being the ones to give passage on entering the intersection, find and signal the fact that during peak periods of traffic (especially at the exit from the first shift), the waiting time for entering the intersection is very high. But the decision to transform an already
Fig. 2. The intersection under study: the geometrical configuration and traffic flow direction
Fig. 3. Hourly traffic volumes on the mioveni ‑ Piteşti direction on a working day
Fig. 4. maximum hourly traffic volumes in the intersection
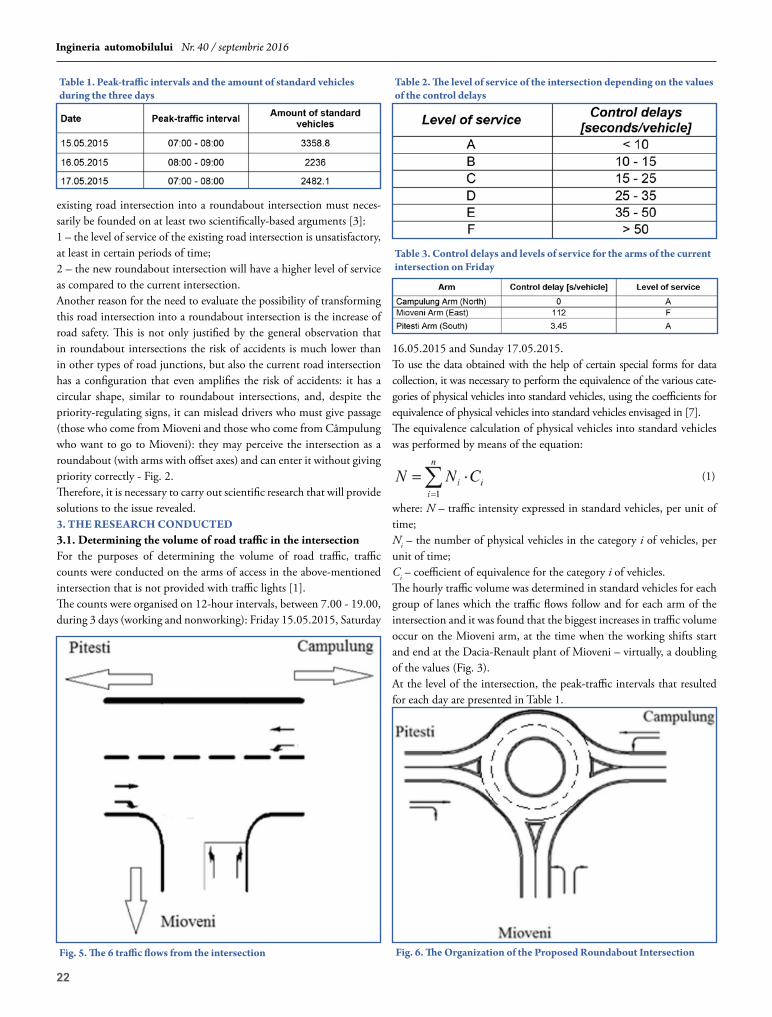
22
Ingineria automobilului Nr. 40 / septembrie 2016
existing road intersection into a roundabout intersection must neces-sarily be founded on at least two scientifically-based arguments [3]: 1 – the level of service of the existing road intersection is unsatisfactory, at least in certain periods of time; 2 – the new roundabout intersection will have a higher level of service as compared to the current intersection. Another reason for the need to evaluate the possibility of transforming this road intersection into a roundabout intersection is the increase of road safety. This is not only justified by the general observation that in roundabout intersections the risk of accidents is much lower than in other types of road junctions, but also the current road intersection has a configuration that even amplifies the risk of accidents: it has a circular shape, similar to roundabout intersections, and, despite the priority-regulating signs, it can mislead drivers who must give passage (those who come from Mioveni and those who come from Câmpulung who want to go to Mioveni): they may perceive the intersection as a roundabout (with arms with offset axes) and can enter it without giving priority correctly - Fig. 2. Therefore, it is necessary to carry out scientific research that will provide solutions to the issue revealed. 3. tHe ReseARCH ConDuCteD3.1. Determining the volume of road traffic in the intersectionFor the purposes of determining the volume of road traffic, traffic counts were conducted on the arms of access in the above-mentioned intersection that is not provided with traffic lights [1]. The counts were organised on 12-hour intervals, between 7.00 - 19.00, during 3 days (working and nonworking): Friday 15.05.2015, Saturday
16.05.2015 and Sunday 17.05.2015.To use the data obtained with the help of certain special forms for data collection, it was necessary to perform the equivalence of the various cate-gories of physical vehicles into standard vehicles, using the coefficients for equivalence of physical vehicles into standard vehicles envisaged in [7]. The equivalence calculation of physical vehicles into standard vehicles was performed by means of the equation:
(1)
where: N – traffic intensity expressed in standard vehicles, per unit of time;Ni – the number of physical vehicles in the category i of vehicles, per unit of time; Ci – coefficient of equivalence for the category i of vehicles.The hourly traffic volume was determined in standard vehicles for each group of lanes which the traffic flows follow and for each arm of the intersection and it was found that the biggest increases in traffic volume occur on the Mioveni arm, at the time when the working shifts start and end at the Dacia-Renault plant of Mioveni – virtually, a doubling of the values (Fig. 3).At the level of the intersection, the peak-traffic intervals that resulted for each day are presented in Table 1.
table 1. Peak‑traffic intervals and the amount of standard vehicles during the three days
Fig. 5. The 6 traffic flows from the intersection
table 2. The level of service of the intersection depending on the values of the control delays
table 3. Control delays and levels of service for the arms of the current intersection on Friday
Fig. 6. The organization of the Proposed Roundabout intersection
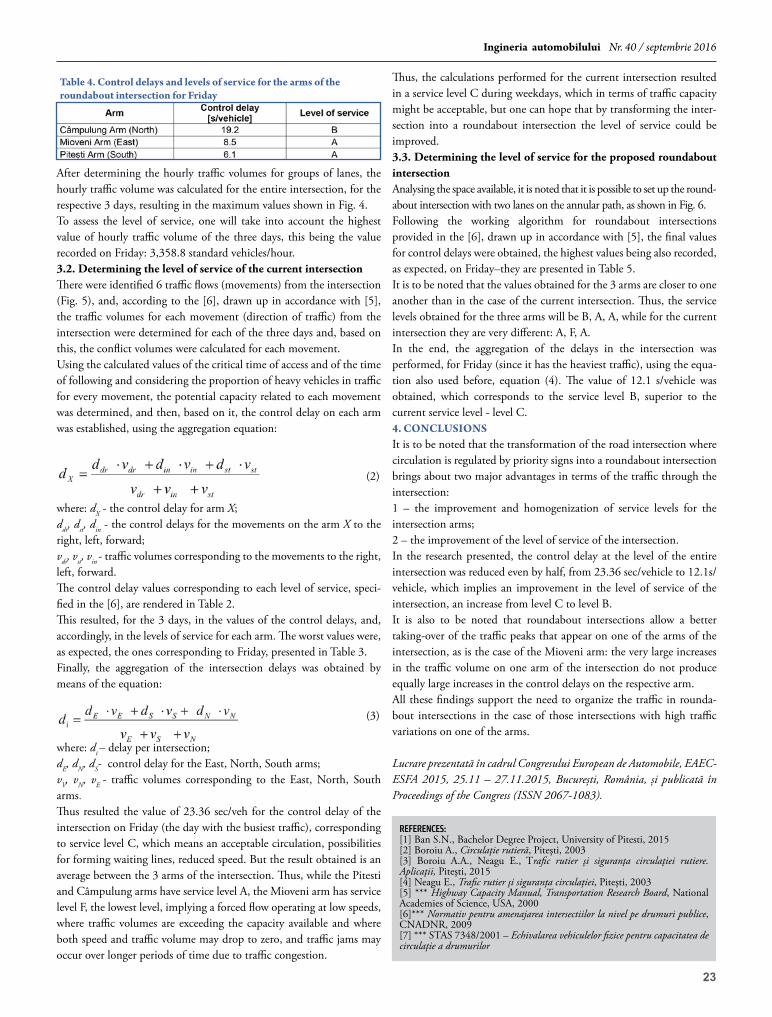
23
Ingineria automobilului Nr. 40 / septembrie 2016
After determining the hourly traffic volumes for groups of lanes, the hourly traffic volume was calculated for the entire intersection, for the respective 3 days, resulting in the maximum values shown in Fig. 4.To assess the level of service, one will take into account the highest value of hourly traffic volume of the three days, this being the value recorded on Friday: 3,358.8 standard vehicles/hour.3.2. Determining the level of service of the current intersectionThere were identified 6 traffic flows (movements) from the intersection (Fig. 5), and, according to the [6], drawn up in accordance with [5], the traffic volumes for each movement (direction of traffic) from the intersection were determined for each of the three days and, based on this, the conflict volumes were calculated for each movement.Using the calculated values of the critical time of access and of the time of following and considering the proportion of heavy vehicles in traffic for every movement, the potential capacity related to each movement was determined, and then, based on it, the control delay on each arm was established, using the aggregation equation:
(2)
where: dX - the control delay for arm X;ddr, dst, din - the control delays for the movements on the arm X to the right, left, forward;vdr, vst, vin - traffic volumes corresponding to the movements to the right, left, forward.The control delay values corresponding to each level of service, speci-fied in the [6], are rendered in Table 2. This resulted, for the 3 days, in the values of the control delays, and, accordingly, in the levels of service for each arm. The worst values were, as expected, the ones corresponding to Friday, presented in Table 3.Finally, the aggregation of the intersection delays was obtained by means of the equation:
(3)
where: di – delay per intersection;dE, dN, dS- control delay for the East, North, South arms;vV, vN, vE - traffic volumes corresponding to the East, North, South arms.Thus resulted the value of 23.36 sec/veh for the control delay of the intersection on Friday (the day with the busiest traffic), corresponding to service level C, which means an acceptable circulation, possibilities for forming waiting lines, reduced speed. But the result obtained is an average between the 3 arms of the intersection. Thus, while the Pitesti and Câmpulung arms have service level A, the Mioveni arm has service level F, the lowest level, implying a forced flow operating at low speeds, where traffic volumes are exceeding the capacity available and where both speed and traffic volume may drop to zero, and traffic jams may occur over longer periods of time due to traffic congestion.
Thus, the calculations performed for the current intersection resulted in a service level C during weekdays, which in terms of traffic capacity might be acceptable, but one can hope that by transforming the inter-section into a roundabout intersection the level of service could be improved.3.3. Determining the level of service for the proposed roundabout intersectionAnalysing the space available, it is noted that it is possible to set up the round-about intersection with two lanes on the annular path, as shown in Fig. 6. Following the working algorithm for roundabout intersections provided in the [6], drawn up in accordance with [5], the final values for control delays were obtained, the highest values being also recorded, as expected, on Friday–they are presented in Table 5.It is to be noted that the values obtained for the 3 arms are closer to one another than in the case of the current intersection. Thus, the service levels obtained for the three arms will be B, A, A, while for the current intersection they are very different: A, F, A.In the end, the aggregation of the delays in the intersection was performed, for Friday (since it has the heaviest traffic), using the equa-tion also used before, equation (4). The value of 12.1 s/vehicle was obtained, which corresponds to the service level B, superior to the current service level - level C. 4. ConClusionsIt is to be noted that the transformation of the road intersection where circulation is regulated by priority signs into a roundabout intersection brings about two major advantages in terms of the traffic through the intersection:1 – the improvement and homogenization of service levels for the intersection arms;2 – the improvement of the level of service of the intersection.In the research presented, the control delay at the level of the entire intersection was reduced even by half, from 23.36 sec/vehicle to 12.1s/vehicle, which implies an improvement in the level of service of the intersection, an increase from level C to level B. It is also to be noted that roundabout intersections allow a better taking-over of the traffic peaks that appear on one of the arms of the intersection, as is the case of the Mioveni arm: the very large increases in the traffic volume on one arm of the intersection do not produce equally large increases in the control delays on the respective arm. All these findings support the need to organize the traffic in rounda-bout intersections in the case of those intersections with high traffic variations on one of the arms.
Lucrare prezentată în cadrul Congresului European de Automobile, EAEC-ESFA 2015, 25.11 – 27.11.2015, București, România, și publicată în Proceedings of the Congress (ISSN 2067-1083).
references:[1] Ban S.N., Bachelor Degree Project, University of Pitesti, 2015[2] Boroiu A., Circulaţie rutieră, Piteşti, 2003[3] Boroiu A.A., Neagu E., Trafic rutier şi siguranţa circulaţiei rutiere. Aplicaţii, Piteşti, 2015[4] Neagu E., Trafic rutier şi siguranţa circulaţiei, Piteşti, 2003[5] *** Highway Capacity Manual, Transportation Research Board, National Academies of Science, USA, 2000[6]*** Normativ pentru amenajarea intersectiilor la nivel pe drumuri publice, CNADNR, 2009[7] *** STAS 7348/2001 – Echivalarea vehiculelor fizice pentru capacitatea de circulaţie a drumurilor
table 4. Control delays and levels of service for the arms of the roundabout intersection for Friday

24
Ingineria automobilului Nr. 40 / septembrie 2016
1. intRoDuCtionMost existing vehicles in road transportation, which are equipped with an internal combustion engine for the propulsion system, have a significant influence on the quality of atmospheric air. For this reason, there are complaints regarding the impact of internal combustion engines on the atmosphere, which is polluted by noxious exhaust gas emissions and noise, but also leakages of fuel and lubricants. In the combustion chamber of an internal combustion engine, the
burning process has the biggest contribution on the pollution due to short reaction time, mixture formation difficulties, heat losses and other. For the pollution evaluation of an internal combustion engine, the adoption of a coefficient, having a harmful effect on the environment and health is proposed.This coefficient is characterizing the global toxicity effect of the emissions resulting from internal combustion engine operation and it can be used for comparing the emissions level produced by different engines.The evaluation of global toxicity of exhaust gases is usually done with the help of coefficients, which consider the noxious component effect and noxious character of these components relative to the toxicity of carbon monoxide.2. toXiCitY inDeX (it)Global toxicity can be evaluated considering components, such as bezo(a)pyrene, formaldehyde, lead, which are not comprised in the legislation regarding emissions of means of transportation. The defined global coefficient has a less technical significance, but a more environmental one. The general form of this toxicity coefficient, called IT [1] is described by Equation 1, such as:
(1)
where: i – considered pollutants.Nowadays, the list of selected pollutants contains carbon monoxide (CO), unburned hydrocarbons (HC), nitrous oxides (NOx) for spark ignition engines and for compression ignition engines, particles (PT) are
added to this list. The list may continue with other very toxic components that are found in the burnt gases too, although in small quantities.In the case of compression ignition, considering the most common pollution legislations containing clear limitations of the mentioned values, this coefficient evaluates the effects on the environment produced by the pollutants under law, in a technical manner, with the Equation 2.
(2)
where: KCO, KNOx, KHC, KPT – toxicity specific coefficient of each considered pollutant, defined on a toxicity scale based on the effects produced of the corresponding pollutant on health and environment;wCO, wNOx, wHC, wPT – masses of the respective pollutants.Usually, the toxicity of pollutants is considered with respect to the toxicity of carbon monoxide. So, ZCO = 1 and K ‘NOx= KNOx / KCO [1].
(3)
where: KNOx, KHC, KPT - toxicity specific coefficients with respect to the toxic effects of CO.Finding the K’ coefficients represents a difficult task due to the fact that the evaluation of the toxicity of the pollutants is greatly subjective [1].Toxicity specific coefficient K’HC, K’NOx and K’PT, have the following values: K’HC=1, K’NOx=20 and K’PT=40 [1].These coefficients support the idea of summing up the toxic effect of the components forming the burnt gases, comparing it with the toxicity of CO. The K’ coefficients are computed as a ratio of the maximal allowable concentration of pollutant i and the maximal allowable concentration of CO. The list of pollutants may continue with other toxic compounds as lead, sulfur oxides, acrolein, formaldehyde and bezo(a)pyrene [1].The coefficients K’ were computed based on the limit values of the concentrations of the concentrations of the pollutant substances according to quality standards of the air in Romania [1].3. estABlisHing tHe ReFeRenCe VeHiCleDue to the diversity of the road traffic, for diverse analyses on it, there is necessary that for each vehicle an equivalence coefficient to be considered based on vehicle type.In urban traffic, defining a reference vehicle is simple, because the considered elements concern the shape and dimensions of the vehicles, but for defining a toxicity equivalent for each vehicle is more difficult. In
URBAN TRAFFIC TOXICITY INDEX EVALUATIONASUPRA UNUI INDICE DE EVALUARE A TOXICITĂŢII TRAFICULUI URBAN
rezumatLucrarea prezintă unele aspecte privind cercetările efectuate în scopul definirii şi validării unui indice global de evaluare a toxicității traficului urban. Acest indice integrează efectele cumulate ale toxicității emisiilor rezultate în urma operării
motoarelor cu ardere internă ce echipează autovehiculele rutiere. Aplicarea concep-telor dezvoltate la cazul municipiului Braşov evidențiază utilitatea adoptării unui astfel de indice pentru studii de poluare complexă.Keywords: traffic, pollution, toxicity index, environment.
Universitatea Transilvania Braşov, Str. Politehnicii nr. 1, 500024 Braşov, România
Drd. ing.Dan-Mihai DOGARIU
Drd. ing. Marius LAZĂ[email protected]
Prof. dr. ing. Anghel CHIRU
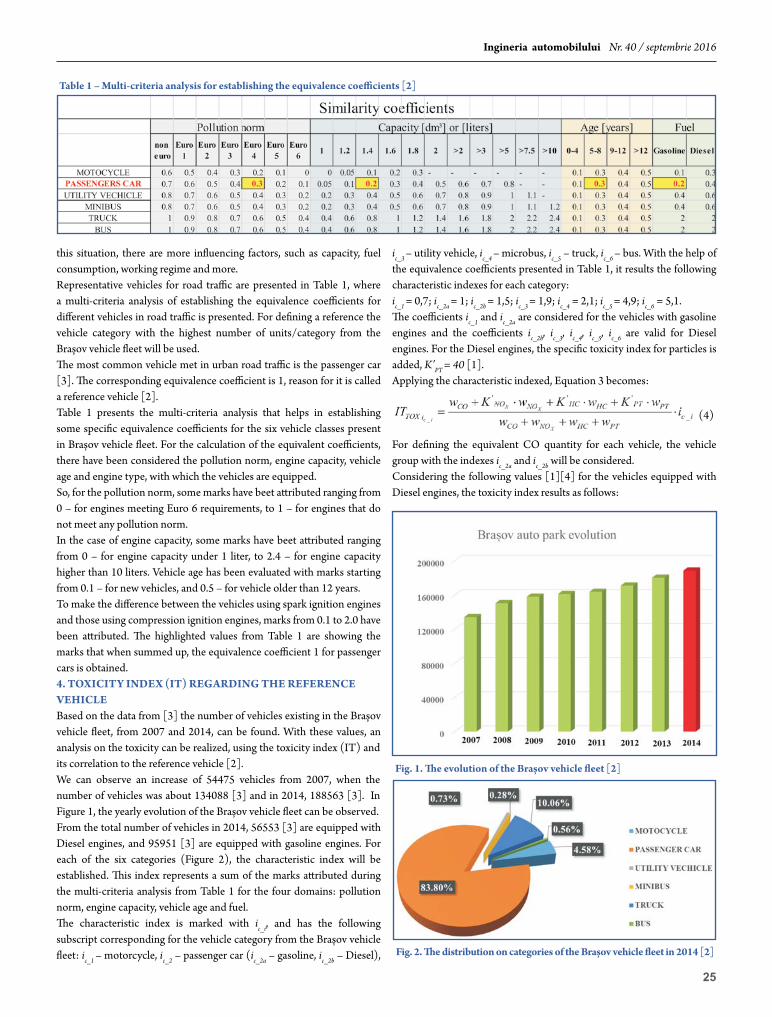
25
Ingineria automobilului Nr. 40 / septembrie 2016
this situation, there are more influencing factors, such as capacity, fuel consumption, working regime and more.Representative vehicles for road traffic are presented in Table 1, where a multi-criteria analysis of establishing the equivalence coefficients for different vehicles in road traffic is presented. For defining a reference the vehicle category with the highest number of units/category from the Braşov vehicle fleet will be used.The most common vehicle met in urban road traffic is the passenger car [3]. The corresponding equivalence coefficient is 1, reason for it is called a reference vehicle [2].Table 1 presents the multi-criteria analysis that helps in establishing some specific equivalence coefficients for the six vehicle classes present in Braşov vehicle fleet. For the calculation of the equivalent coefficients, there have been considered the pollution norm, engine capacity, vehicle age and engine type, with which the vehicles are equipped.So, for the pollution norm, some marks have beet attributed ranging from 0 – for engines meeting Euro 6 requirements, to 1 – for engines that do not meet any pollution norm.In the case of engine capacity, some marks have beet attributed ranging from 0 – for engine capacity under 1 liter, to 2.4 – for engine capacity higher than 10 liters. Vehicle age has been evaluated with marks starting from 0.1 – for new vehicles, and 0.5 – for vehicle older than 12 years.To make the difference between the vehicles using spark ignition engines and those using compression ignition engines, marks from 0.1 to 2.0 have been attributed. The highlighted values from Table 1 are showing the marks that when summed up, the equivalence coefficient 1 for passenger cars is obtained.4. toXiCitY inDeX (it) RegARDing tHe ReFeRenCe VeHiCleBased on the data from [3] the number of vehicles existing in the Braşov vehicle fleet, from 2007 and 2014, can be found. With these values, an analysis on the toxicity can be realized, using the toxicity index (IT) and its correlation to the reference vehicle [2].We can observe an increase of 54475 vehicles from 2007, when the number of vehicles was about 134088 [3] and in 2014, 188563 [3]. In Figure 1, the yearly evolution of the Braşov vehicle fleet can be observed.From the total number of vehicles in 2014, 56553 [3] are equipped with Diesel engines, and 95951 [3] are equipped with gasoline engines. For each of the six categories (Figure 2), the characteristic index will be established. This index represents a sum of the marks attributed during the multi-criteria analysis from Table 1 for the four domains: pollution norm, engine capacity, vehicle age and fuel. The characteristic index is marked with ic_i, and has the following subscript corresponding for the vehicle category from the Braşov vehicle fleet: ic_1 – motorcycle, ic_2 – passenger car (ic_2a – gasoline, ic_2b – Diesel),
ic_3 – utility vehicle, ic_4 – microbus, ic_5 – truck, ic_6 – bus. With the help of the equivalence coefficients presented in Table 1, it results the following characteristic indexes for each category:ic_1 = 0,7; ic_2a = 1; ic_2b = 1,5; ic_3 = 1,9; ic_4 = 2,1; ic_5 = 4,9; ic_6 = 5,1.The coefficients ic_1 and ic_2a are considered for the vehicles with gasoline engines and the coefficients ic_2b, ic_3, ic_4, ic_5, ic_6 are valid for Diesel engines. For the Diesel engines, the specific toxicity index for particles is added, K’PT = 40 [1].Applying the characteristic indexed, Equation 3 becomes:
(4)
For defining the equivalent CO quantity for each vehicle, the vehicle group with the indexes ic_2a and ic_2b will be considered.Considering the following values [1][4] for the vehicles equipped with Diesel engines, the toxicity index results as follows:
table 1 – multi‑criteria analysis for establishing the equivalence coefficients [2]
Fig. 1. The evolution of the Braşov vehicle fleet [2]
Fig. 2. The distribution on categories of the Braşov vehicle fleet in 2014 [2]
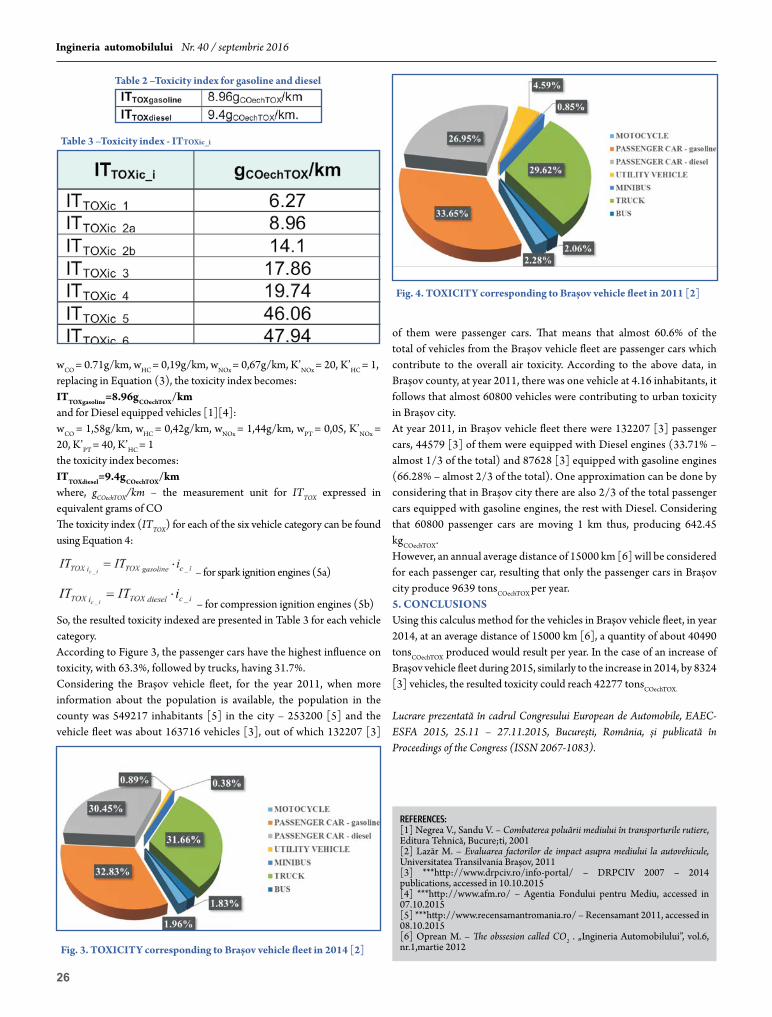
26
Ingineria automobilului Nr. 40 / septembrie 2016
wCO = 0.71g/km, wHC = 0,19g/km, wNOx = 0,67g/km, K’NOx = 20, K’HC = 1,replacing in Equation (3), the toxicity index becomes:ittoXgasoline=8.96gCoechtoX/km and for Diesel equipped vehicles [1][4]:wCO = 1,58g/km, wHC = 0,42g/km, wNOx = 1,44g/km, wPT = 0,05, K’NOx = 20, K’PT = 40, K’HC = 1the toxicity index becomes:ittoXdiesel=9.4gCoechtoX/kmwhere, gCOechTOX/km – the measurement unit for ITTOX expressed in equivalent grams of COThe toxicity index (ITTOX) for each of the six vehicle category can be found using Equation 4:
– for spark ignition engines (5a)
– for compression ignition engines (5b)So, the resulted toxicity indexed are presented in Table 3 for each vehicle category.According to Figure 3, the passenger cars have the highest influence on toxicity, with 63.3%, followed by trucks, having 31.7%.Considering the Braşov vehicle fleet, for the year 2011, when more information about the population is available, the population in the county was 549217 inhabitants [5] in the city – 253200 [5] and the vehicle fleet was about 163716 vehicles [3], out of which 132207 [3]
of them were passenger cars. That means that almost 60.6% of the total of vehicles from the Braşov vehicle fleet are passenger cars which contribute to the overall air toxicity. According to the above data, in Braşov county, at year 2011, there was one vehicle at 4.16 inhabitants, it follows that almost 60800 vehicles were contributing to urban toxicity in Braşov city.At year 2011, in Braşov vehicle fleet there were 132207 [3] passenger cars, 44579 [3] of them were equipped with Diesel engines (33.71% – almost 1/3 of the total) and 87628 [3] equipped with gasoline engines (66.28% – almost 2/3 of the total). One approximation can be done by considering that in Braşov city there are also 2/3 of the total passenger cars equipped with gasoline engines, the rest with Diesel. Considering that 60800 passenger cars are moving 1 km thus, producing 642.45 kgCOechTOX. However, an annual average distance of 15000 km [6] will be considered for each passenger car, resulting that only the passenger cars in Braşov city produce 9639 tonsCOechTOX per year.5. ConClusionsUsing this calculus method for the vehicles in Braşov vehicle fleet, in year 2014, at an average distance of 15000 km [6], a quantity of about 40490 tonsCOechTOX produced would result per year. In the case of an increase of Braşov vehicle fleet during 2015, similarly to the increase in 2014, by 8324 [3] vehicles, the resulted toxicity could reach 42277 tonsCOechTOX.
Lucrare prezentată în cadrul Congresului European de Automobile, EAEC-ESFA 2015, 25.11 – 27.11.2015, Bucureşti, România, şi publicată în Proceedings of the Congress (ISSN 2067-1083).
references:[1] Negrea V., Sandu V. – Combaterea poluării mediului în transporturile rutiere, Editura Tehnică, Bucure;ti, 2001[2] Lazăr M. – Evaluarea factorilor de impact asupra mediului la autovehicule, Universitatea Transilvania Braşov, 2011[3] ***http://www.drpciv.ro/info-portal/ – DRPCIV 2007 – 2014 publications, accessed in 10.10.2015[4] ***http://www.afm.ro/ – Agentia Fondului pentru Mediu, accessed in 07.10.2015[5] ***http://www.recensamantromania.ro/ – Recensamant 2011, accessed in 08.10.2015[6] Oprean M. – The obssesion called CO2 . „Ingineria Automobilului”, vol.6, nr.1,martie 2012
table 2 –toxicity index for gasoline and diesel
table 3 –toxicity index ‑ ittoXic_i
Fig. 3. toXiCitY corresponding to Braşov vehicle fleet in 2014 [2]
Fig. 4. toXiCitY corresponding to Braşov vehicle fleet in 2011 [2]
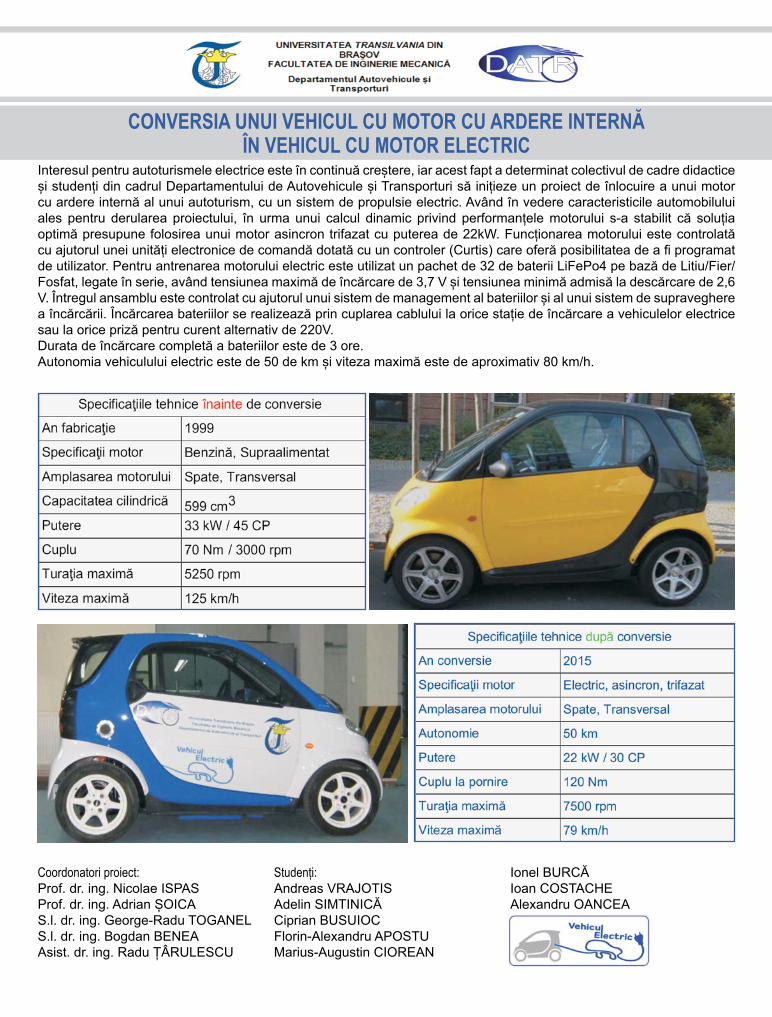
CONVERSIA UNUI VEHICUL CU MOTOR CU ARDERE INTERNĂ ÎN VEHICUL CU MOTOR ELECTRIC
Interesul pentru autoturismele electrice este în continuă creștere, iar acest fapt a determinat colectivul de cadre didactice și studenți din cadrul Departamentului de Autovehicule și Transporturi să inițieze un proiect de înlocuire a unui motor cu ardere internă al unui autoturism, cu un sistem de propulsie electric. Având în vedere caracteristicile automobilului ales pentru derularea proiectului, în urma unui calcul dinamic privind performanțele motorului s-a stabilit că soluția optimă presupune folosirea unui motor asincron trifazat cu puterea de 22kW. Funcționarea motorului este controlată cu ajutorul unei unități electronice de comandă dotată cu un controler (Curtis) care oferă posibilitatea de a fi programat de utilizator. Pentru antrenarea motorului electric este utilizat un pachet de 32 de baterii LiFePo4 pe bază de Litiu/Fier/Fosfat, legate în serie, având tensiunea maximă de încărcare de 3,7 V și tensiunea minimă admisă la descărcare de 2,6 V. Întregul ansamblu este controlat cu ajutorul unui sistem de management al bateriilor și al unui sistem de supraveghere a încărcării. Încărcarea bateriilor se realizează prin cuplarea cablului la orice stație de încărcare a vehiculelor electrice sau la orice priză pentru curent alternativ de 220V. Durata de încărcare completă a bateriilor este de 3 ore. Autonomia vehiculului electric este de 50 de km și viteza maximă este de aproximativ 80 km/h.
Coordonatori proiect:Prof. dr. ing. Nicolae ISPASProf. dr. ing. Adrian ȘOICAS.l. dr. ing. George-Radu TOGANELS.l. dr. ing. Bogdan BENEAAsist. dr. ing. Radu ȚÂRULESCU
Studenți:Andreas VRAJOTISAdelin SIMTINICĂCiprian BUSUIOCFlorin-Alexandru APOSTUMarius-Augustin CIOREAN
Ionel BURCĂIoan COSTACHEAlexandru OANCEA