fie că este vorba de ştiinţă sau de politică, max weber
TRANSCRIPT


1
Fie că este vorba de ştiinţă sau de politică, Max Weber viza acelaşi scop: să
extragă etica specifică unei activităţi pe care o dorea conformă cu finalitatea sa
Raymond ARON
Viața oricărei persoane moderne este asociată, mai mult sau mai puțin conștient, așteptării
societale. Putem spune că suntem imersați în așteptare, că depindem de ea și o influențăm.
Cumpărăm mărfuri din magazine mici ori hipermarketuri, ne instruim în școli și universități,
folosim produse realizate în fabrici, avem relații cu băncile.
Ca o concluzie, suntem angajați ai unor instituții/organizații și clienți ai altora. Toate aceste
lucruri determină o creștere mai mare ca niciodată a valorii organizațiilor și a activităților
organizaționale.
Teoria organizației este o știință bine formată, fondator al acestei discipline fiind
considerat sociologul, avocatul, economistul și istoricului german Max Weber (1864-1920) cel
care a trasat așa-numita direcție birocratică în dezvoltarea teoriei managementului și
organizării.
În scrierile sale despre raționalizarea societății, căutând un răspuns la întrebarea ce trebuie
făcut pentru ca întreaga organizație să funcționeze ca o mașină, acesta a subliniat că ordinea,
susținută de reguli relevante, este cea mai eficientă metodă de lucru pentru orice grup organizat
de oameni.
El a considerat că organizația poate fi descompusă în părțile componente și se poate
normaliza activitatea fiecăreia dintre aceste părți, a propus astfel să se reglementeze cu precizie
numărul și funcțiile angajaților și ale organizațiilor, a subliniat că organizația trebuie
administrată pe o bază rațională/impersonală. În acest punct, aspectul social al organizației este
foarte important, oamenii fiind recunoscuți pentru ideile, caracterul, relațiile, cultura și deloc
de neglijat, așteptările lor. Astăzi, aparenta omnipotentă a civilizației noastre este plină de
amenințări la adresa umanității și a întregii vieți pe Pământ, inclusiv amenințarea continuă a
unui război nuclear global și a tulburărilor geochimice și climatice sistemice, în echilibrul
planetei.
Dezvoltarea rapidă a tehnologiilor digitale și materiale precum și noile instrumente de
management din secolul XXI oferă omenirii oportunități fără precedent de a crea un viitor
optimist la scară globală. În întreaga istorie a Pământului nu au existat astfel de circumstanțe
pentru a influența mediul: s-au creat mijloace de protejare față de efectele ostile ale climatului
și agenților patogeni, s-au creat sisteme globale de aprovizionare cu alimente, există metode de
influență genetică și s-au accelerat cercetări care ne pot transforma într-o specie cosmică ce
trăiește pe mai multe planete.
La începutul secolului XX în lume au trăit puțin mai mult de un miliard și jumătate de
oameni, în 100 de ani ne-am înmulțit la șapte miliarde și jumătate iar specia noastră continuă
să trăiască după tipare și norme culturale dezvoltate atunci când oamenii erau mult mai puțini.
În același timp și cumva în mod paralel, creația civilizației noastre – tehnosfera, devine rapid
autonomă, inteligentă și uneori chiar greu accesibilă propriei noastre înțelegeri. Organizațiile publice sunt create pentru a răspunde nevoilor și intereselor sociale ale
oamenilor, iar eficacitatea organizației depinde de potențialul de resurse al acesteia și de
interacțiunea sistemică a acestora, luând în calcul echipamentele de producție, potențialul
intelectual și puterea de muncă a angajaților, resursele financiare sau imaginea companiei.
În stuctura industrială actuală, aproximativ jumătate dintre ocupații conțin elemente de
rutină, fie că este vorba de muncă fizică sau muncă intelectuală, inclusiv marketing, finanțe,
comunicații etc. Pe termen lung însă, aceste ocupații pot fi înlocuite cu inteligență artificială
sau roboți. Mai mult, unele tehnologii, cum ar fi nano - sau biotehnologie, pot duce la o
revoluție a întregii industrii și la apariția rețelelor de producție regenerative.
EDITORIAL
Identificarea nevoii societale (1)
2
Sectoare de tehnologie noi vor apărea ca urmare a dezvoltării unei noi generații de
tehnologii de uz industrial și de consum, precum dezvoltarea și programarea sistemelor
energetice și a altor medii inteligente pentru localități și gospodării, sau producția de roboți
urbani și vehicule autonome fără pilot, precum și dezvoltarea și producerea de materiale de
bioinginerie regenerabile.
Există însă două însușiri ale omului care sunt imposibil de imitat: creativitatea și
umanitatea. De aceea un număr foarte mare de activități pe care oamenii le pot oferi în educație,
sănătate, artă, design sau chiar divertisment, vor rămâne subordonate acestor două însușiri. Prin prisma acestor însușiri educația poate oferi mult mai mult decât instruirea în abilitățile
necesare socializării ca simplu angajat și cetățean. Poate ajuta la restabilirea sensului vieții și
la furnizarea ocaziei fiecăruia de a face lucruri care îl inspiră.
Economiile virtuale, create în mediul online, de la jocuri la rețele sociale, în care oamenii
pot găsi un număr imens de activități, de la simulări de proiectare ori simulări numerice,
deoarece realitatea virtuală permite depășirea aproape oricăror restricții care există în realitatea
materială, crează lumi cu reguli ce par imposibile sau puțin probabil să fie reale.
O economie verde care își propune nu numai crearea de procese și produse durabile, în
conformitate cu reglementările ONU, profesii ecologice și metode de restabilire a echilibrului
dintre umanitate și planetă, în care tot mai mulți oameni au rolul de a ajuta la protejarea și
dezvoltarea ecosistemului global natural, prin utilizarea pe scară largă a soluțiilor automate,
cum ar fi robotica, internetul și inteligența artificială, dezvoltarea imprimării 3D și a altor
tehnologii aditive, precum și prin utilizarea pe scară largă a bio - producției ecosistemice de
produse alimentare, energiei și materialelor, posedă uriașul potențial de a dezvolta civilizația
la nivelul abundenței totale.
Răspândirea inovației tehnologice continuă să aibă un impact major asupra societății,
organizațiilor și comunităților. Accelerarea schimbării este însoțită de creșterea fluidității
mediilor sociale care sunt din ce în ce mai influențate de variabilitatea socială, politică și
economică, de incertitudine și de complexitate.
Într-o situație de creștere exponențială a datelor și a cunoștințelor științifice, inteligența
artificială poate juca un rol în integrarea cunoștințelor și în susținerea luării deciziilor colective,
iar principalul obstacol în calea evoluției sociale poate fi capacitatea noastră colectivă de a crea
și susține noi dezvoltări, crearea de cunoștințe și managementul ecosistemelor capabile să facă
față complexității societale crescânde.
Tranziția la o societate bazată pe principiile durabilității va trebui să țină cont de
preferințele, interesele și alegerile colective, limitările și prejudecățile cognitive, dar și de
cunoștințele, competențele, practicile, tehnologiile pe care le inițiem și dezvoltam și care pot fi
motiv pentru desfășurarea crizei existențiale.
Modele de sisteme sociale, create în era de relativă stabilitate a trecutului, par să nu fie
potrivite pentru viitor. Apariția unui nou sistem financiar, inclusiv criptomonede și alte sisteme
de gestionare a averii, dar și modificările valorilor și motivației emoționale, fără a se pune
accent pe acumulare și pe bani, oferă o șansă de a recunoaște valoarea de unicitate a omului,
cu înțelepciunea, grija, compasiunea și dragostea la scară globală.
Autor: ec. Elena Banea
Decembrie 2019
Identificarea nevoii societale (2)
EDITORIAL
3
Whether science or politics were in question, Max Weber had in mind a single
purpose: to extract the ethics specific to a certain activity so that it would answer its
very scope.
Raymond ARON
Life of any modern person is more or less consciously associated with societal expectation. We
may say that we are plunged into expectation, that we depend on and influence it at the same
time. We purchase goods from shops and hypermarkets, we instruct ourselves in schools and
universities, we use products developed in plants, and we collaborate with banks. Ultimately,
we are either employees of some institutions/organizations or the clients of others. All these
things determine an ever larger growth than ever of the value of organizations, as well as of the
organizational activities.
The theory of management is a well grounded science, the founder of this discipline being
considered to be Max Weber (1864-1920), a German sociologist, lawyer, economist and
historian, the one who introduced the so-called birocratic direction as part of the development
of the theory of management and organization.
In his writings on the rationalization of society, while searching for an answer to the question
about what was to be done so that the entire organisation may work as a machine, he underlined
that order, supported by relevant rules, is the most efficient working method for any organized
group of people. He considered that any organization can be decomposed into its component
parts and that the activity of each of these parts can be structured; therefore, he proposed a
strict limitation of the number and positions of the employees and compartments, and he
insisted on the fact that the organization must be managed on a rational/objective basis. At this
point, the social aspect of the organization is extremely important, people being appreciated
for their personal ideas, character, relationships, education and, last but not least, for their own
expectations.
Nowadays, the apparent omnipotency of our civilisation is full of threats to humanity and to
the whole life on Earth, including the permanent threat of a global nuclear war, as well as of
systemic geochemical and climate changes in the ballance of the planet.
Fast development of digital and material technologies, as well as the new 21st century
management tools provide humanity with unprecedented opportunities to develop an optimistic
future for society at large. The whole history of the Earth hasn’t ever recorded any similar
circumstances that may have an impact on the environment: new means of protection against
hostile climate effects and patogenic agents have been generated, global systems of food supply
have been developed, methods of genetic influence are also existent, and accelerated research
has been made on mankind’s possibility of becoming a cosmic species that might live on other
planets.
At the beginning of the 20th century, a little over a billion and a half people lived on earth; one
hundred years later, the overall population reaches seven billion and a half, while our species
goes on living on cultural patterns and norms that were developed in times when the number
of people was significantly smaller. At the same time, and somehow independently, the very
creation of our civilization – the techno sphere, tends to become autonomous, intelligent, and,
in certain cases, even hardly accessible to our own understanding.
Public organizations are set up to answer the social needs and interests of the individuals, and
the efficiency of any organization depends on its resource potential, as well as on the systemic
interaction of those resources, if we refer to production equipment, to the intellectual potential
and the working power of its employees, but it also depends on the financial resources and the
visibility of the company.
Almost half of the jobs included in the present industrial structure contain some routine
elements, whether we refer to physical or intellectual work, including marketing, finances,
communications, etc. In the long run, though, these jobs may be replaced by artificial
intelligence or robots.
EDITORIAL
Identification of Societal Needs (1)
4
Furthermore, some technologies, nano for example – or the bio technology, may lead towards
a complete industrial revolution and to the emergence of regenerative production networks.
New technology areas will come out as a consequence of the development of a new generation
of industrial and domestic technologies, such as the development and programming of energy
systems and of other intelligent environments destined for open places and households or the
production of urban robots and of autonomous vehicles, but also the development and
production of regenerating bio engineering materials.
Still, there are two human features that cannot be reproduced at all: creativity and humanity.
That is why a very large number of activities, which men are able to supply in domains like
education, health, arts, design or even entertainment, will always depend on these two features.
Considering these two above mentioned features, we may say that education can offer much
more than a simple training of social abilities of any employee or citizen. It can lead to
redefining the sense of life, but also to facilitating anyone the occasion to do things that may
inspire her/him.
Virtual economies created online, be them games or social networks, where people can
discover an endless number of activities, such as, for example, design or numeric simulations,
due to the fact that virtual reality allows transcendence of almost any restriction existent in
actual reality, but it also sets up distinct environments with rules which seem impossible or
highly improbable to be real.
Any friendly economy, which takes into consideration not only the development of durable
processes and products, according to the UNO regulations, ecological professions and methods
of ballance resetting between humanity and the earth, in which more and more people get
involved to help to protect and develop the natural global ecosystem by a large scale use of
automatic solutions, such as robotics, the Internet and artificial intelligence, through the
development of 3D imprinting and of other additive technologies, as well as by a large scale
use of ecosystemic bio-production of food supplies, energy and materials, has the huge
potential of providing the development of our civilization towards overall abundance.
Dissipation of technological innovation still has a major impact on society, organizations and
communities. The acceleration of change is accompanied by extension of social media fluidity,
which are more and more clearly influenced by social, political and economic changes, as well
as by incertitude and complexity.
Given a specific exponential raise in scientific data and knowledge, artificial intelligence may
play a certain role in data integration and support of collective decision taking, while the main
obstacle against social evolution may reside in our collective capacity to design and support
new developments, knowledge advance and the management of ecosystems capable of coping
with the ever growing societal complexity.
Transition towards a society based on durability principles will have to consider collective
preferences, interests and choices, cognitive limitations and prejudices, but also it will have to
respond to the knowledge, competences, practices and technologies that we innitiate and
develop, and that may all stand for further extention of the existential crisis.
Various models of social systems set up during relatively stable past years do not seem to be
appropriate in the future. The emmergence of a new financial system, cripto coins included, as
well as of other systems of wealth management, and also the changes in value and emotional
motivation, without any specific insistance on accumulation and money, facilitates the
recognition of man’s unique value, as far as his wisdom, care, compassion and love are
concerned anywhere on earth.
Author: ec. Elena Banea
December 2019
Identification of Societal Needs (2)
EDITORIAL
5
PRESIDENT:
Dr. Eng. Valentin SILIVESTRU
VICE-PRESIDENT:
Dr. Eng. Cristian CÂRLĂNESCU
Dr. Eng. Romulus PETCU
SECRETARY:
Dr. Eng. Jeni POPESCU
MEMBERS:
Prof. Dr. Virgil STANCIU Prof. Dr. Corneliu BERBENTE
Prof. Dr. Dan ROBESCU
Prof. Dr. Sterian DĂNĂILĂ Dr. Eng. Gheorghe MATACHE
Dr. Eng. Ene BARBU
Dr. Eng. Gheorghe FETEA Dr. Eng. Ionuț PORUMBEL
Dr. Eng. Mircea Dan IONESCU
Dr. Eng. Lucia Raluca VOICU
Dr. Eng. Mihaiella CREȚU
Dr. Eng. Cleopatra CUCIUMIȚA
Dr. Eng. Sorin GABROVEANU
EDITOR IN CHIEF:
Prof. Dr. Lăcrămioara ROBESCU
EDITORS:
Eng. Mihaela Raluca CONDRUZ
Ec. Elena BANEA
ADMINISTRATIVE SECRETARY:
Eng. Mihaela GRIGORESCU
TRANSLATION CHECKING:
Dr. Eng. Paul RĂDULESCU
Laura COMĂNESCU
Oana HRIȚCU
GRAPHICS:
Victor BEȘLEAGĂ
More information regarding the scientific journal can be found at:
http://www.comoti.ro/ro/jurnalul_stiintific_turb
o.html [email protected]
ISSN: 2559-608X
ISSN-L: 1454-2897
Scientific Journal TURBO is included in ICI World of Journals:
https://journals.indexcopernicus.com/search/det
ails?id=48512
ICV 2017: 63,88
EDITORIAL BOARD CONTENTS
AUTOMATION AND MONITORING
Hardware in the Loop Test Platform Concept
for Adaptive Turbine Engine Controller
Stoicescu A., Ciobanu R., Țăran A., Nechifor C.,
Niculescu F. ………………………………………… pp 6
ENVIRONMENT, COMBUSTION,
CHEMISTRY, INJECTION
FT-IR Spectroscopy Used for Mineral
Compressor Oil Degradation Assessment
Mirea R., Crețu M., Tomescu G, Ceatră L. ……...... pp. 12
LOX/LCH4 UPPER Stage Development
Strategies for Future Launchers
Andreescu T., Mangra A., Vilag V., Mălăel I., Câncescu
A., Vilag J., Ifrim D., Dănescu S. …………….….... pp. 15
COMPRESSORS, BLOWERS,
TURBINES
Analysis of Volumetric Efficiency of the
Blower Rotors with Lobs
Stănescu T., Badea G.P., Stan N.D., Presură-Chirilescu E.
…………………………………………………..... pp. 27
Cross Flow Heat Transfer with Application
in Turbine Blades Cooling
Dombrovschi M. ......…………………………….... pp. 33
MATERIALS AND TECHNOLOGIES
Additive Manufacturing for a Turbopump
rotor
Dobromirescu C., Vilag V. ……………………….. pp. 41
TURBO, vol. VI (2019), no. 2
6
HARDWARE IN THE LOOP TEST PLATFORM
CONCEPT FOR ADAPTIVE TURBINE ENGINE
CONTROLLER
Adrian STOICESCU1,2, Razvan CIOBANU1, Alexandra ȚĂRANU1,2, Cristian
NECHIFOR1,2, Filip NICULESCU1,2
ABSTRACT: Hardware in the loop simulation has gained much attention during the last years in both research
and engineering areas. It allows testing embedded controllers using simulation models of the controlled plant,
such as a real engine. The challenges are making an adequate simulation platform so that the testing scenarios
for the developed controller will be as close as possible as with a real engine. This paper presents a dedicated
Hardware in the loop test platform concept for an innovative turbine engine controller. This way, its
development and testing time and costs are minimized, while as much simulation accuracy is brought into the
testing procedure. The controller is a neural network-based adaptive ECU that aims at bringing major
improvements to the engine control efficiency. Based on preliminary analysis, the proposed HIL platform is
described as a concept, is technically achievable and expected to become a prototype within future work.
KEYWORDS: Hardware in the Loop, Simulation, Turbine Engine, Controller, ECU
NOMENCLATURE
ADC – Analog Digital Converter
AI – Analog Input
ANN – Artificial Neural Network(s)
CLOCK – Internal ECU Clock
COM UART – UART Protocol Programming Interface
CPU – Central Processing Unit
DAC – Digital Analog Converter
DC – Direct Current
DEMUX - Demultiplexer
ECU – Engine Control Unit
EHCV – Electrohydraulic Check Valve
FPGA – Field Programmable Gate Array
HIL – Hardware in the loop
I/O – Input/Output
kS – kyloSamples
OS – Operating System
PCB – Printed Circuit Board
PHT2 – Turboshaft engine
SS – State Space
SG – Starter Generator
TF – Transfer Function
WD – Watch Dog
βTL – Throttle Lever Control Input
δEHCV FI – Electrohydraulic Check Valve for Fuel Injector Control Circuit
δEHCV FS – Electrohydraulic Check Valve for Fuel Supply Control Circuit
δFP – Fuel Pump Power Control Circuit
δIGP – Injector Glow Plug Power Control Circuit
1 Romanian Research and Development Institute for Gas Turbines COMOTI, Bucharest, Romania 2 University Politehnica of Bucharest, Romania
A.STOICESCU, R. CIOBANU, A. ȚĂRANU, C. NECHIFOR, F. NICULESCU
7
δSG Mode – Starter Generator Mode Selector
χEGT – Exhaust Gas Temperature Input
χNCC – Centrifugal Clutch Speed Input
χNGT – Gas Turbine Speed Input
χTAT – True Air Temperature Input
1. INTRODUCTION
Hardware in the loop (HIL) platforms are increasingly used during development and testing stages of
control systems. The plant under control, such as a turbine engine, is simulated by using mathematical models
in a virtual environment on a dedicated hardware platform. The simulation interacts continuously with the
controller, as if it were the real plant. This allows for developing new hardware and software solutions within
time and quality restrictions imposed by markets. Turbine engines are costly machines. Using HIL platforms
when developing and testing ECU (Engine Control Unit) controllers provide the means for performing a wide
range of scenarios while the engine is either not physically available or risky enough to use it. An automotive
ECU HIL system is described in [1]. In [2], the authors developed a HIL simulation platform for testing a jet
engine fuel controller. The engine model shown in [2] is based on two parts: a nonlinear equation system
describing thermodynamic relations in the compressor, turbine and nozzle, and dynamic nonlinear equations
describing the transcient process. A HIL simulation for turbofan engine is described in [3]. This paper proposes
a HIL test platform concept for an adaptive turbine engine ECU which undergoes design phase.
ECUs are fundamentally important in determining fuel flow, as well as the logic dealing with engine’s
constraints. These controllers need to be adapted based on the engine performance characteristics. The most
widely used control strategy for turbine engines is Min-Max [4]. This is based on selecting, at any moment,
one of multiple engine control loops, such as: steady-state control loop, acceleration/deceleration control loops,
critical situations, etc. Intelligent control strategies have gained attention among researchers, in order to
increase the performance and flexibility of the controller. In [5], a combination of fuzzy logic and evolutionary
algorithms was studied with the aim towards a gas turbine aero-engine. Other studies regarding fuzzy logic and
artificial neural networks (ANN) have been conducted and shown in various papers [6-8]. However, most of
them have not exceed research stages. The HIL test platform proposed in this paper is a concept adapted for
testing an ANN-based controller which is undergoing the design stage.
2. CONTROLLER OPERATION ANALYSIS
The adaptive turbine engine controller is an ECU (Engine Control Unit) designed for a particular type
of miniature single-shaft turbine engine. As an innovative controller, the ECU logic is made so that the output
is based not on predefined logic, but determined based on adaptive algorithms. The controller is based on a
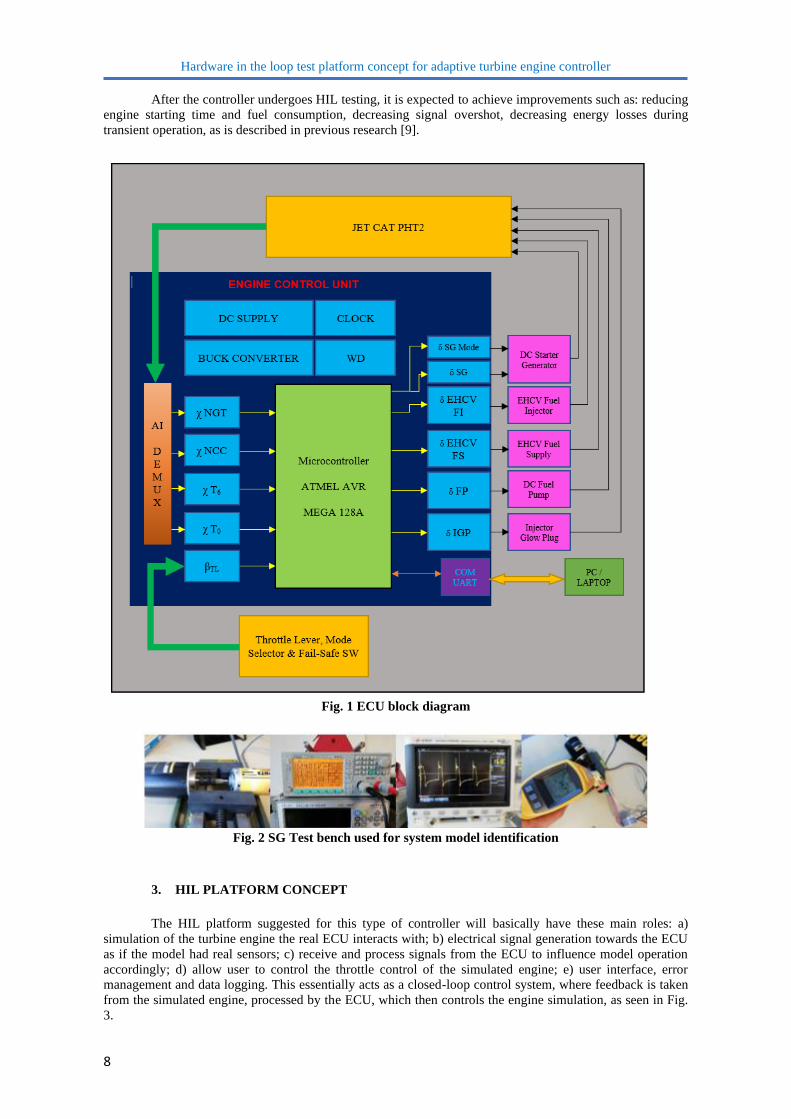
ECU-type embedded hardware module that includes a PCB, with the main component blocks shown in Fig. 1,
and software routines. Parts of the routines will be enhanced with blocks for generating fuel flow signal output
based on ANNs, previously trained on gathered data sets and simulations. Generally, international approaches
on similar topics lead to a fuzzy logic or multilayer feed-forward neural network, which is also the basis for
the ECU under development. However, to the authors’ knowledge, their TRL only ranges from technology
concept to experimental model.
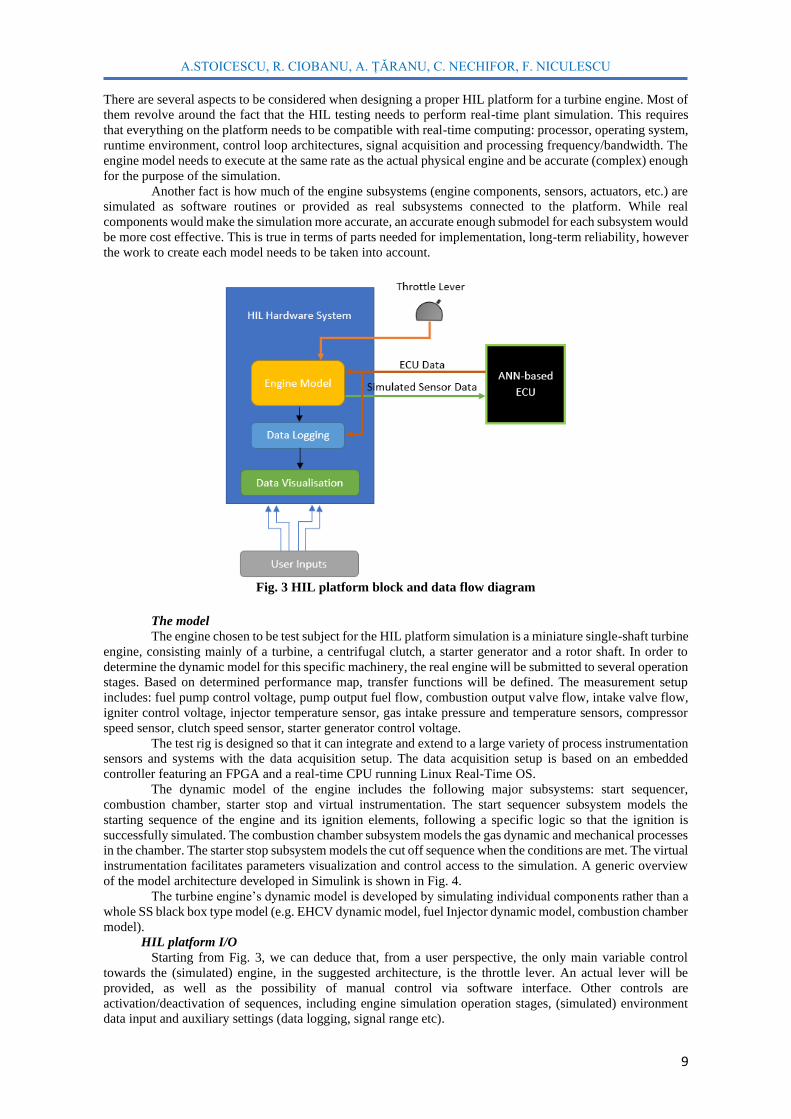
For developing the ECU circuit diagram, it was necessary to identify the dynamic model of the
equipment used to control the turbine engine and of the turbine engine itself. This was achieved with the use
of system dynamics identification via experimental testing (Fig. 2). Equipment such as electrohydraulic check
valves, fuel injector, glow plug, fuel pump and starter generator were tested at full operational limits. After the
testing, the data was plotted in order to achieve graphical analysis (EHCV fuel dosage according to modulation
frequency and pump supply voltage; glow plug temperature – supply voltage dependency) of the system, later
on being used as input data for modelling transfer functions of the previously mentioned equipment. The ECU
was designed with transient operational capability other than steady state operation wich does not require a
nonlinear system modelling. As a result, continuous-time instead of discrete transfer functions were used.
After determining the polynomial coefficients of the transfer functions, the equipment dynamic model
was developed and tested for step response. In order to mimic ECU control logic, conditioning blocks were
also implemented (such as EGT Start Conditioner or Start Attempt Control Loop). For implementing
operational control safety measures, interlocks were also introduced as primary backup conditioning loop in
order to eliminate logic infringements.
Hardware in the loop test platform concept for adaptive turbine engine controller
8
After the controller undergoes HIL testing, it is expected to achieve improvements such as: reducing
engine starting time and fuel consumption, decreasing signal overshot, decreasing energy losses during
transient operation, as is described in previous research [9].
Fig. 1 ECU block diagram
Fig. 2 SG Test bench used for system model identification
3. HIL PLATFORM CONCEPT
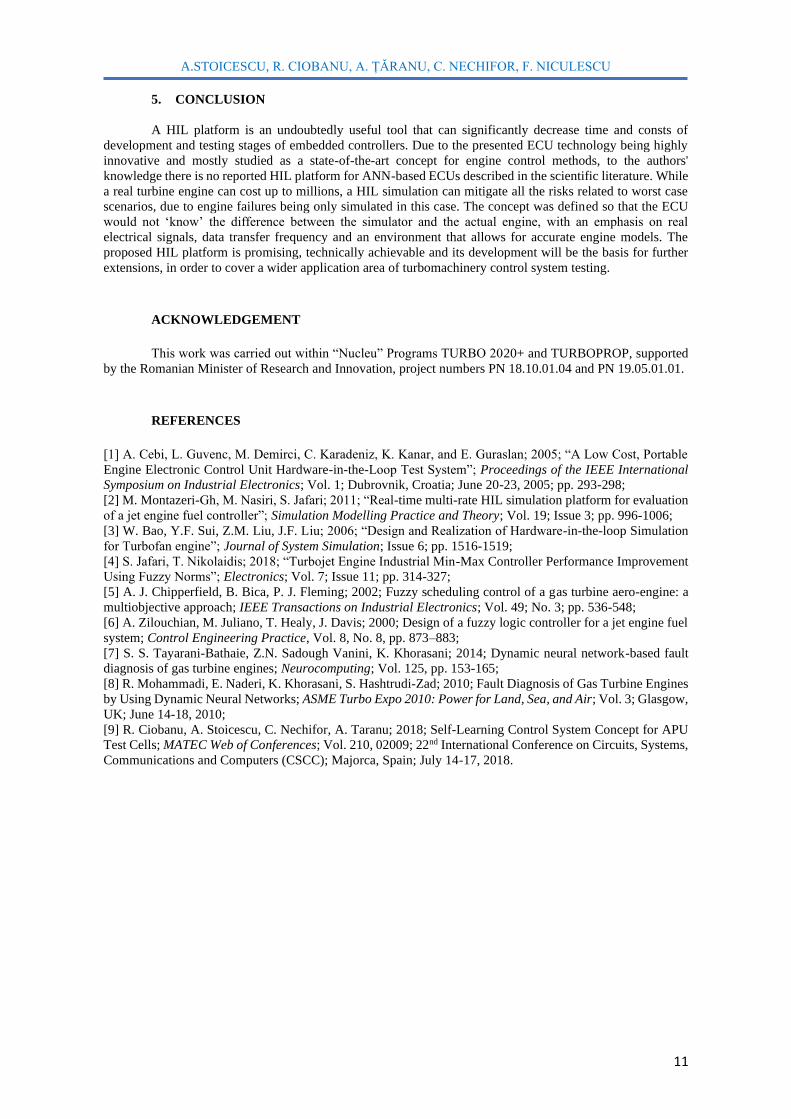
The HIL platform suggested for this type of controller will basically have these main roles: a)
simulation of the turbine engine the real ECU interacts with; b) electrical signal generation towards the ECU
as if the model had real sensors; c) receive and process signals from the ECU to influence model operation
accordingly; d) allow user to control the throttle control of the simulated engine; e) user interface, error
management and data logging. This essentially acts as a closed-loop control system, where feedback is taken
from the simulated engine, processed by the ECU, which then controls the engine simulation, as seen in Fig.
3.
A.STOICESCU, R. CIOBANU, A. ȚĂRANU, C. NECHIFOR, F. NICULESCU
9
There are several aspects to be considered when designing a proper HIL platform for a turbine engine. Most of
them revolve around the fact that the HIL testing needs to perform real-time plant simulation. This requires
that everything on the platform needs to be compatible with real-time computing: processor, operating system,
runtime environment, control loop architectures, signal acquisition and processing frequency/bandwidth. The
engine model needs to execute at the same rate as the actual physical engine and be accurate (complex) enough
for the purpose of the simulation.
Another fact is how much of the engine subsystems (engine components, sensors, actuators, etc.) are
simulated as software routines or provided as real subsystems connected to the platform. While real
components would make the simulation more accurate, an accurate enough submodel for each subsystem would
be more cost effective. This is true in terms of parts needed for implementation, long-term reliability, however
the work to create each model needs to be taken into account.
Fig. 3 HIL platform block and data flow diagram
The model
The engine chosen to be test subject for the HIL platform simulation is a miniature single-shaft turbine
engine, consisting mainly of a turbine, a centrifugal clutch, a starter generator and a rotor shaft. In order to
determine the dynamic model for this specific machinery, the real engine will be submitted to several operation
stages. Based on determined performance map, transfer functions will be defined. The measurement setup
includes: fuel pump control voltage, pump output fuel flow, combustion output valve flow, intake valve flow,
igniter control voltage, injector temperature sensor, gas intake pressure and temperature sensors, compressor
speed sensor, clutch speed sensor, starter generator control voltage.
The test rig is designed so that it can integrate and extend to a large variety of process instrumentation
sensors and systems with the data acquisition setup. The data acquisition setup is based on an embedded
controller featuring an FPGA and a real-time CPU running Linux Real-Time OS.
The dynamic model of the engine includes the following major subsystems: start sequencer,
combustion chamber, starter stop and virtual instrumentation. The start sequencer subsystem models the
starting sequence of the engine and its ignition elements, following a specific logic so that the ignition is
successfully simulated. The combustion chamber subsystem models the gas dynamic and mechanical processes
in the chamber. The starter stop subsystem models the cut off sequence when the conditions are met. The virtual
instrumentation facilitates parameters visualization and control access to the simulation. A generic overview
of the model architecture developed in Simulink is shown in Fig. 4.
The turbine engine’s dynamic model is developed by simulating individual components rather than a
whole SS black box type model (e.g. EHCV dynamic model, fuel Injector dynamic model, combustion chamber
model).
HIL platform I/O
Starting from Fig. 3, we can deduce that, from a user perspective, the only main variable control
towards the (simulated) engine, in the suggested architecture, is the throttle lever. An actual lever will be
provided, as well as the possibility of manual control via software interface. Other controls are
activation/deactivation of sequences, including engine simulation operation stages, (simulated) environment
data input and auxiliary settings (data logging, signal range etc).

Hardware in the loop test platform concept for adaptive turbine engine controller
10
All engine instrumentation will be simulated and generated as real signals towards the ECU. Simulated sensor
data towards the ECU include mainly the following output signals: Throttle Lever position, Igniter Check Valve
1/0, Igniter Check Valve Flow, Fuel Check Valve 1/0, Fuel Check Valve Flow, Gas Turbine Speed, Exhaust
Gas Temperature, Starter Generator Speed, Starter Generator 1/0, Centrifugal Clutch Speed, Intake Gas
Temperature, Atmospheric Pressure, True Air Temperature, Glow Plug 1/0, Fuel Injector Temperature, Fuel
Pump 1/0, Fuel Pump Flow, Engine Mode 1/0 and Vibration.
Fig. 4 Engine dynamic model – generic blocks overview
HIL platform architecture
The architecture revolves around a configuration, with an embedded controller similar to the
previously mentioned data acquisition setup, featuring: a real-time 1.33 GHz dual-core CPU, 1 GB RAM
memory, Linux Real-Time OS, an I/O chassis including a ±10 V 250 kS/s, 32-channel Analog Input voltage
module, an 8-channel thermocouple input module, a 5V/TTL bidirectional I/O module and a ±10 V, 25 kS/s
16-channel Analog Output voltage module. The I/O modules configuration is designed to cover all signal types
and number listed above, with the appropriate sample rate.
The VeriStand software will be used to run the simulation including the engine model developed in
Simulink. This environment facilitates configuring I/O channels, data logging, stimulus generation for the
ECU. VeriStand project files will be transferred to the Real-Time controller, while a remote computer will be
permanently connected to it for user interface, logging, alarms and other such functions.
4. CHALLENGES AND FUTURE WORK
In this case, there are mainly two clearly defined systems operating in a loop: the specific control
system (ECU) and the simulated engine system. For the HIL platform, a real-time embedded controller is
chosen for the application, which is a low to medium sized hardware configuration controller. The
configuration, in terms of both hardware resources and I/O specifications, is specifically designed for a) the
type of ECU described earlier in this paper, and b) the model complexity. One of the main challenges regarding
the implementation is the balance between the model complexity and hardware resources. The model needs to
be accurate enough but not more complex than necessary for this specific purpose.
Future implementations of HIL platforms will include designing and configuring a more advanced
HIL system. This is aimed at having a higher degree of integration with mathematical models and physical
interfaces, in order to perform HIL testing of the highest level for a wider range of control systems. Building
such a system will involve assembling and configuring all components for integration, testing and proper
operation. Instrumentation and communication lines are also an important part. Several interfaces and interface
modules and converters need to be properly implemented, while full compatibility and sustaining real-time
frequency might prove to be a challenge. Software configuration includes routines such as: connection to the
control system, running the model, data logging and interface.
Testing any of the HIL platforms will be made by simulating inputs, analysing outputs, evaluating
time response, functionality and safety and submitting to specific scenarios. Optimization stages provide the
means to address failures, inconsistencies, or other issues following testing stages.
A.STOICESCU, R. CIOBANU, A. ȚĂRANU, C. NECHIFOR, F. NICULESCU
11
5. CONCLUSION
A HIL platform is an undoubtedly useful tool that can significantly decrease time and consts of
development and testing stages of embedded controllers. Due to the presented ECU technology being highly
innovative and mostly studied as a state-of-the-art concept for engine control methods, to the authors'
knowledge there is no reported HIL platform for ANN-based ECUs described in the scientific literature. While
a real turbine engine can cost up to millions, a HIL simulation can mitigate all the risks related to worst case
scenarios, due to engine failures being only simulated in this case. The concept was defined so that the ECU
would not ‘know’ the difference between the simulator and the actual engine, with an emphasis on real
electrical signals, data transfer frequency and an environment that allows for accurate engine models. The
proposed HIL platform is promising, technically achievable and its development will be the basis for further
extensions, in order to cover a wider application area of turbomachinery control system testing.
ACKNOWLEDGEMENT
This work was carried out within “Nucleu” Programs TURBO 2020+ and TURBOPROP, supported
by the Romanian Minister of Research and Innovation, project numbers PN 18.10.01.04 and PN 19.05.01.01.
REFERENCES
[1] A. Cebi, L. Guvenc, M. Demirci, C. Karadeniz, K. Kanar, and E. Guraslan; 2005; “A Low Cost, Portable
Engine Electronic Control Unit Hardware-in-the-Loop Test System”; Proceedings of the IEEE International
Symposium on Industrial Electronics; Vol. 1; Dubrovnik, Croatia; June 20-23, 2005; pp. 293-298;
[2] M. Montazeri-Gh, M. Nasiri, S. Jafari; 2011; “Real-time multi-rate HIL simulation platform for evaluation
of a jet engine fuel controller”; Simulation Modelling Practice and Theory; Vol. 19; Issue 3; pp. 996-1006;
[3] W. Bao, Y.F. Sui, Z.M. Liu, J.F. Liu; 2006; “Design and Realization of Hardware-in-the-loop Simulation
for Turbofan engine”; Journal of System Simulation; Issue 6; pp. 1516-1519;
[4] S. Jafari, T. Nikolaidis; 2018; “Turbojet Engine Industrial Min-Max Controller Performance Improvement
Using Fuzzy Norms”; Electronics; Vol. 7; Issue 11; pp. 314-327;
[5] A. J. Chipperfield, B. Bica, P. J. Fleming; 2002; Fuzzy scheduling control of a gas turbine aero-engine: a
multiobjective approach; IEEE Transactions on Industrial Electronics; Vol. 49; No. 3; pp. 536-548;
[6] A. Zilouchian, M. Juliano, T. Healy, J. Davis; 2000; Design of a fuzzy logic controller for a jet engine fuel
system; Control Engineering Practice, Vol. 8, No. 8, pp. 873–883;
[7] S. S. Tayarani-Bathaie, Z.N. Sadough Vanini, K. Khorasani; 2014; Dynamic neural network-based fault
diagnosis of gas turbine engines; Neurocomputing; Vol. 125, pp. 153-165;
[8] R. Mohammadi, E. Naderi, K. Khorasani, S. Hashtrudi-Zad; 2010; Fault Diagnosis of Gas Turbine Engines
by Using Dynamic Neural Networks; ASME Turbo Expo 2010: Power for Land, Sea, and Air; Vol. 3; Glasgow,
UK; June 14-18, 2010;
[9] R. Ciobanu, A. Stoicescu, C. Nechifor, A. Taranu; 2018; Self-Learning Control System Concept for APU
Test Cells; MATEC Web of Conferences; Vol. 210, 02009; 22nd International Conference on Circuits, Systems,
Communications and Computers (CSCC); Majorca, Spain; July 14-17, 2018.
TURBO, vol. VI (2019), no. 2
12
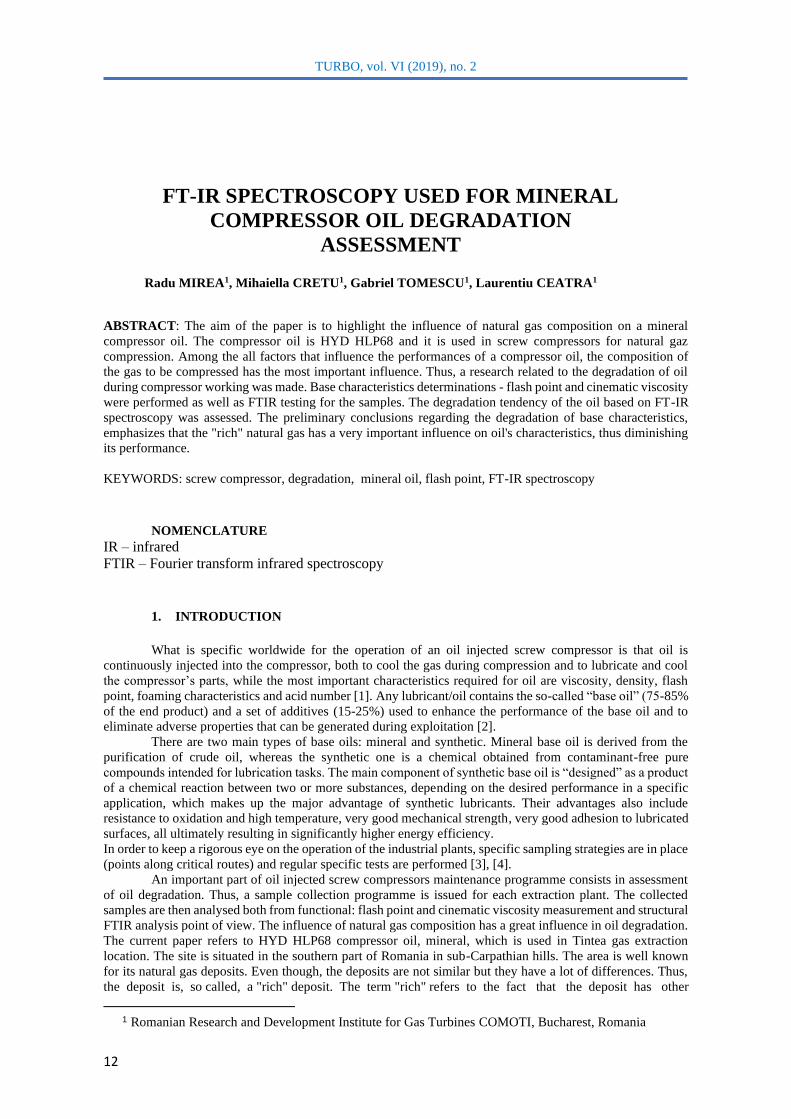
FT-IR SPECTROSCOPY USED FOR MINERAL
COMPRESSOR OIL DEGRADATION
ASSESSMENT Radu MIREA1, Mihaiella CRETU1, Gabriel TOMESCU1, Laurentiu CEATRA1
ABSTRACT: The aim of the paper is to highlight the influence of natural gas composition on a mineral
compressor oil. The compressor oil is HYD HLP68 and it is used in screw compressors for natural gaz
compression. Among the all factors that influence the performances of a compressor oil, the composition of
the gas to be compressed has the most important influence. Thus, a research related to the degradation of oil
during compressor working was made. Base characteristics determinations - flash point and cinematic viscosity
were performed as well as FTIR testing for the samples. The degradation tendency of the oil based on FT-IR
spectroscopy was assessed. The preliminary conclusions regarding the degradation of base characteristics,
emphasizes that the "rich" natural gas has a very important influence on oil's characteristics, thus diminishing
its performance.
KEYWORDS: screw compressor, degradation, mineral oil, flash point, FT-IR spectroscopy
NOMENCLATURE
IR – infrared
FTIR – Fourier transform infrared spectroscopy
1. INTRODUCTION
What is specific worldwide for the operation of an oil injected screw compressor is that oil is
continuously injected into the compressor, both to cool the gas during compression and to lubricate and cool
the compressor’s parts, while the most important characteristics required for oil are viscosity, density, flash
point, foaming characteristics and acid number [1]. Any lubricant/oil contains the so-called “base oil” (75-85%
of the end product) and a set of additives (15-25%) used to enhance the performance of the base oil and to
eliminate adverse properties that can be generated during exploitation [2].
There are two main types of base oils: mineral and synthetic. Mineral base oil is derived from the
purification of crude oil, whereas the synthetic one is a chemical obtained from contaminant-free pure
compounds intended for lubrication tasks. The main component of synthetic base oil is “designed” as a product
of a chemical reaction between two or more substances, depending on the desired performance in a specific
application, which makes up the major advantage of synthetic lubricants. Their advantages also include
resistance to oxidation and high temperature, very good mechanical strength, very good adhesion to lubricated
surfaces, all ultimately resulting in significantly higher energy efficiency.
In order to keep a rigorous eye on the operation of the industrial plants, specific sampling strategies are in place
(points along critical routes) and regular specific tests are performed [3], [4].
An important part of oil injected screw compressors maintenance programme consists in assessment
of oil degradation. Thus, a sample collection programme is issued for each extraction plant. The collected
samples are then analysed both from functional: flash point and cinematic viscosity measurement and structural
FTIR analysis point of view. The influence of natural gas composition has a great influence in oil degradation.
The current paper refers to HYD HLP68 compressor oil, mineral, which is used in Tintea gas extraction
location. The site is situated in the southern part of Romania in sub-Carpathian hills. The area is well known
for its natural gas deposits. Even though, the deposits are not similar but they have a lot of differences. Thus,
the deposit is, so called, a "rich" deposit. The term "rich" refers to the fact that the deposit has other
1 Romanian Research and Development Institute for Gas Turbines COMOTI, Bucharest, Romania

R. MIREA, M. CREȚU, G. TOMESCU, L. CEATRĂ
13
hydrocarbons along with methane (CH4).
According to the literature, "rich" deposits have less CH4 and more C2-C7 fractions called gasoline.
These gasolines are mainly responsible for the degradation of oils. The matter of developing a specific type of
oil for natural gas compression equipment, in Romania, has not been seriously addressed so far, being used
only mineral base oils or synthetic PAO base oils having as components that degrade at the same rate. The
explanation resides in the natural gas solubility in mineral oils. The gas dissolved in mineral oils leads to a
constantly decreasing viscosity and flash point, because it contains molecules similar in structure, mainly C-H
bonds, unlike dieter and PAG based synthetic oils, which are polar molecules.
2. PAPER CONTENT
2.1. Determination of base characteristics of the obtained samples
HYD HLP68 compressor oil is a mineral oil which is commonly used for natural gas compression
applications with an applicability domain in the areas where the natural gaz deposits are "poor", thus contains
less C2 - C7 hydrocarbons and more CH4.
Hydraulic oil HLP69 is a mineral bese oil produced by LiquiMoly and was succesfully used for air
and "poor" gas compression. The main purpose of the current paper is to assess the behavoiur of this kind of
oil in an oil injected screw compressor which compress a "rich" gas. Thus the oil was put in an oil injected
screw compressor deployed at Tintea extraction site and monitored during 3800 working hours.
The paper presents smpling tests made for 900, 2000 and 3800 working hours. The monitored
characteristics of the oil were: cinematic viscosity at 40°C, flash point and structural transformations by FT-IR
spectroscopy. The obtained values for the viscosity at 400C emphasises a 55-64 % decrease and for flash piont
a 83-89 % decrease compared with the new, unused sample as seen in table 1.[6,7]
Tabel 1: Obtained values for HYD HLP68 oil
Determined characteristic / Sample Viscosity at 40 °C,
[mm2/s] Flash point, [C]
Method SR ISO 3104-2002 ASTM D92 - 05a
Equipment SCAVINI equipment
Ubbelohde COMECTA
SCAVINI
equipment
Values according to technical sheet BASF TI/EVO 0010
e / Nov. 2015 68 240
900 h 30.7 40.7
2000 h 24 27.3
3800 h 23.4 26.8
2.2. FTIR tests of the obtained samples
Fourier transform infrared (FTIR) spectroscopy is a versatile tool used to detect common
contaminants, lube degradation by-products and additives within lubricating oils. It has become a widely used
technique for quickly assessing multiple lubricant characteristics. This test method is relatively quick to
perform and is capable of simultaneously detecting multiple parameters, including antioxidants, water, soot,
fuel, glycol, oil oxidation and certain additives. Adding to the power of this qualitative measurement, the size
of the peaks is a direct indication of the amount of the specific material found in the sample. Since most used
oil samples are complex mixtures of thousands of different molecules, including base oil molecules, additives,
oil degradation by-products, wear debris and contaminants, the infrared spectrum of the sample is typically
complex and can be difficult to interpret with any degree of certainty, as some wave numbers may overlap.
Despite these drawbacks, FTIR still has great value in used oil analysis and is employed by the majority of oil
analysis labs as a screening tool. [5]
The tests have been performed within Physical-Chemical Determination lab on a FTIR Spectrum Oil
Express Series 100, v 3.0 spectrometer provided by Perkin Elmer which has an auto sampler. (fig. 2)
The equipment is specially designed for FTIR analysis of used oils, made of: sample purge compartment,
optical system in spectral domain 7800-370 cm-1 having a resolution of 0.5 cm-1, intermediary IR detector,
electronic system with signal processor Motorola DSP56303 and Motorola 68340, PC, Spectrum Software,
auto sampler. The used solvent is n-heptane. The spectrometer is capable of displaying the results both in for
of absorbance or transmittance. Absorbance (A/cm) is the most used way of displaying the results since is
proportional with the concentration of the specific funcyional group within the sample [8]. As is shown in table
2, after analysing the results, it can be observed that there are some differences between tested samples. After
analysing the quantitative results, it can be observed the water content slightly increases as well as OH groups.
There are traces of oxidation of the nitrogen groups (NOx ) which are mainly found in the anti-wear additive.
SO4 groups are also present in the oil and are correlated with sulphatation of the oil.

FT-IR Spectroscopy used for mineral compressor oil degradation assessment
14
Fig. 2 Spectrum Oil Express Series 100, v 3.0
Table 2. FTIR results for HLP HYD68
Characteristic HLP HYD68
K1 - 900 h
HLP HYD68
K1 - 2000 h
HLP HYD68
K1 - 3800 h
Anti-wear (A/cm) 0.61 0.55 0.26
Hydroxi (A/cm) 0 0 0.68
NOx (A/cm) 2.35 2.2 1.58
NOx vs Oxid (A/cm) 4.45 7.77 2.32
Oxidation (A/cm) 1.18 3.21 1.26
Soot 1980 (A/cm) 0.06 0.36 0
Soot 3800 (A/cm) 2.29 2.19 1.14
Sulf vs. Oxid (A/cm) 6.72 10.48 3.38
Water (%) 0 0 0.02
3. CONCLUSIONS
• As a result of sample analysis as shown in tables 1 and 2, it can be seen that the values of base
characteristics (cinematic viscosity and flash point) are far from the ones stated in the technical datasheet of
the oil.
• Table 2 shows the changes within the chemical composition of the oil during its working period: anti-
wear additives are almost finished, nitrous and sulphating occurs and also soot particles.
• After analysing FT-IR spectra, it is clearly highlighted that at 3800 working hours, there are more
short carbon chains in the structure of the oil due to the fact that the gasoline which are present in the "rich"
gas are continuously affecting the long carbon chains of the oil. Also, the presence of gasoline (C3 - C7) in the
compressed gas makes them accumulate in the oil.
4. ACKNOWLEDGEMENTS
The research has been carried out within Program Nucleu, project PN 19.05.02.02, financed by Romanian
Ministry of Research and Innovation.
5. References
[1] ***Physical Properties of Lubricants, Engineering Tribology, Tribology Series Vol. 24, 1993, Pp 11–57
[2] *** Componenta lubrifiantilor, http://www.xoil.ro/lubrifianti/tribologie/
[3] Vidrighin C., “Strategii pentru evaluarea analitică a lubrifianţilor industriali”, 2013,
http://www.ttonline.ro/autori/costin-vidrighin
[4] Vidrighin C., “Programe de analiza a lubrifiantilor”, 2013, http://www.ttonline.ro/autori/costin-vidrighin]
[5] Wright J. "Benefits of FTIR oil analysis", Machinery lubrication, no. 8/2015
[6] SR EN ISO 3104:2002/AC:2002 - Produse petroliere. Lichide opace si transparente. Determinarea
viscozitatii cinematice si calculul viscozitatii dinamice;
[7] SR EN ISO 2592:2018 - Petrol şi produse conexe. Determinarea punctelor de inflamabilitate şi de
aprindere. Metoda Cleveland cu vas deschis;
[8] Determinarea gradului de uzură a lubrifianților, prin analiza FTIR
TURBO, vol. VI (2019), no. 2
15
LOX/LCH4 UPPER STAGE DEVELOPMENT
STRATEGIES FOR FUTURE LAUNCHERS
Theodora ANDREESCU1, Andreea MANGRA1, Valeriu VILAG1, Ion MALAEL1,
Alexandru CANCESC1, Jeni VILAG1, Dan IFRIM1, Simona DANESCU1
ABSTRACT: The reduction of Earth-to-orbit launch costs in conjunction with an increase in Launcher
reliability and operational efficiency are the key requirements of future space transportation systems. This paper
underlines the progress in LOX/CH4 upper stage engine development carried out by COMOTI and also being
provided the prediction of the rocket engine performances at the conceptual and preliminary stages of design.
This paper focuses on the trade-off studies for the engine architecture definition, considering both open and
closed thermodynamic cycles. Various subsystems configurations have been taken into account, analyzing the
optimum configuration in terms of performance. The main operating and geometrical parameters were
discussed: combustion pressure, optimum mixture ratio, turbine pressure ratio, thrust chamber geometry, and
the turbopump size is addressed.
KEYWORDS: upper stage, liquid rocket engine, turbopump, LOX/CH4 cryogenic propellant, thrust chamber
NOMENCLATURE
A – turbine characteristic area �̇� – gas flow rate
𝑨𝒆 - nozzle exit diameter 𝑷𝒑𝒐𝒙 – liquid oxygen pump power
𝑨𝒕 – nozzle throat diameter 𝑷𝒑𝒇𝒖𝒆𝒍 – liquid methane pump power
𝑨𝒄 – combustion chamber area 𝑷𝑻 – turbine power
𝑻𝒄 – combustion temperature 𝒏𝒔 – pump specific rotational speed
𝜸 - specific heat ratio 𝜶 – turbine flow angle
𝑪𝒑- specific heat capacity 𝝈𝒑∗ - turbine pressure losses
𝒑𝒄 – combustion pressure R – gas constant
𝑪𝑭 – thrust coefficient 𝝆 – density
𝒄∗ - characteristic velocity M – Mach number
𝒈𝟎 – gravitational constant 𝒉𝒑𝒇, 𝒉𝒑𝒎 – turbine blades hight
𝒙𝒑𝒇, 𝒙𝒑𝒎, - axial width
1. INTRODUCTION
As the present trend in rocket engine development recommends a high versatility and low launch
service cost, while preserving high performance, expander cycle upper stage based on LOX/LCH4 being a key
competitiveness factor recognized by the market. The new ESA-VEGA Development Program aimed at
improving the VEGA competitiveness throughout three major high-level objectives: decrease of the Vega C
Yearly Launch System Service Cost for lower price per launch into the reference orbit with a target of 10% as
cost reduction in production and operations, Increase of the VEGA C Launch System Margins for higher
mission flexibility complementarily with Ariane 6 Launch System and to Increase of the VEGA C Launch
System Services Versatility for ad-hoc launch services solutions based on available products, including small
spacecraft mission services (SSMS-C), dual – launch services (VESPA-C) and orbit transfer services
(VENUS). Also, the introduction of VEGA-C that cover large part of the LEO payloads has led to focus main
motivations for VEGA-EVO of the following main drivers:
1 Romanian Research and Development Institute for Gas Turbines COMOTI, Bucharest, Romania
T.ANDREESCU, A.MANGRA, V.VILAG, I.MĂLĂEL, A.CÂNCESCU, J.VILAG, D.IFRIM, S.DĂNESCU
16
- Competitive: recurring Cost 20% less than VEGA C target price;
- Green: elimination of all the toxic propellants;
- Flexible: multiple altitudes and orbital planes;
- Scalable: a family of launchers suitable for different payloads.
As regards the upper stage, there is a pronounced need to develop a new class engine based on “green
propellant” and relatively low power due to the development of low-costs and environmental options. The main
distinguishing properties of the upper-stage compared to the first stage engines are as follows: the engine must
start in a vacuum, while engines of previous stages continue to operate; the specific impulse must increase by
using high-nozzle area ratios.
Fully cryogenic LOX/LCH4 is one of the most promising liquid-rocket-engine technologies due to
the following advantages: reduced dry mass, compact architecture, cooling capabilities, reusability issues and
mission flexibility. [4]
Methane is a soft cryogenic that is not corrosive and has low toxicity, therefore being easier to store,
requires less insulation and fewer concerns than hydrogen fuel systems. Also, liquid methane is about six times
denser than hydrogen; thus methane tanks require a smaller storage volume than comparable hydrogen tanks.
Furthermore, methane has exceptional heat capacity properties that provide good cooling properties for
expander cycle; methane fuel has lower pressure drops in regenerative cooling channels compared to kerosene
fuel. In addition, methane is natural gas, being 5 to 10 times cheaper to acquire and store than liquid hydrogen.
[18]
The highest risk involved in the expander cycle engine development is to match the coolant circuit
capability to the engine requirements. The working pressure inside the combustion chamber imposed a
sufficient amount of heat to be extracted from the coolant circuit to power the turbomachinery while still
providing a suitable cooling in order to avoid structural damages. This risk can be mitigated through numerical
analysis, combustion chamber components testing and engine test bench experimental testing. Any variation
in the extracted energy can be controlled through orifices to adjust the distribution of flow between the
combustion chamber and the turbine.
None launcher upper stage based on the combination LOX/LCH4 has yet flown, but ground testing
of such systems is being carried out, as an example, the upper stage LM10-MIRA foreseen for the evolution of
VEGA-E launcher.
Aim of the current study is to evaluate the performance of an oxygen/methane expander system
intended to the upper stage with a specific focus on thrust chamber and feeding system design.
The clean-burning, non-toxic, high vapor pressure propellants provide significant advantages for
reliable ignition in space. The main components in a cryogenic upper stage engine are the thrust chamber
assembly; the propellant feed control system, the turbopumps, the propellant tank pressurization system, the
electrical system, the hydraulic control system and the flight instrumentation system.
A liquid rocket upper stage can be divided into two main parts: a feeding system and thrust chamber
assembly. The feeding system suitable for this type of application is based on turbopumps that are designed to
provide the required energy to the propellant for an optimum combustion process. Another technique to
characterize the engine cycle is based on the turbine and thrust chamber arrangement, the cycle is classified as
open or closed. Advantages of a well-established power cycles include lower development cost, reduced
development risk, repeatable starts and a compact assembly.
For each configuration, the following design steps were performed:
- Definition of the engine operational parameters;
- Thrust chamber geometry definition;
- Pump concept design;
- Turbine concept design.
This procedure allows estimating the engine performance based on sub-systems concept design
procedure. For higher performance, mechanical pumps must be used to feed the combustion chamber.
2. LIQUID ROCKET ENGINE CYCLE DESIGN
Considering a thrust range of 30𝑘𝑁, a LOx / CH4 cycle analysis was performed to determine the most
performant global architecture. The investigation has been channeled on three directions: gas generator cycle,
staged combustion cycle (both fuel-rich and oxidizer-rich) and expander cycle. This analysis allows selecting
thrust chamber performance, turbopump assembly power, thrust chamber size and cooling system
configuration.
LOX/LCH4 upper stage development strategies for future launchers
17
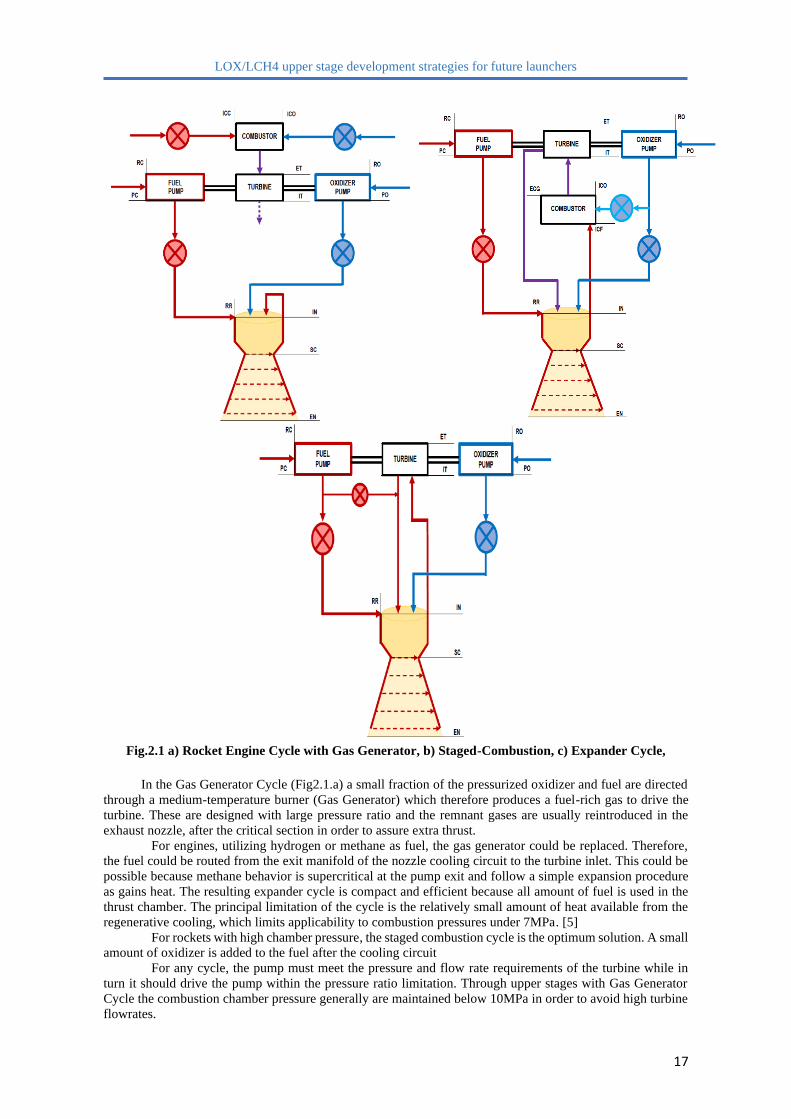
Fig.2.1 a) Rocket Engine Cycle with Gas Generator, b) Staged-Combustion, c) Expander Cycle,
In the Gas Generator Cycle (Fig2.1.a) a small fraction of the pressurized oxidizer and fuel are directed
through a medium-temperature burner (Gas Generator) which therefore produces a fuel-rich gas to drive the
turbine. These are designed with large pressure ratio and the remnant gases are usually reintroduced in the
exhaust nozzle, after the critical section in order to assure extra thrust.
For engines, utilizing hydrogen or methane as fuel, the gas generator could be replaced. Therefore,
the fuel could be routed from the exit manifold of the nozzle cooling circuit to the turbine inlet. This could be
possible because methane behavior is supercritical at the pump exit and follow a simple expansion procedure
as gains heat. The resulting expander cycle is compact and efficient because all amount of fuel is used in the
thrust chamber. The principal limitation of the cycle is the relatively small amount of heat available from the
regenerative cooling, which limits applicability to combustion pressures under 7MPa. [5]
For rockets with high chamber pressure, the staged combustion cycle is the optimum solution. A small
amount of oxidizer is added to the fuel after the cooling circuit
For any cycle, the pump must meet the pressure and flow rate requirements of the turbine while in
turn it should drive the pump within the pressure ratio limitation. Through upper stages with Gas Generator
Cycle the combustion chamber pressure generally are maintained below 10MPa in order to avoid high turbine
flowrates.
T.ANDREESCU, A.MANGRA, V.VILAG, I.MĂLĂEL, A.CÂNCESCU, J.VILAG, D.IFRIM, S.DĂNESCU
18
A pump-fed rocket engine with turbine extracted from the cooling system is referred to an expander
cycle, being intended for upper-stage, considering its limitation in terms of available power when compared to
staged-combustion and gas generator cycles. The absence of gas generator allows for easier start-up sequences
and avoids the controlling of the mixture ratio of the gas generator. From other points of view, the expander
cycle is not suitable for high thrust level, due to the limitation imposed by the power that could be extracted
from the cooling process of the thrust chamber.
In the Expander Cycle (Fig. 2.1.c) the chamber pressure is limited due to the amount of heating
available for the turbine working fluid. [5] At the same imposed combustion pressure, the expander cycle
requires a higher pump discharge pressure. For the stage-combustion cycle, the chamber pressure could attain
a chamber pressure of about 20MPa because the preburner provide high-energy working fluid for the turbine
[16]; 20MPa is actually an upper limit for the turbine drive cycle because for a given turbine inlet temperature
and turbopump efficiency, the required pump discharge pressure rises at higher quotations. Expander cycles
are reliable and have multiple restart capability, while the LOX/LCH4 offers high specific impulse with
attractive bulk density and handling characteristics [19].
For the Gas Generator Cycle, turbine pressure ratios of about 20 are required in order to minimize the
flow rate of the turbine working and therefore maximizing the specific impulse. For the expander and staged-
combustion cycles, the optimum turbine pressure ratios are typically less than 1.5, because of the large turbine
working fluid available. For that configuration, turbopump assembly weight is greater comparative to expander
and staged-combustion cycle. These differences originate from pump discharge pressure differences. In order
to gain high system efficiency, pumps in expander and staged-combustion cycle either operate at higher speed
or have more stages than those in the gas generator
2.1 CASE STUDY
Recent studies for new generation upper stage cryogenic engines in Europe with the main goal to
increase the reliability and performance, have engines with restart capability and low development costs
identify expander cycles as a promising technology. The main elements of an expander cycle are a tank system,
turbopump system, cooling system, injector system, main combustion chamber and exhaust nozzle [1].
For this type of technology, the heat exchange by regenerative cooling is a critical point in expander
cycles as the hot gases formed need to drive the turbine. When is used a regenerative cooling technique, the
coolant, which is the fuel because oxidizers at high temperature lead to corrosion issues, is passes in cooling
channels along with the thrust chamber before it is redistributed into the combustion chamber [17]. The major
limitation is the relatively low achievable combustion chamber pressure level, which ultimately limits the
maximum thrust level. Therefore, the expander cycle is a proper candidate for an upper stage.
The LOX/LCH4 engine mixture ratio has been set to 3.36 in order to minimize the turning inlet
temperature to 1100 K and to be far from the stoichiometric ratio. In order to avoid the two-phase flow in the
cooling circuit, for the LCH4 case, the pressure must be higher than the critical pressure, of 45.9 bars. [16]
For this study, considering the potential of a higher density of liquid methane compared to liquid
oxygen, a system with a single turbine acting both fuel and oxidizer pumps is considered. For an optimized
cooling of the thrust chamber, the total mass flow rate flows in the cooling system.
3. PERFORMANCE EVALUATION AND THRUST CHAMBER PRELIMINARY DESIGN
Fuel, oxidizer and mixture ratio determines the start characteristics of the flow field in the combustion
chamber and further the chamber geometry influences the nozzle performance. In this paper, it has been
analyzed how a combustion pressure in 1-10MPa influences the mixture ratio choice for LOX/CH4
combination. Also, an expansion ratio (𝐴𝑒 𝐴𝑡⁄ ) with a variation in the range of 10 – has been investigated.
The specific heat ratio(𝛾), the combustion temperature (𝑇𝑐), the molar mass, the density and the
specific heat capacity (𝐶𝑝) for mixtures of fuel and oxidizer were obtained from CEA. From the specific heat
ratio, the value of the Van Kerckhove function Γ [2] was calculated:
Γ = √𝛾 (2
𝛾 + 1)
(𝛾+1
2(𝛾−1))
(3.1)
The Mach number (M) at any point in the thrust chamber could be found from solving the area-Mach
number relation:
(𝐴
𝐴𝑡
)2
=1
𝑀2[
2
𝛾 + 1(1 +
𝛾 − 1
2𝑀2)]
𝛾+1𝛾−1
(3.2)
LOX/LCH4 upper stage development strategies for future launchers
19
The performance parameters such as thrust coefficient 𝐶𝐹 and characteristic velocity 𝑐∗ could be
expressed with the following relationships [1]:
𝐶𝐹 = Γ√(2𝛾
𝛾 − 1) (1 − (
𝑝𝑒
𝑝𝑐
)
𝛾−1𝛾
) + (𝑝𝑒
𝑝𝑐
−𝑝𝑎
𝑝𝑐
)𝐴𝑒
𝐴𝑡
(3.3)
c∗ =√γR𝑇𝑐
Γ (3.4)
Knowing the thrust coefficient and characteristic velocity allows calculating the thrust chamber specific
impulse:
(𝐼𝑠𝑝)𝑖𝑑𝑒𝑎𝑙
=𝐹
𝑔0�̇�=
𝐶𝐹c∗
𝑔0
(3.5)
Selecting the design point chamber pressure is a key decision in the development of a new rocket engine.
Higher chamber pressure generally enables higher impulse. For an expander cycle, selection of the chamber
pressure is important since the extracted power to operate the turbopump system is extracted from the
combustion chamber cooling circuit.
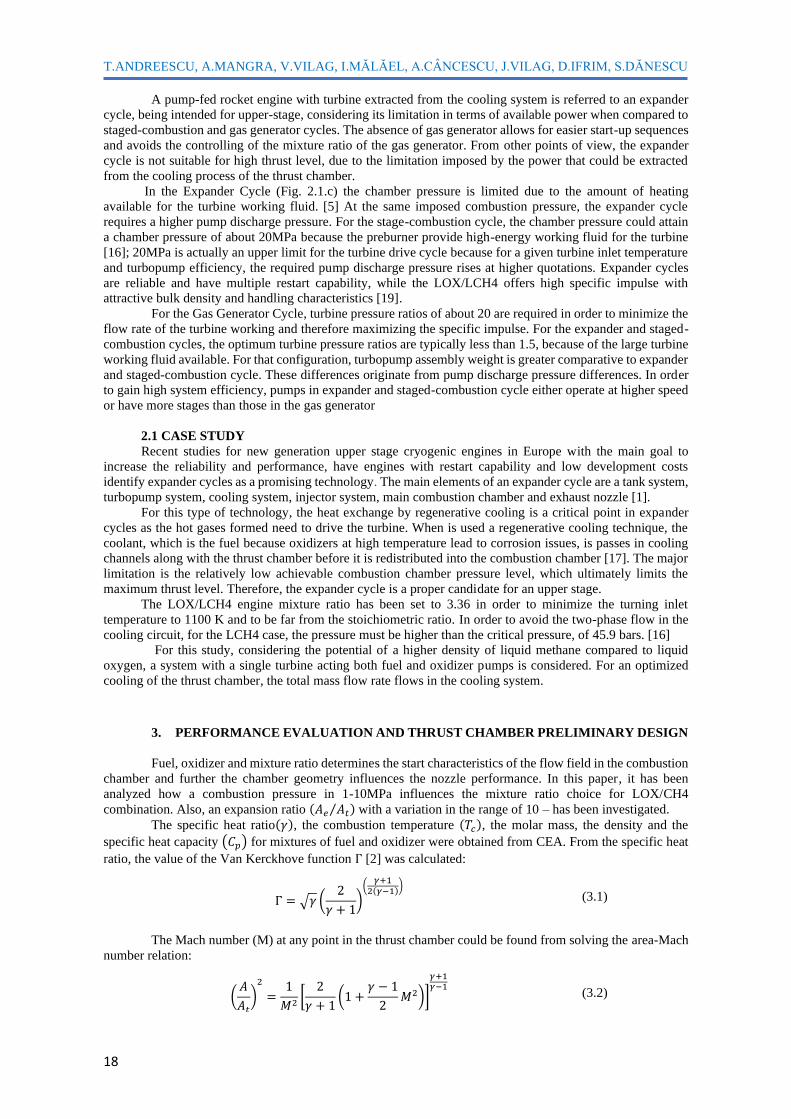
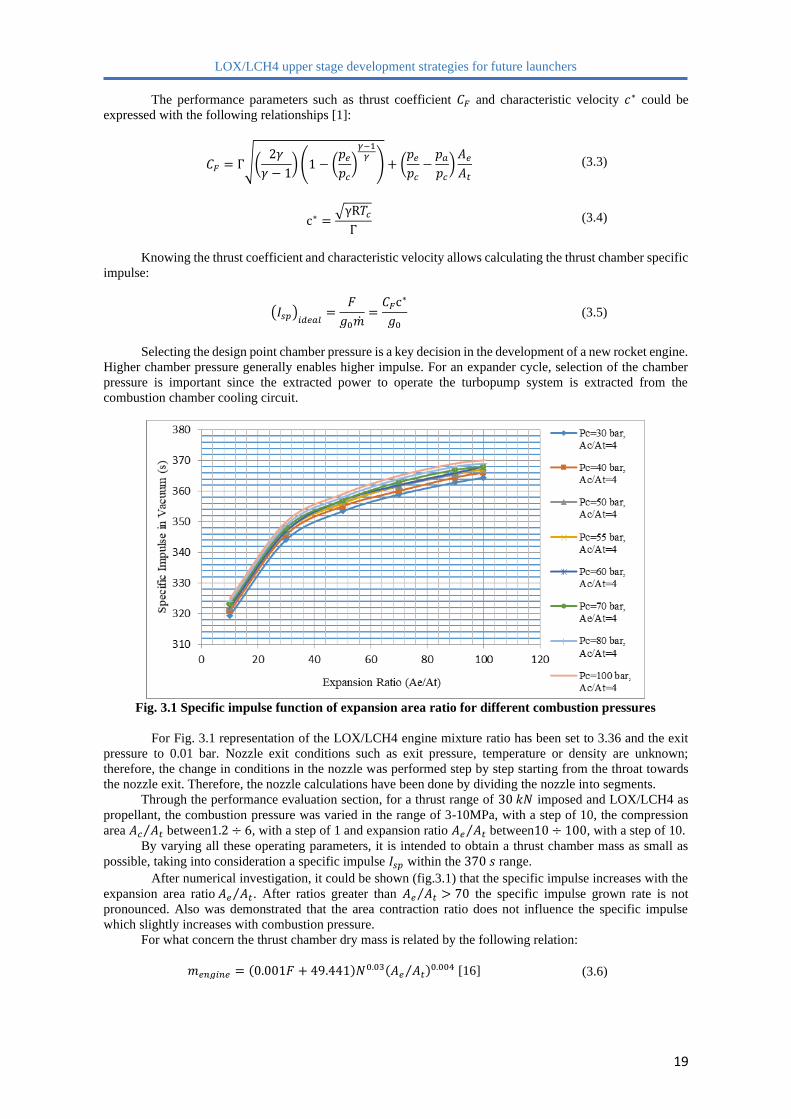
Fig. 3.1 Specific impulse function of expansion area ratio for different combustion pressures
For Fig. 3.1 representation of the LOX/LCH4 engine mixture ratio has been set to 3.36 and the exit
pressure to 0.01 bar. Nozzle exit conditions such as exit pressure, temperature or density are unknown;
therefore, the change in conditions in the nozzle was performed step by step starting from the throat towards
the nozzle exit. Therefore, the nozzle calculations have been done by dividing the nozzle into segments.
Through the performance evaluation section, for a thrust range of 30 𝑘𝑁 imposed and LOX/LCH4 as
propellant, the combustion pressure was varied in the range of 3-10MPa, with a step of 10, the compression
area 𝐴𝑐 𝐴𝑡⁄ between1.2 ÷ 6, with a step of 1 and expansion ratio 𝐴𝑒 𝐴𝑡⁄ between10 ÷ 100, with a step of 10.
By varying all these operating parameters, it is intended to obtain a thrust chamber mass as small as
possible, taking into consideration a specific impulse 𝐼𝑠𝑝 within the 370 𝑠 range.
After numerical investigation, it could be shown (fig.3.1) that the specific impulse increases with the
expansion area ratio 𝐴𝑒 𝐴𝑡⁄ . After ratios greater than 𝐴𝑒 𝐴𝑡⁄ > 70 the specific impulse grown rate is not
pronounced. Also was demonstrated that the area contraction ratio does not influence the specific impulse
which slightly increases with combustion pressure.
For what concern the thrust chamber dry mass is related by the following relation:
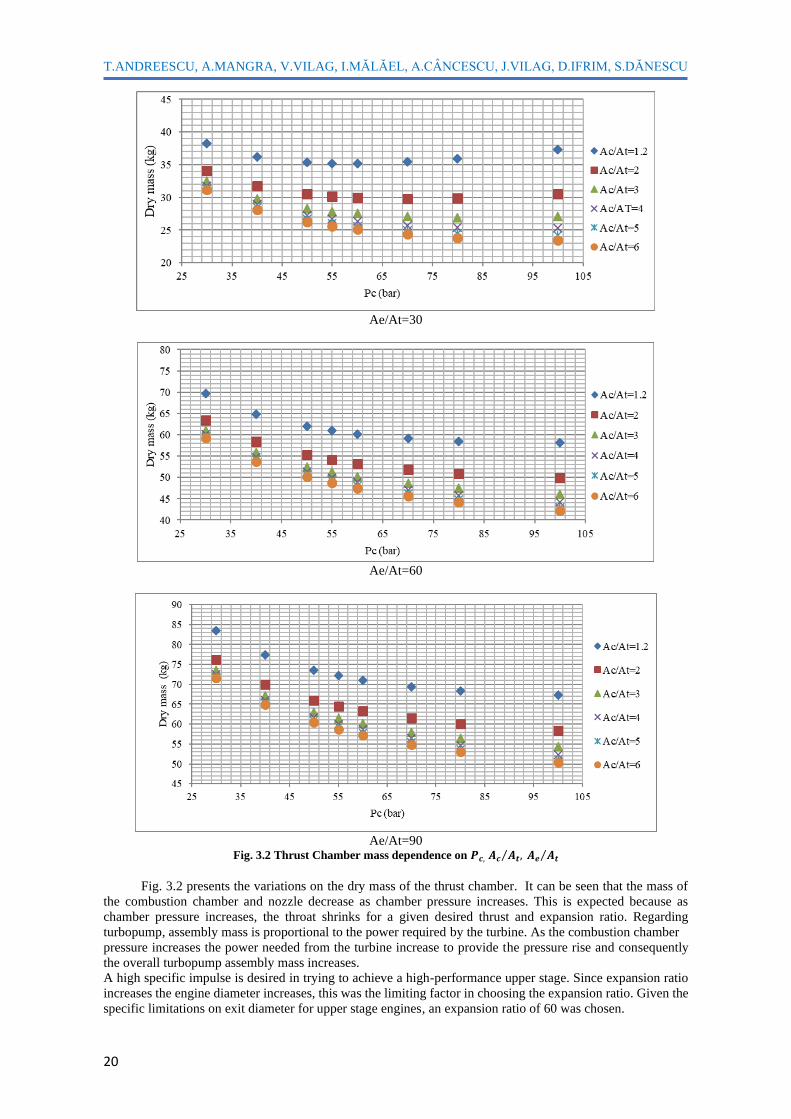
𝑚𝑒𝑛𝑔𝑖𝑛𝑒 = (0.001𝐹 + 49.441)𝑁0.03(𝐴𝑒 𝐴𝑡⁄ )0.004 [16] (3.6)
T.ANDREESCU, A.MANGRA, V.VILAG, I.MĂLĂEL, A.CÂNCESCU, J.VILAG, D.IFRIM, S.DĂNESCU
20
Ae/At=30
Ae/At=60
Ae/At=90
Fig. 3.2 Thrust Chamber mass dependence on 𝑷𝒄, 𝑨𝒄 𝑨𝒕,⁄ 𝑨𝒆 𝑨𝒕⁄
Fig. 3.2 presents the variations on the dry mass of the thrust chamber. It can be seen that the mass of
the combustion chamber and nozzle decrease as chamber pressure increases. This is expected because as
chamber pressure increases, the throat shrinks for a given desired thrust and expansion ratio. Regarding
turbopump, assembly mass is proportional to the power required by the turbine. As the combustion chamber
pressure increases the power needed from the turbine increase to provide the pressure rise and consequently
the overall turbopump assembly mass increases.
A high specific impulse is desired in trying to achieve a high-performance upper stage. Since expansion ratio
increases the engine diameter increases, this was the limiting factor in choosing the expansion ratio. Given the
specific limitations on exit diameter for upper stage engines, an expansion ratio of 60 was chosen.
LOX/LCH4 upper stage development strategies for future launchers
21
From the graphics exemplified besides, thrust chamber mass increase significant with expansion area
ratio and decrease with 𝐴𝑐 𝐴𝑡⁄ increment; the decrease is not as significant for the values 𝐴𝑐 𝐴𝑡⁄ > 3.
Also, the thrust chamber mass decreases as the pressure increases in the combustion chamber. The
minimum take-off mass was taken as an objective function. Since launcher development costs tend to vary as
a function of gross take-off mass; therefore, minimum gross take-off mass vehicle may be considered as a
minimum development cost concept.
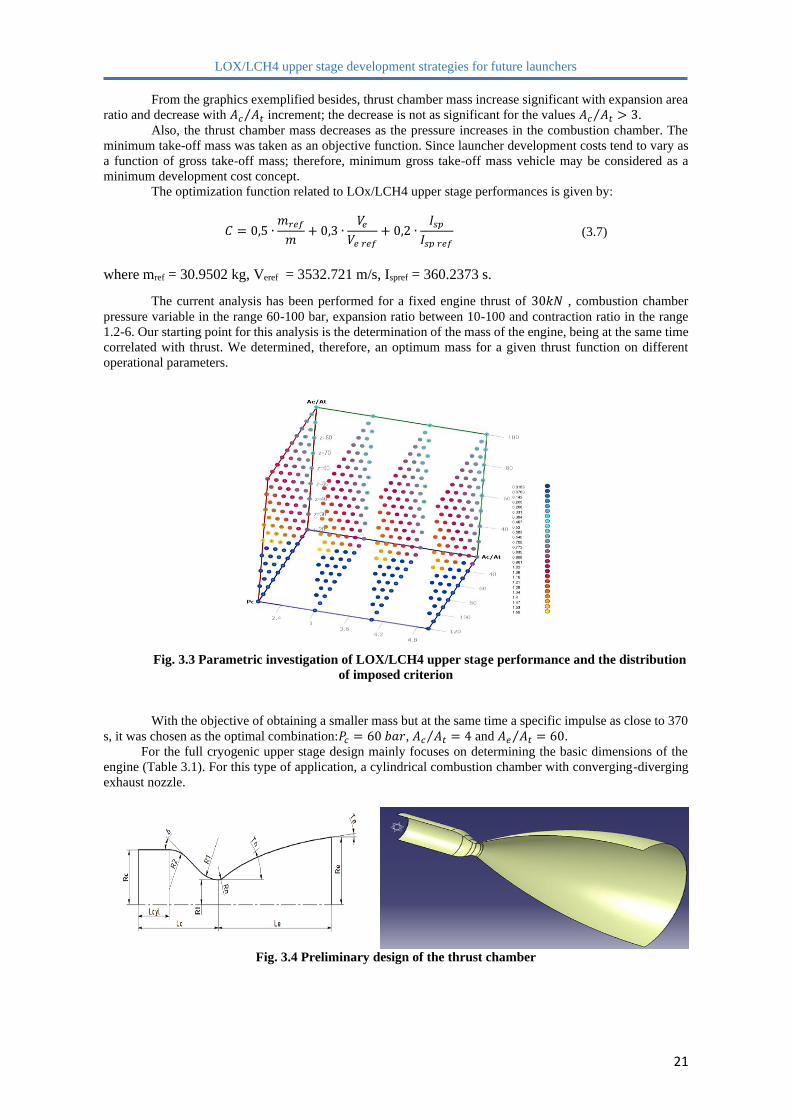
The optimization function related to LOx/LCH4 upper stage performances is given by:
𝐶 = 0,5 ∙𝑚𝑟𝑒𝑓
𝑚+ 0,3 ∙
𝑉𝑒
𝑉𝑒 𝑟𝑒𝑓
+ 0,2 ∙𝐼𝑠𝑝
𝐼𝑠𝑝 𝑟𝑒𝑓
(3.7)
where mref = 30.9502 kg, Veref = 3532.721 m/s, Ispref = 360.2373 s.
The current analysis has been performed for a fixed engine thrust of 30𝑘𝑁 , combustion chamber
pressure variable in the range 60-100 bar, expansion ratio between 10-100 and contraction ratio in the range
1.2-6. Our starting point for this analysis is the determination of the mass of the engine, being at the same time
correlated with thrust. We determined, therefore, an optimum mass for a given thrust function on different
operational parameters.
Fig. 3.3 Parametric investigation of LOX/LCH4 upper stage performance and the distribution
of imposed criterion
With the objective of obtaining a smaller mass but at the same time a specific impulse as close to 370
s, it was chosen as the optimal combination:𝑃𝑐 = 60 𝑏𝑎𝑟, 𝐴𝑐 𝐴𝑡 = 4⁄ and 𝐴𝑒 𝐴𝑡 = 60⁄ .
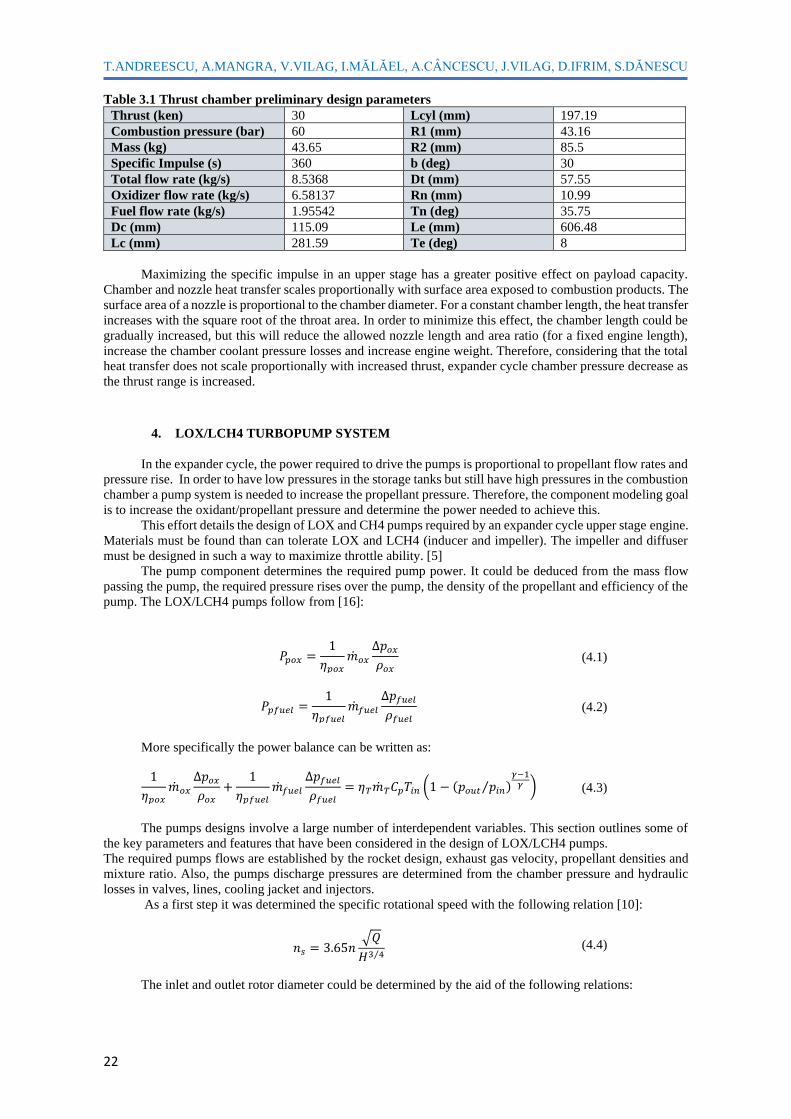
For the full cryogenic upper stage design mainly focuses on determining the basic dimensions of the
engine (Table 3.1). For this type of application, a cylindrical combustion chamber with converging-diverging
exhaust nozzle.
Fig. 3.4 Preliminary design of the thrust chamber
T.ANDREESCU, A.MANGRA, V.VILAG, I.MĂLĂEL, A.CÂNCESCU, J.VILAG, D.IFRIM, S.DĂNESCU
22
Table 3.1 Thrust chamber preliminary design parameters
Thrust (ken) 30 Lcyl (mm) 197.19
Combustion pressure (bar) 60 R1 (mm) 43.16
Mass (kg) 43.65 R2 (mm) 85.5
Specific Impulse (s) 360 b (deg) 30
Total flow rate (kg/s) 8.5368 Dt (mm) 57.55
Oxidizer flow rate (kg/s) 6.58137 Rn (mm) 10.99
Fuel flow rate (kg/s) 1.95542 Tn (deg) 35.75
Dc (mm) 115.09 Le (mm) 606.48
Lc (mm) 281.59 Te (deg) 8
Maximizing the specific impulse in an upper stage has a greater positive effect on payload capacity.
Chamber and nozzle heat transfer scales proportionally with surface area exposed to combustion products. The
surface area of a nozzle is proportional to the chamber diameter. For a constant chamber length, the heat transfer
increases with the square root of the throat area. In order to minimize this effect, the chamber length could be
gradually increased, but this will reduce the allowed nozzle length and area ratio (for a fixed engine length),
increase the chamber coolant pressure losses and increase engine weight. Therefore, considering that the total
heat transfer does not scale proportionally with increased thrust, expander cycle chamber pressure decrease as
the thrust range is increased.
4. LOX/LCH4 TURBOPUMP SYSTEM
In the expander cycle, the power required to drive the pumps is proportional to propellant flow rates and
pressure rise. In order to have low pressures in the storage tanks but still have high pressures in the combustion
chamber a pump system is needed to increase the propellant pressure. Therefore, the component modeling goal
is to increase the oxidant/propellant pressure and determine the power needed to achieve this.
This effort details the design of LOX and CH4 pumps required by an expander cycle upper stage engine.
Materials must be found than can tolerate LOX and LCH4 (inducer and impeller). The impeller and diffuser
must be designed in such a way to maximize throttle ability. [5]
The pump component determines the required pump power. It could be deduced from the mass flow
passing the pump, the required pressure rises over the pump, the density of the propellant and efficiency of the
pump. The LOX/LCH4 pumps follow from [16]:
𝑃𝑝𝑜𝑥 =1
𝜂𝑝𝑜𝑥
�̇�𝑜𝑥
Δ𝑝𝑜𝑥
𝜌𝑜𝑥
(4.1)
𝑃𝑝𝑓𝑢𝑒𝑙 =1
𝜂𝑝𝑓𝑢𝑒𝑙
�̇�𝑓𝑢𝑒𝑙
Δ𝑝𝑓𝑢𝑒𝑙
𝜌𝑓𝑢𝑒𝑙
(4.2)
More specifically the power balance can be written as:
1
𝜂𝑝𝑜𝑥
�̇�𝑜𝑥
Δ𝑝𝑜𝑥
𝜌𝑜𝑥
+1
𝜂𝑝𝑓𝑢𝑒𝑙
�̇�𝑓𝑢𝑒𝑙
Δ𝑝𝑓𝑢𝑒𝑙
𝜌𝑓𝑢𝑒𝑙
= 𝜂𝑇�̇�𝑇𝐶𝑝𝑇𝑖𝑛 (1 − (𝑝𝑜𝑢𝑡 𝑝𝑖𝑛⁄ )𝛾−1
𝛾 ) (4.3)
The pumps designs involve a large number of interdependent variables. This section outlines some of
the key parameters and features that have been considered in the design of LOX/LCH4 pumps.
The required pumps flows are established by the rocket design, exhaust gas velocity, propellant densities and
mixture ratio. Also, the pumps discharge pressures are determined from the chamber pressure and hydraulic
losses in valves, lines, cooling jacket and injectors.
As a first step it was determined the specific rotational speed with the following relation [10]:
𝑛𝑠 = 3.65𝑛√𝑄
𝐻3 4⁄ (4.4)
The inlet and outlet rotor diameter could be determined by the aid of the following relations:

LOX/LCH4 upper stage development strategies for future launchers
23
𝐷1 = (1.1~1.5)𝐾0 √𝑄
𝑛
3 (4.5)
𝐷2 = 19.2 (𝑛𝑠𝑜𝑝𝑡
100)
1 6⁄
√2𝑔𝐻
𝑛 (4.6)
The exit rotor blade high is given by:
𝑏2 = 0.78 (𝑛𝑠𝑜𝑝𝑡
100)
1 2⁄
√𝑄
𝑛
3
(4.7)
Blade number:
𝑍 = 6.5𝐷2 + 𝐷1
𝐷2 − 𝐷1
𝑠𝑖𝑛(𝛽1 + 𝛽2) (4.8)
Also another important parameter is the net pressure suction head [13]:
𝑁𝑃𝑆𝐻 =𝑝𝑖𝑛𝑙𝑒𝑡 − 𝑝𝑣𝑎𝑝𝑜𝑢𝑟
𝑔0𝜌 (4.9)
Using ANSYS Vista CPD the two pumps were pre dimensioned. Among the required data are speed,
gas flow rate, working fluid density, pumping head, inlet flow angle and velocities ratio.
Table 4.1 Pumps inputs design parameters
LOX Pump LCH4 Pump
Rotational speed (rpm) 30850 Rotational speed (rpm) 30850
Volume flow rate (𝒎𝟑 𝒉⁄ ) 20.783 Volume flow rate (𝒎𝟑 𝒉⁄ ) 16963
Density (𝒌𝒈 𝒎𝟑⁄ ) 1140 Density (𝒌𝒈 𝒎𝟑⁄ ) 415
Head rise (m) 689 Head rise (m) 1880
Inlet flow angle (deg) 90 Inlet flow angle (deg) 90
Merid velocity ratio 1.1 Merid velocity ratio 1.1
Table 4.2 LOX/LCH4 rotor`s main parameters
LOX Pump LCH4 Pump
Power (𝒌𝑾) 121.8 Power (𝒌𝑾) 161.4
Head coeffi 0.430 Head coeffi 0.490
NPSH (m) 36.73 NPSH (m) 31.78
Impeller inlet D1 (mm) 22.1 Impeller inlet D1 (mm) 23.0
Impeller exit D2 (mm) 77.2 Impeller exit D2 (mm) 120.1
B2 (mm) 4.7 B2 (mm) 6.1
For full cryogenic 30 𝑘𝑁 upper stage we have selected a closed expander engine cycle. For that
architecture, the turbine that controls the pump is driven by hot gaseous fuel after it has passed as a liquid the
nozzle where it is used for cooling. After the gaseous fuel has passed the turbine it is injected into the thrust
chamber.
Rocket turbine pumps typically use impulse turbines with higher pressure ratios and higher speeds in
order to achieve a compact geometry but affecting the TPO assembly efficiency. For an expander cycle it is
preferable to use one stage turbine. [7]
The turbine must provide required shaft power for driving the LOX/LCH4 pumps at a predefined
rotational speed and torque. In an impulse turbine, the enthalpy of the working fluid is converted into kinetic
energy within the first set of stationary turbine nozzles. The power supplied by the turbine is given by: [8]
𝑃𝑇 = 𝜂𝑇�̇�𝑇∆ℎ = 𝜂𝑇�̇�𝑇𝐶𝑝𝑇𝑖𝑛 (1 − (𝑝𝑜𝑢𝑡 𝑝𝑖𝑛⁄ )𝛾−1
𝛾 ) (4.10)
T.ANDREESCU, A.MANGRA, V.VILAG, I.MĂLĂEL, A.CÂNCESCU, J.VILAG, D.IFRIM, S.DĂNESCU
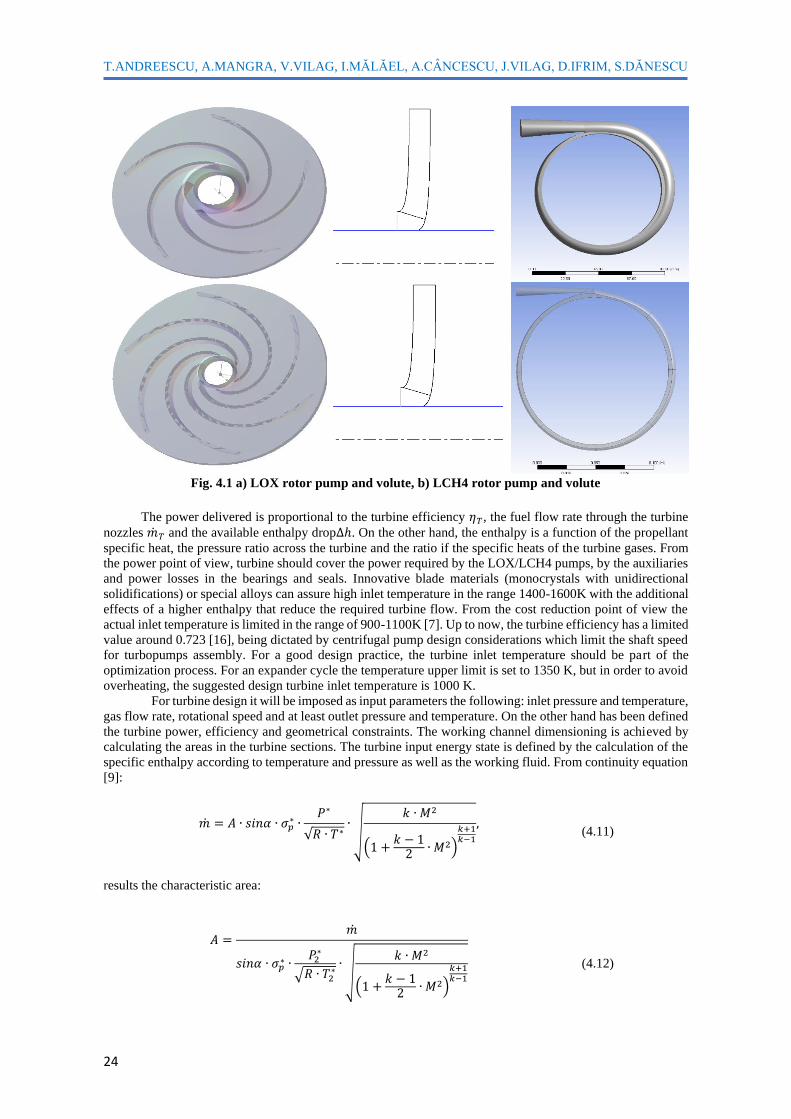
24
Fig. 4.1 a) LOX rotor pump and volute, b) LCH4 rotor pump and volute
The power delivered is proportional to the turbine efficiency 𝜂𝑇, the fuel flow rate through the turbine
nozzles �̇�𝑇 and the available enthalpy drop∆ℎ. On the other hand, the enthalpy is a function of the propellant
specific heat, the pressure ratio across the turbine and the ratio if the specific heats of the turbine gases. From
the power point of view, turbine should cover the power required by the LOX/LCH4 pumps, by the auxiliaries
and power losses in the bearings and seals. Innovative blade materials (monocrystals with unidirectional
solidifications) or special alloys can assure high inlet temperature in the range 1400-1600K with the additional
effects of a higher enthalpy that reduce the required turbine flow. From the cost reduction point of view the
actual inlet temperature is limited in the range of 900-1100K [7]. Up to now, the turbine efficiency has a limited
value around 0.723 [16], being dictated by centrifugal pump design considerations which limit the shaft speed
for turbopumps assembly. For a good design practice, the turbine inlet temperature should be part of the
optimization process. For an expander cycle the temperature upper limit is set to 1350 K, but in order to avoid
overheating, the suggested design turbine inlet temperature is 1000 K.
For turbine design it will be imposed as input parameters the following: inlet pressure and temperature,
gas flow rate, rotational speed and at least outlet pressure and temperature. On the other hand has been defined
the turbine power, efficiency and geometrical constraints. The working channel dimensioning is achieved by
calculating the areas in the turbine sections. The turbine input energy state is defined by the calculation of the
specific enthalpy according to temperature and pressure as well as the working fluid. From continuity equation
[9]:
�̇� = 𝐴 ∙ 𝑠𝑖𝑛𝛼 ∙ 𝜎𝑝∗ ∙
𝑃∗
√𝑅 ∙ 𝑇∗∙
√
𝑘 ∙ 𝑀2
(1 +𝑘 − 1
2∙ 𝑀2)
𝑘+1𝑘−1
, (4.11)
results the characteristic area:
𝐴 =�̇�
𝑠𝑖𝑛𝛼 ∙ 𝜎𝑝∗ ∙
𝑃2∗
√𝑅 ∙ 𝑇2∗
∙√
𝑘 ∙ 𝑀2
(1 +𝑘 − 1
2∙ 𝑀2)
𝑘+1𝑘−1
(4.12)
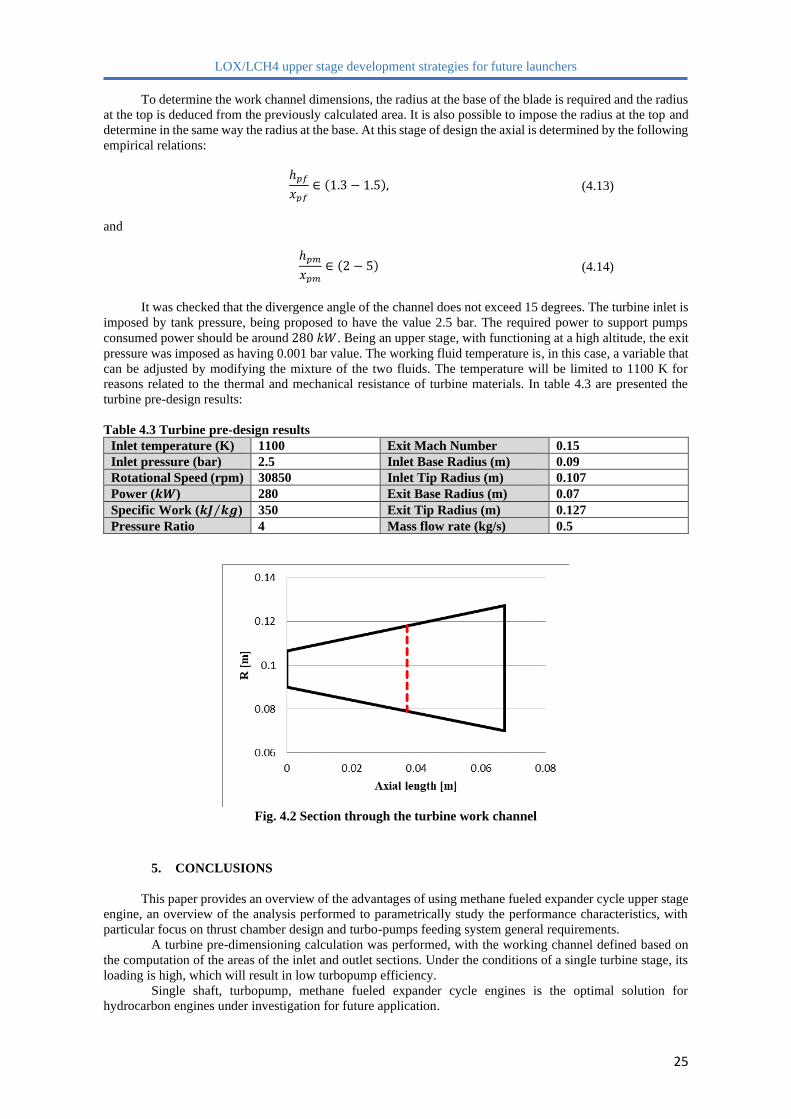
LOX/LCH4 upper stage development strategies for future launchers
25
To determine the work channel dimensions, the radius at the base of the blade is required and the radius
at the top is deduced from the previously calculated area. It is also possible to impose the radius at the top and
determine in the same way the radius at the base. At this stage of design the axial is determined by the following
empirical relations:
ℎ𝑝𝑓
𝑥𝑝𝑓
∈ (1.3 − 1.5), (4.13)
and
ℎ𝑝𝑚
𝑥𝑝𝑚
∈ (2 − 5) (4.14)
It was checked that the divergence angle of the channel does not exceed 15 degrees. The turbine inlet is
imposed by tank pressure, being proposed to have the value 2.5 bar. The required power to support pumps
consumed power should be around 280 𝑘𝑊. Being an upper stage, with functioning at a high altitude, the exit
pressure was imposed as having 0.001 bar value. The working fluid temperature is, in this case, a variable that
can be adjusted by modifying the mixture of the two fluids. The temperature will be limited to 1100 K for
reasons related to the thermal and mechanical resistance of turbine materials. In table 4.3 are presented the
turbine pre-design results:
Table 4.3 Turbine pre-design results
Inlet temperature (K) 1100 Exit Mach Number 0.15
Inlet pressure (bar) 2.5 Inlet Base Radius (m) 0.09
Rotational Speed (rpm) 30850 Inlet Tip Radius (m) 0.107
Power (𝒌𝑾) 280 Exit Base Radius (m) 0.07
Specific Work (𝒌𝑱 𝒌𝒈⁄ ) 350 Exit Tip Radius (m) 0.127
Pressure Ratio 4 Mass flow rate (kg/s) 0.5
Fig. 4.2 Section through the turbine work channel
5. CONCLUSIONS
This paper provides an overview of the advantages of using methane fueled expander cycle upper stage
engine, an overview of the analysis performed to parametrically study the performance characteristics, with
particular focus on thrust chamber design and turbo-pumps feeding system general requirements.
A turbine pre-dimensioning calculation was performed, with the working channel defined based on
the computation of the areas of the inlet and outlet sections. Under the conditions of a single turbine stage, its
loading is high, which will result in low turbopump efficiency.
Single shaft, turbopump, methane fueled expander cycle engines is the optimal solution for
hydrocarbon engines under investigation for future application.
T.ANDREESCU, A.MANGRA, V.VILAG, I.MĂLĂEL, A.CÂNCESCU, J.VILAG, D.IFRIM, S.DĂNESCU
26
In this paper, it was conducted a design procedure of a liquid oxygen liquid and of the liquid methane.
Using the literature, a calculation and design methodology of the pump rotors was determined and using the
Vista CPD software, the volute rotor assembly for each pump was pre-dimensioned. For the LOx pump, a
77.6mm rotor outlet diameter with a power output of 122kW was obtained and for the LCH4 pump the diameter
of the rotor outlet was 120.1mm with a power output of 162kW
System performance and configuration studies indicate that a methane-fueled expander cycle is a
viable candidate for upper stage propulsion.
ACKNOWLEDGEMENT
This work was carried out within “Nucleu” Program TURBOPROP, supported by the Romanian
Minister of Research and Innovation, project number PN 19.05.01.02.
REFERENCES
[1] G. P. SUTTON, Rocket Propulsion Elements (Seventh Edition), by John Wiley & Sons, 2001, ISBN 0-
471-32642-9
[2] M.J.L. Turner, Rocket and Spacecraft propulsion, Principles, Practice and New Developments (Second
Edition), Springer, 2006, ISBN 3-540-22190-5
[3] D.K. Huzel, D.H. Huang, Modern Engineering for design of liquid-propellant rocket engines, AIAA,
1992, ISBN 1-56347-013-6
[4] David R. Lide, Handbook of Chemistry & Physics 1996-1997, 77th Edition; CPC Press Inc., 1996
[5] Source- Turbopump Systems for Liquid Rocket Engines NASA SP-8170
[6] Adhikari, Pradhumna & Budhathoki, Umesh & Raj Timilsina, Shiva & Manandhar, Saurav & Bajracharya,
Tri. (2014). A Study on Developing Pico Propeller Turbine for Low Head Micro Hydropower Plants în Nepal.
Journal of the Institute of Engineering. 9. 10.3126/jie.v9i1.10669.
[7] Research and Development of Rocket Turbopumps --- 35 Years în Retrospect published by Tohoku
University Press, Sendai, în February, 2013. (http://www.frontier.phys.nagoya-
u.ac.jp/jp/leading/files/Thubopump_of_Rocket_kamijo.pdf accesat 03.06.2019)
[8] Lampart, Piotr & Yershov, Sergiy & Rusanov, Andrey & Szymaniak, Mariusz. (2004). Tip leakage /
main flow interaction în multi-stage HP turbines with short-height blading.
[9] Moustapha H. et al., Axial and Radial Turbines, Concepts ETI, Inc., 2003, ISBN0-933283-12-0
[10] M.J. Zhang, C.G. Gu, and Y.M. Miao, Numerical study of the internal flow field of a centrifugal impeller,
ASME Paper 94-GT-357, 1994.
[11] K. Hillewaert and R.A. Van den Braembussche, Numerical simulation of impeller-volute interaction în
centrifugal compressors, ASME Journal of Turbomachinery, vol. 121, pp.603-609, 1999.
[12] J. Gonzalez, J. Fernandez, E. Blanco, and C. Santolaria, Numerical simulation of the dynamic effects due
to impellervolute interaction în a centrifugal pump, ASME Journal of Fluids Engineering, vol. 124, pp. 348-
355, 2002.
[13] J. Gonzalez, J. Parrondo, C. Santolaria, and E. Blanco, Steady and unsteady forces for a centrifugal pump
with impeller to tongue pump variation, ASME Journal of Fluids Engineering, vol. 128, pp. 454-462, 2006.
[14] J. Gonzalez, and C. Santolaria, Unsteady flow structure and global variables în a centrifugal pump, ASME
Journal of Fluids Engineering, vol. 128, pp. 937-946, 2006.
[15] R. K. Byskov, C. B. Jacobsen, and N. Pedersen, Flow în a centrifugal pump impeller at design and off-
design conditions- Part II: Large Eddy Simulations, ASME Journal of Fluids Engineering, vol. 125, pp. 73-83,
2003
[16] – Liquid Rocket Analysis-Development of Liquid Bi-Propellant Rocket Engine Design, Analysis and
Optimization Tool, Master of Science Thesis, 2014, TUDelft
[17] Igor N. Nikischenko, Improving the performance of LOX/kerosene upper stage rocket engines, Propulsion
and Power Research 2017; 6(3), 157-176
[18] Reuben Schuff, Matthew Maier, Oleg Sindly “ Integrated Modeling for a Lox/Methane Expander Cycle
Engine: Focusing on Regenerative Cooling Jacket Design”, AIAA 2006-4534
[19] Marco Leonardi, Francesco Nasuti “Basic Analysis of a LOX/Methane Expander Bleed Engine”, DOI:
10.13009/EUCASS2017-332

TURBO, vol. VI (2019), no. 2
27
ANALYSIS OF THE VOLUMETRIC EFFICIENCY
OF THE BLOWER ROTORS WITH LOBES
Teodor STĂNESCU1, Gabriel-Petre BADEA1, Nicușor-Daniel STAN1, Elena PRESURĂ-
CHIRILESCU1
ABSTRACT: Within this article were studied 3 types of rotors based on different profile curves. For these,
the 2D model of the profile was established starting from the parametric relations that describe the curves,
subsequent by defining the computational relations of the volumetric machine parameters, a comparison
criterion was established following which the most efficient type of rotor was identified.
Keywords: lobe blower, lobe blower profile, involute, cycloide, hypocycloide.
NOMENCLATURE
𝐷𝑐 Housing diameter 𝜂𝑚 Mechanical efficency
𝑅𝑐 Housing radius 𝑄𝑟 Volumetric machine real flow
𝐿𝑟 Rotor length 𝑝𝑎 Suction pressure
𝐿𝑐 Housing length 𝑝𝑟 Discharge pressure
𝑛 Electric engine speed ∆𝑝 Differential pressure
𝐴𝑐 Housing diameter area
𝐴𝑟 Rotor area 𝑀𝑡 Moment of torsion5
𝑉𝑔 Displacement / Engine displacement 𝑃 Power
𝑄1𝑟𝑜𝑡𝑜𝑟 Theoretical flow provided by a single rotor 𝜃 Rotation angle
𝑄𝑡 Volumetric machine theoretical flow 𝑗𝑎 Axial clearance
𝜂𝑣 Volumetric efficency 𝑗𝑟 Radial clearance
1. INTRODUCTION
Lobe blowers are volumetric compression machines used in a variety of industries, including cellulose
and paper, chemicals, food, pharmaceuticals and biotechnology. They are popular because they offer high
efficiencies, reliability, corrosion resistance and are very easy to maintain.
These machines can be classified in terms of number of lobes, thus there are pumps with two,three or
four lobes, with straight or helical lobes.
The shape of the lobe and the analysis of the rotors gearing of the blowers / compressors are the basis
of many scientific works. Mimmi [1] used in his work a mathematical model for optimizing the parameters of
the lobes. Wang [2] designed a lobe consisting of five circle arches with improved sealing efficiency, and Chiu
[3] developed a new profile using elliptic curves and then compared the performances with those of traditional
profiles. Hwang [4-5] proposed a new shape of the lobe, where it investigated how high volumetric efficiency
and better sealing performance can be achieved. The same problem was studied by Tong and Yang [6-8][18].
With the development of fluid dynamics (CFD), a growing number of researchers have focused on numerical
analysis of volumetric machines, such as the screw compressor and the lobe pump. Regarding the screw
compressor, Stosic [9] described the generation of rotors based on the method of generating the racks.
Kovacevic [10, 11] developed a static model to simulate the flow through the volumetric voids of the machines.
5 Romanian Research and Development Institute for Gas Turbines COMOTI, Bucharest, Romania
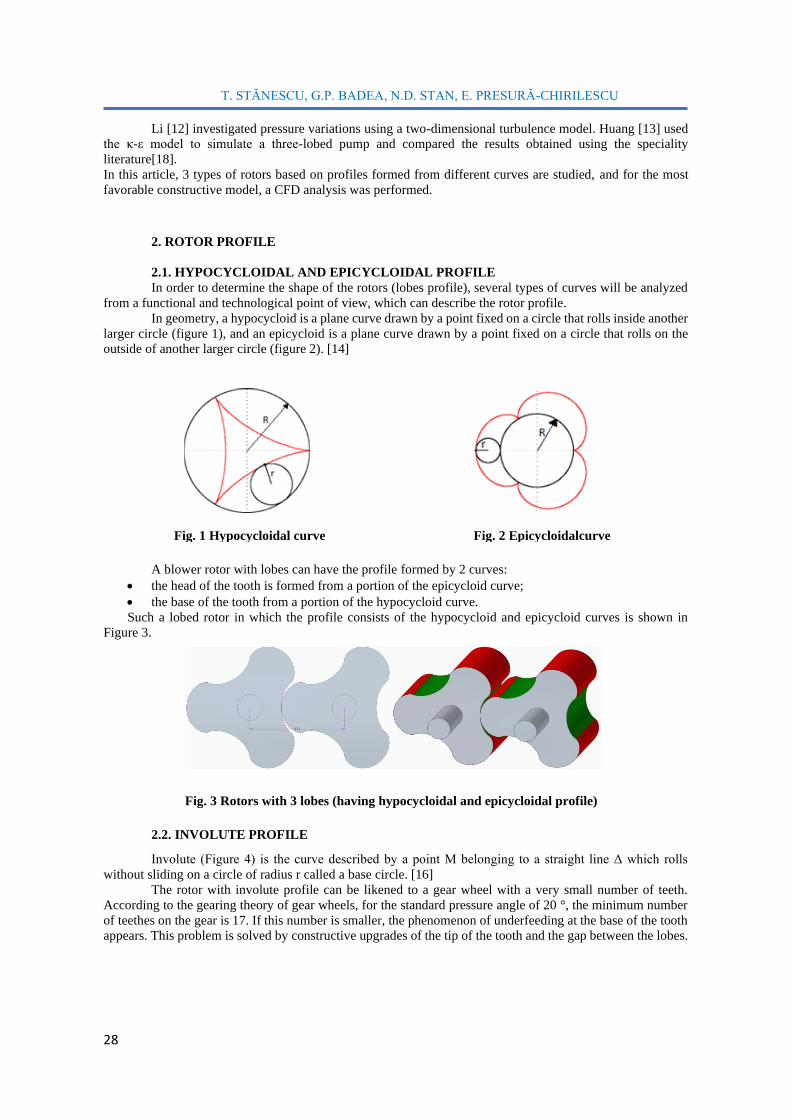
T. STĂNESCU, G.P. BADEA, N.D. STAN, E. PRESURĂ-CHIRILESCU
28
Li [12] investigated pressure variations using a two-dimensional turbulence model. Huang [13] used
the κ-ε model to simulate a three-lobed pump and compared the results obtained using the speciality
literature[18].
In this article, 3 types of rotors based on profiles formed from different curves are studied, and for the most
favorable constructive model, a CFD analysis was performed.
2. ROTOR PROFILE
2.1. HYPOCYCLOIDAL AND EPICYCLOIDAL PROFILE
In order to determine the shape of the rotors (lobes profile), several types of curves will be analyzed
from a functional and technological point of view, which can describe the rotor profile.
In geometry, a hypocycloid is a plane curve drawn by a point fixed on a circle that rolls inside another
larger circle (figure 1), and an epicycloid is a plane curve drawn by a point fixed on a circle that rolls on the
outside of another larger circle (figure 2). [14]
Fig. 1 Hypocycloidal curve Fig. 2 Epicycloidalcurve
A blower rotor with lobes can have the profile formed by 2 curves:
• the head of the tooth is formed from a portion of the epicycloid curve;
• the base of the tooth from a portion of the hypocycloid curve.
Such a lobed rotor in which the profile consists of the hypocycloid and epicycloid curves is shown in
Figure 3.
Fig. 3 Rotors with 3 lobes (having hypocycloidal and epicycloidal profile)
2.2. INVOLUTE PROFILE
Involute (Figure 4) is the curve described by a point M belonging to a straight line Δ which rolls
without sliding on a circle of radius r called a base circle. [16]
The rotor with involute profile can be likened to a gear wheel with a very small number of teeth.
According to the gearing theory of gear wheels, for the standard pressure angle of 20 °, the minimum number
of teethes on the gear is 17. If this number is smaller, the phenomenon of underfeeding at the base of the tooth
appears. This problem is solved by constructive upgrades of the tip of the tooth and the gap between the lobes.

Analysis of the volumetric efficiency of the blower rotors with lobes
29
Fig. 4 Generating the involute profile
Fig. 5 Rotors with 3 lobes (with involute profile and circle arche)
Unlike the constructive variant of the rotor made from the hypocycloid and epicycloid profile, where
the clearance between the rotors will be kept constant at a complete rotation of the shaft, in the case of the rotor
with involute profile and circle arches the clearance between the 2 rotors will vary, but not much , ± 0.1 mm.
2.3. CYCLOIDAL PROFILE
A cycloid is a curve drawn by a fixed point on a circle that rolls on a straight line. [17]
Fig. 6 Cycloid generated by a rolling circle [4]
The cycloid equations. The cycloid passing through origin, created by a circle with radius r, is formed
by the points (x, y) with:
𝑥 = 𝑟 ∙ (𝑡 − sin(𝑡)) (1)
𝑦 = 𝑟 ∙ (1 − cos(𝑡)) (2) where t is a real parameter, equal to the angle at which the generator circle is rotated.
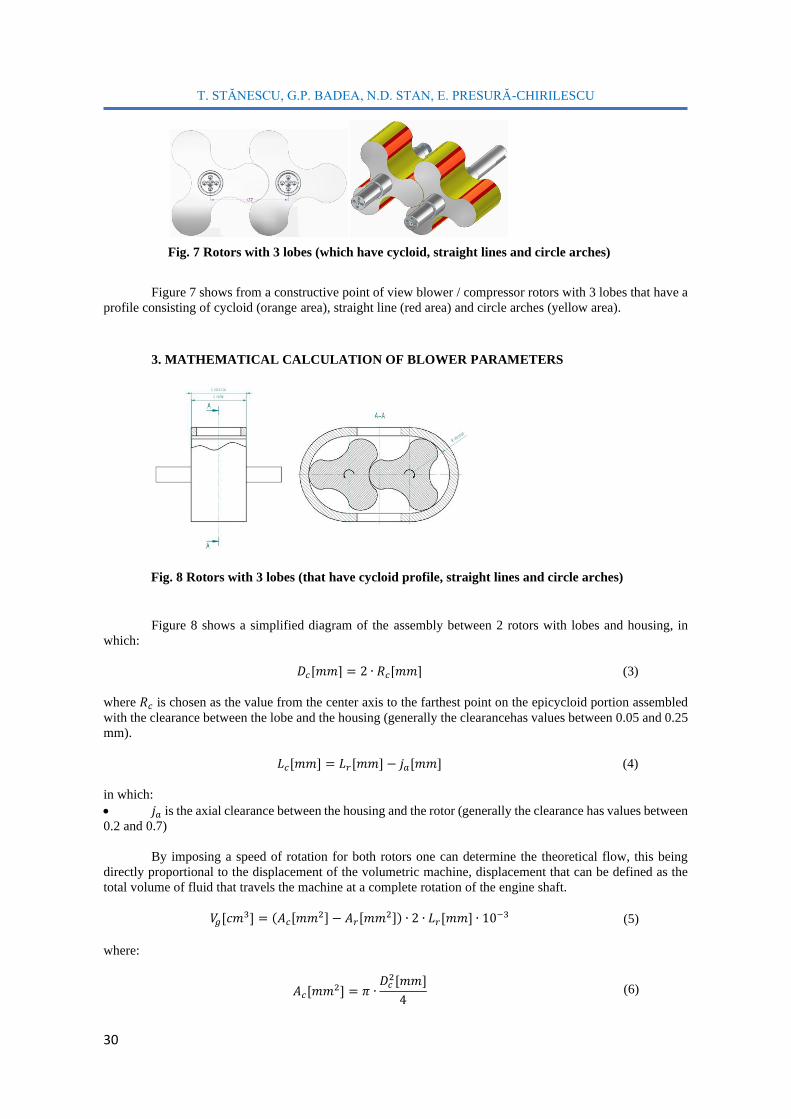
T. STĂNESCU, G.P. BADEA, N.D. STAN, E. PRESURĂ-CHIRILESCU
30
Fig. 7 Rotors with 3 lobes (which have cycloid, straight lines and circle arches)
Figure 7 shows from a constructive point of view blower / compressor rotors with 3 lobes that have a
profile consisting of cycloid (orange area), straight line (red area) and circle arches (yellow area).
3. MATHEMATICAL CALCULATION OF BLOWER PARAMETERS
Fig. 8 Rotors with 3 lobes (that have cycloid profile, straight lines and circle arches)
Figure 8 shows a simplified diagram of the assembly between 2 rotors with lobes and housing, in
which:
𝐷𝑐[𝑚𝑚] = 2 ∙ 𝑅𝑐[𝑚𝑚] (3)
where 𝑅𝑐 is chosen as the value from the center axis to the farthest point on the epicycloid portion assembled
with the clearance between the lobe and the housing (generally the clearancehas values between 0.05 and 0.25
mm).
𝐿𝑐[𝑚𝑚] = 𝐿𝑟[𝑚𝑚] − 𝑗𝑎[𝑚𝑚] (4)
in which:
• 𝑗𝑎 is the axial clearance between the housing and the rotor (generally the clearance has values between
0.2 and 0.7)
By imposing a speed of rotation for both rotors one can determine the theoretical flow, this being
directly proportional to the displacement of the volumetric machine, displacement that can be defined as the
total volume of fluid that travels the machine at a complete rotation of the engine shaft.
𝑉𝑔[𝑐𝑚3] = (𝐴𝑐[𝑚𝑚2] − 𝐴𝑟[𝑚𝑚2]) ∙ 2 ∙ 𝐿𝑟[𝑚𝑚] ∙ 10−3 (5)
where:
𝐴𝑐[𝑚𝑚2] = 𝜋 ∙𝐷𝑐
2[𝑚𝑚]
4 (6)
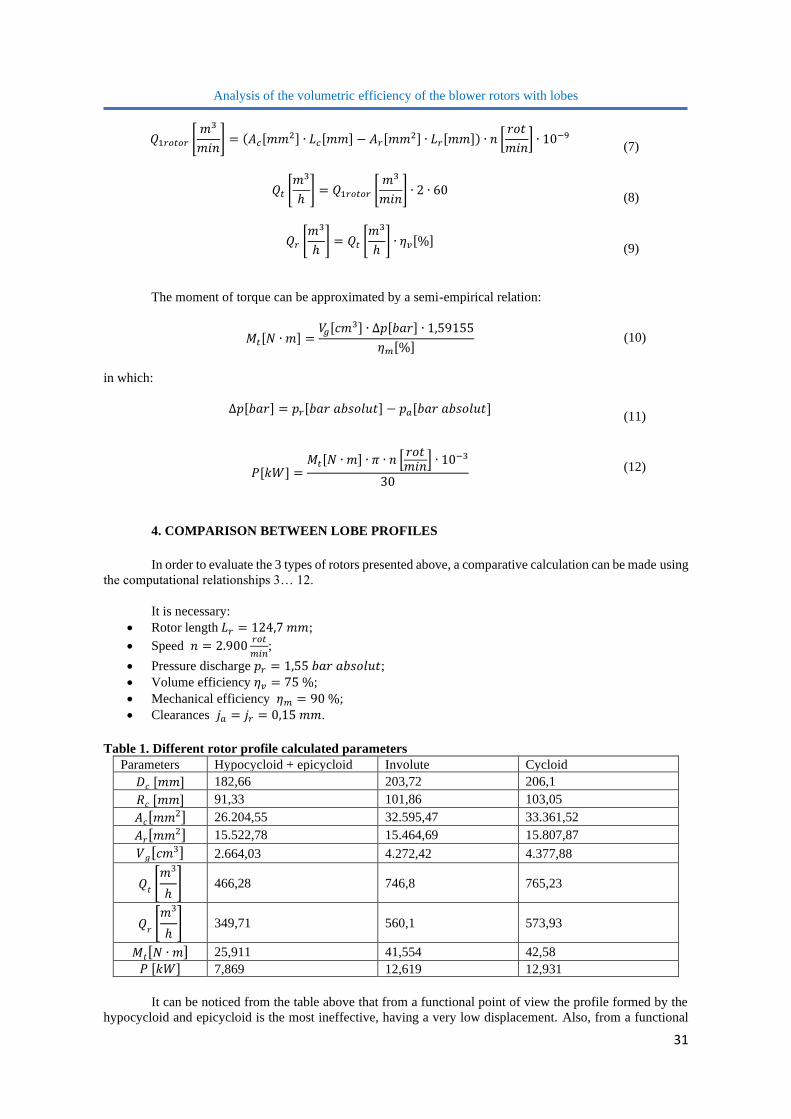
Analysis of the volumetric efficiency of the blower rotors with lobes
31
𝑄1𝑟𝑜𝑡𝑜𝑟 [𝑚3
𝑚𝑖𝑛] = (𝐴𝑐[𝑚𝑚2] ∙ 𝐿𝑐[𝑚𝑚] − 𝐴𝑟[𝑚𝑚2] ∙ 𝐿𝑟[𝑚𝑚]) ∙ 𝑛 [
𝑟𝑜𝑡
𝑚𝑖𝑛] ∙ 10−9
(7)
𝑄𝑡 [𝑚3
ℎ] = 𝑄1𝑟𝑜𝑡𝑜𝑟 [
𝑚3
𝑚𝑖𝑛] ∙ 2 ∙ 60
(8)
𝑄𝑟 [𝑚3
ℎ] = 𝑄𝑡 [
𝑚3
ℎ] ∙ 𝜂𝑣[%]
(9)
The moment of torque can be approximated by a semi-empirical relation:
𝑀𝑡[𝑁 ∙ 𝑚] =𝑉𝑔[𝑐𝑚3] ∙ ∆𝑝[𝑏𝑎𝑟] ∙ 1,59155
𝜂𝑚[%] (10)
in which:
∆𝑝[𝑏𝑎𝑟] = 𝑝𝑟[𝑏𝑎𝑟 𝑎𝑏𝑠𝑜𝑙𝑢𝑡] − 𝑝𝑎[𝑏𝑎𝑟 𝑎𝑏𝑠𝑜𝑙𝑢𝑡]
(11)
𝑃[𝑘𝑊] =𝑀𝑡[𝑁 ∙ 𝑚] ∙ 𝜋 ∙ 𝑛 [
𝑟𝑜𝑡𝑚𝑖𝑛
] ∙ 10−3
30
(12)
4. COMPARISON BETWEEN LOBE PROFILES
In order to evaluate the 3 types of rotors presented above, a comparative calculation can be made using
the computational relationships 3… 12.
It is necessary:
• Rotor length 𝐿𝑟 = 124,7 𝑚𝑚;
• Speed 𝑛 = 2.900𝑟𝑜𝑡
𝑚𝑖𝑛;
• Pressure discharge 𝑝𝑟 = 1,55 𝑏𝑎𝑟 𝑎𝑏𝑠𝑜𝑙𝑢𝑡;
• Volume efficiency 𝜂𝑣 = 75 %;
• Mechanical efficiency 𝜂𝑚 = 90 %;
• Clearances 𝑗𝑎 = 𝑗𝑟 = 0,15 𝑚𝑚.
Table 1. Different rotor profile calculated parameters
Parameters Hypocycloid + epicycloid Involute Cycloid
𝐷𝑐 [𝑚𝑚] 182,66 203,72 206,1
𝑅𝑐 [𝑚𝑚] 91,33 101,86 103,05
𝐴𝑐[𝑚𝑚2] 26.204,55 32.595,47 33.361,52
𝐴𝑟[𝑚𝑚2] 15.522,78 15.464,69 15.807,87
𝑉𝑔[𝑐𝑚3] 2.664,03 4.272,42 4.377,88
𝑄𝑡 [𝑚3
ℎ] 466,28 746,8 765,23
𝑄𝑟 [𝑚3
ℎ] 349,71 560,1 573,93
𝑀𝑡[𝑁 ∙ 𝑚] 25,911 41,554 42,58
𝑃 [𝑘𝑊] 7,869 12,619 12,931
It can be noticed from the table above that from a functional point of view the profile formed by the
hypocycloid and epicycloid is the most ineffective, having a very low displacement. Also, from a functional
T. STĂNESCU, G.P. BADEA, N.D. STAN, E. PRESURĂ-CHIRILESCU
32
point of view, the functional characteristics of the other 2 profiles (involute and cycloid) are close, the
differences between them being maximum 3%.
From a technological point of view, the profile formed by the involute requires a careful processing
on a much larger surface than the profile formed by the cycloid.
From the point of view of control dimensions, the profile formed with the cycloid has the advantage
of a straight reference surface, so that exact dimensions of dimensional control can be indicated.
5. CONCLUSIONS
From the analysis of the different curves that can describe the rotor profile, it was concluded that the
profile formed by the hypocycloid and the epicycloid is the most ineffective in terms of the volume of fluid
conveyed at a complete rotation of the shaft. The profiles formed from involute + circle arches and cycloid +
straight lines+ circle arches have close efficiency, differences between them being maximum 3%, and from the
technological point of view the profile that has a cycloid component have more advantages.
Due to the fact that lobe blowers did not reached the maximum point of development, research on this
topic can continue.
REFERENCES
[1] G. Mimmi, P. Pennacchi, G. Mimmi, Analytical model of a particular type of positive displacement
blower, ARCHIVE Proc. Institution Mech. Eng. Part C J. Mech. Eng. Sci. 213 (5) (1999) 517e526.
[2] P.Y. Wang, Z.H. Fong, H.S. Fang, Design constraints of five-arc Roots vacuum pumps, Proc. Institution
Mech. Eng. Part C 216 (2) (2002) 225e234.
[3] C.F. Hsieh, A new curve for application to the rotor profile of rotary lobe pumps, Mech. Mach. Theory
87 (2015) 70e81.
[4] Y.W. Hwang, C.F. Hsieh, Study on high volumetric efficiency of the Roots rotor profile with variable
trochoid ratio, Proc. Institution Mech. Eng. Part C J. Mech. Eng. Sci. 220 (9) (2006) 1375e1384.
[5] C.F. Hsieh, Y.W. Hwang, Study on the high-sealing of Roots rotor with variable trochoid ratio, J. Mech.
Des. 129 (12) (2007) 1278e1284.
[6] S.H. Tong, D.C.H. Yang, On the generation of new lobe pumps for higher pumping flow rate, Mech.
Mach. Theory 35 (35) (2000) 997e1012.
[7] D.C.H. Yang, S.H. Tong, The specific flow rate of deviation function based lobe pumps - derivation and
analysis, Mech. Mach. Theory 37 (10) (2002) 1025e1042.
[8] S.H. Tong, D.C.H. Yang, Rotor profiles synthesis for lobe pumps with given flow rate functions, J. Mech.
Des. 127 (2) (2005) 287e294.
[9] N. Stosic, I.K. Smith, A. Kovacevic, et al., Geometry of screw compressor rotors and their tools, J.
Zhejiang University-SCIENCE A 12 (4) (2011) 310e326.
[10] A. Kovacevic, I.K. Smith, The influence of rotor deflection upon screw compressor performance, Vdi
Berichte 1715 (2002) 17e28.
[11] Li Y B, Jia K, Meng Q W, et al. Flow simulation of the effects of pressure angle to lobe pump rotor
meshing characteristics. 6th international conference on blowers and fans with compressors and wind
turbines, materials science and engineering, 2013, 52(3):032022.
[12] Z.F. Huang, Z.X. Liu, Numerical study of a positive displacement blower, ARCHIVE Proc. Institution
Mech. Eng. Part C J. Mech. Eng. Sci. 223 (10) (2009) 2309e2316.
[13] Florian MENTER,J. C. FERREIRA,T. ESCH,B. KONNO, “The SST Turbulence Model with Improved
Wall Treatment for Heat Transfer Predictions in Gas Turbines”, Proceedings of the International Gas
Turbine Congress 2003 Tokyo November 2-7, 2003
[14] https://en.wikipedia.org/wiki/Hypocycloid– Accessed on 08.10.2019
[15] https://en.wikipedia.org/wiki/Epicycloid– Accessed on 08.10.2019
[16] https://math.wikia.org/ro/wiki/Evolvent – Accessed on 08.10.2019
[17] https://en.wikipedia.org/wiki/Cycloid – Accessed on 08.10.2019
[18] T.Stănescu,I.Mălăel,D.Rădulescu, Modelarea şi simularea unei maşini de comprimare volumetrică a
aerului cu pistoane rotative cu 3 lobi. Cercetări privind influența rezonatorului Helmholtz asupra
zgomotului produs de mașină., PN 19.05.02.01-3
TURBO, vol. VI (2019), no. 2
33
CROSS-FLOW HEAT TRANSFER WITH APPLICATIONS
IN TURBINE BLADES COOLING
Mădălin DOMBROVSCHI1
ABSTRACT: In this paper, the heat transfer phenomenon in a cross-flow it will be discussed. In the first part
of the paper, the theory behind the paper will be presented with the most important physical parameters
described, then a presentation of the numerical calculations and the geometry follows. The paper ends with a
presentation of the results in a graphical way and some conclusions. After the results were discussed, the final
conclusion is that the results are encouraging and the simulations seem good, an experimental analyze is require
to see if the real world the results will be the same.
KEYWORDS: heat transfer, CFD, CFX, cross-flow
1. INTRODUCTION
It is well known that for a turbine to produce a bigger power, the temperature in front of the turbine
has to be higher. All along the years, a lot of methods have been developed for increasing high temperature
resistance, such as introducing new alloys of material, or developing some cooling techniques, for example the
film cooling, which is a method which collects a small percentage of the compressor air, guides it through the
internal channels in the turbine blades, and discharges it through small holes in the blade walls. The discharged
air is forming a thin blanket around the turbine blade, that keeps the turbine blade surface temperature lower.
This paper focuses on the heat transfer methodology for a cross-flow, which is the exact type of flow
that exists in the cooling of the turbine blades. In this paper, no specific turbine blade geometry was used.
It is very important to understand that this paper will be followed by an experimental study, that being the main
reason why the numerical simulation was made on similar geometry to a turbine blade. The results of the
upcoming experiment will be compared with the results of the numerical calculation and this comparison will
be presented in a future paper.
2. THEORY BEHIND THE PAPER
The heat transfer calculation begins with the calculation of the Reynolds number. The reason for that
is to determinate what kind of flow it, is so the Nusselt number may be determined, which is one of the
quantities that is needed in the calculation of the heat-transfer coefficient.
The problem itself is described as follows. In a medium of a flow that has as a working fluid air ideal gas with
the temperature equals to 1000℃ and a velocity of 10 𝑚 𝑠⁄ comes across a rectangular plate that has inside it
a number of cooling tubes through which an air ideal gas with the temperature of 600℃ and a velocity of
10 𝑚 𝑠⁄ passes.
The heat transfer will be produced in this order: first, forced convection occurs between the hot air
and the wall, then heat conduction will appear inside the wall, and then internal forced convection. The last
one occurs because the fluid is forced to flow in a desired direction.
One may have probably noticed that most fluids, especially liquids, are transported in circular pipes.
This is because pipes with a circular cross section can withstand large pressure differences between the inside
and the outside without undergoing significant distortion. For a fixed surface area, the circular tube gives the
most heat transfer for the least pressure drop, which explains the overwhelming popularity of circular tubes in
1 Romanian Research and Development Institute for Gas Turbines COMOTI, Bucharest, Romania

M. DOMBROVSCHI
34
heat transfer equipment [1]. This paper will focus on explaining the internal forced flow as much as possible.
Due to its complexity the problem presented earlier can’t be solved analytically.
For the internal flow of the cooling air, it is highly important to understand two physical parameters,
which are the average velocity and temperature, so the next paragraphs will be dedicated to explaining these
parameters. In the external flow, the free-stream velocity served as a convenient reference velocity for use in
the evaluation of the Reynolds number and the friction coefficient. In the internal flow, there is no free stream
and thus an alternative is needed. The fluid velocity in a tube changes from zero at the surface because of the
no-slip condition, to a maximum at the tube center. Therefore, it is convenient to work with an average or mean
velocity, which remains constant for incompressible flow when the cross-sectional area of the tube is constant.
[1]
The value of the average velocity at some streamwise cross section is determined from the requirement
that the conservation of mass principle be satisfied. [2]
�̇� = 𝜌𝑉𝑎𝑣𝑔𝐴𝑐 = ∫ 𝜌𝑢(𝑟)𝑑
𝐴𝑐
𝐴𝑐
(1)
Then, the average velocity for incompressible flow in a circular pipe of radius R is expressed as
𝑉𝑎𝑣𝑔 =∫ 𝜌𝑢(𝑟)𝑑
𝐴𝑐𝐴𝑐
𝜌𝐴𝑐
=∫ 𝜌𝑢(𝑟)2𝜋𝑟 𝑑
𝑅
0𝑟
𝜌𝜋𝑅2=
2
𝑅2∫ 𝑢(𝑟)𝑟 𝑑𝑟
𝑅
0
(2)
where, 𝐴𝑐 is the cross-sectional area, 𝜌 is the density of the fluid, �̇� is the mass flow, 𝑅 is the radius of the
circular pipe and 𝑢(𝑟) is the velocity profile.
Therefore, if the flow rate or the velocity profile are known, the average velocity can be determined
easily [2]. When a fluid is heated or cooled as it flows through a tube, the temperature of the fluid at any cross-
section changes from the temperature at the surface of the wall to some maximum (or minimum in the case of
heating) at the tube center. In fluid flow, it is convenient to work with an average or mean temperature, which
remains constant at a cross section. Unlike the mean velocity, the mean temperature changes in the flow
direction whenever the fluid is heated or cooled. [1]
The value of the mean temperature is determined from the requirement that the conservation of energy principle
be satisfied. That is, the energy transported by the fluid through a cross section in actual flow must be equal to
the energy that would be transported through the same cross section if the fluid were at a constant temperature.
𝑇𝑚 =∫ 𝑐𝑝𝑇(𝑟)𝛿�̇�
�̇�
�̇�𝑐𝑝
(3)
3. NUMERICAL CALCULATION
Before the numerical simulation starts, an analytical calculation is needed for the determination of the
velocity field. This calculation was made using equation 1, imposing the mass flow of the coolant to vary
between 0.4-1.8% of the hot air mass flow. The reason for that is the similarity between this case and the case
of a turbine blade cooling. [3] The results of the analytical calculation can be found in table 1.
Table 1. Results of the numerical calculation
Hot air mass flow: 0.0031331 [kg/s]
Percentage
[%]
Coolant mass flow
[kg/s]
Speed
[m/s]
0.4 0.001253 10.97538
0.5 0.001567 13.71922
0.6 0.00188 16.46307
0.7 0.002193 19.20691
0.8 0.002506 21.95076
0.9 0.00282 24.6946
1 0.003133 27.43845
… … …
1.8 0.00564 49.3892
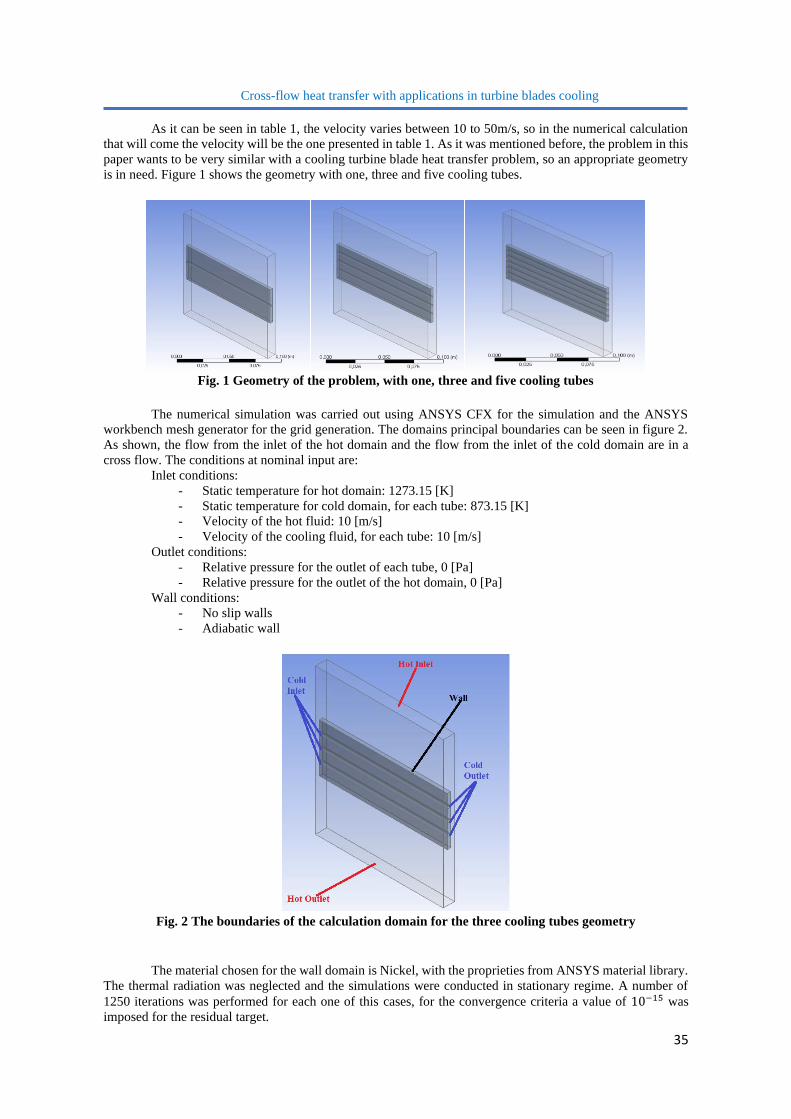
Cross-flow heat transfer with applications in turbine blades cooling
35
As it can be seen in table 1, the velocity varies between 10 to 50m/s, so in the numerical calculation
that will come the velocity will be the one presented in table 1. As it was mentioned before, the problem in this
paper wants to be very similar with a cooling turbine blade heat transfer problem, so an appropriate geometry
is in need. Figure 1 shows the geometry with one, three and five cooling tubes.
Fig. 1 Geometry of the problem, with one, three and five cooling tubes
The numerical simulation was carried out using ANSYS CFX for the simulation and the ANSYS
workbench mesh generator for the grid generation. The domains principal boundaries can be seen in figure 2.
As shown, the flow from the inlet of the hot domain and the flow from the inlet of the cold domain are in a
cross flow. The conditions at nominal input are:
Inlet conditions:
- Static temperature for hot domain: 1273.15 [K]
- Static temperature for cold domain, for each tube: 873.15 [K]
- Velocity of the hot fluid: 10 [m/s]
- Velocity of the cooling fluid, for each tube: 10 [m/s]
Outlet conditions:
- Relative pressure for the outlet of each tube, 0 [Pa]
- Relative pressure for the outlet of the hot domain, 0 [Pa]
Wall conditions:
- No slip walls
- Adiabatic wall
Fig. 2 The boundaries of the calculation domain for the three cooling tubes geometry
The material chosen for the wall domain is Nickel, with the proprieties from ANSYS material library.
The thermal radiation was neglected and the simulations were conducted in stationary regime. A number of
1250 iterations was performed for each one of this cases, for the convergence criteria a value of 10−15 was
imposed for the residual target.
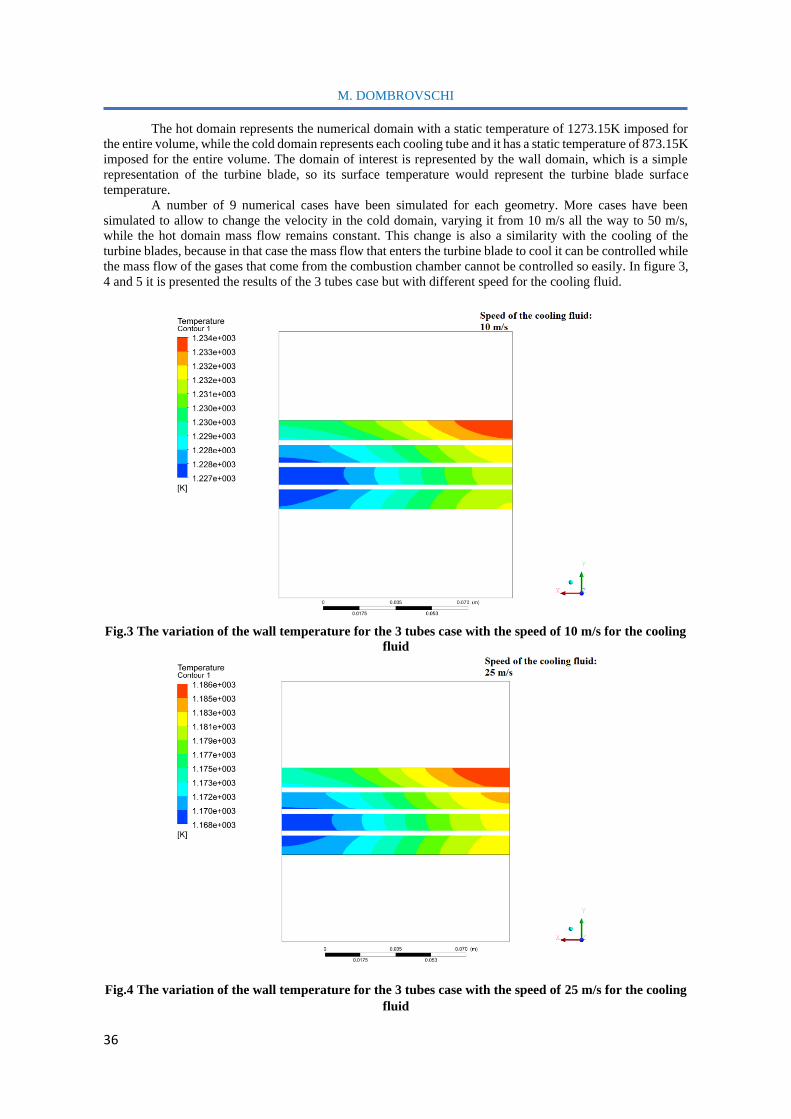
M. DOMBROVSCHI
36
The hot domain represents the numerical domain with a static temperature of 1273.15K imposed for
the entire volume, while the cold domain represents each cooling tube and it has a static temperature of 873.15K
imposed for the entire volume. The domain of interest is represented by the wall domain, which is a simple
representation of the turbine blade, so its surface temperature would represent the turbine blade surface
temperature.
A number of 9 numerical cases have been simulated for each geometry. More cases have been
simulated to allow to change the velocity in the cold domain, varying it from 10 m/s all the way to 50 m/s,
while the hot domain mass flow remains constant. This change is also a similarity with the cooling of the
turbine blades, because in that case the mass flow that enters the turbine blade to cool it can be controlled while
the mass flow of the gases that come from the combustion chamber cannot be controlled so easily. In figure 3,
4 and 5 it is presented the results of the 3 tubes case but with different speed for the cooling fluid.
Fig.3 The variation of the wall temperature for the 3 tubes case with the speed of 10 m/s for the cooling
fluid
Fig.4 The variation of the wall temperature for the 3 tubes case with the speed of 25 m/s for the cooling
fluid
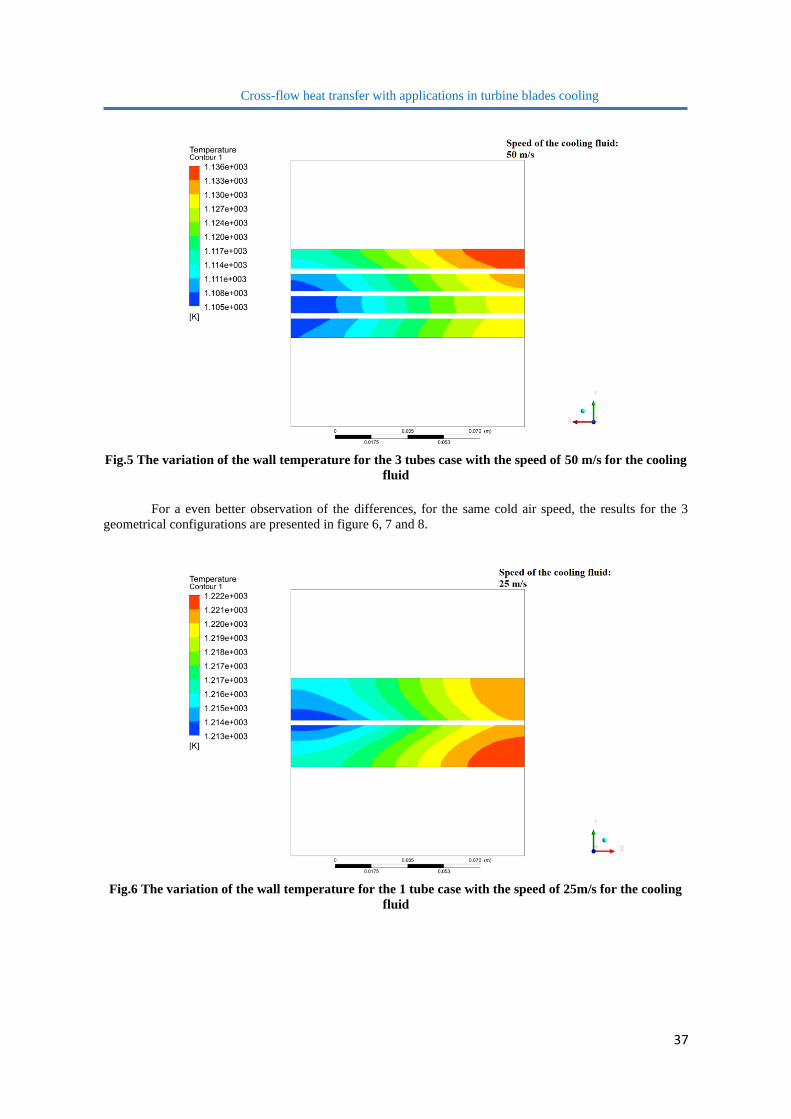
Cross-flow heat transfer with applications in turbine blades cooling
37
Fig.5 The variation of the wall temperature for the 3 tubes case with the speed of 50 m/s for the cooling
fluid
For a even better observation of the differences, for the same cold air speed, the results for the 3
geometrical configurations are presented in figure 6, 7 and 8.
Fig.6 The variation of the wall temperature for the 1 tube case with the speed of 25m/s for the cooling
fluid

M. DOMBROVSCHI
38
Fig.7 The variation of the wall temperature for the 5 tubes case with the speed of 25m/s for the cooling
fluid
Fig.8 The variation of the wall temperature for the 3 tubes case with the speed of 25m/s for the cooling
fluid
4. RESULTS
As it was said before, it was solved a number of nine numerical cases and the interest data were the
maximum, medium and minimum temperature of the wall. In figure 9 it can be seen a graphical illustration of
the wall temperature variation based on the cooling fluid velocity.
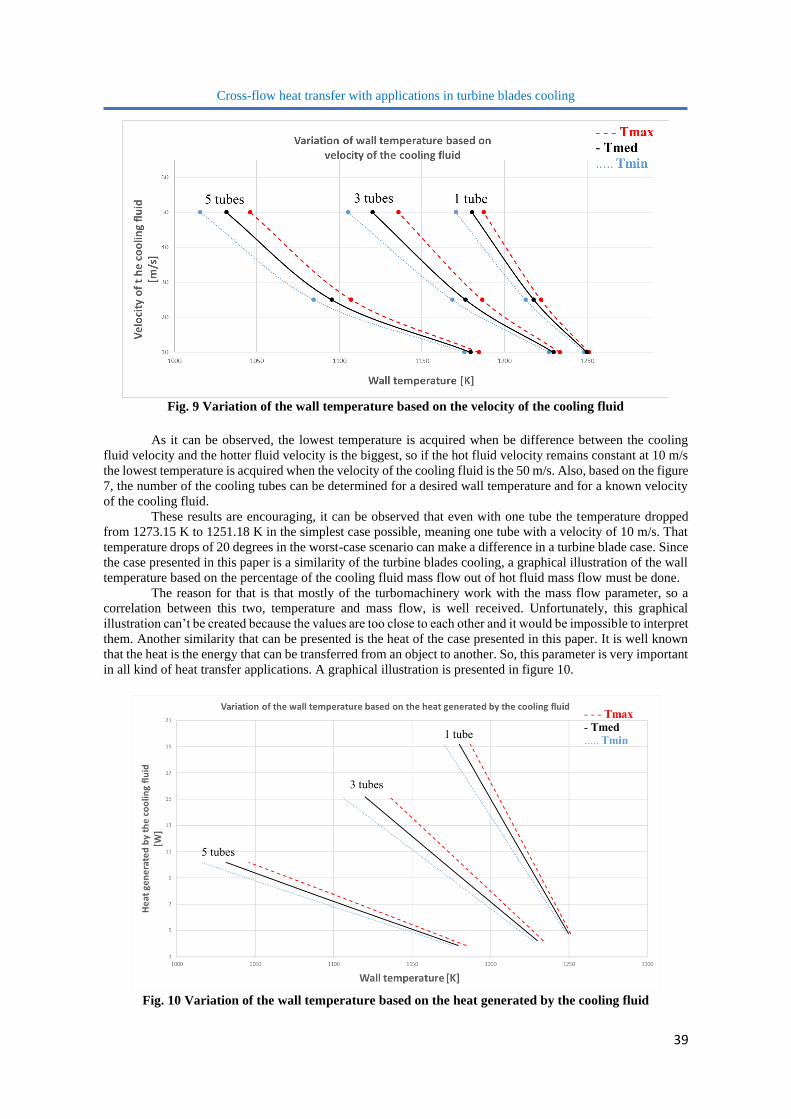
Cross-flow heat transfer with applications in turbine blades cooling
39
Fig. 9 Variation of the wall temperature based on the velocity of the cooling fluid
As it can be observed, the lowest temperature is acquired when be difference between the cooling
fluid velocity and the hotter fluid velocity is the biggest, so if the hot fluid velocity remains constant at 10 m/s
the lowest temperature is acquired when the velocity of the cooling fluid is the 50 m/s. Also, based on the figure
7, the number of the cooling tubes can be determined for a desired wall temperature and for a known velocity
of the cooling fluid.
These results are encouraging, it can be observed that even with one tube the temperature dropped
from 1273.15 K to 1251.18 K in the simplest case possible, meaning one tube with a velocity of 10 m/s. That
temperature drops of 20 degrees in the worst-case scenario can make a difference in a turbine blade case. Since
the case presented in this paper is a similarity of the turbine blades cooling, a graphical illustration of the wall
temperature based on the percentage of the cooling fluid mass flow out of hot fluid mass flow must be done.
The reason for that is that mostly of the turbomachinery work with the mass flow parameter, so a
correlation between this two, temperature and mass flow, is well received. Unfortunately, this graphical
illustration can’t be created because the values are too close to each other and it would be impossible to interpret
them. Another similarity that can be presented is the heat of the case presented in this paper. It is well known
that the heat is the energy that can be transferred from an object to another. So, this parameter is very important
in all kind of heat transfer applications. A graphical illustration is presented in figure 10.
Fig. 10 Variation of the wall temperature based on the heat generated by the cooling fluid

M. DOMBROVSCHI
40
From figure 10, it can be observed that the results of the simulations are correct. As it can be seen, the
highest temperature and heat is obtained in the case with only one cooling tube and the lowest is acquired in
the 5 tubes case. From this figure it can be predicted how the wall temperature will behave for a case with 4 or
2 cooling tubes, also if a lower value of the generated heat is obtained using another fluid, another than air, it
would be interesting to study this problem to see if it’s more viable using another fluid instead of using air from
the compressor.
5. CONCLUSIONS
In this paper was presented a method of cooling a surface that is exposed to a flow of a very high
temperature fluid was presented and analyzed using the numerical simulations. The graphical illustration was
obtained changing one input value multiple times for three different geometries. For future work, as it was said
before, a physical experiment will follow trying to obtain similar results, or with an error of maximum 5%. If
this error will be achieved or lowered, a similar experiment will begin, but this time instead of the simplified
geometry a turbine blade geometry will be introduced. An experimental stand will be created to confirm this
methodology using the same inputs that were presented in this paper, temperature, velocity etc. Then, a cooled
turbine blade will be designed using a CAD program then it will be simulated using a numerical simulation
program then a physical geometry will be created and tested in the same way. The experiment will be made
using a hot source that will produce a flux of a desire temperature on the desired geometry and the cooling will
be produce using pipes that will have installed on them pressure, temperature and mass flow sensors so these
3 parameters can be controlled from distance.
As it was said before, the mass flow of the cold domain in the nominal condition represents 0.63% of the mass
flow of the hot domain, this thing is also encouraging to see such significant drop of temperature with such a
small percentage of the mass flow.
REFERENCES
[1] Yunus A. Cengel, Afshin J. Ghajar, ,, Heat and Mass Transfer: Fundamentals and Applications, 5th
Edition”, McGraw-Hill Science/Engineering/Math, United States of America, 2014, ISBN: 978-007-339-
818-1
[2] J.P. Holman, ,,Heat Transfer tenth Edition”, McGraw-Hill Science/Engineering/Math, United States of
America, 2009, ISBN: 978-007-352-936-3
[3] Daniel Crunțeanu, Ioan Manole, „CALCULUL MOTOARELOR AEROREACTOARE ”- octombrie
2016, editura Politehnica Press, ISBN 978-606-515-714-9
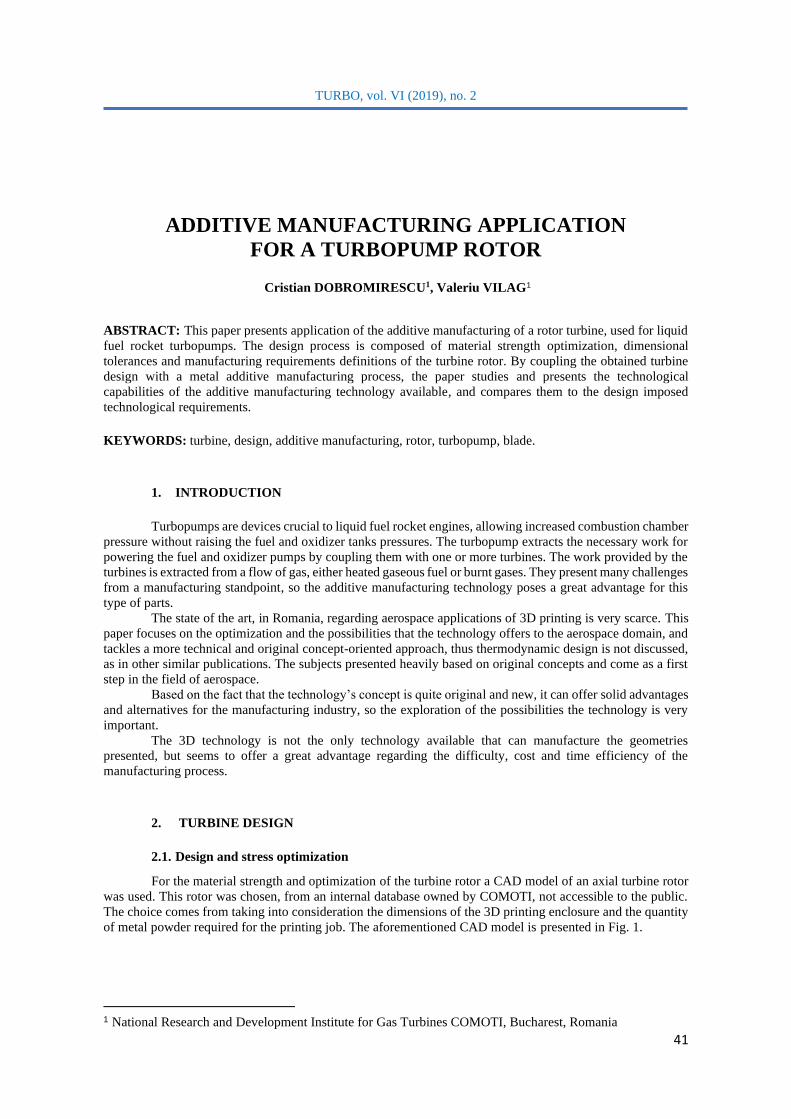
TURBO, vol. VI (2019), no. 2
41
ADDITIVE MANUFACTURING APPLICATION
FOR A TURBOPUMP ROTOR
Cristian DOBROMIRESCU1, Valeriu VILAG1
ABSTRACT: This paper presents application of the additive manufacturing of a rotor turbine, used for liquid
fuel rocket turbopumps. The design process is composed of material strength optimization, dimensional
tolerances and manufacturing requirements definitions of the turbine rotor. By coupling the obtained turbine
design with a metal additive manufacturing process, the paper studies and presents the technological
capabilities of the additive manufacturing technology available, and compares them to the design imposed
technological requirements.
KEYWORDS: turbine, design, additive manufacturing, rotor, turbopump, blade.
1. INTRODUCTION
Turbopumps are devices crucial to liquid fuel rocket engines, allowing increased combustion chamber
pressure without raising the fuel and oxidizer tanks pressures. The turbopump extracts the necessary work for
powering the fuel and oxidizer pumps by coupling them with one or more turbines. The work provided by the
turbines is extracted from a flow of gas, either heated gaseous fuel or burnt gases. They present many challenges
from a manufacturing standpoint, so the additive manufacturing technology poses a great advantage for this
type of parts.
The state of the art, in Romania, regarding aerospace applications of 3D printing is very scarce. This
paper focuses on the optimization and the possibilities that the technology offers to the aerospace domain, and
tackles a more technical and original concept-oriented approach, thus thermodynamic design is not discussed,
as in other similar publications. The subjects presented heavily based on original concepts and come as a first
step in the field of aerospace.
Based on the fact that the technology’s concept is quite original and new, it can offer solid advantages
and alternatives for the manufacturing industry, so the exploration of the possibilities the technology is very
important.
The 3D technology is not the only technology available that can manufacture the geometries
presented, but seems to offer a great advantage regarding the difficulty, cost and time efficiency of the
manufacturing process.
2. TURBINE DESIGN
2.1. Design and stress optimization
For the material strength and optimization of the turbine rotor a CAD model of an axial turbine rotor
was used. This rotor was chosen, from an internal database owned by COMOTI, not accessible to the public.
The choice comes from taking into consideration the dimensions of the 3D printing enclosure and the quantity
of metal powder required for the printing job. The aforementioned CAD model is presented in Fig. 1.
1 National Research and Development Institute for Gas Turbines COMOTI, Bucharest, Romania
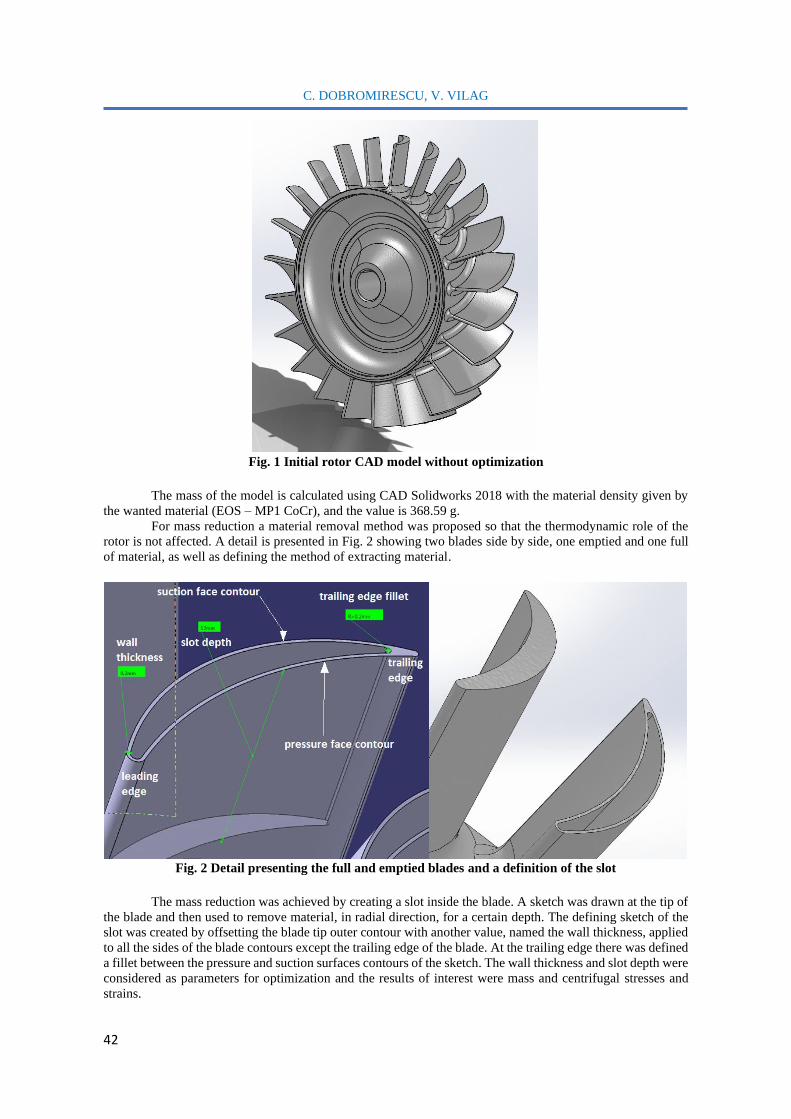
C. DOBROMIRESCU, V. VILAG
42
Fig. 1 Initial rotor CAD model without optimization
The mass of the model is calculated using CAD Solidworks 2018 with the material density given by
the wanted material (EOS – MP1 CoCr), and the value is 368.59 g.
For mass reduction a material removal method was proposed so that the thermodynamic role of the
rotor is not affected. A detail is presented in Fig. 2 showing two blades side by side, one emptied and one full
of material, as well as defining the method of extracting material.
Fig. 2 Detail presenting the full and emptied blades and a definition of the slot
The mass reduction was achieved by creating a slot inside the blade. A sketch was drawn at the tip of
the blade and then used to remove material, in radial direction, for a certain depth. The defining sketch of the
slot was created by offsetting the blade tip outer contour with another value, named the wall thickness, applied
to all the sides of the blade contours except the trailing edge of the blade. At the trailing edge there was defined
a fillet between the pressure and suction surfaces contours of the sketch. The wall thickness and slot depth were
considered as parameters for optimization and the results of interest were mass and centrifugal stresses and
strains.
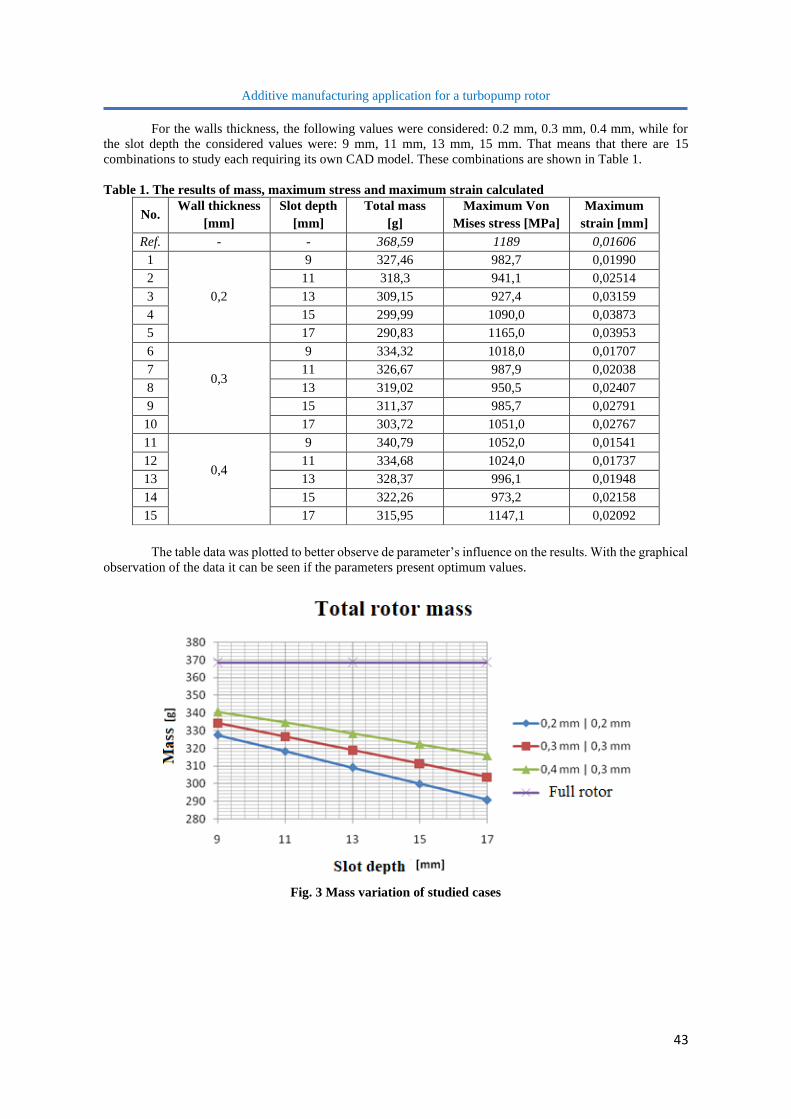
Additive manufacturing application for a turbopump rotor
43
For the walls thickness, the following values were considered: 0.2 mm, 0.3 mm, 0.4 mm, while for
the slot depth the considered values were: 9 mm, 11 mm, 13 mm, 15 mm. That means that there are 15
combinations to study each requiring its own CAD model. These combinations are shown in Table 1.
Table 1. The results of mass, maximum stress and maximum strain calculated
No. Wall thickness
[mm]
Slot depth
[mm]
Total mass
[g]
Maximum Von
Mises stress [MPa]
Maximum
strain [mm]
Ref. - - 368,59 1189 0,01606
1
0,2
9 327,46 982,7 0,01990
2 11 318,3 941,1 0,02514
3 13 309,15 927,4 0,03159
4 15 299,99 1090,0 0,03873
5 17 290,83 1165,0 0,03953
6
0,3
9 334,32 1018,0 0,01707
7 11 326,67 987,9 0,02038
8 13 319,02 950,5 0,02407
9 15 311,37 985,7 0,02791
10 17 303,72 1051,0 0,02767
11
0,4
9 340,79 1052,0 0,01541
12 11 334,68 1024,0 0,01737
13 13 328,37 996,1 0,01948
14 15 322,26 973,2 0,02158
15 17 315,95 1147,1 0,02092
The table data was plotted to better observe de parameter’s influence on the results. With the graphical
observation of the data it can be seen if the parameters present optimum values.
Fig. 3 Mass variation of studied cases
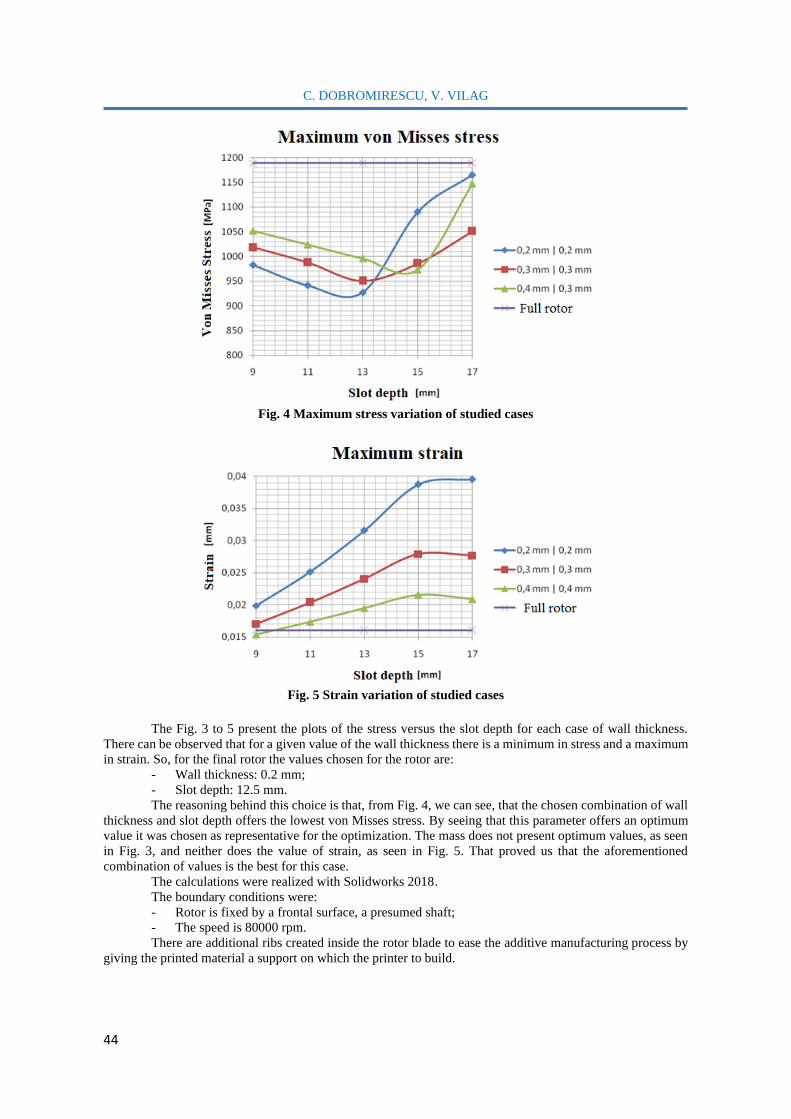
C. DOBROMIRESCU, V. VILAG
44
Fig. 4 Maximum stress variation of studied cases
Fig. 5 Strain variation of studied cases
The Fig. 3 to 5 present the plots of the stress versus the slot depth for each case of wall thickness.
There can be observed that for a given value of the wall thickness there is a minimum in stress and a maximum
in strain. So, for the final rotor the values chosen for the rotor are:
- Wall thickness: 0.2 mm;
- Slot depth: 12.5 mm.
The reasoning behind this choice is that, from Fig. 4, we can see, that the chosen combination of wall
thickness and slot depth offers the lowest von Misses stress. By seeing that this parameter offers an optimum
value it was chosen as representative for the optimization. The mass does not present optimum values, as seen
in Fig. 3, and neither does the value of strain, as seen in Fig. 5. That proved us that the aforementioned
combination of values is the best for this case.
The calculations were realized with Solidworks 2018.
The boundary conditions were:
- Rotor is fixed by a frontal surface, a presumed shaft;
- The speed is 80000 rpm.
There are additional ribs created inside the rotor blade to ease the additive manufacturing process by
giving the printed material a support on which the printer to build.
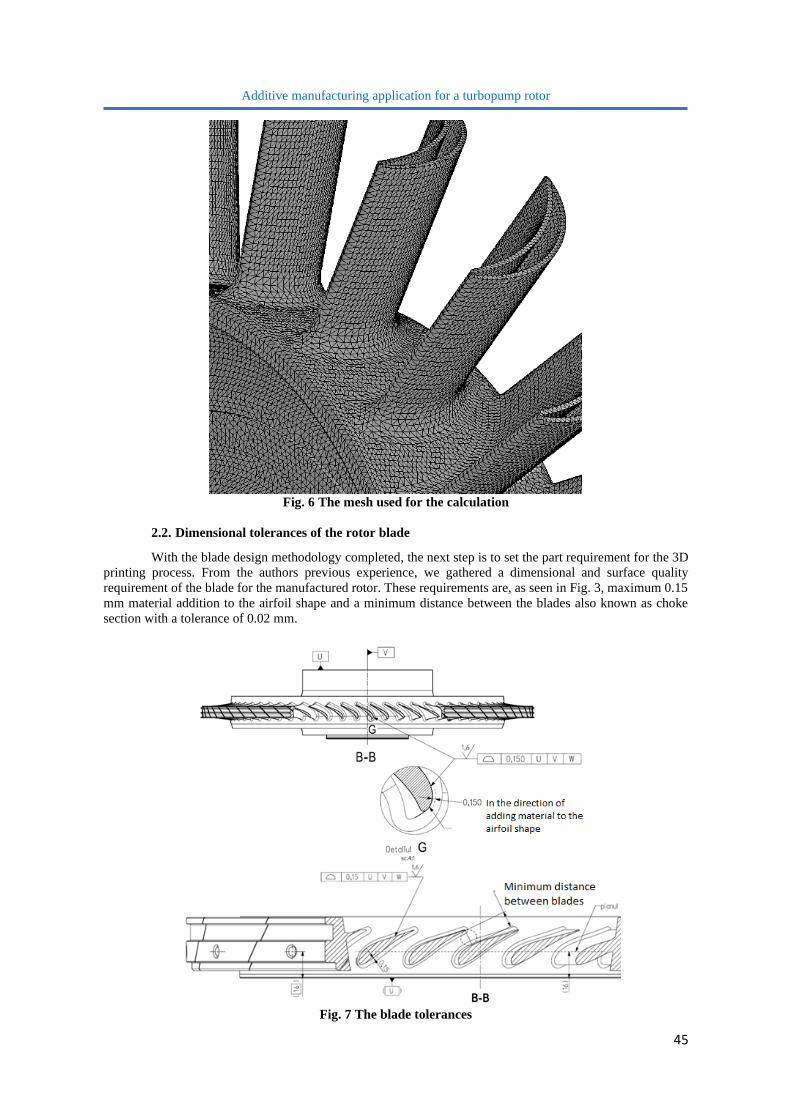
Additive manufacturing application for a turbopump rotor
45
Fig. 6 The mesh used for the calculation
2.2. Dimensional tolerances of the rotor blade
With the blade design methodology completed, the next step is to set the part requirement for the 3D
printing process. From the authors previous experience, we gathered a dimensional and surface quality
requirement of the blade for the manufactured rotor. These requirements are, as seen in Fig. 3, maximum 0.15
mm material addition to the airfoil shape and a minimum distance between the blades also known as choke
section with a tolerance of 0.02 mm.
Fig. 7 The blade tolerances

C. DOBROMIRESCU, V. VILAG
46
Additional tolerances of the rotor are required like the shaft clearance and blade tip clearance. These
types of dimensions that have precise tolerances must be taken into account when designing the rotor. If they
exceed the 3D printer precision they must be limited and made machinable.
3. ADDITIVE MANUFACTURING CAPABILITIES
Now that the requirements of the turbine blade rotor are defined, the next step is studying the
capabilities of the additive manufacturing technology in regards to the two defined requirements. For this task
we created two ways of testing them.
3.1. Material strength of 3D printed metal
The stress of the printed material was tested using test samples situated at different angles on the
printing table, and in different positions, to study a possible connection between orientation, position, and
material strength. The test samples were manufactured in using the 3D printer EOS M270 and the material
used was EOS – MP1 CoCr and machined according to SR EN ISO 6892-1. The choice in material, as opposed
to section 1, was required because of different 3D printing machines with different
Fig. 8 The cylindrical rods on the table, used for manufacturing of the test samples, and the test sample
after the test
The results were obtained by testing the samples using Universal Machine INSTRON 8802 (+/- 250
kN) fitted with an extensometer. In Fig. 9 the experimental test results regarding the mechanical properties of
the test samples is displayed. The red lines represent the tensile stress recorded during the test in Fig. 9 a, and
the load applied to the test subjects plotted against the time passed during the test in Fig. 9 b. The black dots
represent the tensile yield strength and the ultimate tensile strength of the material.
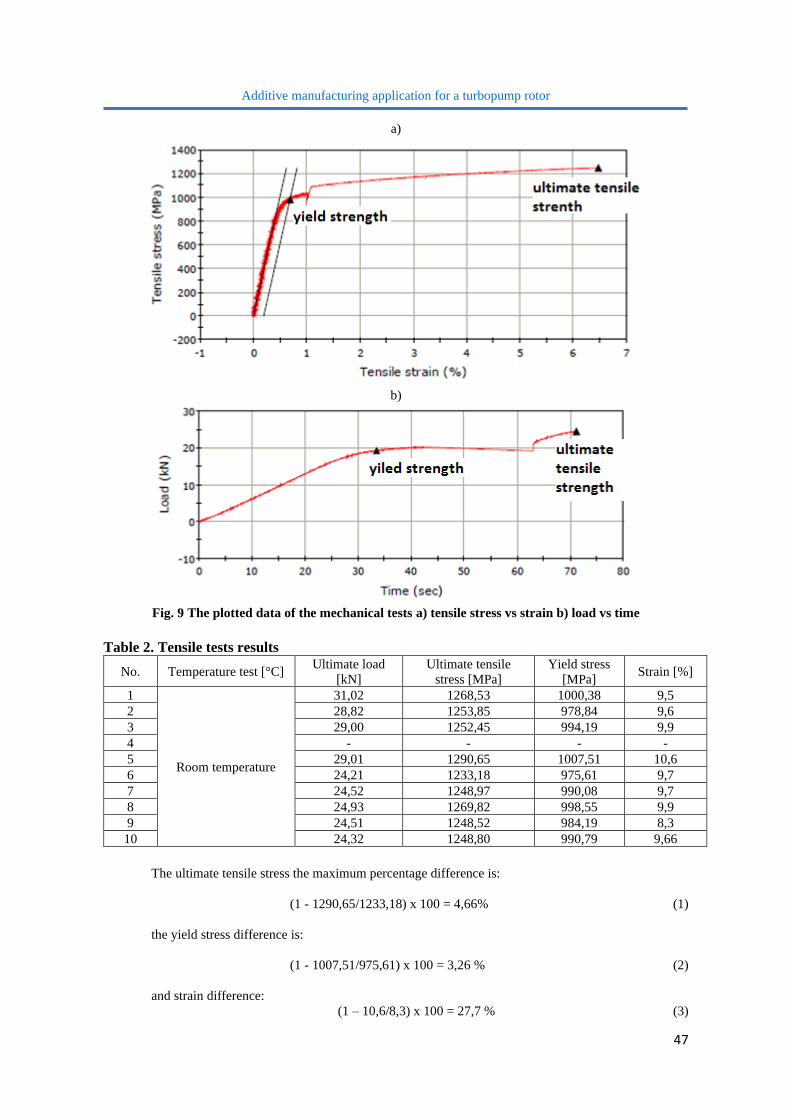
Additive manufacturing application for a turbopump rotor
47
a)
b)
Fig. 9 The plotted data of the mechanical tests a) tensile stress vs strain b) load vs time
Table 2. Tensile tests results
No. Temperature test [°C] Ultimate load
[kN]
Ultimate tensile
stress [MPa]
Yield stress
[MPa] Strain [%]
1
Room temperature
31,02 1268,53 1000,38 9,5
2 28,82 1253,85 978,84 9,6
3 29,00 1252,45 994,19 9,9
4 - - - -
5 29,01 1290,65 1007,51 10,6
6 24,21 1233,18 975,61 9,7
7 24,52 1248,97 990,08 9,7
8 24,93 1269,82 998,55 9,9
9 24,51 1248,52 984,19 8,3
10 24,32 1248,80 990,79 9,66
The ultimate tensile stress the maximum percentage difference is:
(1 - 1290,65/1233,18) x 100 = 4,66% (1)
the yield stress difference is:
(1 - 1007,51/975,61) x 100 = 3,26 % (2)
and strain difference:
(1 – 10,6/8,3) x 100 = 27,7 % (3)
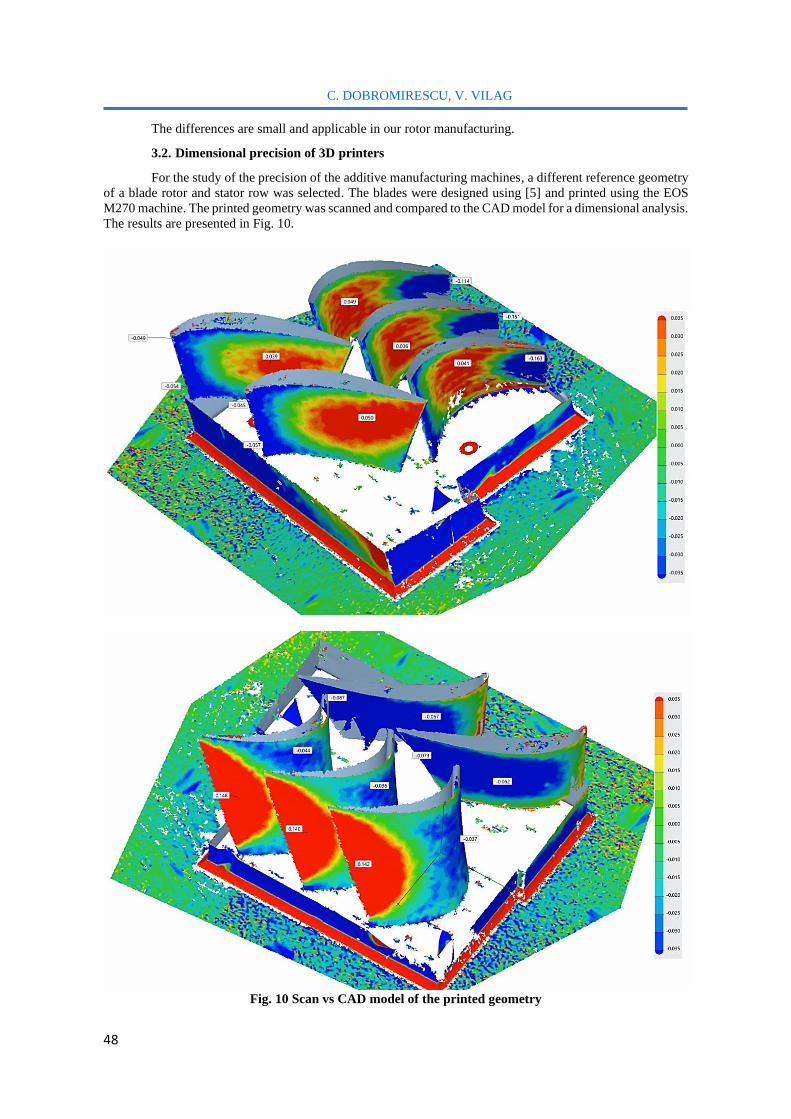
C. DOBROMIRESCU, V. VILAG
48
The differences are small and applicable in our rotor manufacturing.
3.2. Dimensional precision of 3D printers
For the study of the precision of the additive manufacturing machines, a different reference geometry
of a blade rotor and stator row was selected. The blades were designed using [5] and printed using the EOS
M270 machine. The printed geometry was scanned and compared to the CAD model for a dimensional analysis.
The results are presented in Fig. 10.
Fig. 10 Scan vs CAD model of the printed geometry
Additive manufacturing application for a turbopump rotor
49
The green zones indicate a perfect match between the CAD and scanned model, the red zones indicate
an addition of material and the blue zones indicate a lack of material. As can be seen the errors are situated
between -0.163 mm and +0.148 mm and with the defined tolerances of ±0.15 mm and the fact that the red and
blue zones are complementary on the blade, the shape is conserved so the results of the additive manufacturing
process are acceptable
4. CONCLUSIONS
The paper defines the requirements usually found in liquid fuel rocket engine turbopumps and, using
reference models of geometries, tested the capabilities of the additive manufacturing technology from the
material strength and dimension precision standpoints. The results indicate that even in this initial form of the
technology, it is fully capable of creating applications for the aerospace industry, differences being very small
in terms of ultimate tensile stress, yield stress and strain, the values being 4.66%, 3.26% and 27.7%
respectively, when compared to classical manufacturing process. Additional testing will be performed in
different configurations of the rods on the printing table. The dimensional errors obtained for the additive
manufacturing are between -0.163 mm and +0.148 mm, requirements being: ±0.15 mm.
This paper can be used for further research regarding the 3D printing technology application in the
aerospace domain. More so, it can be used as a basis for implementation of the technology in a manufacturing
process for a final product.
ACKNOWLEDGEMENT
The presented study was performed in the frame of 3dRotor project (Romanian Space Agency STAR
Program, ctr. 138/2017) within COMOTI Romanian Research and Development Institute for Gas Turbines.
REFERENCES
[1] David Planchard, “SOLIDWORKS 2018 Tutorial with Video Instruction”, SDC Publications, 2018, ISBN
1630571563;
[2] ISO 6892-1:2016, International Organization for Standardization, 2016;
[3] “Instron Model 8802, 8803, 8804, 8805 and 8806 Load Frames Reference Manual - Pre-Installation”,
Instron Corporation, 2001;
[4] "EOSINT M270 instruction manual", EN 1641 / EN ISO 22674, EOS company.
[5] C. Dobromirescu, V. Vilag, "Energy conversion and efficiency in turboshaft engines", SUSTAINABLE
SOLUTIONS FOR ENERGY AND ENVIRONMENT (EENVIRO 2018), Conference: Cluj-Napoca,
2018, Book Series: E3S Web of Conferences, Volume: 85, Article Number: 01001,
DOI: 10.1051/e3sconf/20198501001;