analele universităţii spiru haretŸti, str. maşina de pâine, nr. 47, sector 2, tel:...
TRANSCRIPT

Analele Universităţii Spiru Haret
Seria Medicină Veterinară
Anul XI, nr. 11, 2010
EDITURA FUNDAŢIEI ROMÂNIA DE MÂINE BUCUREŞTI, 2010
Colegiul de redacţie Prof. univ.dr. Turcu Dănuţ – coordonator Prof. univ. D.H.C. Manolescu Nicolae – membru al Academiei Române Prof. univ. dr. A.T. Bogdan – membru corespondent al Academiei Române Prof. univ. D.H.C. Seiciu Florian – membru al Academiei de Ştiinţe Agricole şi Silvice Prof. univ. D.H.C. Bârză Horea – membru al Academiei de Ştiinţe Agricole şi Silvice Prof. univ. D.H.C Drochner Winfried – Univ. Hohenheim Germania Prof. univ. D.H.C. Coţofan Vasile – USAMV Iaşi, FMV Prof. univ. D.H.C. Stănescu Vasile – USAMV Bucureşti, FMV Conf. univ. dr. Andronie Viorel – USH Bucureşti, FMV Redactori: Conf. univ. dr. Bergheş Carmen Şef lucrări dr. Pârvu Monica – USH Bucureşti, FMV Redacţia: Bucureşti, str. Maşina de Pâine, nr. 47, sector 2, tel: 021.242.15.75 Referenţi ştiinţifici Prof. univ. dr. Cernescu Horia – USAMV Timişoara, FMV Prof. univ. dr Constantin Nicolae – USAMV Bucureşti, FMV Prof. univ. dr. Cornilă Nicolae – USAMV Bucureşti, FMV Prof. univ. dr. Coţofan Otilia – USAMV Iaşi, FMV Prof. univ. dr. Crivineanu Maria – USAMV Bucureşti, FMV Prof. univ. dr. Crivineanu Victor – USAMV Bucureşti, FMV Prof. univ. dr. Diaconescu Ştefan – USAMV Bucureşti, FMV Prof. univ. dr. Dancea Zoe – USAMV Cluj-Napoca, FMV Prof. univ. dr. Decun Mihai – USAMV Timişoara, FMV Prof. univ. dr. Grozea Ion – USAMV Cluj Napoca, FMV Prof. univ. dr Ionescu Emanuela – USAMV Bucuresti, FMV Prof. univ. dr. Mihai Carp Cărare – USAMV Iaşi, FMV Prof. univ. dr. Savu Constantin – USAMV Bucureşti, FMV Prof. univ. dr. Stătescu Constantin – USAMV Bucureşti, FMV Prof. univ. dr. Ştirbu Constantin – USAMV Bucureşti, Facultatea de Biotehnologie Prof. univ. dr. Teuşdea Valer – USAMV Bucureşti, FMV Prof. univ. dr. Ţogoe Iulian – USAMV Bucureşti, FMV Prof. univ. dr. Vlăgioiu Constantin – USAMV Bucureşti, FMV Prof. univ. dr. Coman Toma – USH Bucureşti, FMV Prof. univ. dr. Coman Sofia – USH Bucuresti, FMV Conf. univ. dr. Avram Eugenia –USH Bucureşti, FMV Conf univ. dr. Andronie Ioana Cristina–USH Bucureşti, FMV Conf. univ. dr. Potecea Elena –USH Bucureşti, FMV Conf. univ. dr. Belc Natalia – Institutul de Bioresurse Alimentare
Editură recunoscută de Ministerul Educaţiei, Cercetării, Tineretului şi Sportului prin Consiliul Naţional al Cercetării Ştiinţifice
din Învăţământul Superior (COD 171)
© Editura Fundaţiei România de Mâine, 2010 ISSN: 1454-8283
Revistă cotată CNCSIS la categoria D http://www.spiruharet.ro/facultati/cercetare.phd
Reproducerea integrală sau fragmentară, prin orice formă şi prin orice mijloace tehnice, este strict interzisă şi se pedepseşte conform legii.
Răspunderea pentru conţinutul şi originalitatea textului revine exclusiv autorului/autorilor.
3
CONTENTS
PRECLINIC SECTION
T.Coman, T. Petruţ, Contribution to Blood Morphology Study in Chickens Aged 1-40 Days ........................................................................………………………… 5Daniela Bala1, Manuela Florea-Spiroiu, Dănuţ Turcu, Improvement of Quality and Shelf Life of Hen Eggs by Coating with Biopolymeric Films............……….…….. 23 Carmen Bergheş , M. Cucoaneş , D. Cucă, Clarifications Regarding the Topographical Location of the Vascular, Lymphatic and Nervous Formations from the Thorax Aperture in Pigs and Sheep………………………………………. 33 Ioana Andronie, Monica Pârvu, V. Andronie, G. Şovrea, The Influence of Housing Conditions on the Broiler Welfare ……………………………………… 37 V. Călin, T. Coman, D. Turcu, T. Petruţ, Correlations between Histological Structure and Gravimetrical Changes of Cloacal Bursa in Young Layer Chickens under Immunosuppression Therapy Followed by Immunomodulators Compensatory Treatment......................................................................................... 43D.Cucă, N. Avram, Cristina Dinu, Carmen Bergheş, Eugenia Avram, Study on the Effect of Probiotic Products on Performance of Broilers .....................……… 51Cristina Dinu, N. Avram, D.Cucă, Fl. Leca. (student), Variation on a Regular Sinus Rhythm Pathophisiology of Dog...................................................………….. 57 Cristina Dinu, N. Avram, D. Cucă, Ghe. Tudor (student), Electrocardiogram Features to Romanian Sport Horse....................................………………………… 63 Cristina Dinu, N. Avram, D. Cucă, Alex Dumitru (student), The Behavior of Maternal Care to Bison Bonasus .....................……………………………………. 73 Monica Pârvu, Camelia Donici, Ioana Andronie, Violeta Simion, Adriana Amfim, Interrelation between the Chemical Composition of Pollen and Its Capitalization by the Bees Families, ………………………………………………. 79Violeta-Elena Simion, Fănel Mortu, Research on Alimentation of Working Dogs...…………………………………………………………………………….. 83
CLINIC SECTION V. Andronie, T. Petruţ, Ioana Andronie, Ş. Zamfirescu, T. Stoian, The Cytologic Diagnosis of Canine Prostatic Disorders........................................……………… 91 Elena-Luiza Bădic, N. Avram, Serum Biochemical and Hematological Reactions Due to the Actions of Bacterial Endotoxins from the Shelters´ Air in Pigs..................…………………………………………………………………….. 97 Boh Chang Lin, Identification and Differentiation of Haemophilus parasuis Sero-nontypeable Strains Using a Species-specific PCR and the Digestion of PCR Products with Hind III Endonuclease................…………………………………… 103
Boh Chang Lin, A Novel Approach to Characterize Haemophilus parasuis Field Isolates Using a PCR Assay for Detecting a Neuraminidase Gene and Using a Spot Test for Estimating the Neuraminidase Activity Expressed by the Isolate.............………………………………………… 107 R.S. Singer, M.A. Turcitu, Gh. Bărboi, M. Ward, Elke Starich, Raluca Cioranu, Iuliana Oniţă, Graţiela Neagoe, Adriana Neicuţ1, Handan Coste, Ioana Constantinescu, Pathotyping of Avian Influenza Virus in Romania......................... 115 M.A. Turcitu, Gh. Bărboi, Simona Leau, Lenuţa Zamfir, V. Vuţă, Handan Coste, Ioana Constantinescu, Use of Rt-Pcr Test in Equine Viral Arteritis Diagnostic....... 121 M.A. Turcitu, Gh. Bărboi, V. Vuţă, Lenuţa Zamfir, Handan Coste, D. Boncea, Preliminary Results Regarding Bovine Viral Diarrhea Virus Epidemiology in Romanian Wild Boars................................................................................................ 127 P. Grigorescu, A. Sallay, D. Turcu, Etiology and Diagnosis of Endometritis Studies on the Bitch................................................................................................. 133 Adriana Amfim; Violeta –Elena Simion; Monica Pârvu, Epidemiological Aspects of the Toxoplasmosis Disease in Humans, between 2000-2005 in Bucharest................................................................................................................... 137 Laura Aneta Tudor, Paul Grigorescu, Researches about Orchidectomy for Male Cats and Dogs........................................................................................................... 147 Şt. Nicolae, Gh. Bărboi, A. Stoichici, C. Apostu, I. Şandric, Ş. Cătuşanu, Rabies Evolution to the Fox in Romania, between 2002 – 2009........................................ 151 Dr. Clara Vasilescu, dr. Gh. Onţanu, The Identification of Risk Factors for Bse to Facilitate Performing the Risk Analysis for this Disease……………………….. 155 Dr. Clara Vasilescu, dr. Gh. Onţanu, Risk Analysis Model for Veterinary Laboratories……………………………………………….……………………….. 167
4

5
PRECLINIC SECTION
CONTRIBUTION TO BLOOD MORPHOLOGY STUDY IN CHICKENS AGED 1-40 DAYS
T. COMAN1, T. PETRUŢ1
Email: [email protected]
Abstract
Blood morphology was studied in chickens aged 1, 10, 20 and 40 days old. The morphology study of the formed blood elements was performed on blood smears and bone marrow touch imprints stained with May-Grünwald Giemsa. Quantitative assessment of the formed elements of blood was performed by examining 10 preparations from each group.
The percentage results recorded in day-old chickens show differences from the values observed in adult chickens. Unlike adult chickens, the proportion of lymphocytes is low (approx. 30.27%) and the percentage of heterophyls is large (approx. 63.94%). Reversing the proportion of lymphocytes / heterophyls, seen in adults, occurs after the age of 10 days. Also at age 1 day, in peripheral blood is found a large percentage of polychromatophylic or acidophylic erythroblasts (approx. 14%), the percentage gradually decreases by the age of 40 days when it reaches a level of 4-5%, close to that of adulthood.
At the age of 1-10 days, the percentage of large lymphocytes prevails at the expense of the small ones (approx. 63.94%). The ratio changes slowly for small lymphocytes after 10 days of age, at the age of 20 days small lymphocyte percentage is over 45% of total lymphocytes. Reversing the ratio lymphocytes / heterophyls as well as the proportional change in large/small lymphocytes was correlated with the maturation of the protective lymphoid system of chickens and with the need to ensure immune defence processes with polymorphonuclear cells during early life. Simultaneously with the modification of the lymphocytes/heterophyls ratio, the percentage of monocytes also increased, cells that will leave blood vessels to develop into macrophages.
Keywords: chickens 1-40 days of age, white blood cell count.
1 Faculty of Veterinary Mediciene, Spiru Haret University, Bucharest, Romania.
Introduction The morphology of the blood elements in hen has been studied even as early
as in 1801, when Romanowsky developed the first method to stain the smears with cationic and anionic dyes (eosin and methylene blue) (cited by 17).
The knowledge on blood morphology evolved in the 20th century when Wrigth and May-Grünwald Giemsa staining methods were developed, methods still used today. Most authors considered they were a modification of Romanowsky’s method (1, 10, 20, 21).
Poultry blood morphology has been studied systematically after 1935 when several parasitic poultry diseases produced huge losses among the industrially reared birds (malaria, spirochetosis, micro-philariosis). Kracke and Garver (13), Osgood and Ashworth (18) had important contributions to the terminology and standardization of the blood formed elements in poultry by the atlases they published and by attending congresses.
The studies of poultry blood morphology initiated after 1940 by Kinred (12), Lucas A.M (14), Lucas A.M., C. Jamroz (15), Olson, 1965, Archer, 1971, Leonard, 1982 (cited by de Lucas and Jamroz -15), Schwartze E. and L. Schröder (22), brought important contributions to the knowledge in the poultry blood morphology. The works of Pârvu Gh. et al. (19), Manolescu N. et al. (16), Coman T. (5) also approached poultry blood morphology.
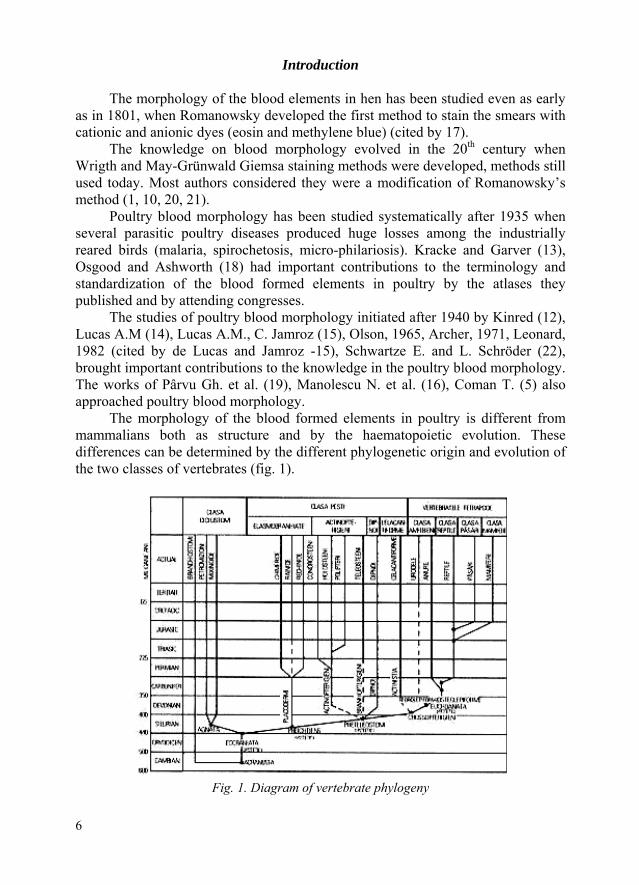
The morphology of the blood formed elements in poultry is different from mammalians both as structure and by the haematopoietic evolution. These differences can be determined by the different phylogenetic origin and evolution of the two classes of vertebrates (fig. 1).
Fig. 1. Diagram of vertebrate phylogeny
6

7
The poultry evolved from reptilians as a class of vertebrate in the Jurassic, after the emergence of the mammalians and they developed independently of the mammalians and reptiles.
The haematopoiesis, the morphological structure and the functions of the blood formed elements differ in the birds from the mammalians by:
− the colony forming unit (CFU) form directly from hemocytoblasts (the mesenchymal stem cell) forming the stem cells for the blood cell series;
− all the evolutive stages of haematopoiesis are regarded as stages of the maturation process of the same stem cell;
− the replication, differentiation and maturation stages of the blood formed elements in poultry are less perfected than in mammalians, the cells having less defined structure and functions throughout haematopoiesis (for instance, the granuloblast, the stem cell of the three adult granulocytes);
− some adult formed elements have less specialised functions than in mammalians (for instance, the thrombocytes which has several functions, among which clotting);
− the origin of the thrombocytes stem cell is not known. In the case of the thrombocytes, a stem cell might originate from the erythroblast, and the maturation process passes through two stages of mature thrombocytes formation, which is a nucleate cell just like the erythrocyte. Thrombocytes are cells with multiple functions, the haemostatic being one of them (Zinkl-23). The mature thrombocytes have a remarkable phagocytic capacity (Chang and Hamilton-4), which make it resemble to the characters of the hemolymph in invertebrates (Janzarik-11);
− the lymphocytic series evolves from the stage of lymphoblast to the mature lymphocyte passing through two stages. The mature lymphocyte has two forms in the peripheral blood: the small lymphocyte and the medium lymphocyte. The large lymphocyte, often observed in the peripheral blood from poultry is regarded as an immature form of evolution, the cell evolving subsequently either towards lymphocytes, or towards monocytes (Lucas A.M.-14). There are no clear evidences on this;
− the stem cell of the granulocytes series is the granuloblast, which has an identical evolution for the three forms of adult granulocytes until the stage of metamyelocyte, when only the tinctorial affinity of the granular formations and their shape distinguish them from heterophyls, eosinophils and basophils;
− the plasmocytic series seems to originate from a conjunctive cell (reticuloblast or osteoblast); they seem not to evolve from B lymphocytes as in mammalians (Lucas A.M. şi A Jamroz-15).
The leukocytic formula in the adult poultry is opposite to that in mammalians. It is characterized by a significant lymphocytosis (in average 60% lymphocytes with a range of 45-75%, function of the species, breed, age, sex), a low number of neutrophils (named heterophyls, in average 28%, with a range of 15-40%), rare basophils and up to 4% eosinophils (range between 1.5-6%) (Nemi J.-17).
The purpose of the paper was to present the morphology of the blood formed elements during the period 1-40 days post-hatching and the dynamics of the post-hatching leukocytic formula, because in a previous paper (5) we noticed the high percentage of heterophyls during the early post-hatching days.
Material and method Groups of 10 day-old light breeds chicks were reared under identical
conditions of feeding and housing up to the age of 40 days. On days 1, 10, 20 and 40, samples were collected from the peripheral blood. The smears were stained by May-Grünwald Giemsa (M.G.G) (8).
The leukocytic formula was assayed for 10 samples for each age category, counting over 100 leukocytes for each smear. The total number of immature erythrocytes was related to 100 leukocytes counted in a smear.
The data were processed statistically by the Student-Fischer test.
Results and discussions The morphology of the blood formed elements during the early post-hatching
days is quite similar to that of the adult poultry and different from the hatching period. The blood formed elements in chicken displayed the following morphological traits during 1-40 post-hatching days and they differ from the mammalians by the high count of blastic formed elements observed in the peripheral blood and by their morphology,
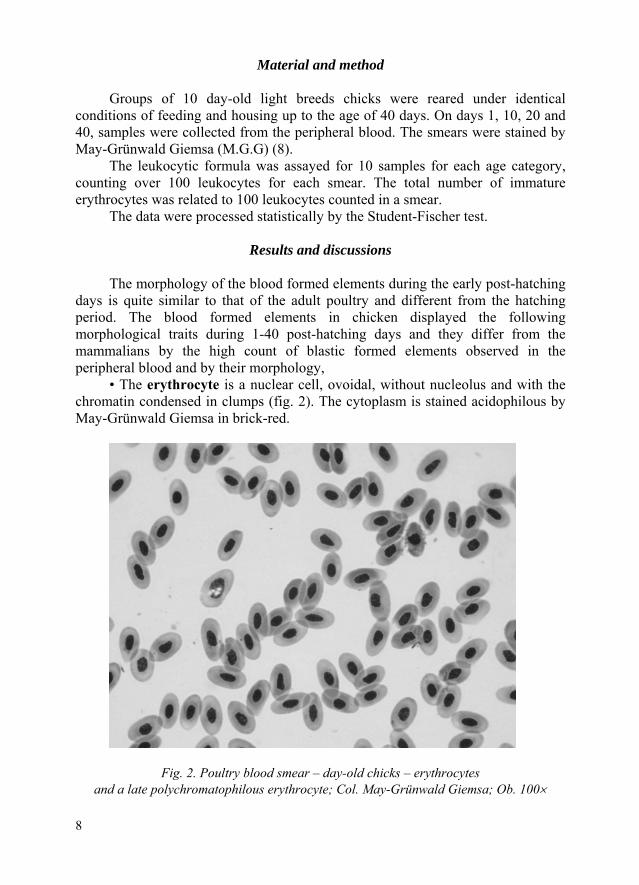
• The erythrocyte is a nuclear cell, ovoidal, without nucleolus and with the chromatin condensed in clumps (fig. 2). The cytoplasm is stained acidophilous by May-Grünwald Giemsa in brick-red.
Fig. 2. Poultry blood smear – day-old chicks – erythrocytes and a late polychromatophilous erythrocyte; Col. May-Grünwald Giemsa; Ob. 100×
8
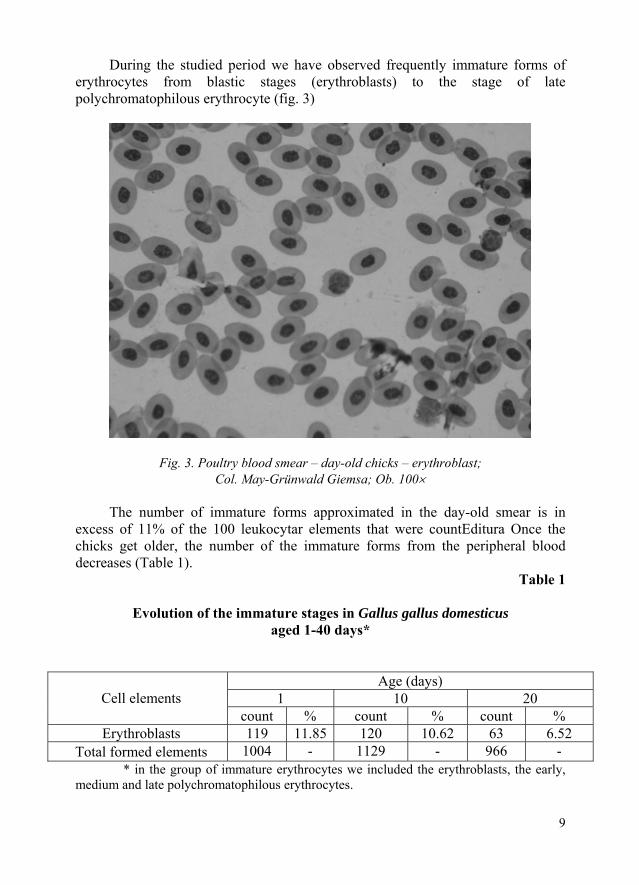
During the studied period we have observed frequently immature forms of erythrocytes from blastic stages (erythroblasts) to the stage of late polychromatophilous erythrocyte (fig. 3)
Fig. 3. Poultry blood smear – day-old chicks – erythroblast; Col. May-Grünwald Giemsa; Ob. 100×
The number of immature forms approximated in the day-old smear is in
excess of 11% of the 100 leukocytar elements that were countEditura Once the chicks get older, the number of the immature forms from the peripheral blood decreases (Table 1).
Table 1
Evolution of the immature stages in Gallus gallus domesticus aged 1-40 days*
Age (days) 1 10 20 Cell elements
count % count % count % Erythroblasts 119 11.85 120 10.62 63 6.52
Total formed elements 1004 - 1129 - 966 - * in the group of immature erythrocytes we included the erythroblasts, the early,
medium and late polychromatophilous erythrocytes.
9

We consider that the presence of the immature forms of erythrocytes in the peripheral blood is caused by the kind of haematopoiesis specific to the poultry, in which the process of haematopoiesis for this category of cells develops within the lumen of the sinusoidal capillaries, not outside them as it takes place in the mammalians, where the cytodiabasis is severely controlled and is allowed only if the cell is mature. Lucas A.M. and C Jamroz (15) cite cases in adult birds where the immature erythrocytes were observed in the peripheral blood even at the age of 5 years and they were not caused by pathological states or by dysfunctions of the erythrocytar series.
• The thromobocyte is a nuclear cell, ovoidal, smaller than the erythrocytes, with the cytoplasm slightly coloured, slightly acidophilous by May-Grünwald Giemsa staining, with one or several azurophilous grains in the cytoplasm (fig. 4).
Fig. 4. Poultry blood smear – day-old chicks – thrombocytes and a late immature thrombocyte; Col. May-Grünwald Giemsa; Ob. 100×
10

The nucleus is spherical, with condensed, homogenous chromatin, without nucleolus and it may be readily mistaken for lymphocytes in the smears. Immature forms of thrombocyte were frequently observed in the smears (fig. 5).
Fig. 5. Poultry blood smear – day-old chicks – early immature thrombocyte;
Col. May-Grünwald Giemsa; Ob. 100× The immature forms were very similar to those of the immature erythrocytes. • The adult lymphocytes are cells of variable size, with large nuclei taking
over 70% of the cytoplasm area. The nucleus is spherical, intensely chromatic, with condensed chromatin, basichromatic, without nucleolus (fig. 6).
Fig. 6. Poultry blood smear – day-old chicks – medium and small lymphocyte;
Col. May-Grünwald Giemsa; Ob. 100×
11
The mature lymphocytes were observed under two forms in the smears: small and medium lymphocytes.
The small lymphocytes are spherical, 7-8 microns large, eccentric nucleus, intensely chromatic, homogenous, taking 90% of the cell area. An area of basophilous cytoplasm can be constantly observed around the nucleus, sometimes with several azurophilous grains. The cell area is unlevelled, displaying temporary modifications determined by the movement of the cell.
The medium lymphocytes are spherical, 8-10 microns large, spherical chromatic nucleus, taking 70-80% of the cell area. The nucleus is surrounded by an area of basophilous cytoplasm with a less intensely coloured juxtanuclear area, next to which several azurophilous grains can be observEditura The chromatin forms clumps. The cell area rarely shows modifications of the surface.
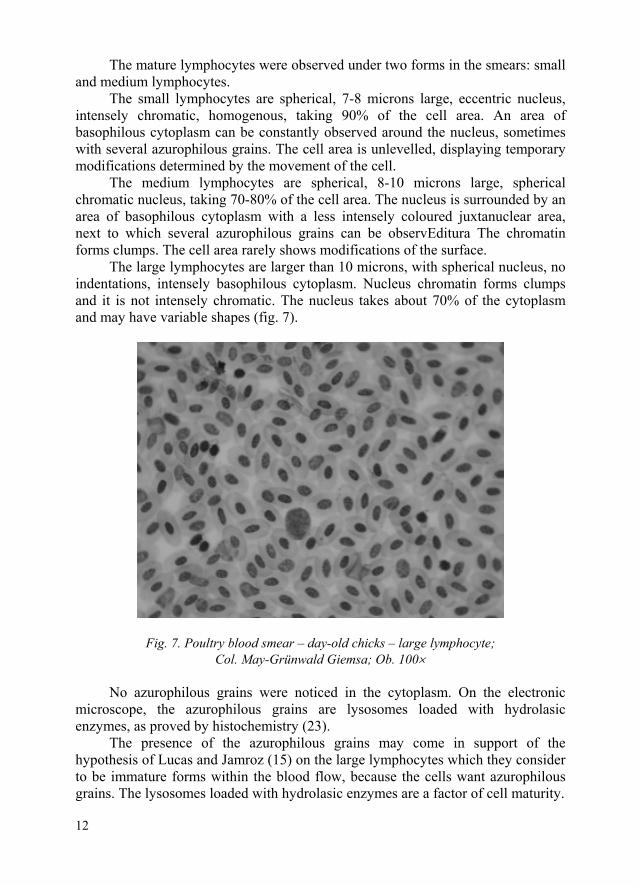
The large lymphocytes are larger than 10 microns, with spherical nucleus, no indentations, intensely basophilous cytoplasm. Nucleus chromatin forms clumps and it is not intensely chromatic. The nucleus takes about 70% of the cytoplasm and may have variable shapes (fig. 7).
Fig. 7. Poultry blood smear – day-old chicks – large lymphocyte; Col. May-Grünwald Giemsa; Ob. 100×
No azurophilous grains were noticed in the cytoplasm. On the electronic
microscope, the azurophilous grains are lysosomes loaded with hydrolasic enzymes, as proved by histochemistry (23).
The presence of the azurophilous grains may come in support of the hypothesis of Lucas and Jamroz (15) on the large lymphocytes which they consider to be immature forms within the blood flow, because the cells want azurophilous grains. The lysosomes loaded with hydrolasic enzymes are a factor of cell maturity.
12
13
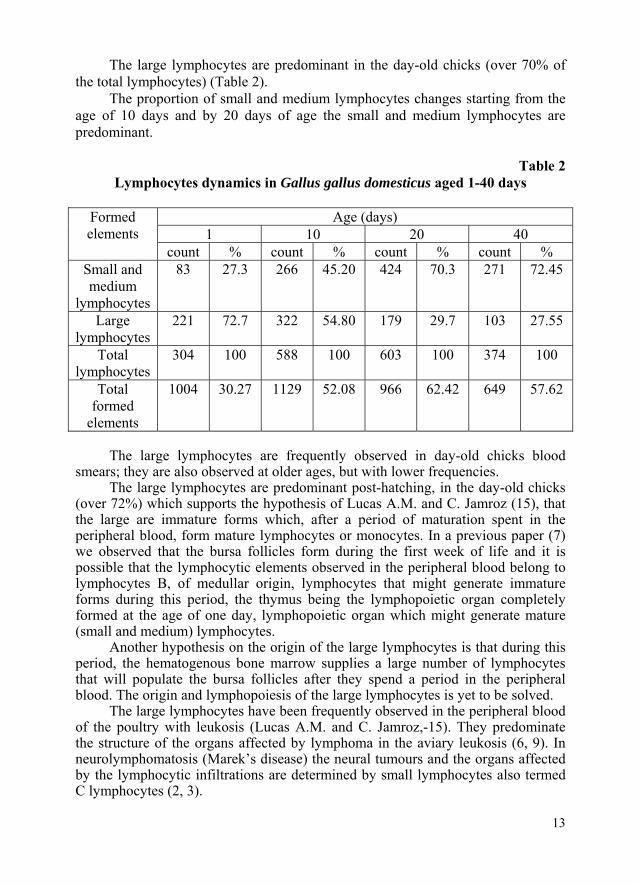
The large lymphocytes are predominant in the day-old chicks (over 70% of the total lymphocytes) (Table 2).
The proportion of small and medium lymphocytes changes starting from the age of 10 days and by 20 days of age the small and medium lymphocytes are predominant.
Table 2
Lymphocytes dynamics in Gallus gallus domesticus aged 1-40 days
Age (days) 1 10 20 40
Formed elements
count % count % count % count % Small and medium
lymphocytes
83 27.3 266 45.20 424 70.3 271 72.45
Large lymphocytes
221 72.7 322 54.80 179 29.7 103 27.55
Total lymphocytes
304 100 588 100 603 100 374 100
Total formed
elements
1004 30.27 1129 52.08 966 62.42 649 57.62
The large lymphocytes are frequently observed in day-old chicks blood
smears; they are also observed at older ages, but with lower frequencies. The large lymphocytes are predominant post-hatching, in the day-old chicks
(over 72%) which supports the hypothesis of Lucas A.M. and C. Jamroz (15), that the large are immature forms which, after a period of maturation spent in the peripheral blood, form mature lymphocytes or monocytes. In a previous paper (7) we observed that the bursa follicles form during the first week of life and it is possible that the lymphocytic elements observed in the peripheral blood belong to lymphocytes B, of medullar origin, lymphocytes that might generate immature forms during this period, the thymus being the lymphopoietic organ completely formed at the age of one day, lymphopoietic organ which might generate mature (small and medium) lymphocytes.
Another hypothesis on the origin of the large lymphocytes is that during this period, the hematogenous bone marrow supplies a large number of lymphocytes that will populate the bursa follicles after they spend a period in the peripheral blood. The origin and lymphopoiesis of the large lymphocytes is yet to be solved.
The large lymphocytes have been frequently observed in the peripheral blood of the poultry with leukosis (Lucas A.M. and C. Jamroz,-15). They predominate the structure of the organs affected by lymphoma in the aviary leukosis (6, 9). In neurolymphomatosis (Marek’s disease) the neural tumours and the organs affected by the lymphocytic infiltrations are determined by small lymphocytes also termed C lymphocytes (2, 3).

The immature forms of lymphocytes were frequently observed until the age of 20 days (fig. 8).
Fig. 8. Poultry blood smear – 20 days old chicks – two lymphoblasts; Col. May-Grünwald Giemsa; Ob. 100×
• The monocytes are large cells (over 14 microns) with excentric nucleus,
less basichromatic, reniform, with indentations (fig. 9). The cells resembles to the mammalian monocyte, the nucleus taking 45-50% of the cell area. The cytoplasm stains basophilous and has 1-2 azurophilous grains. A less coloured area because of the Golgi complex surrounds the nucleus (23).
Fig. 9. Poultry blood smear – 20 days old chicks – monocyte; Col. May-Grünwald Giemsa; Ob. 100×
14
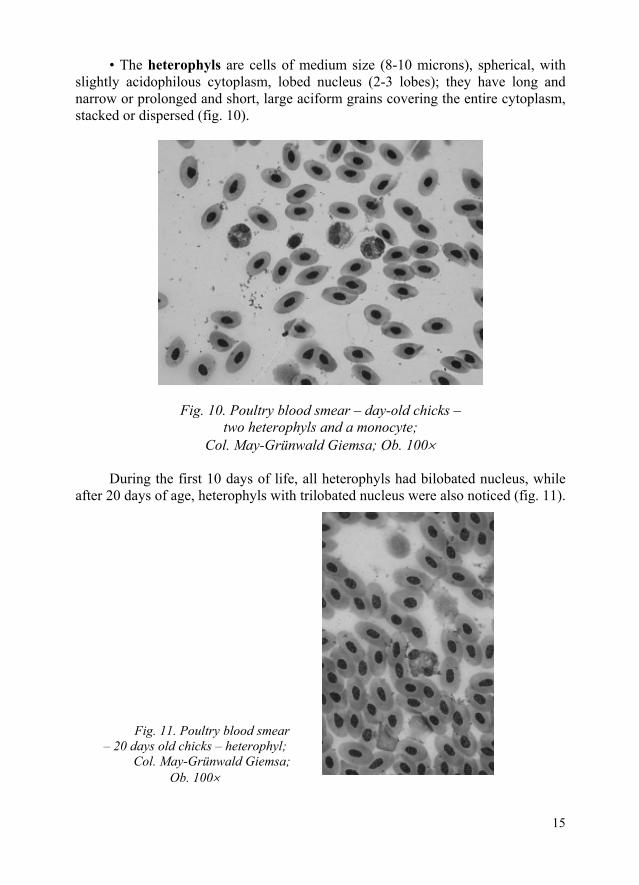
• The heterophyls are cells of medium size (8-10 microns), spherical, with slightly acidophilous cytoplasm, lobed nucleus (2-3 lobes); they have long and narrow or prolonged and short, large aciform grains covering the entire cytoplasm, stacked or dispersed (fig. 10).
Fig. 10. Poultry blood smear – day-old chicks – two heterophyls and a monocyte;
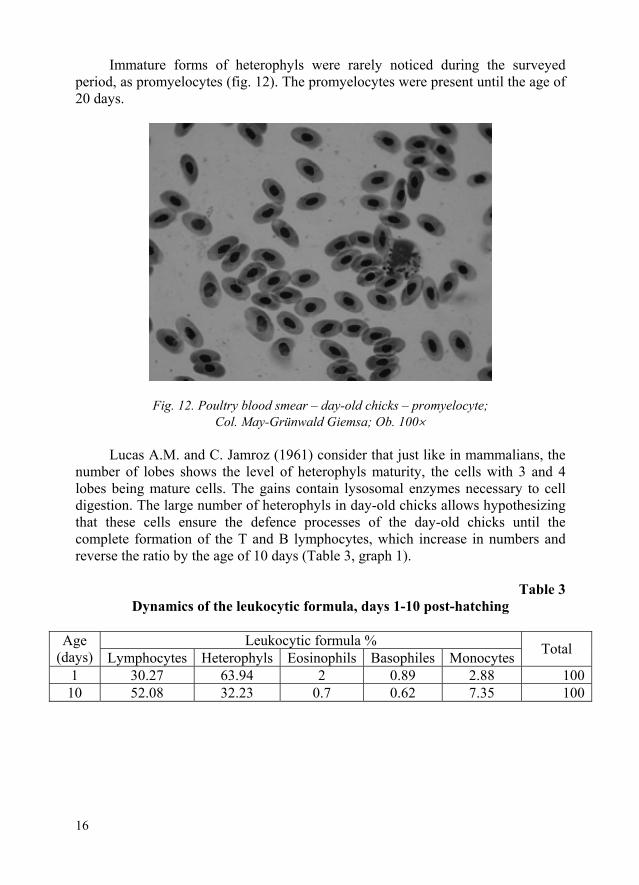
Col. May-Grünwald Giemsa; Ob. 100× During the first 10 days of life, all heterophyls had bilobated nucleus, while
after 20 days of age, heterophyls with trilobated nucleus were also noticed (fig. 11).
Fig. 11. Poultry blood smear – 20 days old chicks – heterophyl;
Col. May-Grünwald Giemsa; Ob. 100×
15
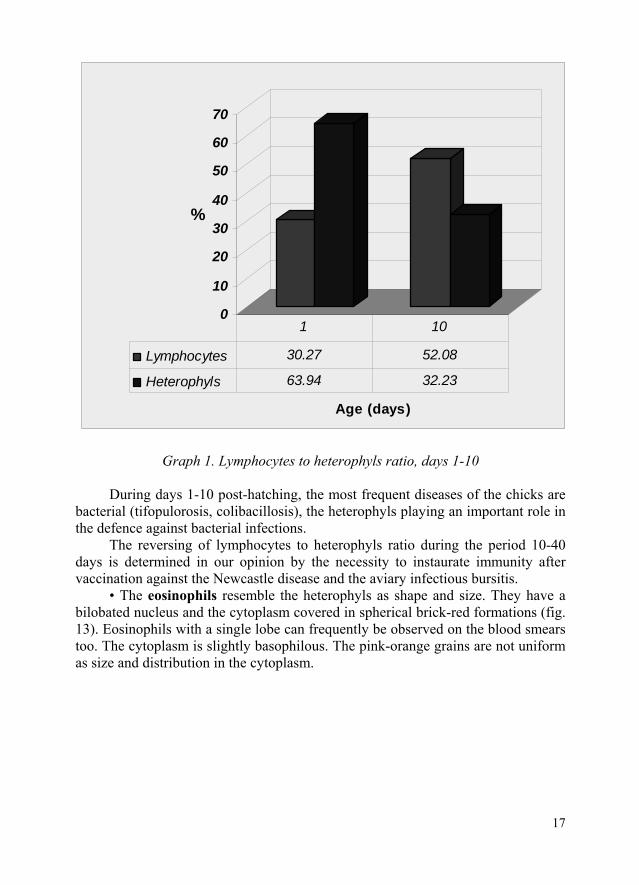
Immature forms of heterophyls were rarely noticed during the surveyed period, as promyelocytes (fig. 12). The promyelocytes were present until the age of 20 days.
Fig. 12. Poultry blood smear – day-old chicks – promyelocyte; Col. May-Grünwald Giemsa; Ob. 100×
Lucas A.M. and C. Jamroz (1961) consider that just like in mammalians, the
number of lobes shows the level of heterophyls maturity, the cells with 3 and 4 lobes being mature cells. The gains contain lysosomal enzymes necessary to cell digestion. The large number of heterophyls in day-old chicks allows hypothesizing that these cells ensure the defence processes of the day-old chicks until the complete formation of the T and B lymphocytes, which increase in numbers and reverse the ratio by the age of 10 days (Table 3, graph 1).
Table 3
Dynamics of the leukocytic formula, days 1-10 post-hatching
Leukocytic formula % Age (days) Lymphocytes Heterophyls Eosinophils Basophiles Monocytes Total
1 30.27 63.94 2 0.89 2.88 100 10 52.08 32.23 0.7 0.62 7.35 100
16
0
10
20
30
40
50
60
70
%
Age (days)
Lymphocytes 30.27 52.08
Heterophyls 63.94 32.23
1 10
Graph 1. Lymphocytes to heterophyls ratio, days 1-10 During days 1-10 post-hatching, the most frequent diseases of the chicks are
bacterial (tifopulorosis, colibacillosis), the heterophyls playing an important role in the defence against bacterial infections.
The reversing of lymphocytes to heterophyls ratio during the period 10-40 days is determined in our opinion by the necessity to instaurate immunity after vaccination against the Newcastle disease and the aviary infectious bursitis.
• The eosinophils resemble the heterophyls as shape and size. They have a bilobated nucleus and the cytoplasm covered in spherical brick-red formations (fig. 13). Eosinophils with a single lobe can frequently be observed on the blood smears too. The cytoplasm is slightly basophilous. The pink-orange grains are not uniform as size and distribution in the cytoplasm.
17
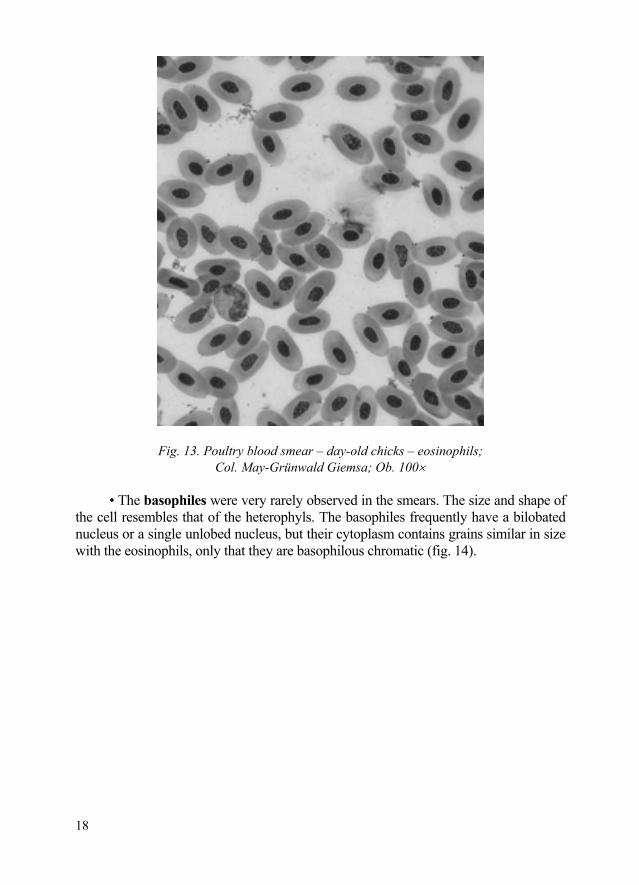
Fig. 13. Poultry blood smear – day-old chicks – eosinophils; Col. May-Grünwald Giemsa; Ob. 100×
• The basophiles were very rarely observed in the smears. The size and shape of
the cell resembles that of the heterophyls. The basophiles frequently have a bilobated nucleus or a single unlobed nucleus, but their cytoplasm contains grains similar in size with the eosinophils, only that they are basophilous chromatic (fig. 14).
18

Fig. 14. Poultry blood smear – day-old chicks – basophilous; Col. May-Grünwald Giemsa; Ob. 100×
The grains of the basophiles are smaller than those of the eosinophils. The
cytoplasm of the basophiles is very little coloured or slightly basophilous. The nucleus is chromatic, with the chromatin gathered in clumps. The nucleus has no nucleolus and sometimes has two lobes. The immature forms observed in the peripheral blood were under the form of granuloblasts or promyelocytes, which can evolve towards basophiles or heterophyls.
Table 4 shows the values of the leukocytic formula in chick, between 1-40 days of age.
Table 4
Dynamics of the leukocytic formula in Gallus gallus domesticus aged 1-40 days
1day 10 days 20 days 40 days Adult* Formed
elements count % count % count % count % count % average/variation
Heterophyls 642 63.94 443 39.23 293 30.33 219 33.74 - 28 (15-40) Eosinophils 20 2 8 0.7 6 0.62 4 0.61 - 4 (1.5-6) Basophiles 9 0.89 7 0.62 0 0 1 0.15 - rare Monocytes 29 2.88 83 7.35 64 6.62 51 7.85 - 8 (5-10)
Lymphocytes 304 30.27 588 52.08 603 62.42 374 57.62 - 60 (45-70) Total count 1004 100 1129 100 966 100 649 100 - 100
* according to Nemi C. Jain - Schalm′s Veterinary Haematology (17)
19
20
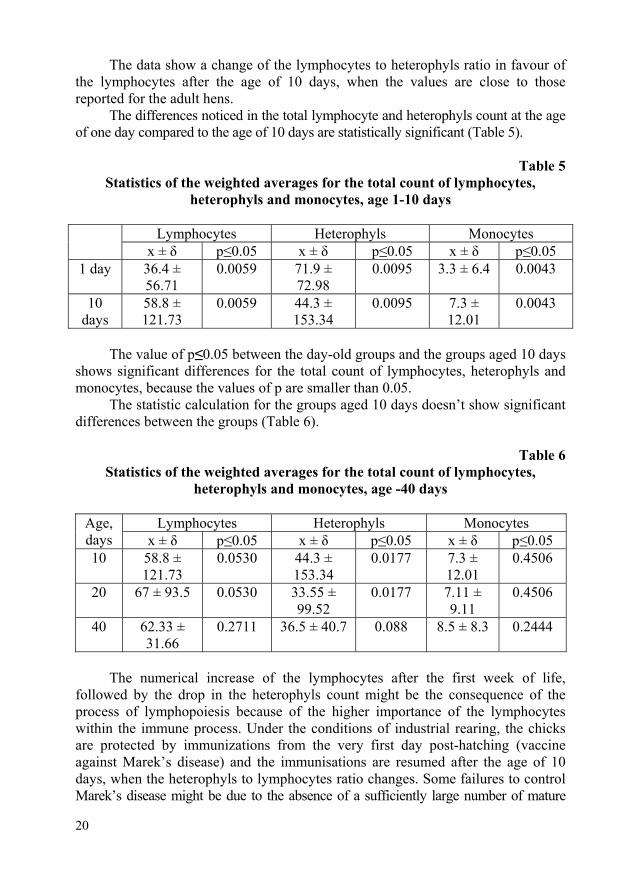
The data show a change of the lymphocytes to heterophyls ratio in favour of the lymphocytes after the age of 10 days, when the values are close to those reported for the adult hens.
The differences noticed in the total lymphocyte and heterophyls count at the age of one day compared to the age of 10 days are statistically significant (Table 5).
Table 5
Statistics of the weighted averages for the total count of lymphocytes, heterophyls and monocytes, age 1-10 days
Lymphocytes Heterophyls Monocytes
x ± δ p≤0.05 x ± δ p≤0.05 x ± δ p≤0.05 1 day 36.4 ±
56.71 0.0059 71.9 ±
72.98 0.0095 3.3 ± 6.4 0.0043
10 days
58.8 ± 121.73
0.0059 44.3 ± 153.34
0.0095 7.3 ± 12.01
0.0043
The value of p≤0.05 between the day-old groups and the groups aged 10 days
shows significant differences for the total count of lymphocytes, heterophyls and monocytes, because the values of p are smaller than 0.05.
The statistic calculation for the groups aged 10 days doesn’t show significant differences between the groups (Table 6).
Table 6
Statistics of the weighted averages for the total count of lymphocytes, heterophyls and monocytes, age -40 days
Lymphocytes Heterophyls Monocytes Age,
days x ± δ p≤0.05 x ± δ p≤0.05 x ± δ p≤0.05 10 58.8 ±
121.73 0.0530 44.3 ±
153.34 0.0177 7.3 ±
12.01 0.4506
20 67 ± 93.5 0.0530 33.55 ± 99.52
0.0177 7.11 ± 9.11
0.4506
40 62.33 ± 31.66
0.2711 36.5 ± 40.7 0.088 8.5 ± 8.3 0.2444
The numerical increase of the lymphocytes after the first week of life,
followed by the drop in the heterophyls count might be the consequence of the process of lymphopoiesis because of the higher importance of the lymphocytes within the immune process. Under the conditions of industrial rearing, the chicks are protected by immunizations from the very first day post-hatching (vaccine against Marek’s disease) and the immunisations are resumed after the age of 10 days, when the heterophyls to lymphocytes ratio changes. Some failures to control Marek’s disease might be due to the absence of a sufficiently large number of mature

21
lymphocytes during the age period 1-10 days, process which is determined by the conditions of incubation or by the quality of the embryonated eggs and by the insufficient maturation of the cloacal bursa. Over the age period 1-10 days, the cloacal bursa organises its bursa follicles, organ which differentiates its lymphocytes from the mesenchymal cells existing in the follicle cortex. The mechanism of bursa follicles differentiation is yet to be elucidatEditura The change of the heterophyls to lymphocytes ratio takes place around the age of 8 days post-hatching (5).
Conclusions
1. The leukocytic formula of the chicks during their early days of life is
predominantly heterophylic. The change of the heterophyls to lymphocytes ratio takes place after the age of 10 days, when the percentage of heterophyls decreases from 63.94% to 39.23%.
2. No statistically significant (p≤0.05) differences in the leukocytic formula were noticed between groups after the age of 10 days, the leukocytic formula being identical with that of the adult poultry.
3. Except for the day-old age, the leukocytic formula is predominantly leukocytar. The percentage of lymphocytes varies between 52.08% and 62.42% over the age period 10-40 days.
4. During the first week post-hatching, lymphocytosis is determined by the large lymphocytes (over 72.7%); this percentage decreases as the chicks grow and reaches 27.55% by the age of 40 days.
5. Immature forms of the formed blood elements were frequently observed in the peripheral blood: erythroblasts, early and late polychromatophilous erythrocytes, lymphoblasts, promyelocytes, early and late immature thrombocytes.
6. The frequency of the immature erythrocytes (early and late immature polychromatophilous erythrocytes) exceeds 11% in day-old chicks, decreasing thereafter to 7% by the age of 20 days.
References
1. Berceanu Ştefan şi colab., Hematologie clinică, Editura Medicală,
Bucureşti, 1977. 2. Biggs P.M., Marek′s Disease, Current Status of Knowledge, “Current
Top Microbiol. Imunology”, Vol. 143, pp. 92-105, 1968. 3. Calnek B.W., R.L. Writter, Marek′s Disease in Diseases of Poultry 7 th
Editura Hofstod M. P. Editura Iowa State Univ. Press Amer., pp. 385-418, 1977. 4. Chang C.F., B.P. Hamilton, The Trombocyte as a Primary Phagocyte in
Chickens, J. Reticuloendothel. Soc., Vol. 25, pp. 585-593, 1967. 5. Coman T., Studii citomorfologice asupra populaţiilor celulare din unele
organe hematopoetice şi limfopoetice la pui în vârstă de 1-11 zile, Ses. ştinţifică a cadrelor didactice şi studenţilor, 6 mai 2010.
22
6. Coman T., Gh. Pârvu, N. Cornilă, Aspecte citomorfologice ale sângelui la puii S.P.F. inoculaţi cu tulpina SR-RAV1 şi RAV2 a virusului de leucoză sarcom-aviar, Lucr. ştiinţ. F.M.V. Bucureşti, pp. 140-143, 1998.
7. Coman T., T. Petruţ, Contribuţii la studiul dezvoltării ontogenetice a bursei cloacale la puii de găină liberi de germeni patogeni specifici. „Analele Univ. Spiru Haret, Seria Medicină Veterinară” Anul III, Nr. 3, pp. 27-36, 2002.
8. Coman T., T. Petruţ, Histologie practică, Vol. I, Editura Fundaţiei România de Mâine, Bucureşti, pp. 185, 2009.
9. Coman T., V. Teuşdea, Diagnosticul diferenţial morfologic al limfoamelor maligne la găină. Lucr. Şt. Cong. Naţ. Cancer, Poiana Braşov, pp. 114-117, 1997.
10. Dacie J.V., S.M. Lewis, Practical Haematology, Editura Churchill Livingstone, London, New York, pp. 552, 1984.
11. Janzarik H., Nucleated Thrombocytoid Cells II Phase and Interference, Contrast Microscopic Studie son Blood Cells of the Domestic Fowl, Cell Tissue Res., Vol. 219, pp. 497-505, 1981.
12. Kindred J.E., A Cantitative Study of Hematopoietic Organs of Young Albino Rats, Am. J. Anat., Vol. 67, pp. 99-149, 1940.
13. Kracke R.R., H.E. Garver, Diseases of the Blood and Atlas Hematology, Ed. J.P. Lippincott Philadelphia, pp. 532, 1937.
14. Lucas A.M., A Discussion of Synonymy in Avian and Mammalian Hematological Nomen, Nature Am. J. Vet. Res., Vol. 20, pp. 887-897, 1959.
15. Lucas A.M., C. Jamroz, Atlas of Avian Hematology, Washington, SUA, 1961. 16. Manolescu N. şi colab., Tratat de hematologie animală, Vol. I şi II,
Editura Fundaţiei România de Mâine, Bucureşti, 1999. 17. Osgood E., C.M. Ashworth, Atlas of Hematology, J.W. Stacey, San
Francisco, SUA, 1937. 18. Pârvu Gh., I. Barna, A. Căprariu, Hematologie veterinară practică,
Editura Ceres, Bucureşti, pp. 228, 1984. 19. Popescu Mut Delia, Hematologie clinică, Editura Medicală, Bucureşti, 1999. 20. Răileanu C., Ioana Răileanu Moţoiu, Atlas de hematologie clinică,
Editura Acad. RSR, Bucureşti, pp. 391, 1974. 21. Schwarze E., L. Schröder, Kompendium der Geflügelanatomie, Editura
VEB Gustav Fischer Verlag Jena Gemany, pp. 279, 1972. 22. Zinkl J.G., Avian Hematology in Schalm′s Veterinary Hematology sub redacţia
Nemi J. – Fourth Edition Lea and Febiger, Philadelphia SUA, pp. 256-273, 1986.
23
IMPROVEMENT OF QUALITY AND SHELF LIFE OF HEN EGGS BY COATING WITH BIOPOLYMERIC FILMS
Daniela BALA∗, Manuela FLOREA-SPIROIU1, D. TURCU2
Abstract
The effects of various coatings of chitosan solutions (simple or
mixed with silver nitrate) on fresh eggs quality were evaluated during 5 weeks of storage at two different temperatures (50C and 250C). The investigated quality parameters were: weight loss, yolk index, Haugh unit, pH of albumen and pH of yolk, foaming capacity, foam stability of albumen solutions, emulsion capacity of yolk and egg white crystallization.
During storage, all egg weights and albumen heights decreased and albumen and yolk pH increased. Coated eggs had significantly lower weight loss than uncoated eggs. The lowest weight loss was observed in chitosan coated eggs at 50C. The albumen and yolk pH of the uncoated eggs was higher than that of coated eggs and increased during storage time. The Haugh unit and yolk index values of all coated eggs were significantly higher than those of control eggs. Various chitosan coatings can be used for preserving the internal quality of albumen and yolk and shelf life of hen eggs can be extended for at least 2 wk longer than the control non-coated eggs.
Keywords: chitosan-coating, hen eggs, shelf life, Haugh unit, yolk index
Introduction Eggs are one of the most inexpensive source of quality protein and other
nutrients, but they are very perishable and can lose their quality. Several problems are encountered during storage of eggs such as weight loss, interior quality deterioration and microbial contamination. Eggshell is a porous breathable material and allows the movement of carbon dioxide and moisture from albumen through the shell leading to quality changes in albumen and yolk and weight loss of eggs. To overcome these problems, considerable attention has been given to the research and development of coating materials with antimicrobial properties from synthetic polymers, polysaccharides, proteins and oils etc in order to improve safety and shelf life of food [1-7].
∗[email protected] 1 Physical Chemistry Department, Faculty of Chemistry, University of Bucharest,
Regina Elisabeta 4-12, 030018 Bucharest, Romania.2 Faculty of Veterinary Medicine, Spiru Haret University, Bucharest, Romania.

24
The second most abundant polysaccharide found in nature, after cellulose, is chitosan. It is a linear polysaccharide formed of (1,4)-linked 2-amino-deoxi-β-D-glucan, being a deacetylated derivative of chitin. Chitosan is nontoxic, nonantigenic, biodegradable, biofunctional, biocompatible and it has been documented to possess a film-forming property for use as edible protective coatings, in dipping and spraying for the food having antimicrobial characteristics. Chitosan has exhibited antimicrobial activity against spoilage and pathogenic microorganisms as fungi, Gram-positive and Gram-negative bacteria. Thus, chitosan coating may offer a protective barrier for moisture and gas transfer from the albumen through the egg shell, thus extending the shelf life of eggs [8-16].
This research was focused on the applications of biopolymers for improvement of quality and shelf life of hen eggs by coating them with chitosan films. The effects of various coatings of chitosan solutions (simple or mixed with silver nitrate) on fresh eggs quality were evaluated during 5 weeks of storage at two different temperatures (50C and 250C). The investigated quality parameters were: weight loss, yolk index, Haugh unit, pH of albumen and pH of yolk, foaming capacity, foam stability of albumen solutions, emulsion capacity of yolk and egg white crystallization.
Materials and methods
Clean, white-shell, fresh, hen eggs (around 125 eggs) from a local egg
producer (S.C. Agrimon Brăila Ianca) were used in the present study. Shell eggs were washed with water and detergent to remove debris from surface. Dried surface of eggs was washed with 70% ethanol and allowed to dry. All eggs were placed in cardboard; half of them were stored at ambient laboratory condition (around 250C) and the other half in a refrigerator at 50C for 5 weeks during the experiment. Samples were divided into three groups, one of them for uncoated (control eggs) and the other groups for coated eggs with chitosan and chitosan and silver ions. Four separate eggs for each group (control, CH, and CH-AgNO3) were analyzed each week during 5 weeks for measurements.
Chitosan (average molecular mass 85% deacetylated) was purchased from Aldrich. Silver nitrate and ethanol were purchased from Reactivul Bucureşti and used without further purification. All solutions were prepared in bidistiled water.
Preparation of chitosan solutions and egg coating Chitosan coating solution (CH) was prepared using 2g (2% w/w) of chitosan
in 100 mL of 1% (w/w) acetic acid aqueous solution under stirring on magnetic stirrer/hot plate. The pH was adjusted to 5.5 using a solution NaHCO3 4%. Solution of chitosan with silver ions (CH-AgNO3) was prepared by adding 4 mL 1×10⁻³ M AgNO3 solution at 50 g CH solution. All solutions were freshly prepared before being applied on the eggshell.
Eggs were weighed individually and coated with chitosan solutions by means of brushing method using a brush and then allowed to dry under a fan for 20 min. The operation was twice repeated. We used this method because brushing method

may offer a suitable alternative to both dipping and spraying methods in order to preserve the quality of albumen and yolk of chitosan-coated eggs [17]. The weight of all eggs were measured with an analytical balance (accuracy ± 10-4g)
Determination of weight loss Weight loss of eggs during 5 weeks of storage was calculated by subtracting
the final weight (Gf) from the initial weight (Gi), then dividing by the initial weight. Weight loss was expressed in percent, by multiplying with 100, using the following equation:
100(%) eight.loss ×−
=i
fi
GGG
W
pH measurement After the egg breaking, the height of albumen (mm) was measured, the
albumen was separated from the yolk. The volumes of thin and firm albumen were homogenized for 60s a magnetic stirrer OP-912/3 Radelkis (Hungary). The pH of albumen and yolk was measured with a pH/Temperature Meter HI 991001 Hanna Instruments.
Determination of Haugh unit Haugh unit was calculated by using the equation:
( )6.77.1log100 37.0 +×−×= GHHU a Where G represents the mass of the whole egg (g) and Ha is the height of
thick albumen (mm), estimated by averaging four measurements carried out in different points of thick albumen at a distance of 10 mm from yolk using a caliper (accuracy ± 2×10⁻² mm)
Determination of foam capacity A certain amount (around 10 g) of homogenized albumen was weighed and
then foamed by whipping with a mixer type VEB MLW LR-40 (Germany). The whipping was made using a stirring butterfly device at 2000 min-1 for 180 s. The formed foam was weighed. The foam capacity was calculated using the equation:
100(%)apacity oam
×−
=solutionsalbumen
foamsolutionalbumen
GGG
CF
Determination of foam stability Weighed obtained foam was left at room temperature for 30 minutes and
after this period the drainage fluid was gently decanted, removed and weighed (Gd). The rest of the foam was weighed again (Gfinal foam). The drainage ratio or foam stability was calculated with the relation:
25
100(%)tability oam
×=foamfinal
d
GG
SF
Determination of emulsifying capacity of yolk In order to determine the emulsifying capacity of yolk, a certain amount of
yolk (around 10 g) was weighed (Gyolk) and then mixed with oil until the breaking of the emulsion. The amount of oil was also determined (Goil). The emulsifying capacity of yolk can be calculated with the equation:
100(%)apacity mulsifying ×+
=yolkoil
oil
GGG
CE
Determination of egg white crystallization Samples of eggs white were examined at optic microscope and video camera
Bresser Biolux AL.
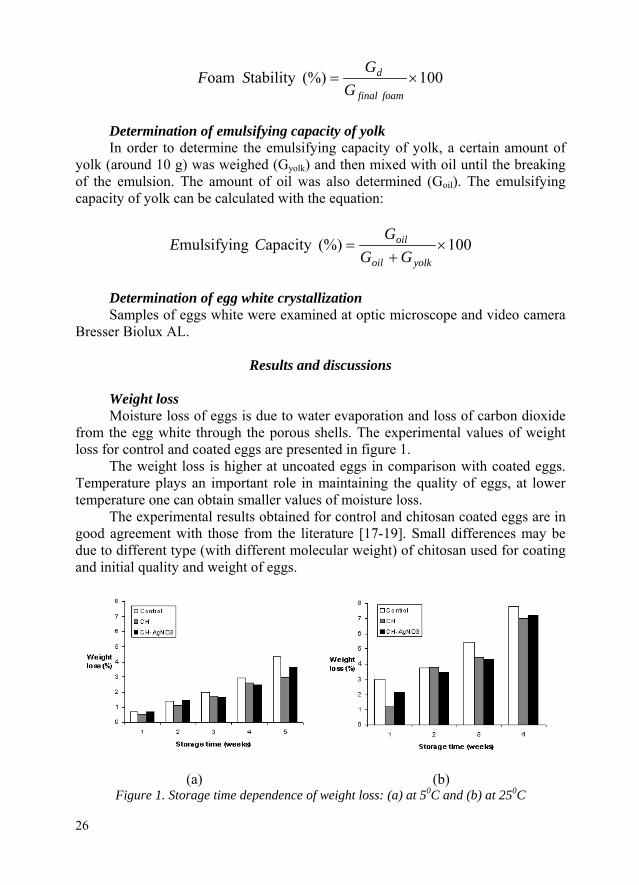
Results and discussions Weight loss Moisture loss of eggs is due to water evaporation and loss of carbon dioxide
from the egg white through the porous shells. The experimental values of weight loss for control and coated eggs are presented in figure 1.
The weight loss is higher at uncoated eggs in comparison with coated eggs. Temperature plays an important role in maintaining the quality of eggs, at lower temperature one can obtain smaller values of moisture loss.
The experimental results obtained for control and chitosan coated eggs are in good agreement with those from the literature [17-19]. Small differences may be due to different type (with different molecular weight) of chitosan used for coating and initial quality and weight of eggs.
(a) (b) Figure 1. Storage time dependence of weight loss: (a) at 50C and (b) at 250C
26
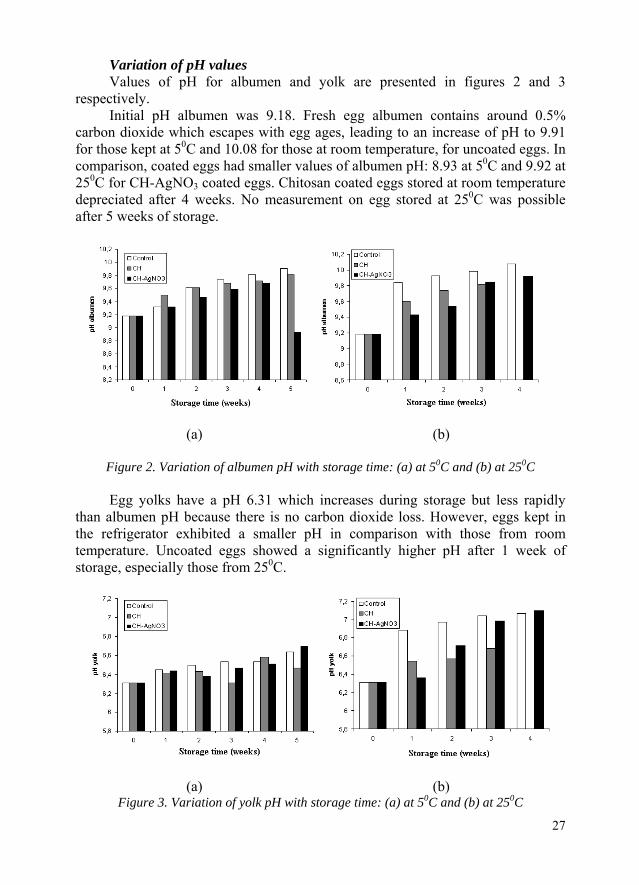
Variation of pH values Values of pH for albumen and yolk are presented in figures 2 and 3
respectively. Initial pH albumen was 9.18. Fresh egg albumen contains around 0.5%
carbon dioxide which escapes with egg ages, leading to an increase of pH to 9.91 for those kept at 50C and 10.08 for those at room temperature, for uncoated eggs. In comparison, coated eggs had smaller values of albumen pH: 8.93 at 50C and 9.92 at 250C for CH-AgNO3 coated eggs. Chitosan coated eggs stored at room temperature depreciated after 4 weeks. No measurement on egg stored at 250C was possible after 5 weeks of storage.
(a) (b)
Figure 2. Variation of albumen pH with storage time: (a) at 50C and (b) at 250C Egg yolks have a pH 6.31 which increases during storage but less rapidly
than albumen pH because there is no carbon dioxide loss. However, eggs kept in the refrigerator exhibited a smaller pH in comparison with those from room temperature. Uncoated eggs showed a significantly higher pH after 1 week of storage, especially those from 250C.
(a) (b) Figure 3. Variation of yolk pH with storage time: (a) at 50C and (b) at 250C
27

According with these results one can say that eggshell coating prevented CO2 release through the shell, so the gas diffuse less rapidly for coated than for control eggs. Coating acts like a protective barrier for carbon dioxide.
Variation of Haugh unit Figure 4 shows changes in Haugh unit of the uncoated and chitosan-coated
eggs during 5 weeks of storage at two different temperatures. According to Lee and other [20], based on Haugh value, eggs can be
classified into four grades: AA (HU above 72), A (from 71 to 60), B (from 59 to 31) and C (below 30). The higher values of Haugh units mean a better quality of egg white.
The Haugh unit decreased with increasing the storage periods. Chitosan-coated eggs had higher Haugh units during 1 to 5 weeks compared with uncoated eggs. Temperature has an important contribution, at lower value one obtained highest Haugh units.
(a) (b)
Figure 4. Haugh unit dependence on storage time: (a) at 50C and (b) at 250C
Variation of foam capacity Egg white possesses great foaming properties due to its component specific
functions. Proteins facilitate foam formation and ovomucin-lysozyme complex confers foam stability. These properties are affected by protein concentration, composition, ionic strength, pH, heating, presence of salts etc. Foaming properties are determined by the ability of proteins to encapsulate and retain air during whipping process.
28
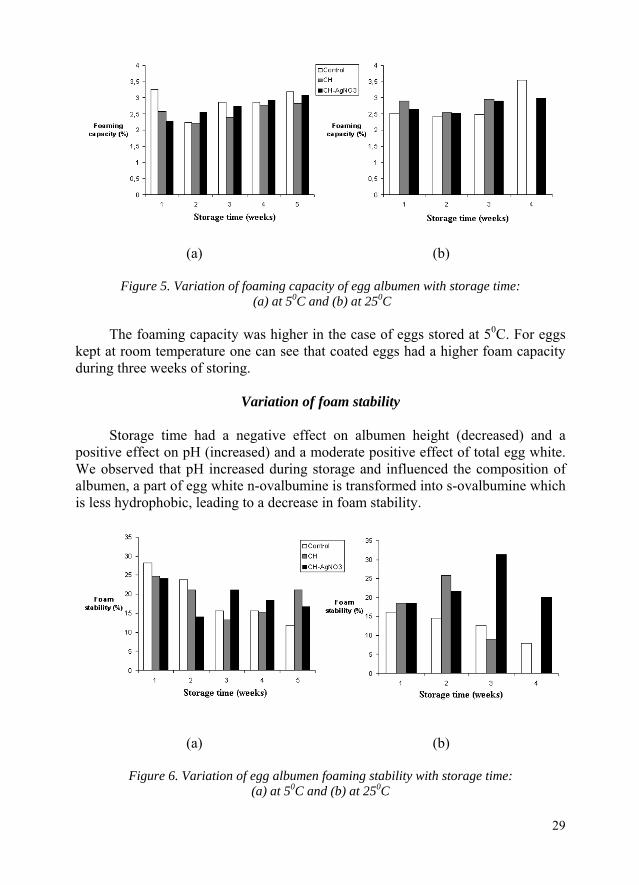
(a) (b)
Figure 5. Variation of foaming capacity of egg albumen with storage time: (a) at 50C and (b) at 250C
The foaming capacity was higher in the case of eggs stored at 50C. For eggs
kept at room temperature one can see that coated eggs had a higher foam capacity during three weeks of storing.
Variation of foam stability
Storage time had a negative effect on albumen height (decreased) and a
positive effect on pH (increased) and a moderate positive effect of total egg white. We observed that pH increased during storage and influenced the composition of albumen, a part of egg white n-ovalbumine is transformed into s-ovalbumine which is less hydrophobic, leading to a decrease in foam stability.
(a) (b)
Figure 6. Variation of egg albumen foaming stability with storage time: (a) at 50C and (b) at 250C
29

The foam stability is higher for eggs stored into refrigerator. For those stored at room temperature, one can see that coated eggs had greater values of foam stability.
Variation of emulsifying capacity of yolk
Generally, hen egg yolk is used in food industry in order to form and stabilize
emulsions, being an important ingredient of salad dressing or mayonnaise. One of the phosphoprotein that constitutes hen yolk is phosvitin which showed emulsifying capacity in some conditions favouring iron fixation: pH values between 5 and 6 and ionic strength values until 0.15 M [21]. Emulsifying capacity of yolk versus storage time is presented in figure 7.
(a) (b)
Figure 7. Variation of emulsifying capacity of egg yolk with storage time: (a) at 50C and (b) at 250C
As we can observe from figure 7 there are no significant modifications in
emulsifying capacity with storage time at 50C, however at this temperature higher values were recorded in comparison with eggs kept at room temperature. Eggs coated with chitosan at 250C presented lower values after 1 week of storage. During the experiment the pH of yolk varied from 6.31 to 7.10. In this pH interval phosvitin is keeping its emulsifying properties, so that there were no important changes in emulsifying capacity of yolk with increasing time of storage.
Conclusions
During storage, all egg weights and albumen heights decreased and the pH of
albumen and yolk increased. Coated eggs had significantly lower weight loss than uncoated. The lowest weight loss was observed at chitosan coated eggs at 50C (0.575 % after 1 week and 3.019 % after 5 weeks). The pH of albumen and yolk of the uncoated eggs was higher than that of coated eggs and increased during storage time. The Haugh unit values of all coated eggs were significantly higher than those of control eggs.
30

31
The foaming capacity and foam stability were higher at eggs stored at lower temperature. No significantly changes in emulsion capacity were observed during storage period. The crystallinity of albumen for eggs stored at 50C was higher especially for those coated with CH and CH-Ag (4 weeks), in comparison with eggs stored at room temperature which become amorphous after 3 weeks.
This study demonstrated that various coatings may offer a protective barrier in preserving the internal quality of albumen and yolk and thus extending shelf life of hen eggs for at least 2 weeks longer than the control non-coated eggs.
References
1. Meyer R., Spencer J.V. (1973), The Effect of Various Coatings on Shell
Strength and Egg Quality, Poult Sci 52, pp. 703-11. 2. Xie, L, Hettiarachchy, NS, Ju, Z.Y, Meullenet, J, Wang, H, Slavik, M.F,
Janes, M.E., (2002), Edible Film Coating to Minimize Eggshell Breakage and Reduce Post-wash Bacterial Contamination Measured by Dye Penetration in Eggs, “J Food Sci” 67, pp. 280-4.
3. Herald, T.J, Gnanasambandam, R, McGuire B.H, Hachmeister, KA., (1995), Degradable Wheat Gluten Films: Preparation, Properties and Applications, “J Food Sci” 60, pp.1147-1150, 1156.
4. Cho, J.M., Park, S.K, Lee, Y.S, Rhee, C.O., (2002), Effects of Soy Protein Isolate Coating on Egg Breakage and Quality of Eggs during Storage, “Food Sci Biotechnol” 11, pp. 392-6.
5. Rhim, J.W, Weller, C.L, Gennadios, A. (2004), Effects of Soy Protein Coating on Shell Strength and Quality of Shell Eggs, “Food Sci Biotechnol” 13, pp.455-459.
6. Knight, D.W., Bowrey, M, Cooke, D.J. (1972), Preservation of Internal Egg Quality Using Silicone Fluids, “Br Poult Sci” 13, pp. 587-593.
7. Obanu, Z.A., Mpieri, A.A. (1984), Efficiency of Dietary Vegetable Oils in Preserving the Quality of Shell Eggs under Ambient Tropical Conditions. “J Sci Food Agric” 35, pp. 1311-1317.
8. Dutta, P.K., Tripathi, S., Methrotra, G.K., Dutta, J. (2009), Perspectives for Chitosan Based Antimicrobial Films in Food Applications, “Food Chemistry” 114, pp. 1173-1182.
9. No, H.K., Prinyawiwatkul, W., Xu, Z. (2007), Applications of Chitosan for Improvement of Quality and Shelf Llife of Foods: A Review, “Journal of Food Science” 72(5), pp. 87-100.
10. Stepnova, E.A., Tikhonov, V.E., Babushkina, T.A., Klimova, T.P., Vorontsov, E.V., Babak, V.G., Lopatin, S.A., Yamskov, I.A. (2007), New Approach to the Quaternization of Chitosan and its Amphiphilic Derivatives, “European Polymer Journal” 43, pp. 2414-2421.
11. Casariego, A., Souza, B.W.S., Vicente, A.A., Teixeira, J.A., Cruz, L., Diaz, R. (2007), Chitosan Coating Surface and Permeation Properties as Affected by Plasticizer, Surfactant and Polymer Concentration-application to Vegetables, Proceedings of the 3rd CIGR Section VI International Symposium on FOOD AND AGRICULTURAL PRODUCTS: PROCESSING AND INNOVATIONS, Naples, Italy.

32
12. Niamsa, N., Baimark, Y. (2009), Preparation and Characterization of Highly Flexible Chitosan Films for Use as Food Packaging, “American Journal of Food Technology” 4(4), pp. 162-169.
13. Kim, K.M., Son, J.H., Kim, S.K., Weller, C.L., Hanna, M.A. (2006), Properties of Chitosan Films as a Function of pH and Solvent Type, “Journal of Food Science” 71(3), pp. 119-124.
14. Kurita, K. (2006), Chitin and Chitosan: Functional Biopolymers from Marine Crustaceans, “Marine Biotechnology” 8, pp. 203-226.
15. Kittur, F.S., Kumar, K.R., Tharanathan, R.N., (1998), Functional Packaging Properties of Chitosan Films, “Z Lebensm Unters Forsch” A 206, pp. 44-47.
16. Fernandez-Saiz, P., Lagaron, J.M., Ocio, M.J. (2009), Optimization of the Biocide Properties of Chitosan for its Application in the Design of Active Films of Interest in the Food Area, “Food Hydrocolloids” 23, pp. 913-921.
17. Kim, S.H., No, H.K., Prinyawiwatkul, W. (2008), Plasticizer Types and Coating Methods Affect Quality and Shelf Life of Eggs Coated with Chitosan, “Journal of Food Science” 73(3), pp. 111-117.
18. No, H.K., Prinyawiwatkul, W., Meyers, S.P. (2005), Comparison of Shelf Life of Eggs Coated with Chitosan Prepared under Various Deproteinization and Demineralization Times, “Journal of Food Science” 70(6), pp. 377-382.
19. Caner, C. (2005), The Effect of Edible Eggshell Coatings on Egg Quality and Consumer Perception, Journal of the Science of Food and Agriculture 85, pp. 1897-1902.
20. Lee, S.H., No, H.K., Jeong, Y.H. (1996), Effect of Cchitosan Coating on Quality of Egg During Storage. “J Korean Soc Food Nutr” 25(2), pp.288-293.
21. Castellani, O., Belhomme, C., David-Briand, E., Guerin-Dubiard, C., Anton, M. (2006), Oil-in-water emulsion properties and interfacial characteristics of hen egg yolk phosvitin, “Food Hydrocolloids” 20, pp. 35-43.
33
CLARIFICATIONS REGARDING THE TOPOGRAPHICAL LOCATION OF THE VASCULAR, LYMPHATIC AND NERVOUS FORMATIONS
FROM THE THORAX APERTURE IN PIGS AND SHEEP
Carmen BERGHEŞ1, M. CUCOANEŞ1, D. CUCĂ1 [email protected]
Abstract
The purpose of the studies is to contribute with some clarifications to the topographical location of the vascular, lymphatic and nervous formations from the thorax aperture in pigs and sheep.
The literature data is little relevant because they depict other formations from the anterior mediastinum, without making a correlation between them.
The study was conducted on 20 pig corpses from production farms, with digestive, not respiratory disorders in general, so as not to affect the studied area, and on sheep corpses used by students for dissection. The vascular formations were injected with a mixture prepared in the laboratory of anatomy.
The paper shows pictures from several dissections, determining as accurately as possible the topographical location of the anatomical formations, and it has a strong applicative character for human medicine, since the closest species to man as experimental morphological model is the pig.
Keywords: mediastinum, lymphatic duct, cranial vena cava, caudal cervical
ganglion
Introduction The fundamental research on the topography of the vascular nervous
formations from the aperture of the thorax cavity in animals is approached by many researchers, but the data are presented separately, either for the vascular formations, or for the nervous formations, or for the lymphatic formations (1, 2, 4). These data are a real support to interpret he physiological phenomena and to clarify several aspects regarding the way of approaching the formations during surgery on the anterior mediastinum. The morphology of the species resembles that of the man, which recommends it as an experimental model, provided the European legislation of the experimental animals is observed (4, 5).
1 Faculty of Veterinary Medicine, Spiru Haret University, Bucharest, Romania.
Material and method The studies were conducted in the laboratory of anatomy of the Faculty of
Veterinary Medicine, on 20 pig corpses from a production farm. Before dissecting, the aorta and the veins were injected with a mixture of substances prepared in the laboratory of anatomy. The nervous formations were treated with a solution of acetic acid 10%. The lymph formations were injected with methylene blue. The lymphatic anatomy of 5 pigs was studied and classified and a new technique for lymphatic cannulation was developed. The cannulation success rate was 55%.
Results and discussions
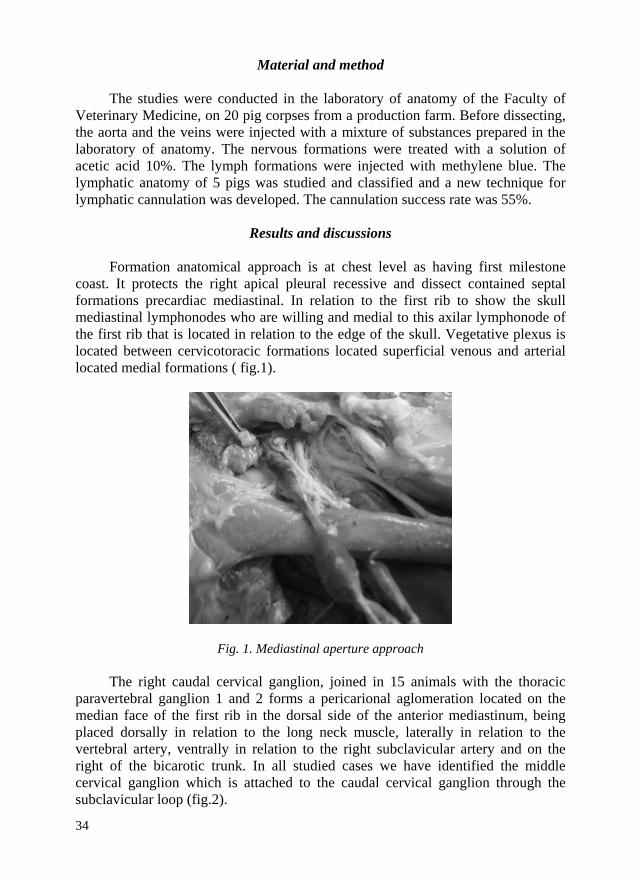
Formation anatomical approach is at chest level as having first milestone
coast. It protects the right apical pleural recessive and dissect contained septal formations precardiac mediastinal. In relation to the first rib to show the skull mediastinal lymphonodes who are willing and medial to this axilar lymphonode of the first rib that is located in relation to the edge of the skull. Vegetative plexus is located between cervicotoracic formations located superficial venous and arterial located medial formations ( fig.1).
Fig. 1. Mediastinal aperture approach The right caudal cervical ganglion, joined in 15 animals with the thoracic
paravertebral ganglion 1 and 2 forms a pericarional aglomeration located on the median face of the first rib in the dorsal side of the anterior mediastinum, being placed dorsally in relation to the long neck muscle, laterally in relation to the vertebral artery, ventrally in relation to the right subclavicular artery and on the right of the bicarotic trunk. In all studied cases we have identified the middle cervical ganglion which is attached to the caudal cervical ganglion through the subclavicular loop (fig.2).
34
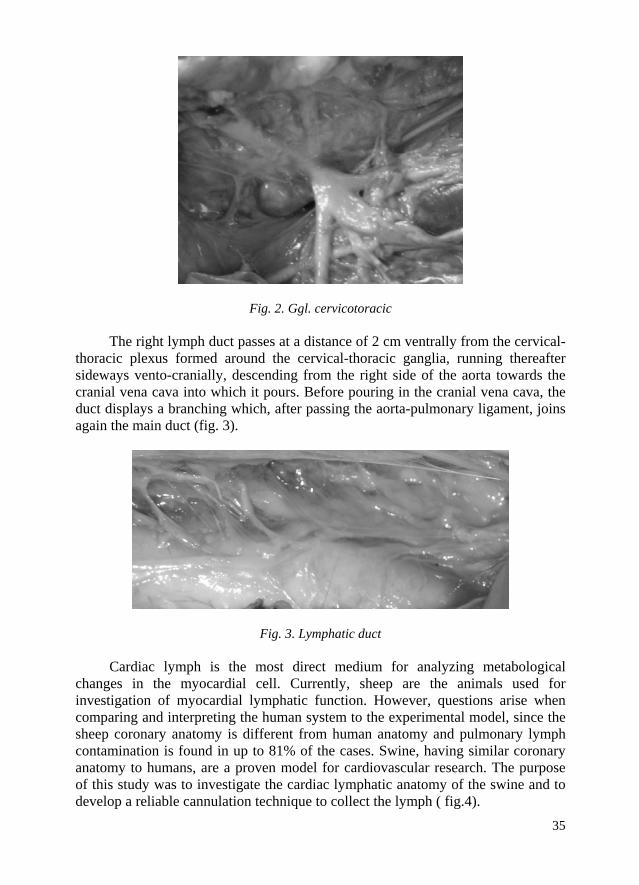
Fig. 2. Ggl. cervicotoracic The right lymph duct passes at a distance of 2 cm ventrally from the cervical-
thoracic plexus formed around the cervical-thoracic ganglia, running thereafter sideways vento-cranially, descending from the right side of the aorta towards the cranial vena cava into which it pours. Before pouring in the cranial vena cava, the duct displays a branching which, after passing the aorta-pulmonary ligament, joins again the main duct (fig. 3).
Fig. 3. Lymphatic duct Cardiac lymph is the most direct medium for analyzing metabological
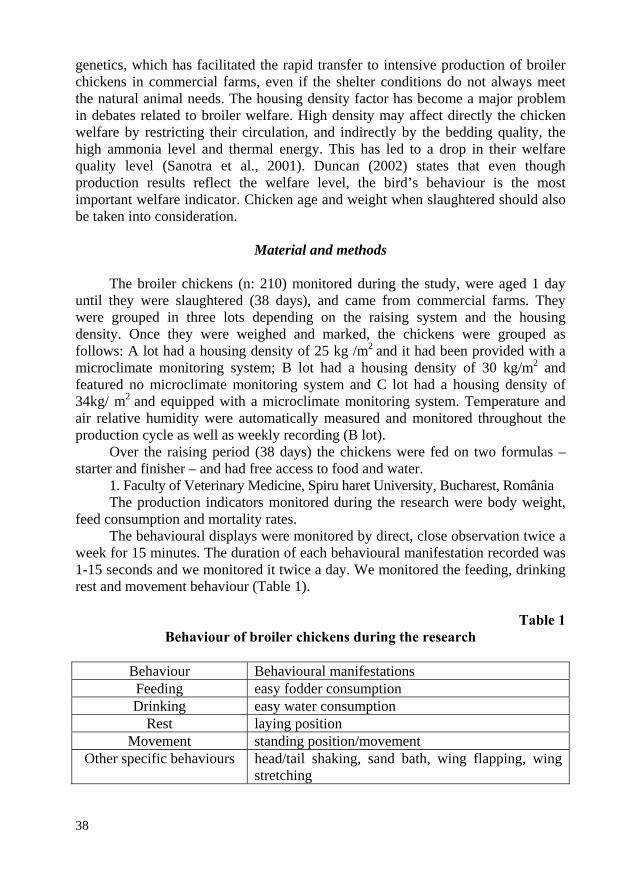
changes in the myocardial cell. Currently, sheep are the animals used for investigation of myocardial lymphatic function. However, questions arise when comparing and interpreting the human system to the experimental model, since the sheep coronary anatomy is different from human anatomy and pulmonary lymph contamination is found in up to 81% of the cases. Swine, having similar coronary anatomy to humans, are a proven model for cardiovascular research. The purpose of this study was to investigate the cardiac lymphatic anatomy of the swine and to develop a reliable cannulation technique to collect the lymph ( fig.4).
35
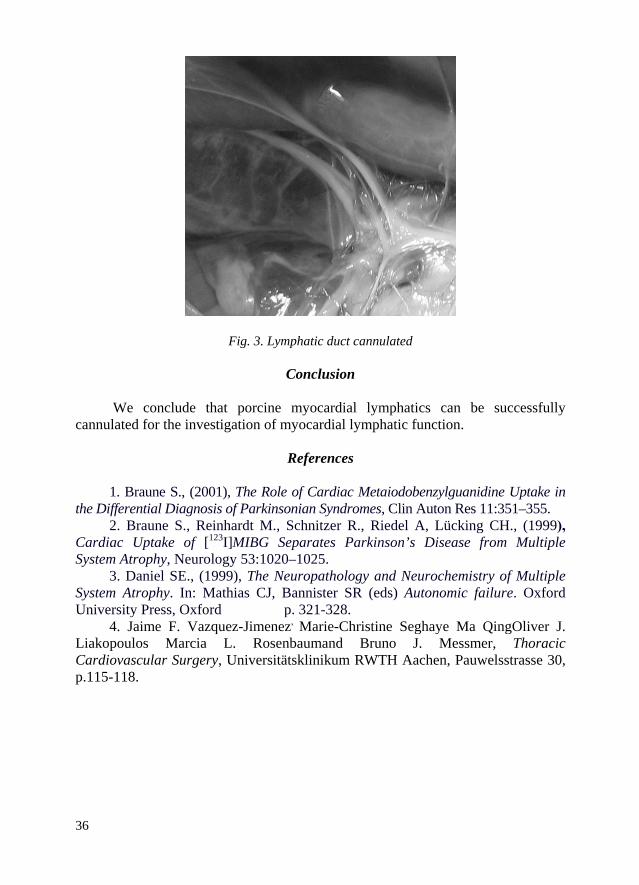
Fig. 3. Lymphatic duct cannulated
Conclusion We conclude that porcine myocardial lymphatics can be successfully
cannulated for the investigation of myocardial lymphatic function.
References 1. Braune S., (2001), The Role of Cardiac Metaiodobenzylguanidine Uptake in
the Differential Diagnosis of Parkinsonian Syndromes, Clin Auton Res 11:351–355. 2. Braune S., Reinhardt M., Schnitzer R., Riedel A, Lücking CH., (1999),
Cardiac Uptake of [123I]MIBG Separates Parkinson’s Disease from Multiple System Atrophy, Neurology 53:1020–1025.
3. Daniel SE., (1999), The Neuropathology and Neurochemistry of Multiple System Atrophy. In: Mathias CJ, Bannister SR (eds) Autonomic failure. Oxford University Press, Oxford p. 321-328.
4. Jaime F. Vazquez-Jimenez, Marie-Christine Seghaye Ma QingOliver J. Liakopoulos Marcia L. Rosenbaumand Bruno J. Messmer, Thoracic Cardiovascular Surgery, Universitätsklinikum RWTH Aachen, Pauwelsstrasse 30, p.115-118.
36

37
THE INFLUENCE OF HOUSING CONDITIONS ON THE BROILER WELFARE
Ioana ANDRONIE, Monica PÂRVU, V. ANDRONIE, G. ŞOVREA
E-mail: [email protected]
Abstract
The aim of this study was to investigate the effect of different housing conditions on broiler welfare, through some indicators like mortality, behaviour and their health.
Broilers investigated were grouped according to housing conditions (area of accommodation, type of litter, microclimate) in three batches. Indicators were used in assessing the productive welfare, behavioural and health.
The results obtained showed that the socking density not the main causes of weight loss chicken (1355,43g), the changes in their behaviour (movement, feeding, resting) and the growth rate of mortality (5,46%).
Monitoring and controlling factors of microclimate (temperature, humidity, air currents, during the entire period of growth and especially their harmonization with the density of housing in the last two weeks of growth may lead to a qualitatively higher level of broiler welfare.
Density housing cannot be considered a factor to declining broiler welfare. Growth conditions are factors in assessing the quality of their welfare. These behavioural changes caused by the body's response to the adjustment, depreciation of health and not least economic losses.
Keywords: broiler, housing, and welfare
Introduction Knowles and Broom have defined the animal welfare as the animal’s physical
and mental state. Thus, any attempt at assessing welfare must take into consideration scientific evidence related to what animals feel which can be inferred from their structure, functioning, and behaviour. Stress is a sign of low welfare in an individual, which over stresses the control systems and reduces the degree of adaptability or it seems to have this effect.
Compared to other sectors of animal production, poultry raising sector is characterised by fast progress both in the raising technologies (equipment systems, housing density, lighting equipment, bedding, air quality), feeding, and their
38
genetics, which has facilitated the rapid transfer to intensive production of broiler chickens in commercial farms, even if the shelter conditions do not always meet the natural animal needs. The housing density factor has become a major problem in debates related to broiler welfare. High density may affect directly the chicken welfare by restricting their circulation, and indirectly by the bedding quality, the high ammonia level and thermal energy. This has led to a drop in their welfare quality level (Sanotra et al., 2001). Duncan (2002) states that even though production results reflect the welfare level, the bird’s behaviour is the most important welfare indicator. Chicken age and weight when slaughtered should also be taken into consideration.
Material and methods
The broiler chickens (n: 210) monitored during the study, were aged 1 day
until they were slaughtered (38 days), and came from commercial farms. They were grouped in three lots depending on the raising system and the housing density. Once they were weighed and marked, the chickens were grouped as follows: A lot had a housing density of 25 kg /m and it had been provided with a microclimate monitoring system; B lot had a housing density of 30 kg/m and featured no microclimate monitoring system and C lot had a housing density of
2
2
34kg/ m and equipped with a microclimate monitoring system. Temperature and air relative humidity were automatically measured and monitored throughout the production cycle as well as weekly recording (B lot).
2
Over the raising period (38 days) the chickens were fed on two formulas – starter and finisher – and had free access to food and water.
1. Faculty of Veterinary Medicine, Spiru haret University, Bucharest, România The production indicators monitored during the research were body weight,
feed consumption and mortality rates. The behavioural displays were monitored by direct, close observation twice a
week for 15 minutes. The duration of each behavioural manifestation recorded was 1-15 seconds and we monitored it twice a day. We monitored the feeding, drinking rest and movement behaviour (Table 1).
Table 1
Behaviour of broiler chickens during the research
Behaviour Behavioural manifestations Feeding easy fodder consumption Drinking easy water consumption
Rest laying position Movement standing position/movement
Other specific behaviours head/tail shaking, sand bath, wing flapping, wing stretching
Results and discussions Minimum and maximum air temperature values varied in the three shelters
throughout the raising period between 24,2°C and 31,3°C. Relative humidity during the day recorded values from 63,5% to 56,2%.
Significant changes in the raising environment stimulate the adjustment processes, which aim at maintaining or gaining balance or homeostasis. Animals have problems if their needs are not met or when there is an environmental adverse effect such as a harmful or pathogenic agent.
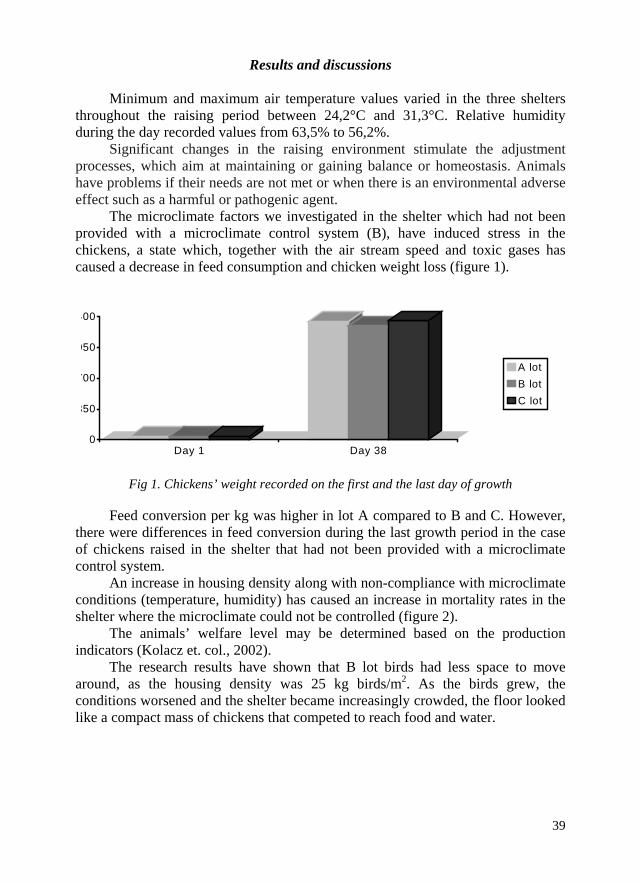
The microclimate factors we investigated in the shelter which had not been provided with a microclimate control system (B), have induced stress in the chickens, a state which, together with the air stream speed and toxic gases has caused a decrease in feed consumption and chicken weight loss (figure 1).
0
350
700
050
400
Day 1 Day 38
A lotB lotC lot
Fig 1. Chickens’ weight recorded on the first and the last day of growth
Feed conversion per kg was higher in lot A compared to B and C. However,
there were differences in feed conversion during the last growth period in the case of chickens raised in the shelter that had not been provided with a microclimate control system.
An increase in housing density along with non-compliance with microclimate conditions (temperature, humidity) has caused an increase in mortality rates in the shelter where the microclimate could not be controlled (figure 2).
The animals’ welfare level may be determined based on the production indicators (Kolacz et. col., 2002).
The research results have shown that B lot birds had less space to move around, as the housing density was 25 kg birds/m2. As the birds grew, the conditions worsened and the shelter became increasingly crowded, the floor looked like a compact mass of chickens that competed to reach food and water.
39
0
2
4
6
Period 1-19 Period 19-38 Period 1-38
A lotB lotC lot
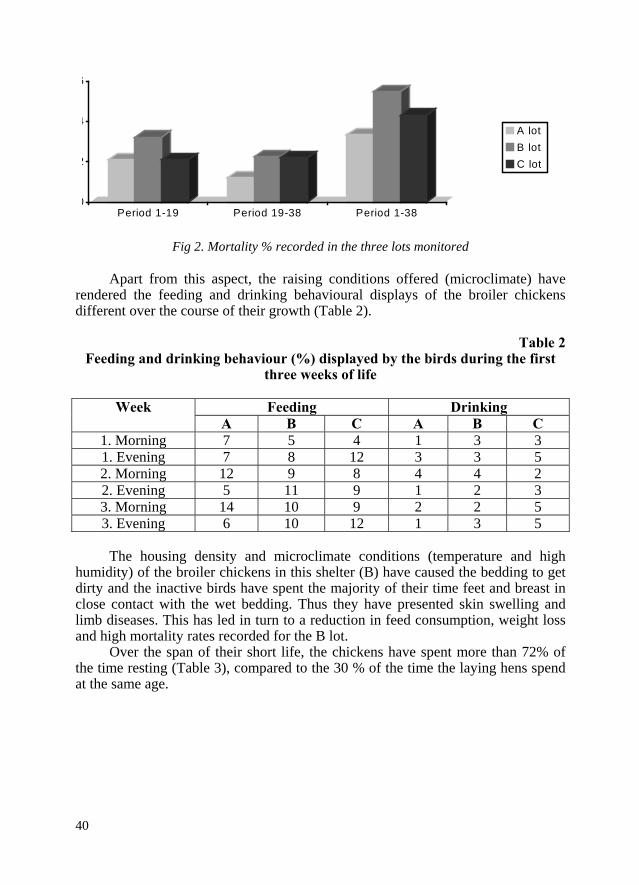
Fig 2. Mortality % recorded in the three lots monitored
Apart from this aspect, the raising conditions offered (microclimate) have
rendered the feeding and drinking behavioural displays of the broiler chickens different over the course of their growth (Table 2).
Table 2
Feeding and drinking behaviour (%) displayed by the birds during the first three weeks of life
Feeding Drinking Week
A B C A B C 1. Morning 7 5 4 1 3 3 1. Evening 7 8 12 3 3 5 2. Morning 12 9 8 4 4 2 2. Evening 5 11 9 1 2 3 3. Morning 14 10 9 2 2 5 3. Evening 6 10 12 1 3 5
The housing density and microclimate conditions (temperature and high
humidity) of the broiler chickens in this shelter (B) have caused the bedding to get dirty and the inactive birds have spent the majority of their time feet and breast in close contact with the wet bedding. Thus they have presented skin swelling and limb diseases. This has led in turn to a reduction in feed consumption, weight loss and high mortality rates recorded for the B lot.
Over the span of their short life, the chickens have spent more than 72% of the time resting (Table 3), compared to the 30 % of the time the laying hens spend at the same age.
40
41
Table 3 Chickens behaviour (%) during the entire research
Feeding Drinking Resting Standing/
moving position Week
A B C A B C A B C A B C 1 7 8 6 2,5 4 3 62 48 62 30 40 32
2 9 9 10 2,5 2,5 3 79 65 77 10 24 17
3 10 10 11 2,0 5 3 61 60 60 28 25 27
4 5 3 5 5,6 1 6 79 89 78 10 7 11
5 5 4 5 2,7 1 3 81 93 85 15 2 7
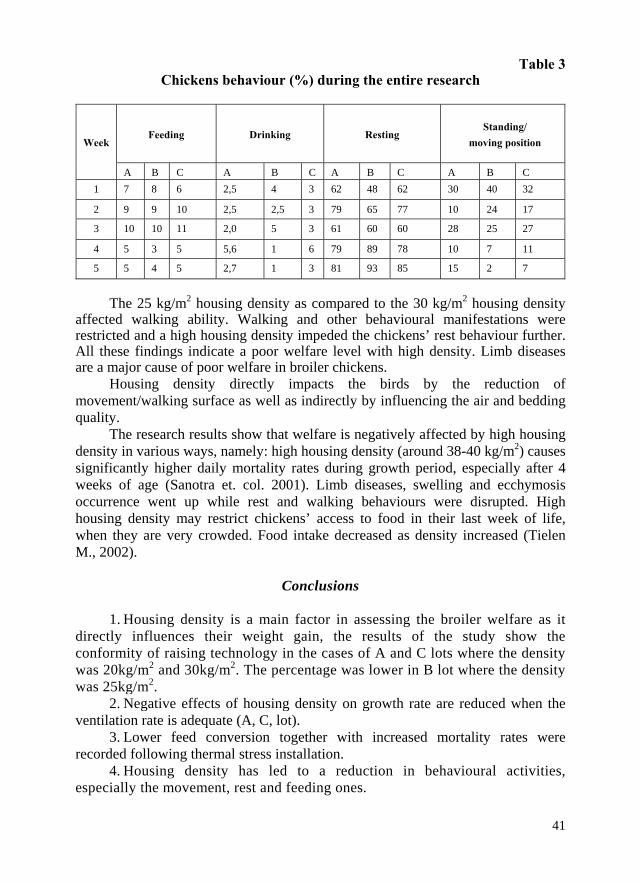
The 25 kg/m2 housing density as compared to the 30 kg/m2 housing density
affected walking ability. Walking and other behavioural manifestations were restricted and a high housing density impeded the chickens’ rest behaviour further. All these findings indicate a poor welfare level with high density. Limb diseases are a major cause of poor welfare in broiler chickens.
Housing density directly impacts the birds by the reduction of movement/walking surface as well as indirectly by influencing the air and bedding quality.
The research results show that welfare is negatively affected by high housing density in various ways, namely: high housing density (around 38-40 kg/m2) causes significantly higher daily mortality rates during growth period, especially after 4 weeks of age (Sanotra et. col. 2001). Limb diseases, swelling and ecchymosis occurrence went up while rest and walking behaviours were disrupted. High housing density may restrict chickens’ access to food in their last week of life, when they are very crowded. Food intake decreased as density increased (Tielen M., 2002).
Conclusions
1. Housing density is a main factor in assessing the broiler welfare as it
directly influences their weight gain, the results of the study show the conformity of raising technology in the cases of A and C lots where the density was 20kg/m2 and 30kg/m2. The percentage was lower in B lot where the density was 25kg/m2.
2. Negative effects of housing density on growth rate are reduced when the ventilation rate is adequate (A, C, lot).
3. Lower feed conversion together with increased mortality rates were recorded following thermal stress installation.
4. Housing density has led to a reduction in behavioural activities, especially the movement, rest and feeding ones.
42
References 1. Duncan I. J. H. (2002), Poultry Welfare: Science or Subjectivity? “Brit.
Poultry Sci”., 43: 643-652. 2. Kolacz R., Bodak E. (2002), Animal Health and Welfare Implications.
“Ann. Anim. Sci”., Suppl. No. 1: 25-28. 3. Rauw W. M., Kanis E., Noordhuizen-Stassen E. N., Grommers F. J.
(1998), Undesirable Side Effects of Selection for High Production Efficiency in Farm Aanimals: a Review, “Livestock Production Sci”, 56: 15-33.
4. Sanotra G. S., Lund J. D. (2001), Monitoring Leg Problems in Broilers: a Survey of Commercial Broiler Production in Denmark. “World’s Poultry Sci.,” J. 57: 55-69.
5. Tielen M. (2002), Animal Hygiene and Welfare in the Feed to Food Production Chain, “Ann. Anim. Sci.,” Suppl. No. 1: 9-13.
43
CORRELATIONS BETWEEN HISTOLOGICAL STRUCTURE AND GRAVIMETRICAL CHANGES OF CLOACAL BURSA IN
YOUNG LAYER CHICKENS UNDER IMMUNOSUPPRESSION THERAPY FOLLOWED BY IMMUNOMODULATORS
COMPENSATORY TREATMENT
V.1 CĂLIN, T. COMAN1, D. TURCU1, T. PETRUŢ1 e-mail: usamv_calin.victor @spiruharet.ro
Abstract
There were 50 birds submitted to testing, grouped in 5 lots (A, B,
C, D, E), from the age of 60 days old, the testing was conducted in an intensive poultry farming system. The experiment was conducted over a period of 30 days, in the end the chickens beeing completely exsanguinated.
The data were statistically processed using Student-Fisher method . Lot A was used as witness. Groups B, C, D and E were
vaccinated against avian salmonellosis in two rounds. The lots C, D and E were immunosuppressed with
cyclophosphamide in 2 rounds at a difference of 8 days. Lot D has undergone compensatory stimulation with vitamin E and Selenium , 3 days in a row, in 3 stages. Lot E has undergone compensatory stimulation with Corynebacterium parvum in 3 stages.
The cloacal`s bursa increasing weight indicates a good protection of the lymphoid tissue in vitamin E and selenium immunomodulation, weight differences between the treated groups with immunomodulators and cyclophosphamide were not significant (p< 0,05).
The average weight decrease of cloacal bursa in the vaccinated group compared with the witness group seems to be explained by the difference between the number of days that have elapsed since the vaccination to slaughter was 30 days, during which the bursal lymphoid follicles, B lymphocytes and memory B lymphocytes have migrated to the spleen.
The bursal index decrease in the cyclophosphamide immunosuppressed group is consistent with histological changes of cloacal bursa. These changes occur both in the mucosal epithelium affecting both the bursal epithelium and the lymphoid follicles of the lamina propria. They mainly consist of lymphoid follicles encystation, the follicle content being replaced by a serous mass.
Keywords: bird, cloacal bursa, immunosuppression.
1 Faculty of Veterinary Medicine, Spiru Haret University, Bucharest, Romania.

44
Introduction
The body`s self defense mechanism is the result of the activity of a complex
of cellular and humoral, specific and non-specific, corelated in the immune response complex mechanism.
In poultry , the cloacal bursa is the main limphopoietic organ, having a very important role in humoral immunity, beeing the formation place of B limphocites (2).
Cyclophosphamide administered to poultry has an inhibitory action on the immune response, causing a significant decrease of chemotaxis, phagocytosis and B limphocites activity and also the significant decrease of antibodies titre synthesized by them (1).
The multiple effects of vitamin E are materialised by the potentiation of resistance to bacterial and viral infections, in laboratory animals and aslo domestic ones.Vitamin E asociated with selenium has immunomodulatory effects in poultry and intensifies the cellular mediated immune response (3).
Rivera and co. (5) have noticed that diet supplements that contain selenium (25 ppm) insures the broiler chicks against some immunosuppresor effects (the decrease in seric protein and the injury of the cloacal bursa parenchyma.
Corynebacterium parvum is a bacteria with complex immunostimulatory effects, proven experimentally. This bacteria is present in healthy organism integument and have affinity for reticulo-endothelial system (RES), cells that have the capacity of including in the foreign molecules and particles, phagocytic functions (4).
Immunosupresive substances were used (cyclophosphamide) and the imunological response was followed and also the possible histological modifications in the cloacal bursa after the compensatory treatment with some immunomodulatory substances (Corynebacterium parvum, vitamin E and selenium) in young layer chickens.
Materials and methods
50 chickens were subjected tot testing , grouped in 5 lots (A, B, C, D, E),
starting with 60 days of age, the testing beeing conducted in an intensive poultry breeding complex.
The experiment was conducted over a period of 30 days. Lot A was used as a witness. Lot B, C, D and E were vaccinated against Avian salmonelosis using the
antisalmonelosis- strain 9R, the inoculation beeing done with 0,5/chicken in the second day of the experiment and again in the 12th day.
In lots C, D and E immunosuppression was done with Endoxan (cyclophosphamide 200 mg / vial) by intramuscular inoculation using 15 m/chicken, in 2 sessions, 8 days apart. In each session were done 3 administrations 24 hours apart.
45
Lot D was subjected to compensatory stimulation with Romselevit (vitamin E + Se) 0,5 ml/chicken (0,5 mg Se + 7,5 vitamin E), s.c., 3 days in a row, in 3 sessions 8 days apart.
Lot E was subjected to compensatory stimulation with Corynebacterium parvum using Imunostimulent S.R.E. Corynebacterium parvum , s.c., in increasing doses (0,1 ml, 0,3 ml and 0,5 ml) in 3 sessions, 8 days apart.
After a week from the last inoculation, the chickens were completly exsanguinated and histological samples were harvested , impressed and paraffin included from the cloacal bursa, sectioned and H.E. stained and Mallory trichromic.
Quantified parameters − the cloacal bursa weight at the end of the experiment ; − the gravimetrical indexes for the bursa (I.B.); − histological observations in the cloacal bursa.
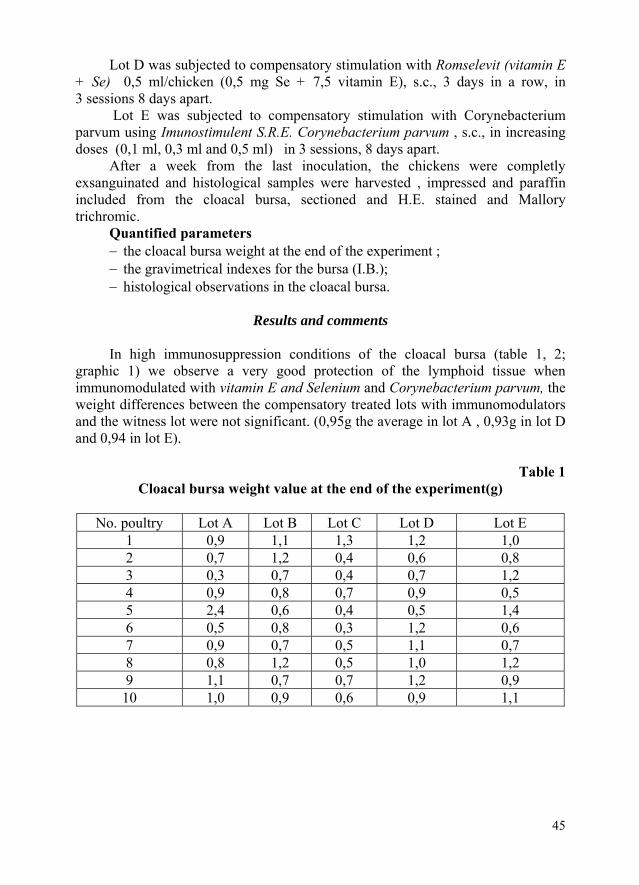
Results and comments In high immunosuppression conditions of the cloacal bursa (table 1, 2;
graphic 1) we observe a very good protection of the lymphoid tissue when immunomodulated with vitamin E and Selenium and Corynebacterium parvum, the weight differences between the compensatory treated lots with immunomodulators and the witness lot were not significant. (0,95g the average in lot A , 0,93g in lot D and 0,94 in lot E).
Table 1
Cloacal bursa weight value at the end of the experiment(g)
No. poultry Lot A Lot B Lot C Lot D Lot E 1 0,9 1,1 1,3 1,2 1,0 2 0,7 1,2 0,4 0,6 0,8 3 0,3 0,7 0,4 0,7 1,2 4 0,9 0,8 0,7 0,9 0,5 5 2,4 0,6 0,4 0,5 1,4 6 0,5 0,8 0,3 1,2 0,6 7 0,9 0,7 0,5 1,1 0,7 8 0,8 1,2 0,5 1,0 1,2 9 1,1 0,7 0,7 1,2 0,9
10 1,0 0,9 0,6 0,9 1,1
00,10,20,30,40,50,60,70,80,9
1
Wei
ght b
ursa
l
Batch
Cloacal bursa average weight
Serie1 0,95 0,87 0,58 0,93 0,94
A B C D E
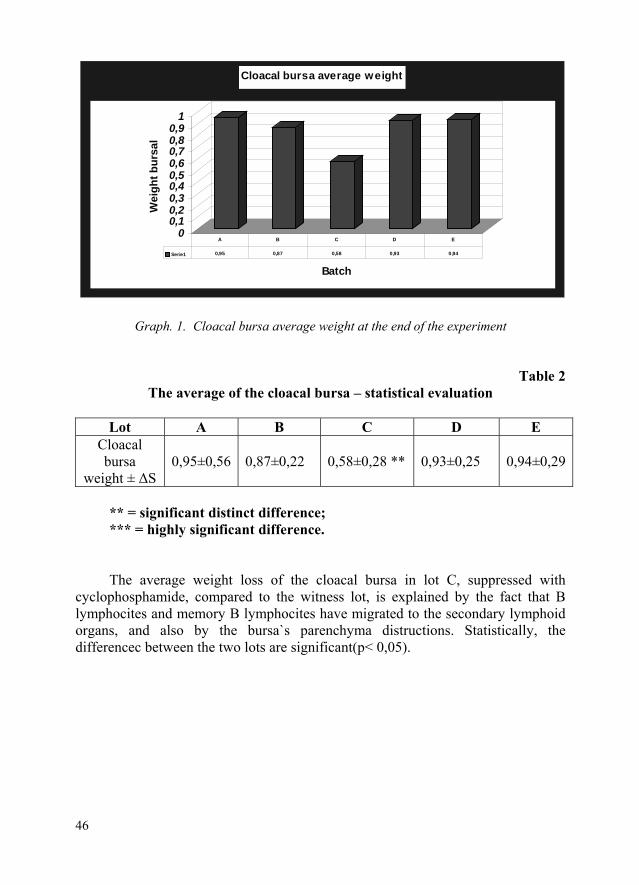
Graph. 1. Cloacal bursa average weight at the end of the experiment
Table 2 The average of the cloacal bursa – statistical evaluation
Lot A B C D E
Cloacal bursa
weight ± ΔS 0,95±0,56 0,87±0,22 0,58±0,28 ** 0,93±0,25 0,94±0,29
** = significant distinct difference; *** = highly significant difference. The average weight loss of the cloacal bursa in lot C, suppressed with
cyclophosphamide, compared to the witness lot, is explained by the fact that B lymphocites and memory B lymphocites have migrated to the secondary lymphoid organs, and also by the bursa`s parenchyma distructions. Statistically, the differencec between the two lots are significant(p< 0,05).
46
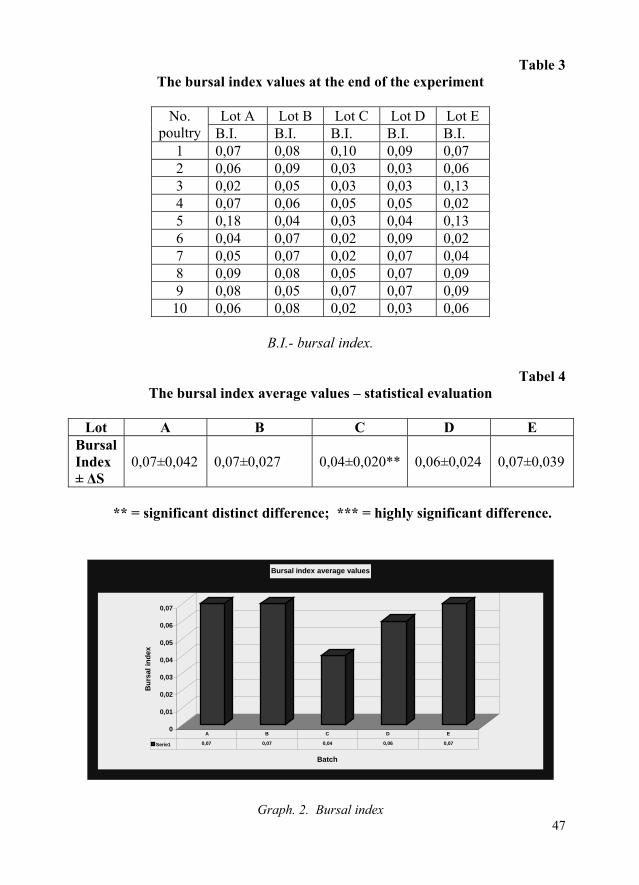
Table 3 The bursal index values at the end of the experiment
Lot A Lot B Lot C Lot D Lot E No.
poultry B.I. B.I. B.I. B.I. B.I. 1 0,07 0,08 0,10 0,09 0,07 2 0,06 0,09 0,03 0,03 0,06 3 0,02 0,05 0,03 0,03 0,13 4 0,07 0,06 0,05 0,05 0,02 5 0,18 0,04 0,03 0,04 0,13 6 0,04 0,07 0,02 0,09 0,02 7 0,05 0,07 0,02 0,07 0,04 8 0,09 0,08 0,05 0,07 0,09 9 0,08 0,05 0,07 0,07 0,09
10 0,06 0,08 0,02 0,03 0,06
B.I.- bursal index.
Tabel 4 The bursal index average values – statistical evaluation
Lot A B C D E
Bursal Index ± ΔS
0,07±0,042 0,07±0,027 0,04±0,020** 0,06±0,024 0,07±0,039
** = significant distinct difference; *** = highly significant difference.
0
0,01
0,02
0,03
0,04
0,05
0,06
0,07
Bur
sal i
ndex
Batch
Bursal index average values
Serie1 0,07 0,07 0,04 0,06 0,07
A B C D E
47Graph. 2. Bursal index
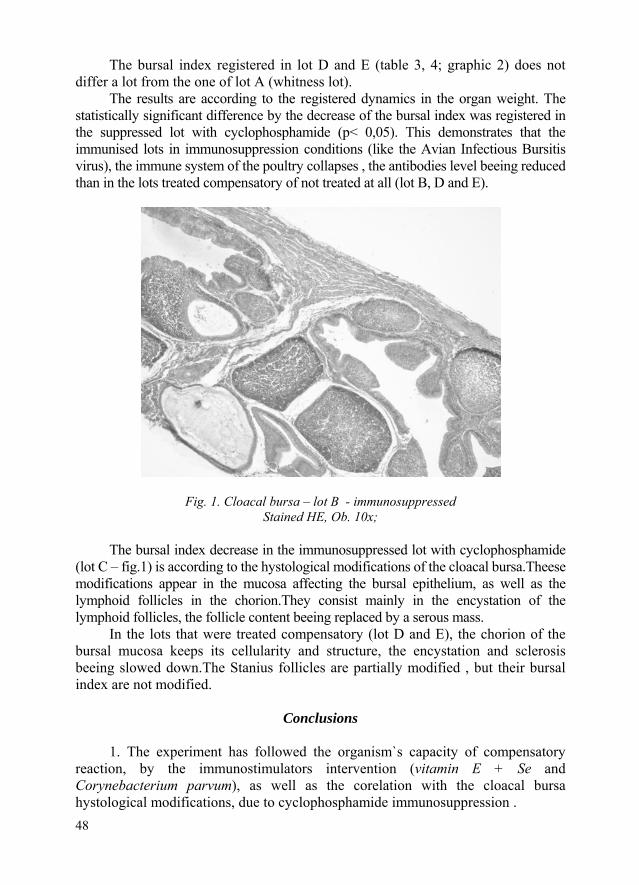
The bursal index registered in lot D and E (table 3, 4; graphic 2) does not differ a lot from the one of lot A (whitness lot).
The results are according to the registered dynamics in the organ weight. The statistically significant difference by the decrease of the bursal index was registered in the suppressed lot with cyclophosphamide (p< 0,05). This demonstrates that the immunised lots in immunosuppression conditions (like the Avian Infectious Bursitis virus), the immune system of the poultry collapses , the antibodies level beeing reduced than in the lots treated compensatory of not treated at all (lot B, D and E).
Fig. 1. Cloacal bursa – lot B - immunosuppressed Stained HE, Ob. 10x;
The bursal index decrease in the immunosuppressed lot with cyclophosphamide
(lot C – fig.1) is according to the hystological modifications of the cloacal bursa.Theese modifications appear in the mucosa affecting the bursal epithelium, as well as the lymphoid follicles in the chorion.They consist mainly in the encystation of the lymphoid follicles, the follicle content beeing replaced by a serous mass.
In the lots that were treated compensatory (lot D and E), the chorion of the bursal mucosa keeps its cellularity and structure, the encystation and sclerosis beeing slowed down.The Stanius follicles are partially modified , but their bursal index are not modified.
Conclusions
1. The experiment has followed the organism`s capacity of compensatory
reaction, by the immunostimulators intervention (vitamin E + Se and Corynebacterium parvum), as well as the corelation with the cloacal bursa hystological modifications, due to cyclophosphamide immunosuppression .
48
49
2. The average weight decrease of the cloacal bursa in the cyclophosphamide immunosuppressed lot, compared to the whitness lot , happened because of the destructions from the bursal parenchyma as well as the fact that probably B lymphocites and memory B lymphocites have migrated to the secondary lymphoid organs.
3. The experiment has pointed the immunomodulatory effect of the vitamin E and Selenium combination against anti-salmonelosis vaccine, even in poultry subjected to previous suppression.
References
1. Călin, V., Vior C., Petruţ T., et al, (2002), Acţiunea unor factori supresori
asupra statusului imun la păsări, „Analele Universităţii Spiru Haret, Seria Med. Vet.”, 3: 103-111.
2. Coman, T., N Cornilă (2002), Structura şi ultrastructura ţesuturilor la animalele domestice, Editura Fundaţiei România de Mâine, Bucureşti.
3. Konjufca, V.K., Bottje W.G., (2004), Influence of Dietary Vitamin E on Phagocitic Functions of Macrophages in Broilers, Poultry Science, 83(9) 1530-1534.
4. Mast, J., Goddeeris, B.M., (1999), Development of Immunocompetence of Broiler Chickens, Vet. Immunol. Immunopathol., 70: 245-356.
5. Rivera J.D., Duff G.C., (2003), Effects of Graded Levels of Vitamin E and Seleniu on Inflamatory Response and Evaluation of Methods of Suplementing Vitamin E and Seleniu on Performance and Health of Broilers, “The Profesional Animal Scient”, 19(2) 171-177.

50 50

51
STUDY ON THE EFFECT OF PROBIOTIC PRODUCTS ON PERFORMANCE OF BROILERS
D. CUCĂ , N. AVRAM , Cristina DINU , 1 1 1
Carmen BERGHEŞ , Eugenia AVRAM1 1
Email: [email protected]
Abstract
The study to tested two probiotic products introduced in the mixed fodder to determine their influence on production performance of broilers.
The testing was done on two batches of Cobb500 broiler, in the control group(L1) composed of 36000 chickens and the experimental group (L2) consists of all 36000 chikens.
There have been pursued: the evolution of body weight, weight gain, mortality rate and specific consumption.
Probiotics in placing all three type of feed recipes Starter, Grower and Finisher led to significantly better results obtained in the experimental group compared with controls as follows:
− Medium – Weight was 2434g in group L2, with 8,79% more than the group L1(2220g);
− Average daily growth between 0-43 days was 56,6 g/ chick in the experimental group 9,5% more than in the control group (51,2g/chick).
− Losses through mortality were 6,3% at L1, up 2,1% from the group L2 (4,2%);
− Specific consumption values 1810g/chicken had the experimental group respectively at 1915g/chicken.
He demonstrated such beneficial effects of probiotic products tested on some production parameters in broilers.
Keywords: probiotics products, performance, chicken broiler
Introduction
Antibiotics were first used by growth promoters in animal nutrition and as biostimulators; their effect has been demonstrated experimentally since 1946. Research has explained the positive impact of maintaining their health, increasing weight gain and feed utilization index.
1 Faculty of Veterinary Medicine, Spiru Haret University, Bucharest, Romania.

52
Besides these beneficial effects have been noted frequently antibiotic resistance phenomena in particular located in the digestive bacteria. E coli have an R factor plasmid containing antibiotic resistance markers and micro characters conferring multiple resistance to antibiotics. Because this R factor is transferable by conjugation to other bacteria, irrational use of antibiotics in farm animal feeds produced a significant increase in frequency of bacteria resistant to multiple antibiotics.
In these circumstances the European Union banned the use of antibiotics as growth promoter and finding classes of products to replace antibiotics (acids, enzymes, probiotics)(1).
Probiotics are the different microbial species apatogene inhibitory effects antinutritivi factors, neutralization of mycotoxins and adjusting the balance of intestinal flora (2,3,4,5,6,7,8,9,10).
Materials and methods
To establish the effect of probiotics on bio broilers were used broiler hybrid
belonging COBB 500 controls divided into two groups (L1) and experimental (L2) with 36 000 chickens per batch.
Each group was individually and body weight was determined at the age of 1day, 7days, 14 days, 21 days, 28 days, 35 days and 42 days when the study ended.
− Objectives in this experiment were: − Evolution of body weight; − Dynamic weight gain; − Evolution of the percentage of mortality; − Specific consumption dynamics; In the first period of 0-14 days chickens home from the two groups were fed
with fodder 21-1S (group L2 feed containing a mixture of probiotic A + B 1500g/tona quantity of feed and control group L1 a feed that contains probiotic.
Growth during 15-28 zile broiler groups were fed with fodder 21-1G in the control group without probiotic and probiotic in the experimental group.
After 29 days of age chickens were given feed without finishing the probiotic and control group at trial with probiotic feed.
Table 1
Structure of mixed fodder used to feed broiler
Starter Grower Finischer Protein% 23 22 19 Lysine% 1,40 1.30 1.19
Methionine% 0.60 0.57 0.51 Tryiptophan% 0.23 0.21 0.19 Threonine% 0.94 0.88 0.79 Leucine% 1.54 1.43 1.34
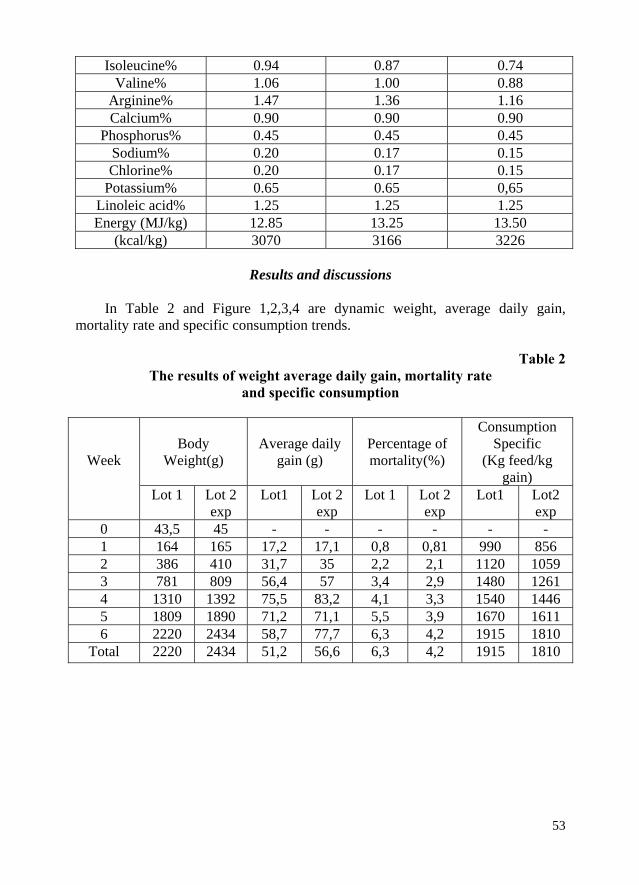
53
Isoleucine% 0.94 0.87 0.74 Valine% 1.06 1.00 0.88
Arginine% 1.47 1.36 1.16 Calcium% 0.90 0.90 0.90
Phosphorus% 0.45 0.45 0.45 Sodium% 0.20 0.17 0.15 Chlorine% 0.20 0.17 0.15
Potassium% 0.65 0.65 0,65 Linoleic acid% 1.25 1.25 1.25 Energy (MJ/kg) 12.85 13.25 13.50
(kcal/kg) 3070 3166 3226
Results and discussions
In Table 2 and Figure 1,2,3,4 are dynamic weight, average daily gain, mortality rate and specific consumption trends.
Table 2
The results of weight average daily gain, mortality rate and specific consumption
Body Weight(g)
Average daily
gain (g)
Percentage of mortality(%)
Consumption Specific
(Kg feed/kg gain)
Week
Lot 1 Lot 2 exp
Lot1 Lot 2 exp
Lot 1 Lot 2 exp
Lot1 Lot2 exp
0 43,5 45 - - - - - - 1 164 165 17,2 17,1 0,8 0,81 990 856 2 386 410 31,7 35 2,2 2,1 1120 1059 3 781 809 56,4 57 3,4 2,9 1480 1261 4 1310 1392 75,5 83,2 4,1 3,3 1540 1446 5 1809 1890 71,2 71,1 5,5 3,9 1670 1611 6 2220 2434 58,7 77,7 6,3 4,2 1915 1810
Total 2220 2434 51,2 56,6 6,3 4,2 1915 1810

0
500
1000
1500
2000
2500
0zile S1 S2 S3 S4 S5 S6
Lot1Lot2
Figure 1. Evolution of average daily gain (g)
01234567
Lot1Lot2
S1 S2 S3 S4 S5 S6 Total
Figure 2. Evolution of the percentage of mortality (%)
0
500
1000
1500
2000
S1 S2 S3 S4 S5 S6 Total
Lot1
Lot2
Figure 3. The evolution of specific consumption (kg feed / kg gain)
Experimental group which was fed with mixed fodder is used with added
probiotic feed, had higher weights at all scales from the control group sample 165g, 410g, 809, 1392g, 1890g, 2434g to 164g, 386g 781g , 1310g, 1809g, 2220g.
Comparing the groups who received the probiotic in feed lot that has not received notice that this group had a total increase of 9.5% higher than the control group: 56.6 g to 51.2 g.
54
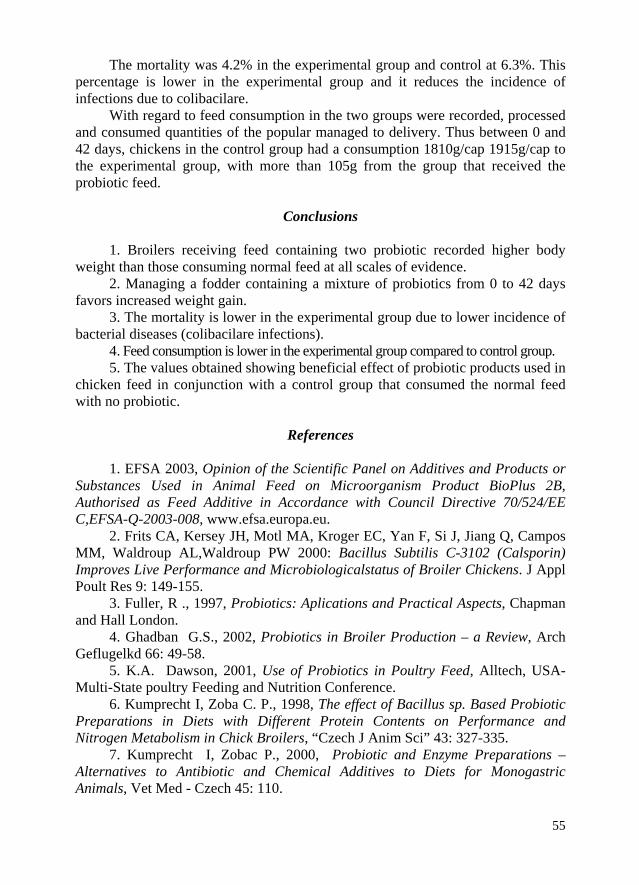
55
The mortality was 4.2% in the experimental group and control at 6.3%. This percentage is lower in the experimental group and it reduces the incidence of infections due to colibacilare.
With regard to feed consumption in the two groups were recorded, processed and consumed quantities of the popular managed to delivery. Thus between 0 and 42 days, chickens in the control group had a consumption 1810g/cap 1915g/cap to the experimental group, with more than 105g from the group that received the probiotic feed.
Conclusions
1. Broilers receiving feed containing two probiotic recorded higher body
weight than those consuming normal feed at all scales of evidence. 2. Managing a fodder containing a mixture of probiotics from 0 to 42 days
favors increased weight gain. 3. The mortality is lower in the experimental group due to lower incidence of
bacterial diseases (colibacilare infections). 4. Feed consumption is lower in the experimental group compared to control group. 5. The values obtained showing beneficial effect of probiotic products used in
chicken feed in conjunction with a control group that consumed the normal feed with no probiotic.
References
1. EFSA 2003, Opinion of the Scientific Panel on Additives and Products or
Substances Used in Animal Feed on Microorganism Product BioPlus 2B, Authorised as Feed Additive in Accordance with Council Directive 70/524/EE C,EFSA-Q-2003-008, www.efsa.europa.eu.
2. Frits CA, Kersey JH, Motl MA, Kroger EC, Yan F, Si J, Jiang Q, Campos MM, Waldroup AL,Waldroup PW 2000: Bacillus Subtilis C-3102 (Calsporin) Improves Live Performance and Microbiologicalstatus of Broiler Chickens. J Appl Poult Res 9: 149-155.
3. Fuller, R ., 1997, Probiotics: Aplications and Practical Aspects, Chapman and Hall London.
4. Ghadban G.S., 2002, Probiotics in Broiler Production – a Review, Arch Geflugelkd 66: 49-58.
5. K.A. Dawson, 2001, Use of Probiotics in Poultry Feed, Alltech, USA- Multi-State poultry Feeding and Nutrition Conference.
6. Kumprecht I, Zoba C. P., 1998, The effect of Bacillus sp. Based Probiotic Preparations in Diets with Different Protein Contents on Performance and Nitrogen Metabolism in Chick Broilers, “Czech J Anim Sci” 43: 327-335.
7. Kumprecht I, Zobac P., 2000, Probiotic and Enzyme Preparations – Alternatives to Antibiotic and Chemical Additives to Diets for Monogastric Animals, Vet Med - Czech 45: 110.

56
8. Mead G.C., 1989, Microbes of the Avian Cecum: Types Present and Substrates Utilized, J Exp Zool Suppl 3: 48-54.
9. O’Dea E.E., Fasenko G.M., Allison G.E., Korver D.R., Tanock G.W., Guan L.L., 2006, Investigating the Effects of Commercial Probiotics on Broiler Chick Quality and Production Efficiency, “Poult Sci 85”: 1855-1863.
10. Patterson J.A., Burkholder K.M., 2003, Application of Prebiotics and Probiotics in Poultry Production, “Poult Sci 82”: 627-631.
57
VARIATION ON A REGULAR SINUS RHYTHM PATHOPHISIOLOGY OF DOG
Cristina DINU1, N. AVRAM1, D.CUCĂ1, Fl. LECA1 (student)
e-mail: [email protected]
Abstract
The study sought to differentiate the physiological disturbances of heart rhythm of their pathological aspects in dogs of various breeds, aged between 3 and 14 years who presented for consultation at our university clinic. In this respect there have been records of cyclic activity of the heart using a portable ECG device (DELTA PLUS) by the standard method of the six bipolar limb derivatives. Compared with reference data characteristic regular sinus rhythm were identified aspects of sinus tachycardia (mean heart rate 200 b / min, the presence of TP wave, PQ interval duration <0.06 s, QT duration <0.15 s), issues of sinus bradycardia (average heart rate 50 b / min, duration of PQ interval > 0.13 s, QT interval duration > 0.25 s), stopping sinus issues (PP interval duration > 0.12 s).
Depending on clinical context, the systolic blood pressure, heart rate changes of intensity noise, the response to carotid sinus massage, the response to vagal blockade by iv injection with atropine, could determine the origin of these changes of pace.
Keywords: dog, regular sinus rhythm, cardiac arrhythmias
Introduction Study of cardiac automatism, generation and management of bioelectrical
impulses in heart muscle mass is crucial in understanding and differentiating physiological disorders and driving rhythms, their pathological aspects. Rhythm disturbances may be due either to abnormal bioelectric impulse formation in embryonic heart tissue, or abnormalities in its leadership to working myocardium (Irisawa et al., 1995).
Identifying and determining the origin of cardiac arrhythmias require knowledge of electrophysiological mechanisms of heart activity. Depending on the intensity factors of maintenance or the trigger forms of cardiac arrhythmia can be clinically detected. These differences can be achieved primarily through electrocardiography cardiac activity and then interpret the changes in the ECG.
1 Faculty of Veterinary Medicine, Spiru Haret University, Bucharest, Romania.
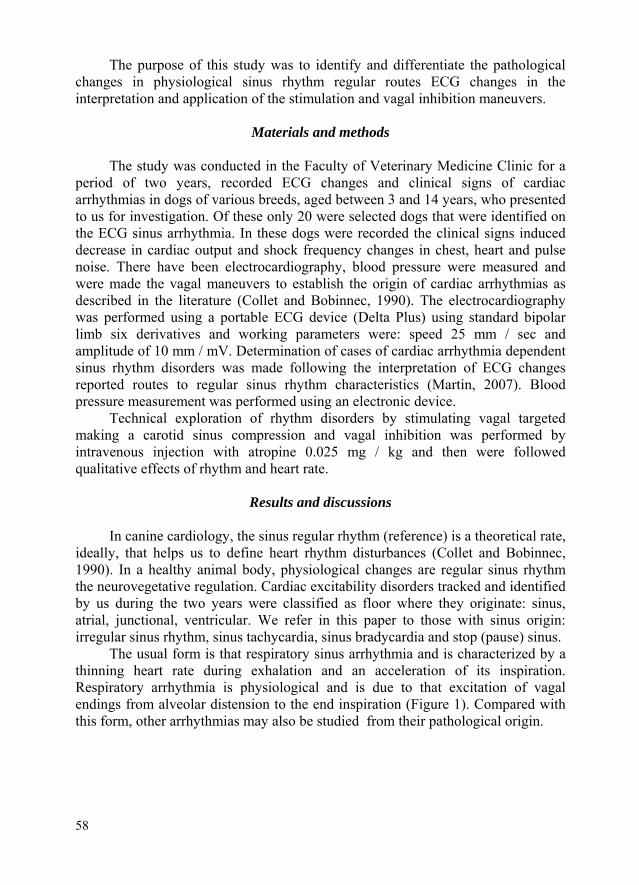
58
The purpose of this study was to identify and differentiate the pathological changes in physiological sinus rhythm regular routes ECG changes in the interpretation and application of the stimulation and vagal inhibition maneuvers.
Materials and methods
The study was conducted in the Faculty of Veterinary Medicine Clinic for a
period of two years, recorded ECG changes and clinical signs of cardiac arrhythmias in dogs of various breeds, aged between 3 and 14 years, who presented to us for investigation. Of these only 20 were selected dogs that were identified on the ECG sinus arrhythmia. In these dogs were recorded the clinical signs induced decrease in cardiac output and shock frequency changes in chest, heart and pulse noise. There have been electrocardiography, blood pressure were measured and were made the vagal maneuvers to establish the origin of cardiac arrhythmias as described in the literature (Collet and Bobinnec, 1990). The electrocardiography was performed using a portable ECG device (Delta Plus) using standard bipolar limb six derivatives and working parameters were: speed 25 mm / sec and amplitude of 10 mm / mV. Determination of cases of cardiac arrhythmia dependent sinus rhythm disorders was made following the interpretation of ECG changes reported routes to regular sinus rhythm characteristics (Martin, 2007). Blood pressure measurement was performed using an electronic device.
Technical exploration of rhythm disorders by stimulating vagal targeted making a carotid sinus compression and vagal inhibition was performed by intravenous injection with atropine 0.025 mg / kg and then were followed qualitative effects of rhythm and heart rate.
Results and discussions
In canine cardiology, the sinus regular rhythm (reference) is a theoretical rate,
ideally, that helps us to define heart rhythm disturbances (Collet and Bobinnec, 1990). In a healthy animal body, physiological changes are regular sinus rhythm the neurovegetative regulation. Cardiac excitability disorders tracked and identified by us during the two years were classified as floor where they originate: sinus, atrial, junctional, ventricular. We refer in this paper to those with sinus origin: irregular sinus rhythm, sinus tachycardia, sinus bradycardia and stop (pause) sinus.
The usual form is that respiratory sinus arrhythmia and is characterized by a thinning heart rate during exhalation and an acceleration of its inspiration. Respiratory arrhythmia is physiological and is due to that excitation of vagal endings from alveolar distension to the end inspiration (Figure 1). Compared with this form, other arrhythmias may also be studied from their pathological origin.
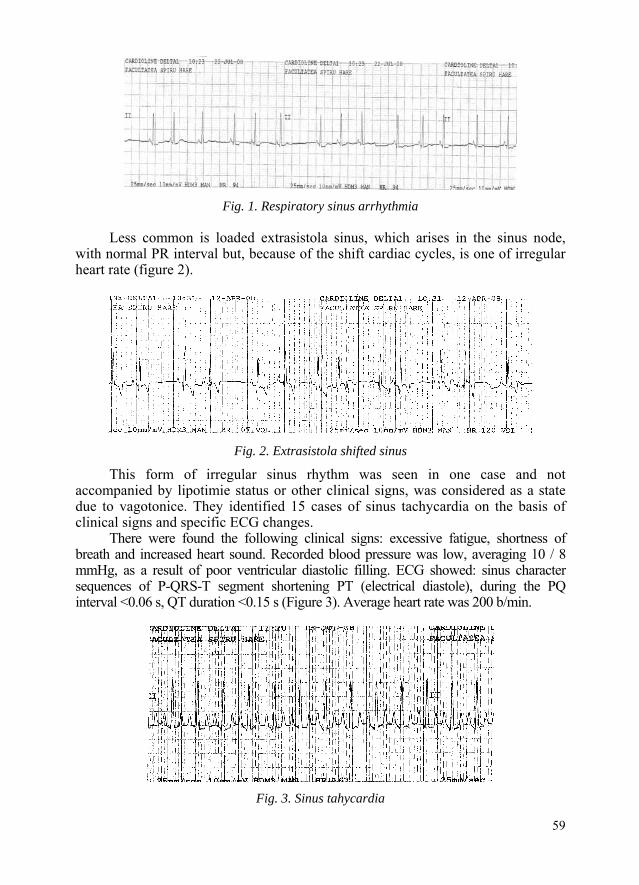
Fig. 1. Respiratory sinus arrhythmia
Less common is loaded extrasistola sinus, which arises in the sinus node,
with normal PR interval but, because of the shift cardiac cycles, is one of irregular heart rate (figure 2).
Fig. 2. Extrasistola shifted sinus
This form of irregular sinus rhythm was seen in one case and not accompanied by lipotimie status or other clinical signs, was considered as a state due to vagotonice. They identified 15 cases of sinus tachycardia on the basis of clinical signs and specific ECG changes.
There were found the following clinical signs: excessive fatigue, shortness of breath and increased heart sound. Recorded blood pressure was low, averaging 10 / 8 mmHg, as a result of poor ventricular diastolic filling. ECG showed: sinus character sequences of P-QRS-T segment shortening PT (electrical diastole), during the PQ interval <0.06 s, QT duration <0.15 s (Figure 3). Average heart rate was 200 b/min.
Fig. 3. Sinus tahycardia
59

In 10 of the 15 cases mentioned, sinus tachycardia was of pathological origin. So we met in seven cases of sinus tachycardia as primary manifestation of chronic heart failure and three cases that show secondary to fever, anemia and hyperthyroidism states. In all these cases, sinus tachycardia was accompanied by clinical signs of these diseases. The other four cases were questioned differential diagnosis of supraventricular tachycardia due to excessive heart rate (255 bpm) and the tendency of overlapping successive waves T and P (Figure 4).
Fig. 4. Supraventricular tachycardia Supraventricular tachycardia (atrial and junctional), has an abrupt onset
caused by the entry into office a center of ectopic or sinus node area during an atrio-ventricular heart failure. ECG examination revealed a regular sinus rhythm and quickly superimposed P waves and inverted T waves (negative) normal QRS complex (figure 4).
If supraventricular tachycardia, labor vagal stimulation by carotid sinus compression for 3-5 seconds, has no effect or caused a sudden stop tachycardia the immediate installation of a slow sinus rhythm (Figure 5).
Fig. 5. Carotid sinus compression (CSC) in supraventricular tachycardia
60
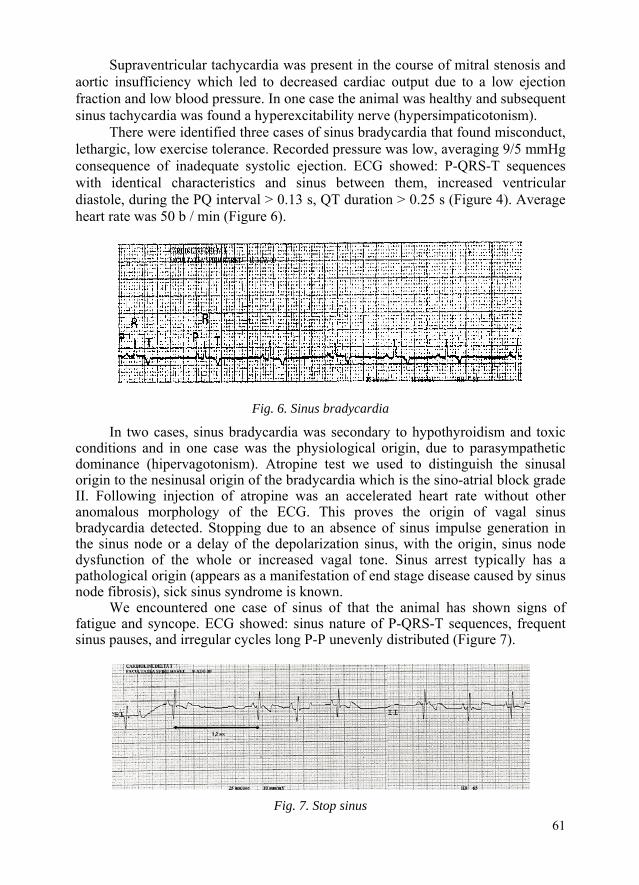
Supraventricular tachycardia was present in the course of mitral stenosis and aortic insufficiency which led to decreased cardiac output due to a low ejection fraction and low blood pressure. In one case the animal was healthy and subsequent sinus tachycardia was found a hyperexcitability nerve (hypersimpaticotonism).
There were identified three cases of sinus bradycardia that found misconduct, lethargic, low exercise tolerance. Recorded pressure was low, averaging 9/5 mmHg consequence of inadequate systolic ejection. ECG showed: P-QRS-T sequences with identical characteristics and sinus between them, increased ventricular diastole, during the PQ interval > 0.13 s, QT duration > 0.25 s (Figure 4). Average heart rate was 50 b / min (Figure 6).
Fig. 6. Sinus bradycardia
In two cases, sinus bradycardia was secondary to hypothyroidism and toxic conditions and in one case was the physiological origin, due to parasympathetic dominance (hipervagotonism). Atropine test we used to distinguish the sinusal origin to the nesinusal origin of the bradycardia which is the sino-atrial block grade II. Following injection of atropine was an accelerated heart rate without other anomalous morphology of the ECG. This proves the origin of vagal sinus bradycardia detected. Stopping due to an absence of sinus impulse generation in the sinus node or a delay of the depolarization sinus, with the origin, sinus node dysfunction of the whole or increased vagal tone. Sinus arrest typically has a pathological origin (appears as a manifestation of end stage disease caused by sinus node fibrosis), sick sinus syndrome is known.
We encountered one case of sinus of that the animal has shown signs of fatigue and syncope. ECG showed: sinus nature of P-QRS-T sequences, frequent sinus pauses, and irregular cycles long P-P unevenly distributed (Figure 7).
Fig. 7. Stop sinus
61

62
The atropine test (parasympathetic inhibition action) had no electrocardiographyque response which shows that the stopping sinus was pathological origin. If stopping vagal sinus home test had hed the effect of atropine, the heart rate would have doublet.
Conclusions
1. Vagal stimulation and inhibition tests can differentiate existing rhythm
disorders of the rhythm latent, subclinical (abnormal excitability and driving). 2. Using tests of vagal stimulation and inhibition may be a common practice
in the differential diagnosis of cardiac arrhythmias.
References 1. Collet, M., Bobinnec,G., 1990, Electrocardiographie et rythmologie
canines, Maison Alfort: Collection Médecine Vétérinaire, Ėditions du Point Vétérinaire.
2. Martin M., 2007, Small Animal ECGs: An Introductory Guide, 2ndEdition, Oxford: Blackwell Science.
3. Irisawa H., Noma A., Matsuda H., 1995, Electrogenesis of the Pacemaker Potentials as Revealed by Sinusal and Atrioventricular Nodal Experiments. Physiology and Patophysiology of the Heart, 3thEdition, Boston, 84-159.
63
ELECTROCARDIOGRAM FEATURES TO ROMANIAN SPORT HORSE
Cristina DINU1, N. AVRAM1, D. CUCĂ1, Ghe. TUDOR (student)
e-mail: [email protected]
Abstract
The study was conducted on a total of 5 Romanian Sport horses, with a mean age of 10 years and was aimed at characterizing bioelectrical activity of the heart. In these ways after the final training exercises were conducted by technical Dubois electrocardiogram. P wave morphology has two characteristics: a two-phase appearance (cipher), with the second deflection (P1 and P2) positive in 85% of cases and monophasic positive aspect in 15% of cases. QRS complex was 0.100 sec RS duration and amplitude of 1.180 mV. Duration of R-T interval was 0.310 sec. T-wave morphology was biphasic in 70% of cases and monophasic positive in 30% of cases.
Two-phase appearance of P with P1 positive wave, R wave amplitude between 1,00-2,50 mV, two-phase appearance of the T wave with positive T2 characterizes sport horses that reach top form as force report and literature for this class horses.
Keywords: Romanian Sport horses, electrocardiography, effort
Introduction There coexist helpfuly in determining suitability for a variety of intrinsic
factors, the genetic origin (conformation, body size, cardio-respiratory capacity, muscular capacity, function and biomechanics of locomotor behavioral traits) and extrinsic (growth technology, training and relationship elements between horse trainer or rider). Intrinsic and extrinsic factors are in a relationship of interdependence and assessment exercise, capacity due to horse sports development that should be consistent with its adaptation to the intensity and rhythm training exercises.
During training adaptation occur cardiovascular and respiratory functions through an increase in the maximum possible volume of O2 transport to muscle tissue, muscle increased tolerance to lactic acid from anaerobic glycolysis and a reduction in mechanical work heart, when efforts take place. The evolution of these functional changes can be followed by numerous direct measurements (heart rate
1 Faculty of Veterinary Medicine, Spiru Haret University, Bucharest, Romania.
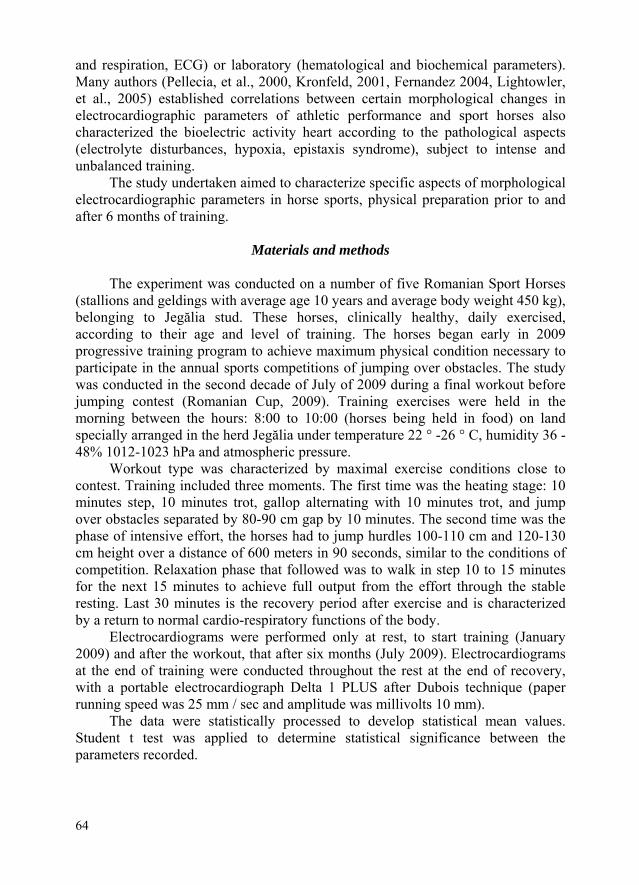
64
and respiration, ECG) or laboratory (hematological and biochemical parameters). Many authors (Pellecia, et al., 2000, Kronfeld, 2001, Fernandez 2004, Lightowler, et al., 2005) established correlations between certain morphological changes in electrocardiographic parameters of athletic performance and sport horses also characterized the bioelectric activity heart according to the pathological aspects (electrolyte disturbances, hypoxia, epistaxis syndrome), subject to intense and unbalanced training.
The study undertaken aimed to characterize specific aspects of morphological electrocardiographic parameters in horse sports, physical preparation prior to and after 6 months of training.
Materials and methods
The experiment was conducted on a number of five Romanian Sport Horses
(stallions and geldings with average age 10 years and average body weight 450 kg), belonging to Jegălia stud. These horses, clinically healthy, daily exercised, according to their age and level of training. The horses began early in 2009 progressive training program to achieve maximum physical condition necessary to participate in the annual sports competitions of jumping over obstacles. The study was conducted in the second decade of July of 2009 during a final workout before jumping contest (Romanian Cup, 2009). Training exercises were held in the morning between the hours: 8:00 to 10:00 (horses being held in food) on land specially arranged in the herd Jegălia under temperature 22 ° -26 ° C, humidity 36 - 48% 1012-1023 hPa and atmospheric pressure.
Workout type was characterized by maximal exercise conditions close to contest. Training included three moments. The first time was the heating stage: 10 minutes step, 10 minutes trot, gallop alternating with 10 minutes trot, and jump over obstacles separated by 80-90 cm gap by 10 minutes. The second time was the phase of intensive effort, the horses had to jump hurdles 100-110 cm and 120-130 cm height over a distance of 600 meters in 90 seconds, similar to the conditions of competition. Relaxation phase that followed was to walk in step 10 to 15 minutes for the next 15 minutes to achieve full output from the effort through the stable resting. Last 30 minutes is the recovery period after exercise and is characterized by a return to normal cardio-respiratory functions of the body.
Electrocardiograms were performed only at rest, to start training (January 2009) and after the workout, that after six months (July 2009). Electrocardiograms at the end of training were conducted throughout the rest at the end of recovery, with a portable electrocardiograph Delta 1 PLUS after Dubois technique (paper running speed was 25 mm / sec and amplitude was millivolts 10 mm).
The data were statistically processed to develop statistical mean values. Student t test was applied to determine statistical significance between the parameters recorded.

65
Results and discussions At the beginning of training (January 2009), after the five horses
electrocardiography Romanian Sports differences could determine the morphology, duration and amplitude of waves and intervals. At rest and before training, P wave was bifidate appearance of the two deflection (P1 and P2), positive in DII, DIII, aVF, and biphasic with P1 and P2 negative in aVR, aVL. In DI, biphasic P wave presented two zero deflection P1 and P2. Biphasic P wave has two sharp points form the letter “M”.
Literature mentions an issue that is abnormal biphasic P wave with negative P1. Pellecia et al., 2000, Piccioni et al., 2003, suggests that this is due to neurovagetative instability and is correlated with weaker performance seen in some way involved.
The average duration biphasic wave form P2 was 0.130 sec. <br>P2 The mean amplitude biphasic P2 wave was 0.176 mV (while P1 amplitude was only 0.080 mV).
Characteristics of ECG waves and intervals in terms of mean and standard deviation of their duration and amplitude are presented in table 1.
Table 1
The waves and intervals ECG characteristics of Romanian sport horses before training period
Duration
(sec) Amplitude
(mV) ECG
parameters M DS M DS
P2 biphasic 0.130 0.014 0.176 0.018 P-R (P-Q) 0.280 0.024 - -
QRS 0.097 0.010 1.450 0.580
R-T (S-T) 0.480 0.034 - - T monophasic 0.080 0.012 0.480 0.038
T2 biphasic 0.210 0.040 0.505 0.051 PR interval (PQ) is the time of the depolarization wave propagation from
sinus node to the atrio-ventricular node. PR interval duration translates vagal tone, instability is linked to respiratory sinus arrhythmia or atrio-ventricular not always pathological significance (Fernandez, 2004). PR interval varies with heart rate (this shortens when heart rate increase) and age (it elongated with age). QRS complex corresponds to ventricular depolarization wave. Morphological characteristics of QRS complex were: rS type in DII, DIII, aVF and qR type in DI, aVR, aVL. Mean amplitude of ventricular complex was 1.450 mV and duration of 0.097 sec. T wave represents ventricular repolarization. In the experiment, all horses were found biphasic appearance of T wave, with T1 negative and T2 positive in DII, DIII, aVF. In other derivatives, respectively aVR, aVL, T wave had two aspects: or biphasic
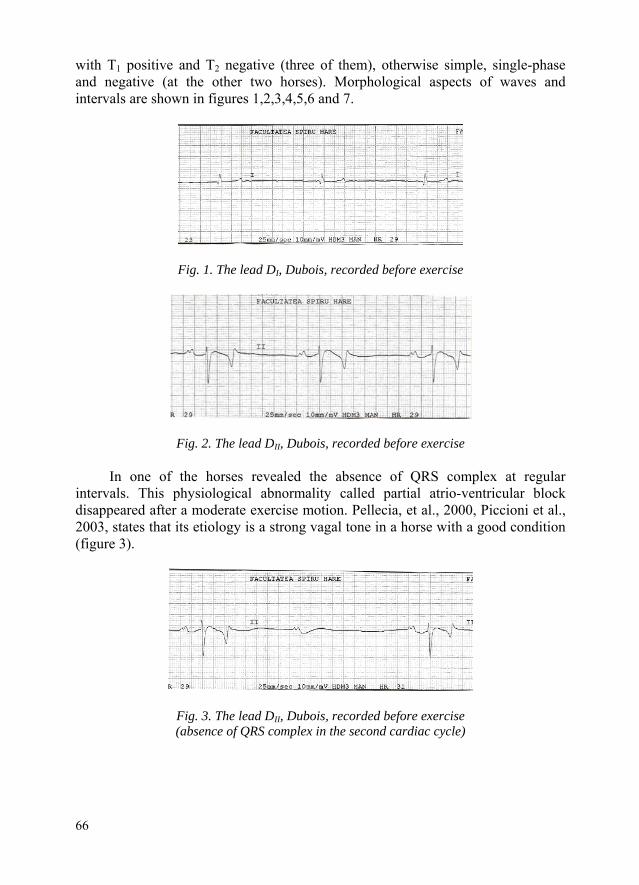
with T1 positive and T2 negative (three of them), otherwise simple, single-phase and negative (at the other two horses). Morphological aspects of waves and intervals are shown in figures 1,2,3,4,5,6 and 7.
Fig. 1. The lead DI, Dubois, recorded before exercise
Fig. 2. The lead DII, Dubois, recorded before exercise In one of the horses revealed the absence of QRS complex at regular
intervals. This physiological abnormality called partial atrio-ventricular block disappeared after a moderate exercise motion. Pellecia, et al., 2000, Piccioni et al., 2003, states that its etiology is a strong vagal tone in a horse with a good condition (figure 3).
Fig. 3. The lead DII, Dubois, recorded before exercise (absence of QRS complex in the second cardiac cycle)
66
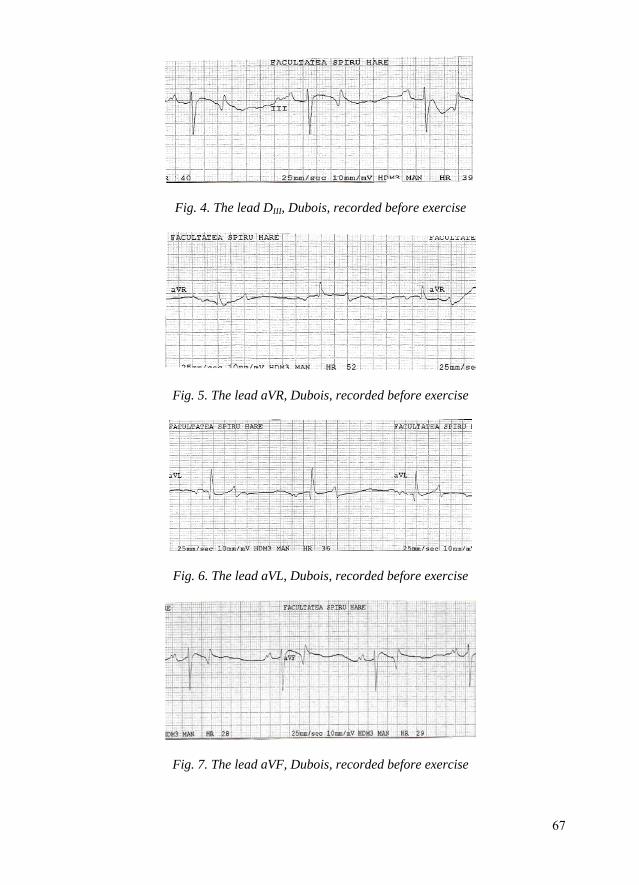
Fig. 4. The lead DIII, Dubois, recorded before exercise
Fig. 5. The lead aVR, Dubois, recorded before exercise
Fig. 6. The lead aVL, Dubois, recorded before exercise
Fig. 7. The lead aVF, Dubois, recorded before exercise
67
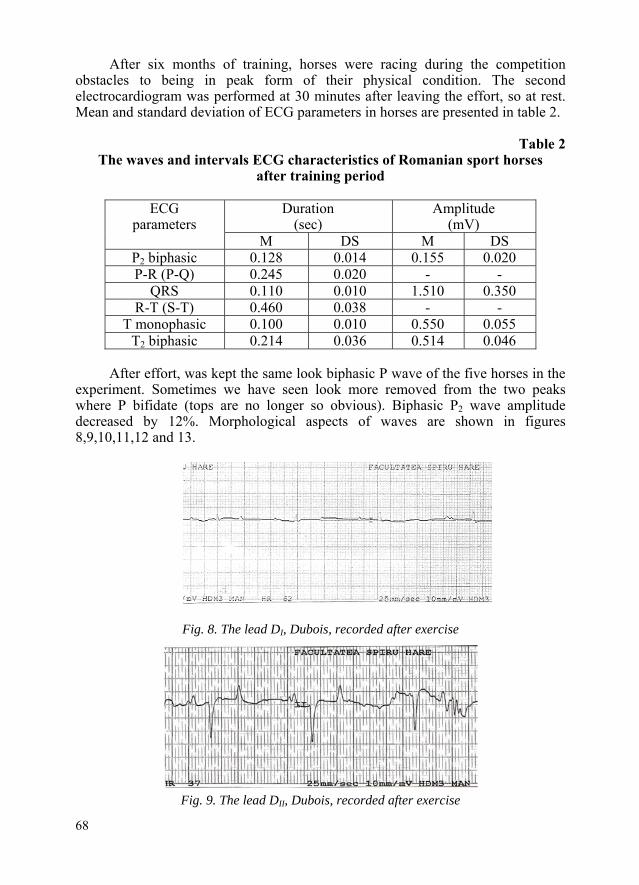
After six months of training, horses were racing during the competition obstacles to being in peak form of their physical condition. The second electrocardiogram was performed at 30 minutes after leaving the effort, so at rest. Mean and standard deviation of ECG parameters in horses are presented in table 2.
Table 2
The waves and intervals ECG characteristics of Romanian sport horses after training period
Duration
(sec) Amplitude
(mV) ECG
parameters M DS M DS
P2 biphasic 0.128 0.014 0.155 0.020 P-R (P-Q) 0.245 0.020 - -
QRS 0.110 0.010 1.510 0.350 R-T (S-T) 0.460 0.038 - -
T monophasic 0.100 0.010 0.550 0.055 T2 biphasic 0.214 0.036 0.514 0.046
After effort, was kept the same look biphasic P wave of the five horses in the
experiment. Sometimes we have seen look more removed from the two peaks where P bifidate (tops are no longer so obvious). Biphasic P2 wave amplitude decreased by 12%. Morphological aspects of waves are shown in figures 8,9,10,11,12 and 13.
Fig. 8. The lead DI, Dubois, recorded after exercise
Fig. 9. The lead DII, Dubois, recorded after exercise
68
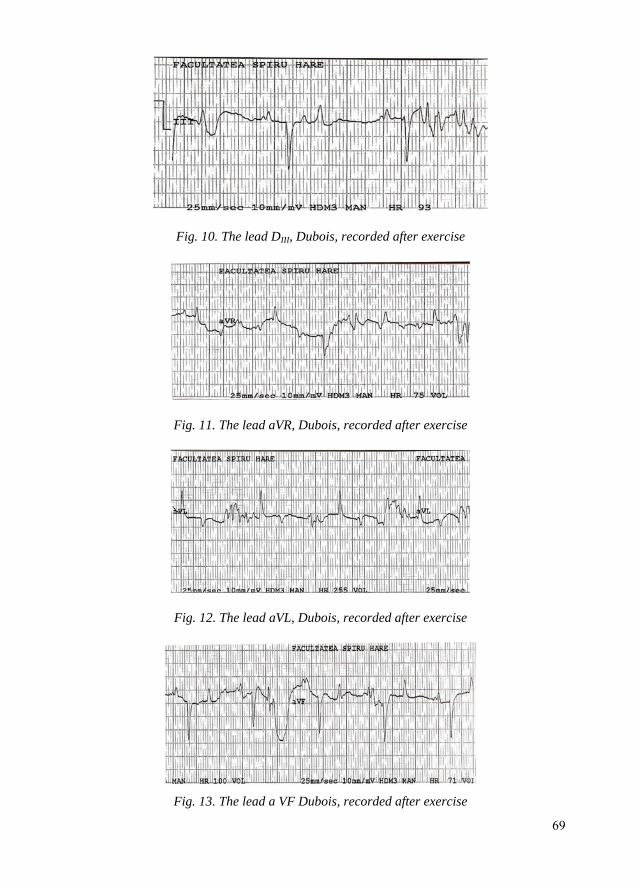
Fig. 10. The lead DIII, Dubois, recorded after exercise
Fig. 11. The lead aVR, Dubois, recorded after exercise
Fig. 12. The lead aVL, Dubois, recorded after exercise
Fig. 13. The lead a VF Dubois, recorded after exercise
69
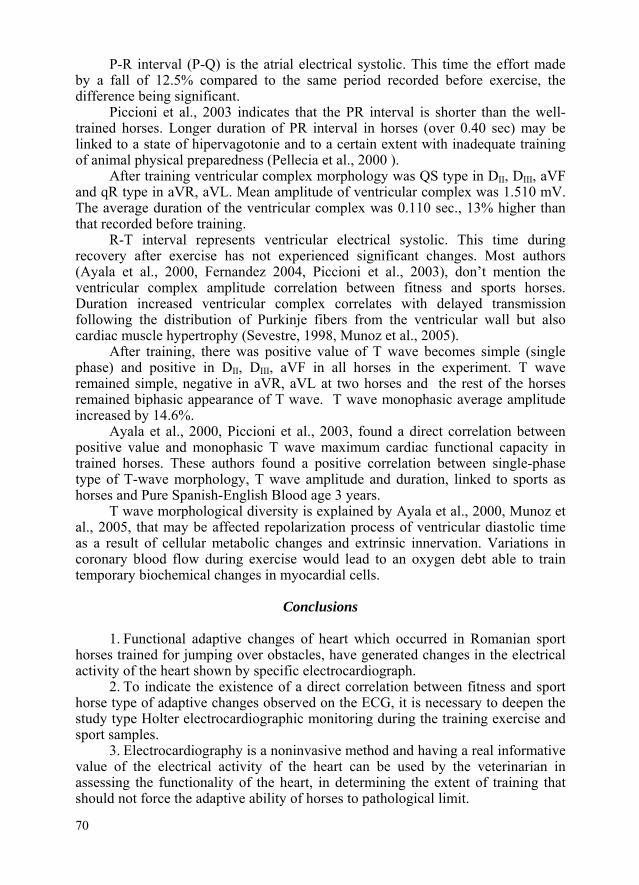
70
P-R interval (P-Q) is the atrial electrical systolic. This time the effort made by a fall of 12.5% compared to the same period recorded before exercise, the difference being significant.
Piccioni et al., 2003 indicates that the PR interval is shorter than the well-trained horses. Longer duration of PR interval in horses (over 0.40 sec) may be linked to a state of hipervagotonie and to a certain extent with inadequate training of animal physical preparedness (Pellecia et al., 2000 ).
After training ventricular complex morphology was QS type in DII, DIII, aVF and qR type in aVR, aVL. Mean amplitude of ventricular complex was 1.510 mV. The average duration of the ventricular complex was 0.110 sec., 13% higher than that recorded before training.
R-T interval represents ventricular electrical systolic. This time during recovery after exercise has not experienced significant changes. Most authors (Ayala et al., 2000, Fernandez 2004, Piccioni et al., 2003), don’t mention the ventricular complex amplitude correlation between fitness and sports horses. Duration increased ventricular complex correlates with delayed transmission following the distribution of Purkinje fibers from the ventricular wall but also cardiac muscle hypertrophy (Sevestre, 1998, Munoz et al., 2005).
After training, there was positive value of T wave becomes simple (single phase) and positive in DII, DIII, aVF in all horses in the experiment. T wave remained simple, negative in aVR, aVL at two horses and the rest of the horses remained biphasic appearance of T wave. T wave monophasic average amplitude increased by 14.6%.
Ayala et al., 2000, Piccioni et al., 2003, found a direct correlation between positive value and monophasic T wave maximum cardiac functional capacity in trained horses. These authors found a positive correlation between single-phase type of T-wave morphology, T wave amplitude and duration, linked to sports as horses and Pure Spanish-English Blood age 3 years.
T wave morphological diversity is explained by Ayala et al., 2000, Munoz et al., 2005, that may be affected repolarization process of ventricular diastolic time as a result of cellular metabolic changes and extrinsic innervation. Variations in coronary blood flow during exercise would lead to an oxygen debt able to train temporary biochemical changes in myocardial cells.
Conclusions
1. Functional adaptive changes of heart which occurred in Romanian sport
horses trained for jumping over obstacles, have generated changes in the electrical activity of the heart shown by specific electrocardiograph.
2. To indicate the existence of a direct correlation between fitness and sport horse type of adaptive changes observed on the ECG, it is necessary to deepen the study type Holter electrocardiographic monitoring during the training exercise and sport samples.
3. Electrocardiography is a noninvasive method and having a real informative value of the electrical activity of the heart can be used by the veterinarian in assessing the functionality of the heart, in determining the extent of training that should not force the adaptive ability of horses to pathological limit.
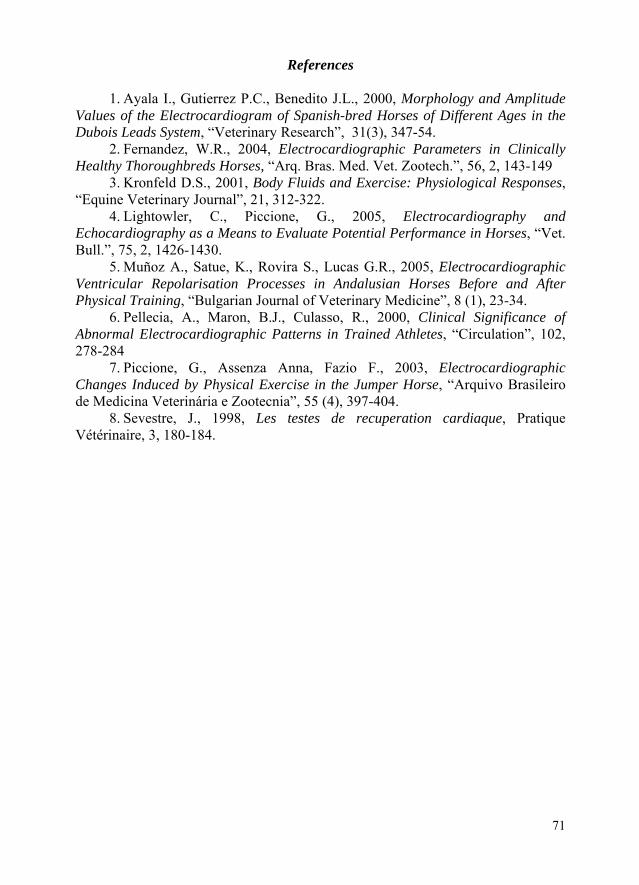
71
References 1. Ayala I., Gutierrez P.C., Benedito J.L., 2000, Morphology and Amplitude
Values of the Electrocardiogram of Spanish-bred Horses of Different Ages in the Dubois Leads System, “Veterinary Research”, 31(3), 347-54.
2. Fernandez, W.R., 2004, Electrocardiographic Parameters in Clinically Healthy Thoroughbreds Horses, “Arq. Bras. Med. Vet. Zootech.”, 56, 2, 143-149
3. Kronfeld D.S., 2001, Body Fluids and Exercise: Physiological Responses, “Equine Veterinary Journal”, 21, 312-322.
4. Lightowler, C., Piccione, G., 2005, Electrocardiography and Echocardiography as a Means to Evaluate Potential Performance in Horses, “Vet. Bull.”, 75, 2, 1426-1430.
5. Muñoz A., Satue, K., Rovira S., Lucas G.R., 2005, Electrocardiographic Ventricular Repolarisation Processes in Andalusian Horses Before and After Physical Training, “Bulgarian Journal of Veterinary Medicine”, 8 (1), 23-34.
6. Pellecia, A., Maron, B.J., Culasso, R., 2000, Clinical Significance of Abnormal Electrocardiographic Patterns in Trained Athletes, “Circulation”, 102, 278-284
7. Piccione, G., Assenza Anna, Fazio F., 2003, Electrocardiographic Changes Induced by Physical Exercise in the Jumper Horse, “Arquivo Brasileiro de Medicina Veterinária e Zootecnia”, 55 (4), 397-404.
8. Sevestre, J., 1998, Les testes de recuperation cardiaque, Pratique Vétérinaire, 3, 180-184.

72 72
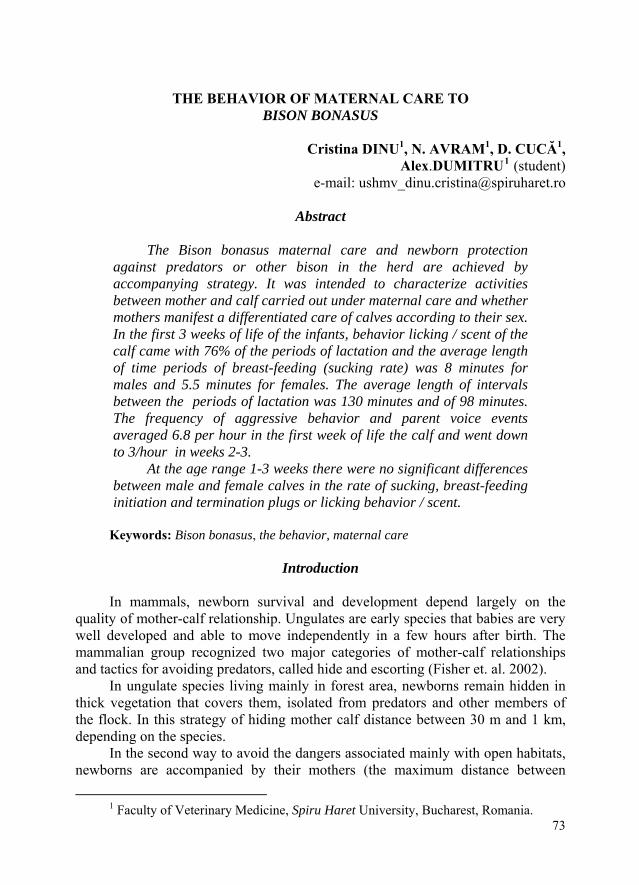
73
THE BEHAVIOR OF MATERNAL CARE TO BISON BONASUS
Cristina DINU1, N. AVRAM1, D. CUCĂ1,
Alex.DUMITRU1 (student) e-mail: [email protected]
Abstract
The Bison bonasus maternal care and newborn protection
against predators or other bison in the herd are achieved by accompanying strategy. It was intended to characterize activities between mother and calf carried out under maternal care and whether mothers manifest a differentiated care of calves according to their sex. In the first 3 weeks of life of the infants, behavior licking / scent of the calf came with 76% of the periods of lactation and the average length of time periods of breast-feeding (sucking rate) was 8 minutes for males and 5.5 minutes for females. The average length of intervals between the periods of lactation was 130 minutes and of 98 minutes. The frequency of aggressive behavior and parent voice events averaged 6.8 per hour in the first week of life the calf and went down to 3/hour in weeks 2-3.
At the age range 1-3 weeks there were no significant differences between male and female calves in the rate of sucking, breast-feeding initiation and termination plugs or licking behavior / scent.
Keywords: Bison bonasus, the behavior, maternal care
Introduction In mammals, newborn survival and development depend largely on the
quality of mother-calf relationship. Ungulates are early species that babies are very well developed and able to move independently in a few hours after birth. The mammalian group recognized two major categories of mother-calf relationships and tactics for avoiding predators, called hide and escorting (Fisher et. al. 2002).
In ungulate species living mainly in forest area, newborns remain hidden in thick vegetation that covers them, isolated from predators and other members of the flock. In this strategy of hiding mother calf distance between 30 m and 1 km, depending on the species.
In the second way to avoid the dangers associated mainly with open habitats, newborns are accompanied by their mothers (the maximum distance between
1 Faculty of Veterinary Medicine, Spiru Haret University, Bucharest, Romania.
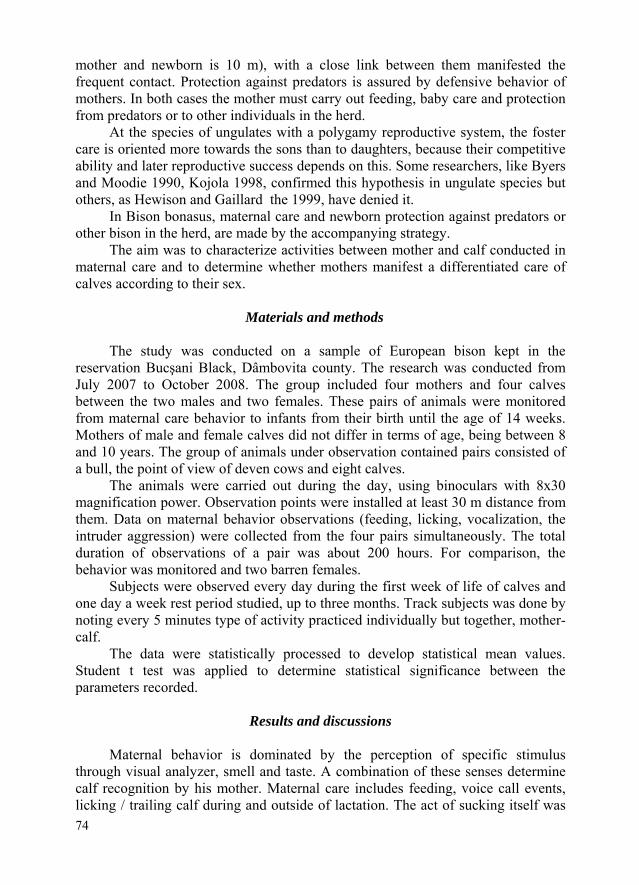
74
mother and newborn is 10 m), with a close link between them manifested the frequent contact. Protection against predators is assured by defensive behavior of mothers. In both cases the mother must carry out feeding, baby care and protection from predators or to other individuals in the herd.
At the species of ungulates with a polygamy reproductive system, the foster care is oriented more towards the sons than to daughters, because their competitive ability and later reproductive success depends on this. Some researchers, like Byers and Moodie 1990, Kojola 1998, confirmed this hypothesis in ungulate species but others, as Hewison and Gaillard the 1999, have denied it.
In Bison bonasus, maternal care and newborn protection against predators or other bison in the herd, are made by the accompanying strategy.
The aim was to characterize activities between mother and calf conducted in maternal care and to determine whether mothers manifest a differentiated care of calves according to their sex.
Materials and methods
The study was conducted on a sample of European bison kept in the
reservation Bucşani Black, Dâmbovita county. The research was conducted from July 2007 to October 2008. The group included four mothers and four calves between the two males and two females. These pairs of animals were monitored from maternal care behavior to infants from their birth until the age of 14 weeks. Mothers of male and female calves did not differ in terms of age, being between 8 and 10 years. The group of animals under observation contained pairs consisted of a bull, the point of view of deven cows and eight calves.
The animals were carried out during the day, using binoculars with 8x30 magnification power. Observation points were installed at least 30 m distance from them. Data on maternal behavior observations (feeding, licking, vocalization, the intruder aggression) were collected from the four pairs simultaneously. The total duration of observations of a pair was about 200 hours. For comparison, the behavior was monitored and two barren females.
Subjects were observed every day during the first week of life of calves and one day a week rest period studied, up to three months. Track subjects was done by noting every 5 minutes type of activity practiced individually but together, mother-calf.
The data were statistically processed to develop statistical mean values. Student t test was applied to determine statistical significance between the parameters recorded.
Results and discussions
Maternal behavior is dominated by the perception of specific stimulus
through visual analyzer, smell and taste. A combination of these senses determine calf recognition by his mother. Maternal care includes feeding, voice call events, licking / trailing calf during and outside of lactation. The act of sucking itself was
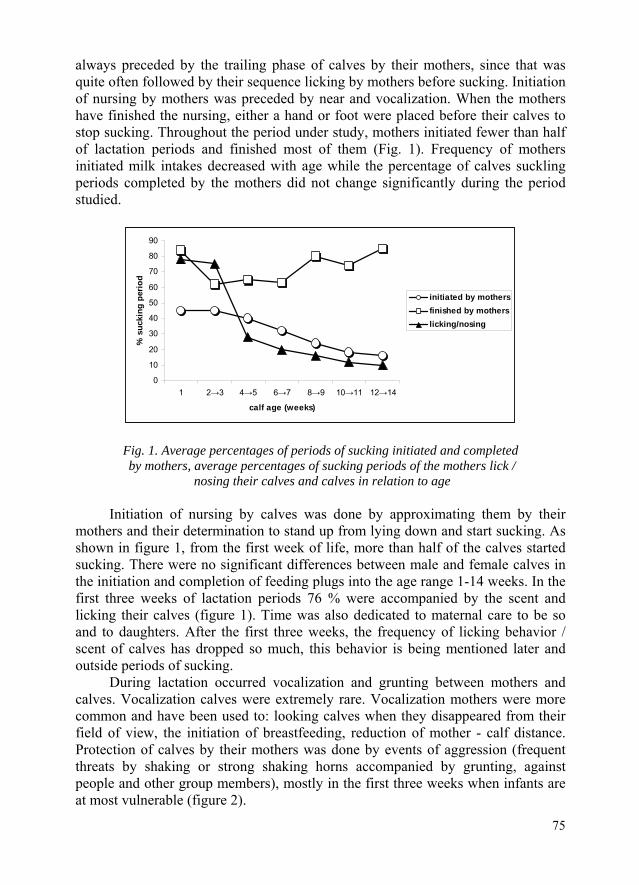
always preceded by the trailing phase of calves by their mothers, since that was quite often followed by their sequence licking by mothers before sucking. Initiation of nursing by mothers was preceded by near and vocalization. When the mothers have finished the nursing, either a hand or foot were placed before their calves to stop sucking. Throughout the period under study, mothers initiated fewer than half of lactation periods and finished most of them (Fig. 1). Frequency of mothers initiated milk intakes decreased with age while the percentage of calves suckling periods completed by the mothers did not change significantly during the period studied.
0
10
20
30
40
50
60
70
80
90
1 2→3 4→5 6→7 8→9 10→11 12→14
calf age (weeks)
% s
ucki
ng p
erio
d
initiated by mothersfinished by motherslicking/nosing
Fig. 1. Average percentages of periods of sucking initiated and completed by mothers, average percentages of sucking periods of the mothers lick /
nosing their calves and calves in relation to age Initiation of nursing by calves was done by approximating them by their
mothers and their determination to stand up from lying down and start sucking. As shown in figure 1, from the first week of life, more than half of the calves started sucking. There were no significant differences between male and female calves in the initiation and completion of feeding plugs into the age range 1-14 weeks. In the first three weeks of lactation periods 76 % were accompanied by the scent and licking their calves (figure 1). Time was also dedicated to maternal care to be so and to daughters. After the first three weeks, the frequency of licking behavior / scent of calves has dropped so much, this behavior is being mentioned later and outside periods of sucking.
During lactation occurred vocalization and grunting between mothers and calves. Vocalization calves were extremely rare. Vocalization mothers were more common and have been used to: looking calves when they disappeared from their field of view, the initiation of breastfeeding, reduction of mother - calf distance. Protection of calves by their mothers was done by events of aggression (frequent threats by shaking or strong shaking horns accompanied by grunting, against people and other group members), mostly in the first three weeks when infants are at most vulnerable (figure 2).
75
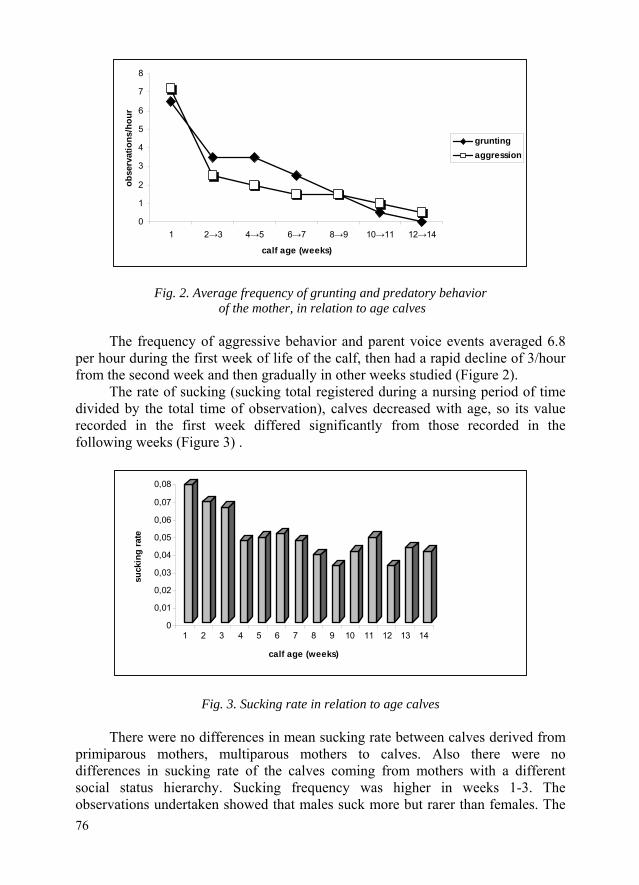
0
1
2
3
4
5
6
7
8
1 2→3 4→5 6→7 8→9 10→11 12→14
calf age (weeks)
obse
rvat
ions
/hou
rgruntingaggression
Fig. 2. Average frequency of grunting and predatory behavior of the mother, in relation to age calves
The frequency of aggressive behavior and parent voice events averaged 6.8
per hour during the first week of life of the calf, then had a rapid decline of 3/hour from the second week and then gradually in other weeks studied (Figure 2).
The rate of sucking (sucking total registered during a nursing period of time divided by the total time of observation), calves decreased with age, so its value recorded in the first week differed significantly from those recorded in the following weeks (Figure 3) .
0
0,01
0,02
0,03
0,04
0,05
0,06
0,07
0,08
suck
ing
rate
1 2 3 4 5 6 7 8 9 10 11 12 13 14
calf age (weeks)
Fig. 3. Sucking rate in relation to age calves There were no differences in mean sucking rate between calves derived from
primiparous mothers, multiparous mothers to calves. Also there were no differences in sucking rate of the calves coming from mothers with a different social status hierarchy. Sucking frequency was higher in weeks 1-3. The observations undertaken showed that males suck more but rarer than females. The
76

77
average duration of lactation periods of time (sucking rate) was 8 minutes for males and 5.5 minutes in females. The average duration of intervals between periods of lactation was 130 minutes and 98 minutes respectively. Even if the male and female calves duration and frequency are of various forms of nursing models, sucking rate differs between them. We can say that gender did not influence the rate of sucking calves.
Conclusions
1. Licking behavior / scent of the calf, grunting vocalization by the mother and
manifestations of aggression against intruders were most often seen in the first week of life of the calf, their frequency decreased with aging drastically over the calves.
2. Sucking is more frequent during the early life of the calf and lactation intervals between plugs were then shorter after the first week of life.
3. Duration and frequency of breast-feeding periods were different in males compared to females but the sex of calves did not influence the final sucking rate probably having as a result the consumption of milk.
References
1. Byers J. A. and Moodie J. D., 1990, Sex-specific Maternal Investment and
the Question of a Limit on Differential Provisioning in Ungulates, “Behavioural Ecology and Sociobiology” 26: 157–164.
2. Fisher D. O., Blomberg S. P., Owens I. P. F., 2002, Convergent Maternal Care Strategies in Ungulates and Macropods, “Evolution” 56: 167–176.
3. Hewison A. J. M. and Gaillard J.M., 1999, Successful Sons or Advantaged Daughters? “Tree” 14: 229–234.
4. Kojola I.,1998, Sex Ratio and Maternal Investment in Ungulates, “Oikos” 83: 567–573.

78 78

79
INTERRELATION BETWEEN THE CHEMICAL COMPOSITION OF POLLEN AND ITS CAPITALIZATION BY THE BEES FAMILIES
Monica PÂRVU1, Camelia DONICI1, Ioana ANDRONIE1, Violeta -Elena SIMION1,
Adriana AMFIM1
Abstract
The pollen is the only protein source of bees, providing necessary training and development of plastic substances young bees, their maturation and formation of body fat. The Biological value of pollen is determined by its chemical composition. The experiment was conducted with 12 families of bees, with different powers (low, medium and high), fed with pollen from three sources: lime, rapeseed and sunflower. The pollen was collected with specific equipment. Regarding chemical composition, the following values were recorded in crude protein: 27.56% for sunflower, rapeseed and 24.15% to 20.04% in lime. Regardless of the power family of bees, the most consumers (24 hours) were obtained from rapeseed, with 6 g at lower power families, 58 g at middle power families and 68 g at high power families. At the lower families, the pollen consumption was reduced with 50% in lime and 66.7% in sunflower. At the medium families, the pollen consumption was reduced with 13,7% in sunflower and 22.4% in sunflower. At the hight families, the pollen consumption was reduced with 11.7% in lime and 20.5% in sunflower. The pollen consumption is influenced by the chemical composition of pollen, it significantly decreased with an increase in crude protein content.
Keywords: honey bee, pollen sources
Introduction To obtain a high population of bees, which exploit higher the harvest early, it
must obtain a high quantity of juvenile and consequently a large number of nurse bees. The development is influenced by the use of bee honey, as energy source, and pollen consumption, the only protein source. Pollen consumption is closely correlated with the presence of juveniles in the larval stage in the family, causing the development of the hypofaringiene glands, responsible for secretion of royal jelly.
1 Faculty of Veterinary Medicine, Spiru Haret University, Bucharest, Romania.
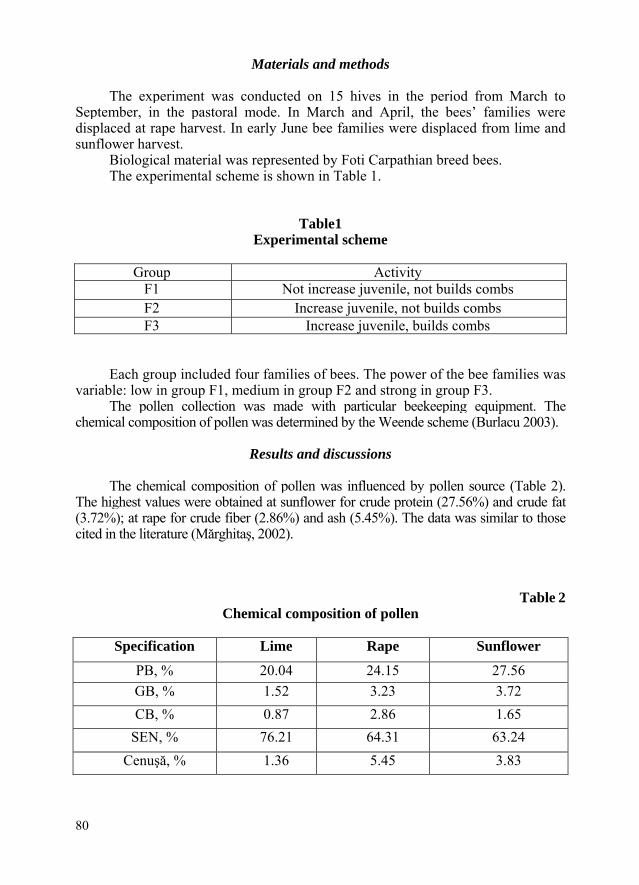
80
Materials and methods The experiment was conducted on 15 hives in the period from March to
September, in the pastoral mode. In March and April, the bees’ families were displaced at rape harvest. In early June bee families were displaced from lime and sunflower harvest.
Biological material was represented by Foti Carpathian breed bees.The experimental scheme is shown in Table 1.
Table1
Experimental scheme
Group Activity F1 Not increase juvenile, not builds combsF2 Increase juvenile, not builds combsF3 Increase juvenile, builds combs
Each group included four families of bees. The power of the bee families was
variable: low in group F1, medium in group F2 and strong in group F3.The pollen collection was made with particular beekeeping equipment. The
chemical composition of pollen was determined by the Weende scheme (Burlacu 2003).
Results and discussions The chemical composition of pollen was influenced by pollen source (Table 2).
The highest values were obtained at sunflower for crude protein (27.56%) and crude fat (3.72%); at rape for crude fiber (2.86%) and ash (5.45%). The data was similar to those cited in the literature (Mărghitaş, 2002).
Table 2 Chemical composition of pollen
Specification Lime Rape Sunflower
PB, % 20.04 24.15 27.56 GB, % 1.52 3.23 3.72 CB, % 0.87 2.86 1.65
SEN, % 76.21 64.31 63.24 Cenuşă, % 1.36 5.45 3.83
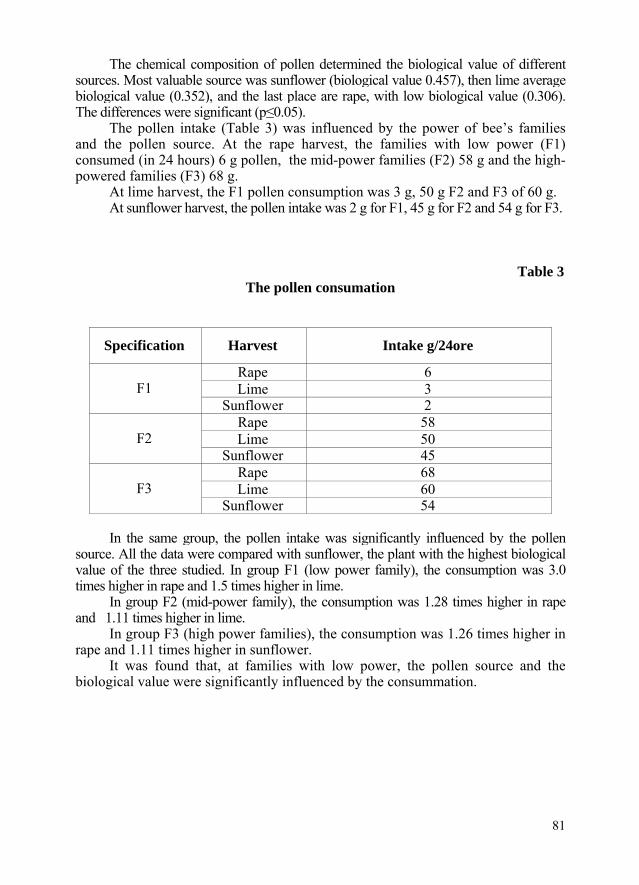
81
The chemical composition of pollen determined the biological value of different sources. Most valuable source was sunflower (biological value 0.457), then lime average biological value (0.352), and the last place are rape, with low biological value (0.306). The differences were significant (p≤0.05).
The pollen intake (Table 3) was influenced by the power of bee’s families and the pollen source. At the rape harvest, the families with low power (F1) consumed (in 24 hours) 6 g pollen, the mid-power families (F2) 58 g and the high-powered families (F3) 68 g.
At lime harvest, the F1 pollen consumption was 3 g, 50 g F2 and F3 of 60 g.At sunflower harvest, the pollen intake was 2 g for F1, 45 g for F2 and 54 g for F3.
Table 3
The pollen consumation
Specification Harvest Intake g/24ore
Rape 6 Lime 3 F1
Sunflower 2 Rape 58 Lime 50 F2
Sunflower 45 Rape 68 Lime 60 F3
Sunflower 54 In the same group, the pollen intake was significantly influenced by the pollen
source. All the data were compared with sunflower, the plant with the highest biological value of the three studied. In group F1 (low power family), the consumption was 3.0 times higher in rape and 1.5 times higher in lime.
In group F2 (mid-power family), the consumption was 1.28 times higher in rape and 1.11 times higher in lime.
In group F3 (high power families), the consumption was 1.26 times higher in rape and 1.11 times higher in sunflower.
It was found that, at families with low power, the pollen source and the biological value were significantly influenced by the consummation.

82
Conclusions 1. The pollen sources significantly influenced the chemical composition of
pollen and its biological value. 2. In the harvesting season, the pollen intake was influenced by the
development of the bee family, being raised in strong families. 3. The pollen sources with a lower biological value determined the increase
of the pollen intake.
References 1. Burlacu Gh., Valoarea nutritivă a nutreţurilor şi produselor animaliere,
Editura Coral Sanivet, Bucureşti, 2003. 2. Mărghitaş L. A., Albinele şi produsele lor, Editura Ceres, Bucureşti, 2002.
83
RESEARCH ON ALIMENTATION OF WORKING DOGS
Violeta-Elena SIMION1, F. MORTU1
Abstract
This research targeted the assessment of working dogs alimentation in terms of the food used and their quantities in the structure ration and calculating the food quantity required to cover standard daily nutritional needs and caloric intake, based on physical effort made.
The biological material used for the research consisted in 10 working dogs, from the German Shepherd breed, aged between 1, 6 and 9 years, the majority being between 2 and 5 years. They were observed and monitored during physical exercises, without being removed from their living environment. The calculation of the caloric consumption during exercises was made with a Dist T300 pedometer.
By calculating the food requirements at dogs with intense activity and multiplying maintenance requirements by 1, 8 factor I have obtained a 644 g of food necessary per day. The amount of food given daily at the dogs monitored in this research was of 654 g dry commercial feed per day, value that covers consumed calories in training and which is conform with the maintenance requirements multiplied by 1,8.
The pedometer can be considered an effective device to monitor the consumption of calories during the physical efforts done by service dogs, as much as the specific calculations.
Keywords: working dogs, alimentation, pedometer
Introduction Since the begining of XX century, the human perception on pets and in
particular on the dog, has changed. Both humans and the animals they live with have evolved and changed their food behaviour, physiological and digestive function depending on environmental factors and the society’s evolution.
Most dog breeds that exist, through various services they perform are useful to man. Depending on the use, dog breeds are divides into service and recreational breeds.
1 Faculty of Veterinary Medicine, Spiru Haret University, Bucharest.
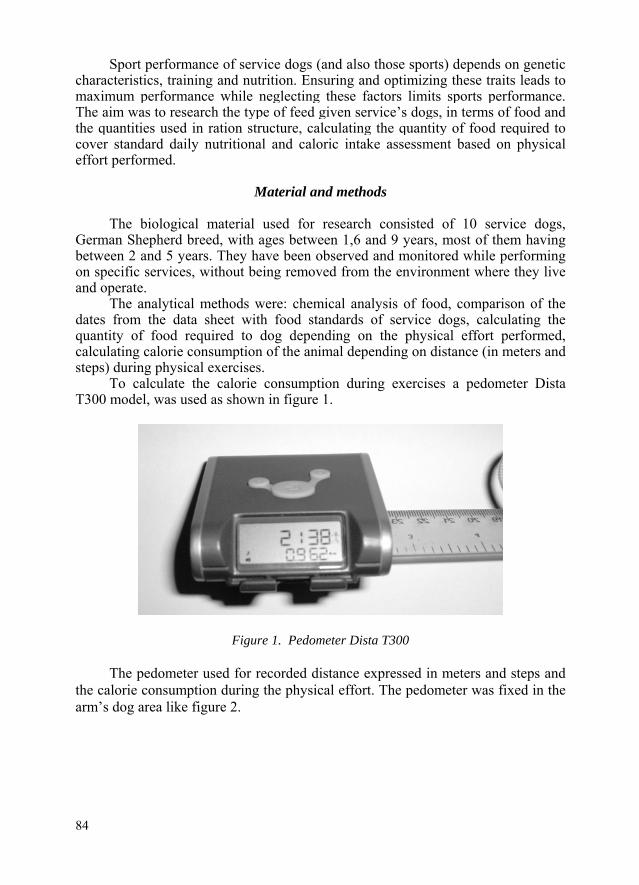
Sport performance of service dogs (and also those sports) depends on genetic characteristics, training and nutrition. Ensuring and optimizing these traits leads to maximum performance while neglecting these factors limits sports performance. The aim was to research the type of feed given service’s dogs, in terms of food and the quantities used in ration structure, calculating the quantity of food required to cover standard daily nutritional and caloric intake assessment based on physical effort performed.
Material and methods
The biological material used for research consisted of 10 service dogs,
German Shepherd breed, with ages between 1,6 and 9 years, most of them having between 2 and 5 years. They have been observed and monitored while performing on specific services, without being removed from the environment where they live and operate.
The analytical methods were: chemical analysis of food, comparison of the dates from the data sheet with food standards of service dogs, calculating the quantity of food required to dog depending on the physical effort performed, calculating calorie consumption of the animal depending on distance (in meters and steps) during physical exercises.
To calculate the calorie consumption during exercises a pedometer Dista T300 model, was used as shown in figure 1.
Figure 1. Pedometer Dista T300 The pedometer used for recorded distance expressed in meters and steps and
the calorie consumption during the physical effort. The pedometer was fixed in the arm’s dog area like figure 2.
84
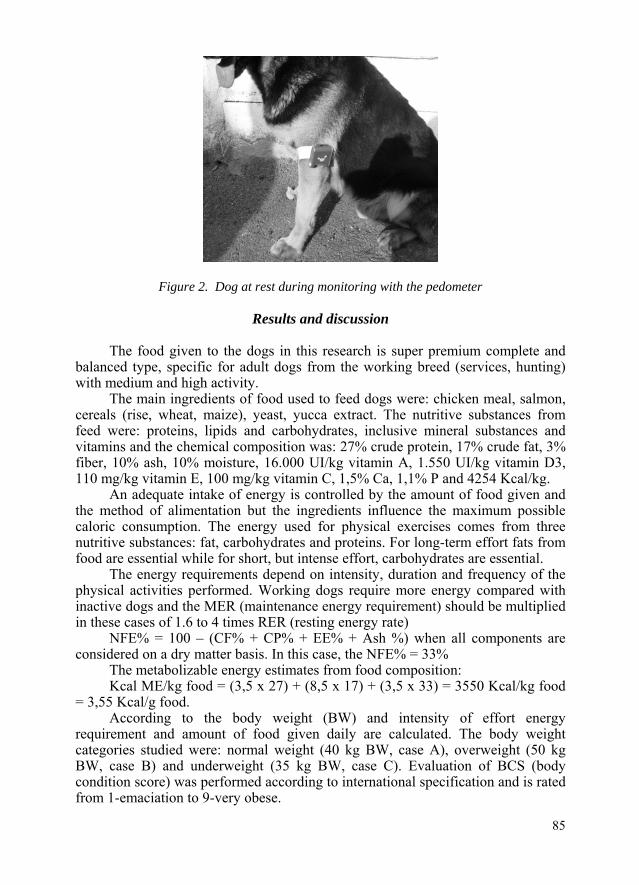
Figure 2. Dog at rest during monitoring with the pedometer
Results and discussion The food given to the dogs in this research is super premium complete and
balanced type, specific for adult dogs from the working breed (services, hunting) with medium and high activity.
The main ingredients of food used to feed dogs were: chicken meal, salmon, cereals (rise, wheat, maize), yeast, yucca extract. The nutritive substances from feed were: proteins, lipids and carbohydrates, inclusive mineral substances and vitamins and the chemical composition was: 27% crude protein, 17% crude fat, 3% fiber, 10% ash, 10% moisture, 16.000 UI/kg vitamin A, 1.550 UI/kg vitamin D3, 110 mg/kg vitamin E, 100 mg/kg vitamin C, 1,5% Ca, 1,1% P and 4254 Kcal/kg.
An adequate intake of energy is controlled by the amount of food given and the method of alimentation but the ingredients influence the maximum possible caloric consumption. The energy used for physical exercises comes from three nutritive substances: fat, carbohydrates and proteins. For long-term effort fats from food are essential while for short, but intense effort, carbohydrates are essential.
The energy requirements depend on intensity, duration and frequency of the physical activities performed. Working dogs require more energy compared with inactive dogs and the MER (maintenance energy requirement) should be multiplied in these cases of 1.6 to 4 times RER (resting energy rate)
NFE% = 100 – (CF% + CP% + EE% + Ash %) when all components are considered on a dry matter basis. In this case, the NFE% = 33%
The metabolizable energy estimates from food composition: Kcal ME/kg food = (3,5 x 27) + (8,5 x 17) + (3,5 x 33) = 3550 Kcal/kg food
= 3,55 Kcal/g food. According to the body weight (BW) and intensity of effort energy
requirement and amount of food given daily are calculated. The body weight categories studied were: normal weight (40 kg BW, case A), overweight (50 kg BW, case B) and underweight (35 kg BW, case C). Evaluation of BCS (body condition score) was performed according to international specification and is rated from 1-emaciation to 9-very obese.
85
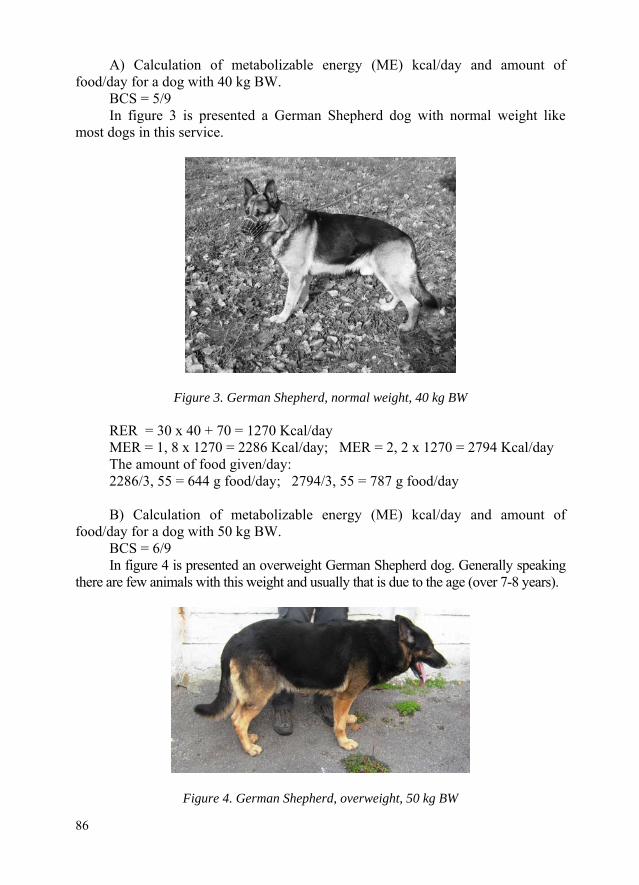
A) Calculation of metabolizable energy (ME) kcal/day and amount of food/day for a dog with 40 kg BW.
BCS = 5/9 In figure 3 is presented a German Shepherd dog with normal weight like
most dogs in this service.
Figure 3. German Shepherd, normal weight, 40 kg BW RER = 30 x 40 + 70 = 1270 Kcal/day MER = 1, 8 x 1270 = 2286 Kcal/day; MER = 2, 2 x 1270 = 2794 Kcal/day The amount of food given/day: 2286/3, 55 = 644 g food/day; 2794/3, 55 = 787 g food/day B) Calculation of metabolizable energy (ME) kcal/day and amount of
food/day for a dog with 50 kg BW. BCS = 6/9 In figure 4 is presented an overweight German Shepherd dog. Generally speaking
there are few animals with this weight and usually that is due to the age (over 7-8 years).
Figure 4. German Shepherd, overweight, 50 kg BW
86

RER = 30 x 50 + 70 = 1570 Kcal/day MER = 1, 8 x 1270 = 2826 Kcal/day; MER = 2, 2 x 1270 = 3454 Kcal/day The amount of food given/day: 2826/3, 55 = 796 g aliment/day; 3454/3, 55 = 973 g aliment/day B) Calculation of metabolizable energy (ME) kcal/day and amount of
food/day for a dog with 35 kg BW. BCS = 4/9 In figure 5 is presents a dog of underweight category, German Shepherd
breed. This weight is due to the age of these dogs (under 2 years) and not under nourishment.
Figure 5. German Shepherd, underweight, 35 kg BW RER = 30 x 35 + 70 = 1120 Kcal/day MER = 1, 8 x 1120 = 2016 Kcal/day; NER = 2, 2 x 1120 = 2464 Kcal/day The amount of food given/day: 2016/3, 55 = 568 g food/day; 2464/3, 55 = 694 g food/day. Exercises are divided in three categories: sprint – high intensity physical
activity which can be done less than two minutes; intermediate – physical activity which lasts from several minutes to several hours and endurance – physical activity that lasts several hours.
The amount of exercises performed can be quantified in hours per day or hours per week and frequency in daily activities, weekly activities, and seasonal activities. Dogs monitored in this research are involved in an intermediate activity.
The clinical examination revealed the animal’s health condition, the musculoskeletal apparatus condition, the hydratation level, cardio respiratory function and physical condition. We also assessed the BCS to determine the nutritional intake. An index of 3/5 is considered normal for sport and services dog categories.
87
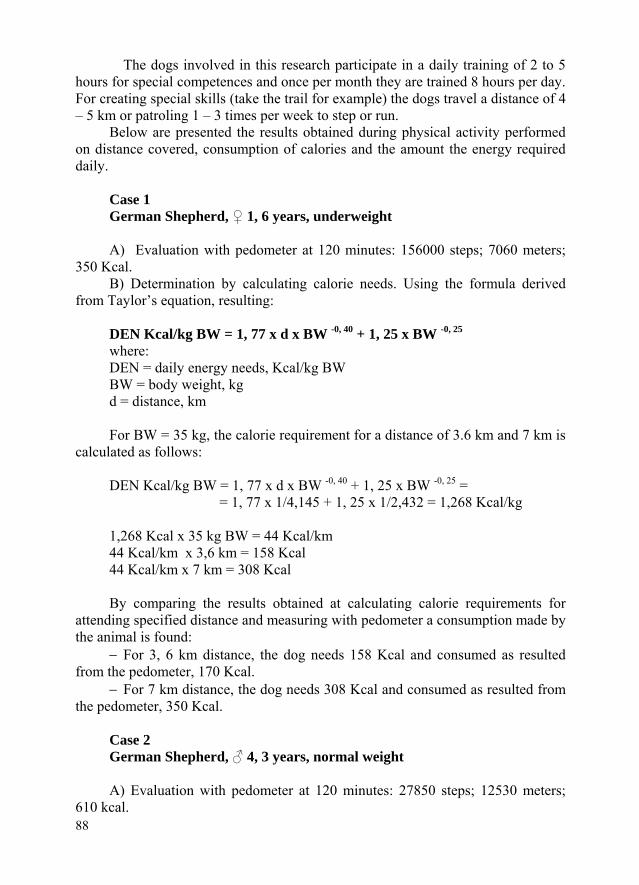
88
The dogs involved in this research participate in a daily training of 2 to 5 hours for special competences and once per month they are trained 8 hours per day. For creating special skills (take the trail for example) the dogs travel a distance of 4 – 5 km or patroling 1 – 3 times per week to step or run.
Below are presented the results obtained during physical activity performed on distance covered, consumption of calories and the amount the energy required daily.
Case 1 German Shepherd, ♀ 1, 6 years, underweight A) Evaluation with pedometer at 120 minutes: 156000 steps; 7060 meters;
350 Kcal. B) Determination by calculating calorie needs. Using the formula derived
from Taylor’s equation, resulting: DEN Kcal/kg BW = 1, 77 x d x BW -0, 40 + 1, 25 x BW -0, 25
where: DEN = daily energy needs, Kcal/kg BW BW = body weight, kg d = distance, km For BW = 35 kg, the calorie requirement for a distance of 3.6 km and 7 km is
calculated as follows: DEN Kcal/kg BW = 1, 77 x d x BW -0, 40 + 1, 25 x BW -0, 25 = = 1, 77 x 1/4,145 + 1, 25 x 1/2,432 = 1,268 Kcal/kg 1,268 Kcal x 35 kg BW = 44 Kcal/km 44 Kcal/km x 3,6 km = 158 Kcal 44 Kcal/km x 7 km = 308 Kcal By comparing the results obtained at calculating calorie requirements for
attending specified distance and measuring with pedometer a consumption made by the animal is found:
− For 3, 6 km distance, the dog needs 158 Kcal and consumed as resulted from the pedometer, 170 Kcal.
− For 7 km distance, the dog needs 308 Kcal and consumed as resulted from the pedometer, 350 Kcal.
Case 2 German Shepherd, ♂ 4, 3 years, normal weight A) Evaluation with pedometer at 120 minutes: 27850 steps; 12530 meters;
610 kcal.
89
B) Determination by calculating calorie needs For BW = 40 kg, the calorie requirement for attenting 12, 53 km is calculated
as follows: DEN Kcal/kg BW = 1, 77 x d x BW -0, 40 + 1, 25 x BW -0, 25 = = 1, 77 x 1/4,373 + 1, 25 x 1/2,514 = 0,899 Kcal/kg 0,899 Kcal x 40 kg BW = 35, 96 Kcal/km 35,96 Kcal/km x 12,53 km = 450 Kcal By comparing the results obtained at calculating calorie requirements for
attending specified distance and measuring with pedometer a consumption made by the animal is found:
− For 12.53 km distance, the dog needs 450 Kcal and consumed as resulted from the pedometer, 610 Kcal.
Case 3 German Shepherd, ♂ 9 years, overweight A) Evaluation with pedometer at 60 minutes: 15400 steps; 6930 meters; 330
kcal. B) Determination by calculating calorie needs. For BW = 50 kg, the calorie requirement for attending distance 6, 9 km is
calculated as follows: DEN Kcal/kg BW = 1, 77 x d x BW -0, 40 + 1, 25 x BW -0, 25 = = 1, 77 x 1/4,781 + 1, 25 x 1/2,659 = 0,839 Kcal/kg 0,839 Kcal x 50 kg BW = 41, 95 Kcal/km 41,95 Kcal/km x 6,9 km = 289 Kcal By comparing the results obtained at calculating calorie requirements for
attending specified distance and measuring with pedometer a consumption made by the animal is found:
− For 6.9 km distance, the dog needs 289 Kcal and consumed as resulted from the pedometer, 330 Kcal.
From the analysis of the results is noted that although there are differences
between the requirements calculated and the result obtained by pedometer, they all maintain equal in all the analyzed cases. This difference may be due to the pedometer Dista T300 which is a device for human use.
90
Conclusions 1. The commercial dry food given to service dogs has the following chemical
composition: 27% crude protein, 17% crude fat, 3% fiber, 10% ash, 10% moisture, 16.000 UI/kg vitamin A, 1.550 UI/kg vitamin D3, 110 mg/kg vitamin E, 100 mg/kg vitamin C, 1,5% Ca, 1,1% P and 4254 Kcal/kg that is normal to the type of activities.
2. At German Shepherd with age over 18 months years and a 40 kg body weight the amount of food that has been given daily, according to calculations, is 644 g, a quantity that provides 2783 kcal/day.
3. At German Shepherd with an average weight of 50 kg BW, the amount of food that has been given daily, according to calculations, is 796 g, a quantity that provides 2930 kcal/day.
4. At German Shepherd with age between 8 – 18 months and the weight of 35 Kg BW, the amount of food that has been given daily, according to calculations, is 568 g, a quantity that provides 2565 kcal/day.
5. The average caloric consumption of dogs monitored in this research was of 593 Kcal which would require an additional 167 g food per day at 529 g food/day for maintenance resulting in a total 696 g (average 40 kg BW, 3, 55 kcal/g dry foods).
6. The amount of food given to the dogs in this research was 654 g dry food/day covering the caloric value resulted by multiplying the maintenance requirement with 1.8 and is consistent with the values of pedometer.
References
1. Agar S., 2004, Small Animal Nutrition, MPG Books Ltd., Bodmin,
Cornwall, Great Britain. 2. Buffington T., Cheryl Holloway, Sarah Abood, 2004, Manual of
Veterinary Dietetics, Elsevier Saunders, U.S.A. 3. Gradjean D., Paragon B-M., Gradjean R., Rationnement alimentaire et
prevention chez le chien, Le Point Veterinaire, 1986, 18:519-524. 4. Hand M., C. Thatcher, Rebecca Remillard, Philip Roudebush, 2005,
Nutrition clinique des animaux de companie, 4 ème Edition, Mark, Morris Institute. 5. Hirakawa C., Daristotle C., 2000, Canine and Feline Nutrition, Mosby
Inc., A harcourt Health Sciences Company, U.S.A.
91
CLINIC SECTION
THE CYTOLOGIC DIAGNOSIS OF CANINE PROSTATIC DISORDERS
V. ANDRONIE1, T. PETRUŢ1, Ioana ANDRONIE1,
Ş. ZAMFIRESCU2, T. STOIAN2
Abstract
Canine prostatic disease is commonly investigated using cytologic techniques, especially now that ultrasound-guided fine needle cell aspiration (US-FNA) is widely available. Few studies, however, have evaluated the diagnostic accuracy of prostatic cytology.The purpose of this study was to evaluate the usefulness of cytologic investigation of prostatic disease using US-FNA and other methods in comparison with histopathologic diagnosis.Cytologic and histopathologic specimens of prostate or paraprostatic tissue from 25 adult dogs were retrospectively evaluated. Cytologic samples were obtained by US-FNA, prostatic massage, or direct impression smears or aspirates of tissue at surgery. Histopathologic sections were obtained from tissue collected by biopsy or at necropsy. Cytologic diagnoses were categorized as nondiagnostic; cyst; squamous metaplasia; inflammation; benign prostatic hyperplasia (BPH); inflammation and BPH; inflammation, BPH and neoplasia; inflammation and neoplasia; neoplasia. Cytologic diagnoses agreed with final histologic diagnoses in 19 of the 25 cases (76%). Four samples obtained by US-FNA and 2 sample obtained by prostatic massage and wash had discordant results.The results of this study suggest strong agreement between cytologic and histopathologic diagnoses for prostatic conditions. Discordance in results obtained by US-FNA usually was the result of the pathologic process rather than a failure to obtain an appropriate sample.
Keywords: Canine, cytopathology, fine needle aspiration, prostate, ultrasound-
guided biopsy
1Faculty of Veterinary Medicine, Spiru Haret University, Bucharest, Romania. 2 Veterinary Clinic Innovet.
92
Introduction Prostatic disorders are common in middle-aged and older sexually intact male
dogs and have been categorized as hyperplasia, cyst, inflammation, primary and metastatic neoplasia, and squamous metaplasia. The diagnosis of prostatic disease in the past has been problematic and relied primarily on prostatic fluid analysis, commonly collected through prostatic massage, blind percutaneous fine needle aspirate, and radiographic imaging. It has been suggested that the relatively new technique of ultrasound-guided fine needle cell aspiration (US-FNA) and biopsy of the prostate improves the quality of diagnosis, by more accurately identifying and sampling diseased areas of tissue.
Histopathologic diagnosis of prostatic disease remains the gold standard because tissue architecture as well as cell detail can be assessed. However, cytology has several advantages over histopathology for the investigation of prostatic disease. Cytology is a less invasive technique and most often does not require general anesthesia. It is also cheaper, easier, and less labor intensive to prepare cytologic specimens, and results are obtained in a shorter time period. In addition, because of the thin monolayer obtained with cytologic smears, it is possible to better assess cell detail and the presence of etiologic agents. Consequently, the strengths and limitations of cytology complement those of histopathology. In one study in which ultrasound-guidance was not used to obtain samples, cytologic diagnosis of prostatic disease was shown to correlate well with histopathologic and clinical diagnoses. This implied that clinicians could rely on the cytologic diagnosis when a biopsy could not be obtained. We hypothesized that US-FNA might further improve the accuracy of cytologic diagnosis of prostatic disease. The aim of this study was to evaluate the accuracy of cytology in the diagnosis of prostatic disorders using US-FNA as well as other methods of sample collection, in comparison with histopathologic diagnoses.
Materials and method
Cytologic and histopathologic specimens of prostatic or paraprostatic tissue
from adult dogs were retrospectively evaluated.Was searched for prostatic samples examined from 2004 to 2009 from dogs that also had histopathologic (biopsy or necropsy) samples submitted.
Relevant clinical signs, age, castration status, breed, ultrasound results, and the method of collection of cytologic and histologic samples were recorded. Cyto-logic preparations had been air dried and stained with Diff-Quik.Tissues for histologic examination had been fixed in formalin, processed routinely, and stained with hematoxylin and eosin (H&E). Cytologic examinations and diagnoses were made by the authors at the time of sample submission. Histopathologic sections originally were examined by several pathol-ogists; for the purpose of this study, all slides were re-reviewed by the authors through a blind procedure to ensure a common gold standard.

93
Results and discussion Of canine prostatic cytology samples during the 4-year period, 25 also had
prostatic biopsy and/ or necropsy results. All biopsies were obtained either concurrently or within 7 days of cytologic sampling. Necropsy examinations were done within 5 months of cytology sample collection. One dog had both biopsy and necropsy results. The dogs ranged from 6 to 14 years old (median 10 years) and 8 of 25 dogs (32%) were castrated (Table 1). All dogs had diffuse or irregular prostatomegaly or paraprostatic enlargement on ultrasound examination and/or digital palpation.
Table 1
Signalment clinical findings, cytologic and histopathologic results in dogs with prostatic diseases
Breed/ Age
(y) Clinical Signs Cytologic
Technique Cytologic Diagnosis
Histopa thologic
Technique
Histopathologic Diagnosis
German Shepherd
Chronic weight loss
US-FNA* BPH Needle biopsy
BPH
Rottweiler Abdominal pain US-FNA BPH Needle biopsy
BPH
Rottweiler Dyschezia Biopsy imprint
BPH Needle biopsy
BPH
German Shepherd
Hematuria, tenesmus
US-FNA BPH Needle biopsy
BPH
Border Collie Polyuria, incontinence
US-FNA BPH Incisional biopsy
BPH
Akita
Hematuria US-FNA BPH, inflammation
Needle biopsy
BPH, prostatitis
Rottweiler Vomiting, inappetence, weight loss
US-FNA BPH, inflammation
Excisional biopsy
BPH, TCC invading paraprostatic fat
German Shepherd
Hematuria Intra-operative
FNA
BPH, fibroplasia,
inflammation
Incisional biopsy
BPH, chronic prostatitis
German Shepherd
Anuria, dyschezia, vomiting
US-FNA BPH, inflammation with possible
TCC
Incisional biopsy,
necropsy
Active-chronic prostatitis, TCCy
German Shepherd Castrated
Dyschezia, incontinence
hematuria
US-FNA Inflammation Incisional biopsy
Chronic inflammation with
mild BPH Border Collie
Castrated Stranguria Prostatic
massage/wash Inflammation with possible
carcinoma
Necropsy ACC, active-chronic prostatitis
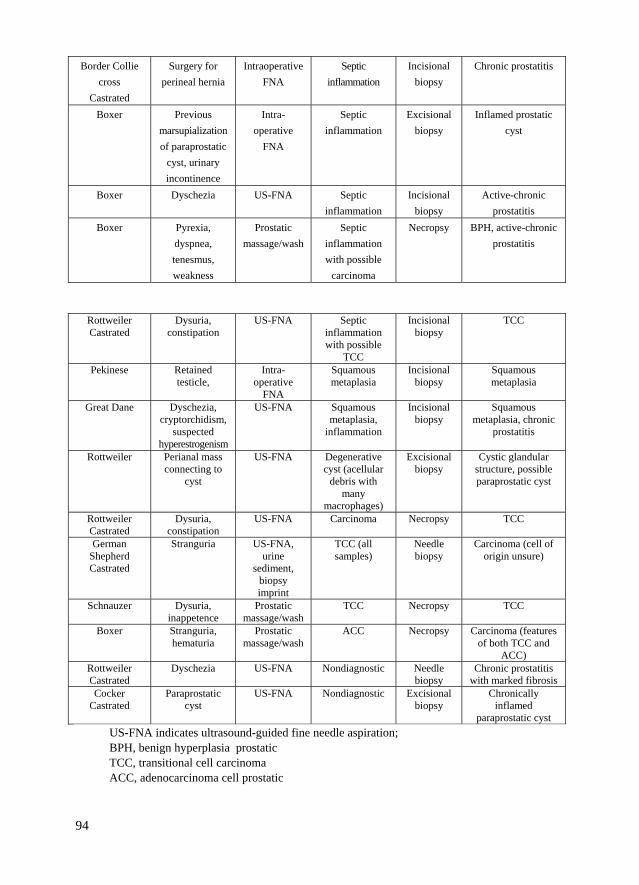
94
Border Collie cross
Castrated
Surgery for perineal hernia
Intraoperative FNA
Septic inflammation
Incisional biopsy
Chronic prostatitis
Boxer Previous marsupialization of paraprostatic
cyst, urinary incontinence
Intra-operative
FNA
Septic inflammation
Excisional biopsy
Inflamed prostatic cyst
Boxer Dyschezia US-FNA Septic inflammation
Incisional biopsy
Active-chronic prostatitis
Boxer Pyrexia, dyspnea, tenesmus, weakness
Prostatic massage/wash
Septic inflammation with possible
carcinoma
Necropsy BPH, active-chronic prostatitis
Rottweiler Castrated
Dysuria, constipation
US-FNA Septic inflammation with possible
TCC
Incisional biopsy
TCC
Pekinese Retained testicle,
Intra-operative
FNA
Squamous metaplasia
Incisional biopsy
Squamous metaplasia
Great Dane Dyschezia, cryptorchidism,
suspected hyperestrogenism
US-FNA Squamous metaplasia,
inflammation
Incisional biopsy
Squamous metaplasia, chronic
prostatitis
Rottweiler Perianal mass connecting to
cyst
US-FNA Degenerative cyst (acellular
debris with many
macrophages)
Excisional biopsy
Cystic glandular structure, possible paraprostatic cyst
Rottweiler Castrated
Dysuria, constipation
US-FNA Carcinoma Necropsy TCC
German Shepherd Castrated
Stranguria US-FNA, urine
sediment, biopsy imprint
TCC (all samples)
Needle biopsy
Carcinoma (cell of origin unsure)
Schnauzer Dysuria, inappetence
Prostatic massage/wash
TCC Necropsy TCC
Boxer Stranguria, hematuria
Prostatic massage/wash
ACC Necropsy Carcinoma (features of both TCC and
ACC) Rottweiler Castrated
Dyschezia US-FNA Nondiagnostic Needle biopsy
Chronic prostatitis with marked fibrosis
Cocker Castrated
Paraprostatic cyst
US-FNA Nondiagnostic Excisional biopsy
Chronically inflamed
paraprostatic cyst US-FNA indicates ultrasound-guided fine needle aspiration; BPH, benign hyperplasia prostatic TCC, transitional cell carcinoma ACC, adenocarcinoma cell prostatic
95
Cytologic samples were obtained by US-FNA, by intraoperative fine needle cell aspiration, by prostatic massage and wash, by imprinting a biopsy specimen, and by sedimentation of urine.Histopathologic sections were made from tissue collected by percutaneous ultrasound-guided needle biopsy or incisional or excisional biopsy at surgery or at necropsy.
Cytologic diagnoses were categorized as nondiagnostic; cyst; squamous metaplasia; inflammation; benign prostatic hyperplasia (BPH); inflammation and BPH; inflammation, BPH, and neoplasia ; inflammation and neoplasia ; and neoplasia. Overall, 12 samples had inflammation; of these, 5 were found to be septic on the basis of cytologic evaluation and bacterial culture. Both dogs with prostatic squamous metaplasia had Sertoli cell tumors.
Cytologic diagnoses agreed with histologic diagnoses in 20 of the 25 cases. Cytology was a more sensitive method than histology for the detec-tion of sepsis, since organisms were not observed in any histologic sections. This was likely because of the thickness of histologic sections, which may impede visualization of organisms, even at high magnification. Even with the application of a modified Gram's stain to histologic sections, bacteria, especially gram-negative forms, may be difficult to identify unless in large clusters.
Of the 5 cases in which cytologic findings did not agree exactly with the histologic diagnosis, 4 samples were obtained by US-FNA, and 1 was obtained by prostatic massage and wash. Two samples obtained by US-FNA were inconclusive due to low cellularity. In one case , US-FNA failed to identify mild BPH. In 1 case, US-FNA failed to detect malignancy. Cytologic examination in case accurately detected BPH, however, small pockets of TCC cells in the paraprostatic fat were found only on histopathologic examination. In the discordant sample obtained by prostatic massage , carcinoma with septic inflammation was suggested, but histologic examination at necropsy revealed only BPH with inflammation, although dysplastic epithelium was noted. Cytologic examination in case 9 suggested possible TCC; although TCC was not detected on histopathologic examination of an incisional biopsy, necropsy findings 4 months later revealed TCC in both the prostate and the sublumbar lymph nodes. Thus, although discordant with biopsy results, cytologic results in this case were concordant with necropsy findings. It is possible the cytologic sample was collected from several affected areas in the prostate, increasing the likelihood of detecting carcinoma cells, compared with a more focal area of tissue collected by incisional biopsy.
Seven samples were diagnosed by both cytology and histopathology as malignant neoplasia. Four of these were diagnosed by histopathology as transitional cell carcinoma (TCC), 1 as adenocarcinoma (ACC), and 2 as carcinomas of uncertain origin. By cytologic examination, 3 of 4 cases of TCC were identified as originating from transitional rather than glandular epithelium based largely on the presence of sheets of cells, a variable proportion of which contained prominent intracytoplasmic red, granular inclusions. Although these inclusions are not unique to neoplastic transitional cells, they were observed in this study only in TCCs, and not in the sample diagnosed histologically as ACC. These results suggest that cytologic evaluation can be used to accurately differentiate TCC from ACC based on features of urothelial cells, although additional studies are needed to confirm this. TCC is recognized as a distinct type of prostatic
96
neoplasm, however, the origin of prostatic neoplasms in general is poorly understood and confusion may result when features of both ACC and TCC occur in histopathologic sections of one tumor.
The results of this study indicate strong agreement between cytologic and histopathologic diagnoses for prostatic conditions. Limitations of cytologic diagnosis were associated primarily with the type of pathologic process. For example, poor cellularity was associated with aspiration of fibrotic tissue, inflammation masked mild BPH, and dysplastic epithelium was mis-interpreted as neoplastic epithelium. In 1 case, the lack of a representative sample led to failure to identify neoplasia in paraprostatic fat. It has been suggested that ultrasound visualization of the prostate allows more accurate identification and sampling of areas of pathology within the prostate. In this study, a similar level of concordance was found for samples obtained by US-FNA as with other techniques. The good agreement between prostatic massage/wash samples and histologic diagnosis was unexpected, because cytologic preparations obtained by catheterization typically yield a mixed population of urothelial cells, which can hinder the diagnosis of neoplasia or squamous metaplasia. Because of the small sample size in this study, however, further evaluation of US-FNA as compared with prostatic massage and other techniques for the cytologic diagnosis of prostatic disorders is warranted.
Conclusions
1. The results of this study suggest strong agreement between cytologic and
histopathologic diagnoses for prostatic conditions. 2. Discordance in results obtained by US-FNA usually was the result of the
pathologic process rather than a failure to obtain an appropriate sample.
References 1. Olsen PN, Wrigley RH, Thrall MA, et al., Disorders of the Canine
Prostate Gland: Pathogenesis, Diagnosis, and Medical Therapy, Comp Cont Ed Pract Vet. 1987; 9:613-623.
2. Thrall MA, Olsen PN, Freemyer FG., Cytologic Diagnosis of Canine Prostatic Disease, J Am Anim Hosp Assoc. 1985; 21:95-102.
3. Ling GV., Diagnostic Methods in Prostatic Disease. In: Ling GV, ed. Lower Urinary Tract Diseases of Dogs and Cats. St Louis, MO: Mosby; 1995:49-54.
4. LeRoy BE., The Cellular Challenges of Canine Prostate Carcinoma: Challenges and Opportunities, Vet Cancer Soc Newsletter. 2003:27:4-5.
5. Meinkoth JH, Cowell RL. - Recognition of Basic Cell Types and Criteria of Malignancy, Vet Clin North Am Small Anim 2002; 32: 1209-1235.
6. Tyler RD, Cowell RL, Baldwin CJ, et al, Introduction. In: Cowell RL, Tyler RD, Meinkoth JH, eds. Diagnostic Cytology and Hematology of the Dog and Cat, 2nd ed. St Louis, MO: Mosby; 1999:1-19.
7. Canfield PJ, Martin PA., Veterinary Cytology. Sydney, Australia: Post Graduate Foundation in Veterinary Science; 1998:153.
97
SERUM BIOCHEMICAL AND HEMATOLOGICAL REACTIONS DUE TO THE ACTIONS OF BACTERIAL ENDOTOXINS FROM THE SHELTERS´
AIR IN PIGS
Elena-Luiza BĂDIC1, N. AVRAM1
Abstract Studies were developed in two pigs farms (A and B) equiped with different control systems of microclimate (computerized in farm A and mechanized in farm B). In the farm B bacterial endotoxin concentrations were in mean two times higher than in the farm A which generated, among other things paraclinical reactions. In order to established biochemical and hematological reactions 20 blood samples were sampled in both farms from the pregnant sows and lactating sows. Following parameters were determinated by automatically methods: glycemia, total cholesterol, transaminases (GOT, GPT), urea, creatinin, number of erythrocyte, hemoglobin, packed cell volume, number of leucocyte, number of thrombocyte. The most important reactions recorded in all tested cathegories in the farm B, comparative with the farm A were : hyperglycemia, hipercholesterolemia, increases of GPT and GOT activities, hyperazotemia, hypercreatininemia and leucocytose. Recorded, reactions were atributed of synergic actions of bacterial endotoxins and shelters´ air bacteria concentrations on the liver, kidneys, hematopoietic and imunologic systems of pigs.
Introduction
Present in the cell wall of Gram-negative bacterial pyrogens carries negative actions on human and animal health (3,4,5,6). Bacterial pyrogens are represented by a macromolecular complex composed of polysaccharides and lipids-LPS (5,6,8,10). Some studies have been conducted on the sources and levels of air bacterial pyrogens pig shelters abroad (6,7,11) as in our country (2.9). Investigations on the effect of bacterial pyrogens on the values of some paraclinical pigs were insufficiently completed to date (4,6,10). The aim of the current work was to study the haematological and biochemical reactions to sow serum, therefore the action of bacterial pyrogens and germs of air shelters.
1 Faculty of Veterinary Medicine, Spiru Haret University, Bucharest, Romania.
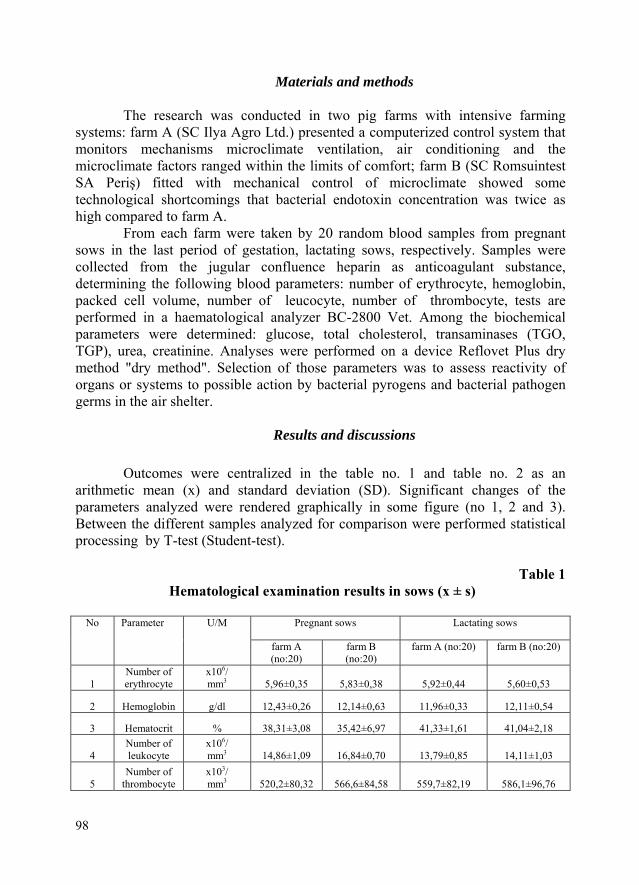
98
Materials and methods
The research was conducted in two pig farms with intensive farming
systems: farm A (SC Ilya Agro Ltd.) presented a computerized control system that monitors mechanisms microclimate ventilation, air conditioning and the microclimate factors ranged within the limits of comfort; farm B (SC Romsuintest SA Periş) fitted with mechanical control of microclimate showed some technological shortcomings that bacterial endotoxin concentration was twice as high compared to farm A.
From each farm were taken by 20 random blood samples from pregnant sows in the last period of gestation, lactating sows, respectively. Samples were collected from the jugular confluence heparin as anticoagulant substance, determining the following blood parameters: number of erythrocyte, hemoglobin, packed cell volume, number of leucocyte, number of thrombocyte, tests are performed in a haematological analyzer BC-2800 Vet. Among the biochemical parameters were determined: glucose, total cholesterol, transaminases (TGO, TGP), urea, creatinine. Analyses were performed on a device Reflovet Plus dry method "dry method". Selection of those parameters was to assess reactivity of organs or systems to possible action by bacterial pyrogens and bacterial pathogen germs in the air shelter.
Results and discussions
Outcomes were centralized in the table no. 1 and table no. 2 as an arithmetic mean (x) and standard deviation (SD). Significant changes of the parameters analyzed were rendered graphically in some figure (no 1, 2 and 3). Between the different samples analyzed for comparison were performed statistical processing by T-test (Student-test).
Table 1
Hematological examination results in sows (x ± s)
Pregnant sows Lactating sowsNo Parameter U/M
farm A (no:20)
farm B (no:20)
farm A (no:20) farm B (no:20)
1 Number of erythrocyte
x106/ mm3 5,96±0,35 5,83±0,38 5,92±0,44 5,60±0,53
2 Hemoglobin g/dl 12,43±0,26 12,14±0,63 11,96±0,33 12,11±0,54
3 Hematocrit % 38,31±3,08 35,42±6,97 41,33±1,61 41,04±2,18
4 Number of leukocyte
x106/ mm3 14,86±1,09 16,84±0,70 13,79±0,85 14,11±1,03
5 Number of
thrombocyte x103/ mm3 520,2±80,32 566,6±84,58 559,7±82,19 586,1±96,76

99
Interpretations of results registered in animals between farms and between
different categories of sows, pregnant, lactating showed that the majority of parameters, statistically significant differences in value attributable to the action of bacterial pyrogens and pathogenic bacterial flora in shelters on the function of vital organs - liver, kidney, hematopoietic and immune system. Blood analysis revealed that the majority of haematological parameters showed no significant differences between groups of farm from those in farm B. The number of erythrocytes, hemoglobin, hematocrit and platelet count showed similar values. A slight increase in hematocrit value was found when compared to the pregnant lactating sows on both farms.
Instead, the WBC count was found higher in groups of sows from farm B, in particular pregnant, that 16 840 ± 700/mm³ to 14 860³ ± 1009/mm³ farm, the differences are significant at p <0.01 . Leukocytosis registered pathogenic factors can be attributed to the influence of farm B (bacterial endotoxins, germs from de air) in stimulating leucocyte series.
Glucose values are generally influenced by energy and protein intake of the ration substances, use and metabolism, but also the health status of pigs (1). Data obtained showed that the sows from farm B compared with those of farm A revealed hyperglycemia (significant difference p <0.01 (table no. 2, figure no. 1).
Table 2 Biochemical examination result sows (x ± s)
Pregnant sows Lactating sows
No Parameter U/M farm A (no:20)
farm B (no:20)
farm A (no:20)
farm B (no:20)
1 Glucosis mg/dl 58,96±2,82 66,87±4,35 53,12±3,97 57,18±2,82
2 Cholesterol mg/dl 76,03±2,46 80,15±2,69 92,79±2,89 98,5±5,91
3 TGP U/l 13,71±2,29 23,12±4,86 16,98±1,72 22,09±5,71
4 TGO U/l 19,68±1,56 22,53±2,99 18,30±1,36 22,6±2,74
5 Urea mg/dl 24,9±3,45 29,64±5,71 23,27±2,76 32,49±5,60
6 Creatinine mg/dl 1,45±0,23 1,74±0,13 1,83±0,18 2,35±0,28
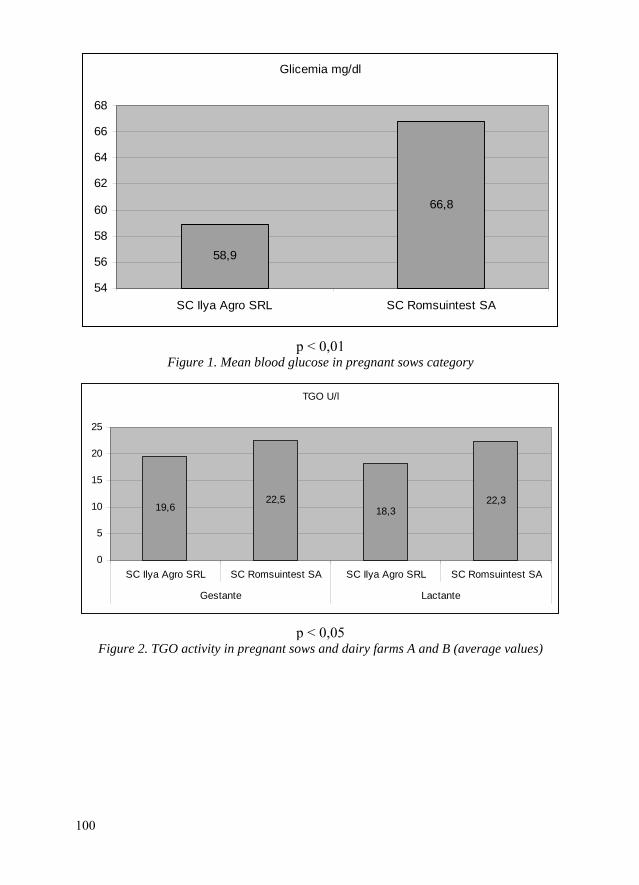
Glicemia mg/dl
58,9
66,8
54
56
58
60
62
64
66
68
SC Ilya Agro SRL SC Romsuintest SA
p < 0,01
Figure 1. Mean blood glucose in pregnant sows category
TGO U/l
19,622,5
18,322,3
0
5
10
15
20
25
SC Ilya Agro SRL SC Romsuintest SA SC Ilya Agro SRL SC Romsuintest SA
Gestante Lactante
p < 0,05 Figure 2. TGO activity in pregnant sows and dairy farms A and B (average values)
100

Uree mg/dl
24,929,6
23,2
32,5
0
5
10
15
20
25
30
35
SC Ilya Agro SRL SC Romsuintest SA SC Ilya Agro SRL SC Romsuintest SA
Gestante Lactante
p < 0,01 p < 0,001
Figure 3. Mean urea in pregnant and lactating sows from farms A and B
Glucose values were higher than those in lactating sows on both farms implying a physiological decrease of this parameter with the consumption of lactose in milk (1). Cholesterol can raise pigs in different liver and kidney generally subclinical (1). The values of this parameter were found elevated in groups of farm B. In both farms were found significantly higher cholesterol levels in lactating sows (p <0.01-farm A, p <0.001, farm B), which may be due to increased sensitivity to the action of this category of pathogens from metabolic demands during lactation.
Transaminase activity is higher in some liver and muscle. Among these enzymes, ALT is less specific. TGO activity in sows from farm B presented significant increases in value both to the pregnant sows and lactating (p <0.05, figure no. 2) which can be correlated with the development of liver disease such as poisoning in pigs from farm B. Following determinations of urea (figure no. 3) and creatinine, parameters that assess renal function in farm B were increases in the values of these parameters both in the pregnant sows and lactating. Noted a correlation between urea and creatinine values. Reactions of these parameters show renal dysfunction in groups of farm B as a result of factors such as poisoning attacks.
101
Outcomes in this study have demonstrated some aspects of haematological parameters and biochemical variability analyzed. Some data have shown the influence of physiological status of sows, pregnant, lactating respectively, the results obtained. Metabolic disorders identified through biochemical and hematological determinations were correlated with technological imperfections mentioned in farm B. This could lead, among other bacterial growth in air cargo shelters and bacterial pyrogens produced haematological and biochemical reactions, including: leukocytosis, hyperglycemia, hypercholesterolemia, increased activity TGO and TGP, and elevated hyperazotaemia. Those changes show the action of pathogenic biological factors on liver function, kidney and hematopoietic system.
102
Conclusions 1. In a pig farm with technological inadequacies of microclimate (B), following the action of bacterial pyrogens and germs from air occurred haematological and biochemical changes in two groups of sows, pregnant, lactating respectively, among which: leukocytosis, hyperglycemia, hypercholesterolemia increase in transaminase activity in particular TGO, hyperazotaemia and hypercreatininemia. 2. Changes highlighted in Farm B showed statistically significant differences compared with two groups of sows in farm A, microclimate factors fell within the limits of comfort.3. Haematological and biochemical reactions found in sows from farm B were attributed to synergistic action of bacterial pyrogens and aeromicroflorei on liver function, kidney and hematopoietic system.
References
1. Avram Nicolae, 2002, Compendium of special Pathophysiology, Romania
Foundation for Tomorrow Publishing House, Bucharest. 2. Bădic Elena-Luiza, 2010, Levels, Sources and Influence of Pyrogens and
Operated Pigs Reared Intensively, PhD thesis. 3. Burrell R., 1994, Human Responses to Bacterial Endotoxin, Circulatory
shock, 43 (3) : 137-53. 4. Carroll J.A., Matteri R.L., Dyer C.J., Beausang L.A., Zannelli M.E., 2001, Impact
of Environmental Temperature on Response of Neonatal Pigs to an Endotoxin Challenge, “American Journal of Veterinary Research”, 62 (4) : 561-6.
5. John E., Pais P., Furtado N., Chin A., Radhakrishnan J., Fornell L., 2008, Early Effects of Lipopolysaccharide on Cytokine Release, Hemodynamic and Renal Function in Newborn Piglets, “Neonatology”, 93 (2) : 106-12.
6. Mwanza A.M., Madej A., Kindahl H., Lundeheim N., Einarsson S., 2001, Postovulatory Effect of Intravenous Administration of Lipopoly-saccharide (Escherichia coli, 055:B5) on the Endocrine Status of Recently Ovulated Sows, “Reproduction in domestic animals”, 36 (3-4) : 157-61.
7. Pickrell J., Heber A.J., Murphy J.P., Henry S.C., May M.M., Nolan D., Oehme F.W., Gillespie J.R., Schoneweis D., 1993, Characterization of Particles, Ammonia, Endotoxin in Swine Confinement Operations, “Veterinary and Human Toxicology”, 35 (5) : 421-8.
8. Elena Potecea, 2002, Infectious Diseases of Animals I Publisher Romania of Tomorrow Foundation, Bucharest, 236-238.
9. Teuşdea V. Mitrănescu Elena, 2007, Environmental Protection, Edition IV, Air Pollution, Methods and Means of Reducing Pollutant Emissions From Livestock Facilities, Omega Publishing Print, Bucharest, 193-212, 254-277.
10. Togoe I., Dobre Mimi, 2006, Veterinary Bacteriology - Methods for Quantification of Microorganisms in a Product, Printech, Bucharest, 116-121.
11. Urbain B., Gustin P., Prouvost J.F., Ansay M., Michel O., Nicks B., 1996, Chronic Exposure of Pigs to Airborne Dust and Endotoxins in an Environmental Chamber: Technical Note, “Veterinary Research”, 27 (6) : 569-78.

103
IDENTIFICATION AND DIFFERENTIATION OF HAEMOPHILUS PARASUIS SERO-NONTYPEABLE STRAINS USING A SPECIES-
SPECIFIC PCR AND THE DIGESTION OF PCR PRODUCTS WITH HIND III ENDONUCLEASE
Boh CHANG LIN, DVM, MS, PhD1
Abstract
Fifty-three sero-nontypeable strains, thirty-two serotypeable, and seven standard strains of Haemophilus parasuis had been examined with a species-specific PCR to confirm the identifications. The PCR amplicon of each strain was further digested with an endonuclease (Hind III) to produce DNA fragments, which allowed the fifty-three sero-nontypeable strains to be divided into 8 distinct restriction fragment length polymorphism (RFLP) patterns. The PCR-RFLP combination adopted in this study provided us with a molecular approach to the identification and differentiation of H. parasuis sero-nontypeable field strains.
Brief communications
Haemophilus parasuis has emerged as one of the most important pathogens in
isolated and immune-naïve high health status pig herds during the past decade. So far, 15 serovars are described, and the most prevalent serovars in the United States are 2,4,5,12,13 and 14 1. A rather high percentage of nontypeable serovars was also noted1,2. However, very little has been known about the virulence factors of H. parasuis field strains isolated from sick pigs. According to some previous studies, the virulence and antigenicity of H. parasuis field isolates might vary between different serovars and even between different strains of the same serovar2. For this reason, fully relying on serotyping may not be adequate in an attempt to design appropriate immuno-prophylactic measures.
Identification and confirmation of H. parasuis field strains can be difficult and cumbersome if the field isolates cannot be serotyped and further biochemical tests are needed. Recently, a species-specific PCR test for detection of H. parasuis has been described by Olivereila et al3, which will greatly improve the diagnosis of H. parasuis sero-nontypeable strains.
In this study, 53 sero-nontypeable strains, 32 serotypeable strains, and 7 standard strains of H. parasuis were examined with the species-specific PCR assay to confirm their identification. This PCR assay allowed the amplification of an 821 bp product, which was further digested with Hind III endonuclease to produce a DNA fingerprint. The reference strains were seven H. parasuis isolates of known serovars that were obtained from Dr. Rapp-Gabrielson. The field strains were isolated from pigs
1 MVP Laboratories, Inc., Ralston, Nebraska.
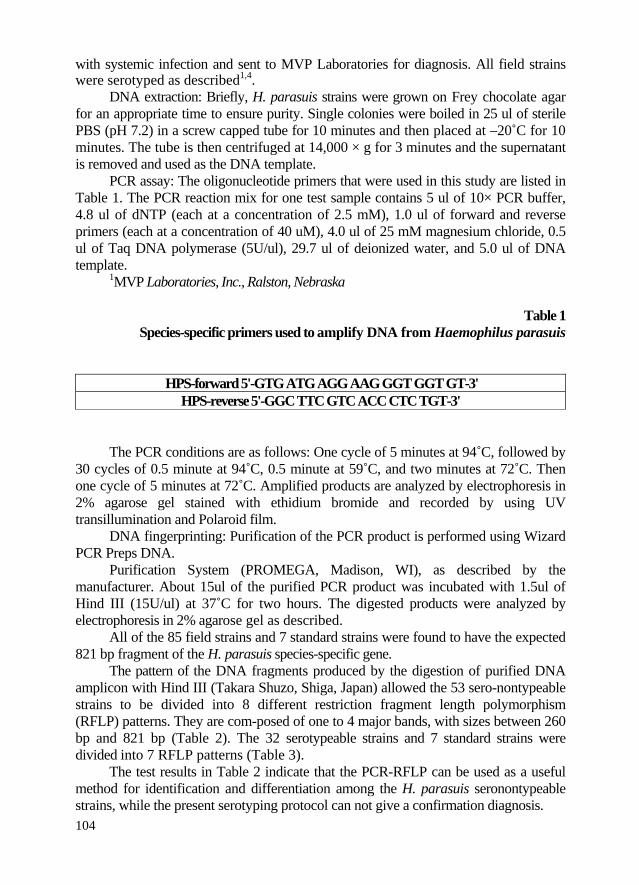
104
with systemic infection and sent to MVP Laboratories for diagnosis. All field strains were serotyped as described1,4.
DNA extraction: Briefly, H. parasuis strains were grown on Frey chocolate agar for an appropriate time to ensure purity. Single colonies were boiled in 25 ul of sterile PBS (pH 7.2) in a screw capped tube for 10 minutes and then placed at –20˚C for 10 minutes. The tube is then centrifuged at 14,000 × g for 3 minutes and the supernatant is removed and used as the DNA template.
PCR assay: The oligonucleotide primers that were used in this study are listed in Table 1. The PCR reaction mix for one test sample contains 5 ul of 10× PCR buffer, 4.8 ul of dNTP (each at a concentration of 2.5 mM), 1.0 ul of forward and reverse primers (each at a concentration of 40 uM), 4.0 ul of 25 mM magnesium chloride, 0.5 ul of Taq DNA polymerase (5U/ul), 29.7 ul of deionized water, and 5.0 ul of DNA template.
1MVP Laboratories, Inc., Ralston, Nebraska
Table 1 Species-specific primers used to amplify DNA from Haemophilus parasuis
HPS-forward 5'-GTG ATG AGG AAG GGT GGT GT-3' HPS-reverse 5'-GGC TTC GTC ACC CTC TGT-3'
The PCR conditions are as follows: One cycle of 5 minutes at 94˚C, followed by
30 cycles of 0.5 minute at 94˚C, 0.5 minute at 59˚C, and two minutes at 72˚C. Then one cycle of 5 minutes at 72˚C. Amplified products are analyzed by electrophoresis in 2% agarose gel stained with ethidium bromide and recorded by using UV transillumination and Polaroid film.
DNA fingerprinting: Purification of the PCR product is performed using Wizard PCR Preps DNA.
Purification System (PROMEGA, Madison, WI), as described by the manufacturer. About 15ul of the purified PCR product was incubated with 1.5ul of Hind III (15U/ul) at 37˚C for two hours. The digested products were analyzed by electrophoresis in 2% agarose gel as described.
All of the 85 field strains and 7 standard strains were found to have the expected 821 bp fragment of the H. parasuis species-specific gene.
The pattern of the DNA fragments produced by the digestion of purified DNA amplicon with Hind III (Takara Shuzo, Shiga, Japan) allowed the 53 sero-nontypeable strains to be divided into 8 different restriction fragment length polymorphism (RFLP) patterns. They are com-posed of one to 4 major bands, with sizes between 260 bp and 821 bp (Table 2). The 32 serotypeable strains and 7 standard strains were divided into 7 RFLP patterns (Table 3).
The test results in Table 2 indicate that the PCR-RFLP can be used as a useful method for identification and differentiation among the H. parasuis seronontypeable strains, while the present serotyping protocol can not give a confirmation diagnosis.
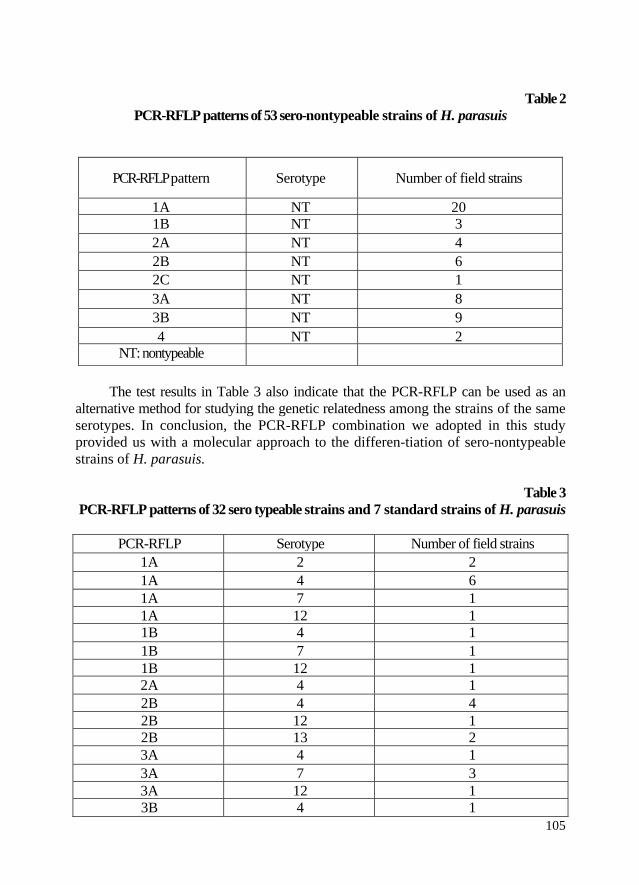
105
Table 2 PCR-RFLP patterns of 53 sero-nontypeable strains of H. parasuis
PCR-RFLP pattern Serotype Number of field strains
1A NT 201B NT 3 2A NT 4 2B NT 6 2C NT 1 3A NT 8 3B NT 9 4 NT 2
NT: nontypeable The test results in Table 3 also indicate that the PCR-RFLP can be used as an
alternative method for studying the genetic relatedness among the strains of the same serotypes. In conclusion, the PCR-RFLP combination we adopted in this study provided us with a molecular approach to the differen-tiation of sero-nontypeable strains of H. parasuis.
Table 3
PCR-RFLP patterns of 32 sero typeable strains and 7 standard strains of H. parasuis
PCR-RFLP Serotype Number of field strains 1A 2 2 1A 4 6 1A 7 11A 12 11B 4 1 1B 7 11B 12 12A 4 1 2B 4 42B 12 12B 13 23A 4 1 3A 7 33A 12 13B 4 1
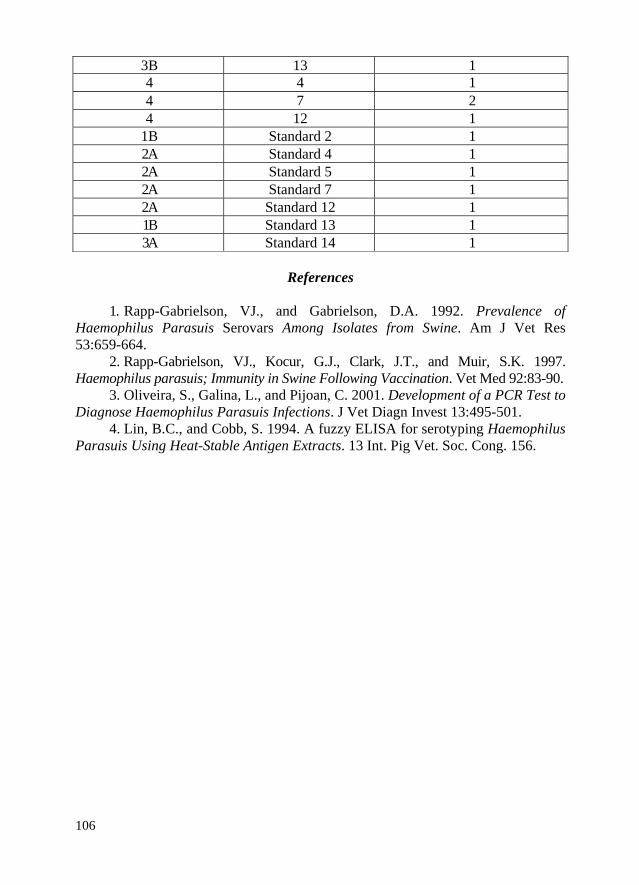
106
3B 13 14 4 1 4 7 2 4 12 1
1B Standard 2 1 2A Standard 4 1 2A Standard 5 1 2A Standard 7 1 2A Standard 12 1 1B Standard 13 1 3A Standard 14 1
References
1. Rapp-Gabrielson, VJ., and Gabrielson, D.A. 1992. Prevalence of
Haemophilus Parasuis Serovars Among Isolates from Swine. Am J Vet Res 53:659-664.
2. Rapp-Gabrielson, VJ., Kocur, G.J., Clark, J.T., and Muir, S.K. 1997. Haemophilus parasuis; Immunity in Swine Following Vaccination. Vet Med 92:83-90.
3. Oliveira, S., Galina, L., and Pijoan, C. 2001. Development of a PCR Test to Diagnose Haemophilus Parasuis Infections. J Vet Diagn Invest 13:495-501.
4. Lin, B.C., and Cobb, S. 1994. A fuzzy ELISA for serotyping Haemophilus Parasuis Using Heat-Stable Antigen Extracts. 13 Int. Pig Vet. Soc. Cong. 156.
107
A NOVEL APPROACH TO CHARACTERIZE HAEMOPHILUS PARASUIS FIELD ISOLATES USING A PCR ASSAY FOR DETECTING A
NEURAMINIDASE GENE AND USING A SPOT TEST FOR ESTIMATING THE NEURAMINIDASE ACTIVITY EXPRESSED BY THE ISOLATE
Boh CHANG LIN, DVM, MS, PhD1
Introduction
Haemophilus parasuis, which was once considered as the causative agent of a
sporadic disease of young pigs com-promised by stress, has become one of the most important bacterial pathogens in immune-naïve pig herds under today’s modern intensive pig raising systems. Innovative new production technologies such as segregated early weaning and all-in/all-out pig flow in high health pig herds and the emergence of new respiratory diseases have been suggested to be associated with an increase in the prevalence and severity of this disease.1
H. parasuis is a gram-negative organism that normally colonizes the upper respiratory tract of pigs. Mucosal injury caused by other microorganisms may enhance the invasion of H. parasuis, but the microbial and host factors involved with systemic infection are not known. Although the differences in pathogenicity among H. parasuis strains have been suggested to be associated with the presence of capsule and proteins pertaining to the external membrane, the virulence factors of this pathogen are not known.
Control of H. parasuis infection in pig herds has been attempted through vaccination. Good homologous protection against some strains of H. parasuis in pigs immunized with autogenous bacterins has been observed, cross protection against heterogenous serovars is less frequently seen.2 This makes the differentiation of H. parasuis isolates critical in the design of an effective autogenous vaccine. During the past few decades the epi-demiologic features of H. parasuis are traditionally based on the results of serotyping. Bakos et al first reported the presence of serovars among H. parasuis isolates.3 So far some 15 serovars based on the immunodiffusion are recognized.4 The serovar-specific antigen is heat-stable polysaccharide.5 A large percentage of H. Parasuis isolates are nontypeable when this typing system is used. This makes the differentiation between H. parasuis isolates very difficult. In fact, considerable heterogeneity among H. parasuis isolates has been demonstrated by serotyping, colony morphology,whole cell and out membrane pro-tein profiles, restricted endonuclease fingerprinting, and other DNA profiles. Such intraspecies heterogeneity makes the accurate characterization and differentiation of H. parasuis isolates impossible in many cases. Some novel techniques, such as ERIC-PCR and PCR-RFLP, may be used for subtyping of H. parasuis isolates.6,7 These DNA based techniques are still unable to make any association between genotype and virulence factors of H. parasuis.
1 MVP Laboratories, Inc., Ralston, Nebraska.
108
Recently, Lictensteiger and Vimr had reported the detection and purification of H. parasuis neuraminidase.8 The role of neuraminidase (sialidase) in virulence of H. parasuis is yet to be determined. But the possible roles neuraminidase may play include scavenging carbon or nitrogen for nutrition and intracellular survival, unmasking receptors for invasion, or interfering with host defense systems. In fact, neuraminidase is frequently found in pathogens that live in close contact with animal hosts such as Pasteurella multocida and E. coli. The enzyme assistance offered by bacterial neuraminidase in establishing bacterial infection is through the removal of terminal sialic acid residues from the protective glycosyl side chains of the glycoproteins on host cells. For this reason, the presence or absence of the neuraminidase activity in an isolate could be used as an additional criterion for the differentiation of H. parasuis strains in the design of an autogenous vaccine.
In this study, a PCR assay was adopted to detect the presence or absence of the bacterial neuraminidase gene among some 103 field strains and 7 standard strains of H. parasuis. The neuraminidase activity of H. parasuis strains was determined by a novel spot test using 5-bromo-4-chloro-3-indolyl-alpha-D-N-acetylneuraminic acid (BCIN) as substrate.9
Materials and methods
Bacterial strains 103 H. parasuis isolates obtained from different farms and different
geographic regions in the United States were evaluated. All of the H. parasuis isolates were ei-ther isolated from pig tissues submitted to the Diagnostic Department at MVP Laboratories, or obtained from the Veterinary Diagnostic Laboratory at the University of Minnesota and other State Laboratories. Seven standard strains were provided by Dr. V.J. Rapp-Gabrielson and stored at -70˚C before use. Growth of all H. parasuis isolates was done as previously described10 and the identification of all of H. parasuis isolates was done by a species-specific PCR.11 Field isolates of Pasteurella multocida were used as the positive control in the PCR assay. Other field isolates such as Haemophilus species, Actinobacillus pleuropneumoniae, Escherichia coli, and Clostridium perfringens were also tested for the presence of the neuraminidase gene using a PCR assay.
PCR assay for neuraminidase gene An internal portion of the neuraminidase gene was amplified by PCR using
the primers F1 (5’-GCTTGATGGCAGTTTATATGTG-3’) and R2 (5’-TGAAGGAGCCGCTGTAGTCG-3’) as described before.12 Briefly, an H. parasuis isolate was grown on Frey chocolate agar for an appropriate time to ensure purity. A single colony was boiled in 25 ul of sterile PBS (pH 7.2) in a screw capped tube for 10 minutes and then stored at -20˚C for 10 minutes. Then the tube is centrifuged at 14,000 × g for 3 minutes and the supernatant is removed and used as the DNA template. The PCR reaction mix for one test sample contains 5.0 ul of 10 x PCR buffer (500mM KCl, 100 mM Tris-HCl, pH 8.3), 2.4 ul of dNTP (2.5 mM each of dATP, dCTP, dGTP and dTTP), 0.5 ul of F1 primer, 0.5 ul of R2 primer, 0.5 ul of T a q polymerase (5 U/ul), 4.0 ul of magnesium chloride (25 mM), 32.1 ul
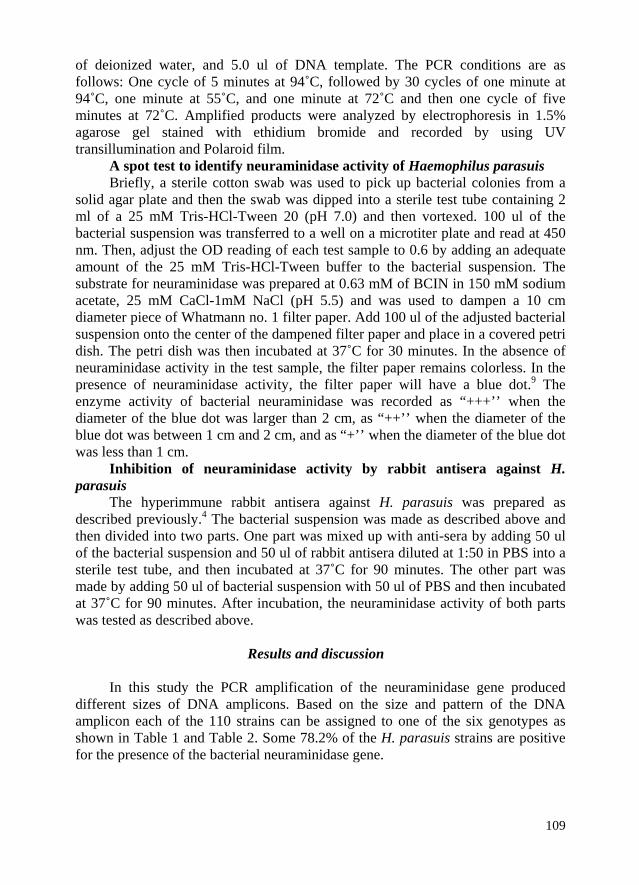
109
of deionized water, and 5.0 ul of DNA template. The PCR conditions are as follows: One cycle of 5 minutes at 94˚C, followed by 30 cycles of one minute at 94˚C, one minute at 55˚C, and one minute at 72˚C and then one cycle of five minutes at 72˚C. Amplified products were analyzed by electrophoresis in 1.5% agarose gel stained with ethidium bromide and recorded by using UV transillumination and Polaroid film.
A spot test to identify neuraminidase activity of Haemophilus parasuis Briefly, a sterile cotton swab was used to pick up bacterial colonies from a
solid agar plate and then the swab was dipped into a sterile test tube containing 2 ml of a 25 mM Tris-HCl-Tween 20 (pH 7.0) and then vortexed. 100 ul of the bacterial suspension was transferred to a well on a microtiter plate and read at 450 nm. Then, adjust the OD reading of each test sample to 0.6 by adding an adequate amount of the 25 mM Tris-HCl-Tween buffer to the bacterial suspension. The substrate for neuraminidase was prepared at 0.63 mM of BCIN in 150 mM sodium acetate, 25 mM CaCl-1mM NaCl (pH 5.5) and was used to dampen a 10 cm diameter piece of Whatmann no. 1 filter paper. Add 100 ul of the adjusted bacterial suspension onto the center of the dampened filter paper and place in a covered petri dish. The petri dish was then incubated at 37˚C for 30 minutes. In the absence of neuraminidase activity in the test sample, the filter paper remains colorless. In the presence of neuraminidase activity, the filter paper will have a blue dot.9 The enzyme activity of bacterial neuraminidase was recorded as “+++’’ when the diameter of the blue dot was larger than 2 cm, as “++’’ when the diameter of the blue dot was between 1 cm and 2 cm, and as “+’’ when the diameter of the blue dot was less than 1 cm.
Inhibition of neuraminidase activity by rabbit antisera against H. parasuis
The hyperimmune rabbit antisera against H. parasuis was prepared as described previously.4 The bacterial suspension was made as described above and then divided into two parts. One part was mixed up with anti-sera by adding 50 ul of the bacterial suspension and 50 ul of rabbit antisera diluted at 1:50 in PBS into a sterile test tube, and then incubated at 37˚C for 90 minutes. The other part was made by adding 50 ul of bacterial suspension with 50 ul of PBS and then incubated at 37˚C for 90 minutes. After incubation, the neuraminidase activity of both parts was tested as described above.
Results and discussion
In this study the PCR amplification of the neuraminidase gene produced
different sizes of DNA amplicons. Based on the size and pattern of the DNA amplicon each of the 110 strains can be assigned to one of the six genotypes as shown in Table 1 and Table 2. Some 78.2% of the H. parasuis strains are positive for the presence of the bacterial neuraminidase gene.

110
Table 1 PCR amplification of bacterial neuraminidase gene extracted from pure
culture of H. parasuis isolates.
Sizes of DNA amplicon Genotype0 bp NA-0
210 bp NA-1210 bp, 925 bp NA-2
925 bp NA-3512 bp NA-4
925 bp, 780 bp, 210 bp NA-5All other patterns NA-6
Table 2 Prevalence of bacterial neuraminidase gene among 110 H. Parasuis strains
Neruraminidase genotype Number of strains Percentage
NA-0 24 21.8% NA-1 52 47.3% NA-2 20 18.2% NA-3 3 2.7% NA-4 1 0.9% NA-5 4 3.6% NA-6 6 5.5%
The neuraminidase activity expressed by an individual H. parasuis strain was
detected by a spot test as shown in Figure 1 and Table 3. It was found that most of the 24 H. parasuis isolates that are negative for the presence of neuraminidase gene (NA-0) are also negative for the neuraminidase activity, while all of the isolates of NA-1 and NA-3 genotypes are positive for the neuraminidase activity. At this stage, it is not clear if there is any relationship between the genotype of H. parasuis neuraminidase gene and the neuraminidase activity of that isolate. However, most of the isolates that have DNA amplicons of 210 bp and 925 bp (NA-1, NA-2, NA-3, NA-5 subtype) are positive for the neuraminidase activity.

111
Table 3 The detection of bacterial neuraminidase activity og 110 H. Parasuis isolates
and 20 Pasteurella multocidaI isolates using BCN as enzyme substrate
Bacterial isolates
Genotype Number of isolate
Neuraminidase activity
Positive Negative H. parasuis NA-0 24 2 22 H. parasuis NA-1 52 52 0 H. parasuis NA-2 20 16 4 H. parasuis NA-3 3 3 0 H. parasuis NA-4 1 1 0 H. parasuis NA-5 4 2 2 H. parasuis NA-6 6 0 6 P. multocida NA-4 20 20 0
Figure 2 shows the decreasing of the neuraminidase ac-tivity of an H. parasuis
isolate as the bacterial suspension is diluted from ten fold to 100 fold. Figure 4 also shows the reduction of neuraminidase activity after an incubation of the bacterial suspension with an antiserum against H. parasuis for 90 minutes at 37˚C. This finding is consistent with a previous report which indi-cated that in the presence of immune serum, a 40.3% reduction in the activity of Pasteurella multicida neuraminidase was observed.13 This is evidence to indicate that the bacterial neuraminidase of H. parasuis is antigenic and antibodies produced in the immunized animal are able to neutralize the enzyme activity of bacterial neuraminidase.
So far all of the classical schemes for the differentiation of H. parasuis isolates provide little insight into the relationship between the virulence of the isolate and the serotype or genotype. In this study it was found that a PCR assay to amplify the bacterial neuraminidase gene can be used as an additional measure in the characterization of H. parasuis isolates. The estimation of the neuraminidase activity of the H. parasuis isolate by a spot test also can help us obtain a profile of one of the virulence factors in this microorganism. The traditional serotyping and genotyping measures for H. Parasuis have nothing to tell about the virulence. The PCR assay and the spot test developed in this study have provided us an alternative way to characterize H. parasuis isolates. This probably is the first time that we can characterize H. parasuis isolates using a virulence factor of H. parasuis.

Figure 1: The neuraminidase activity of individual bacterial isolate detected with a spot test using BCIN as enzyme substrate. Upper left sample: #24472 is H. parasuis and positive for neuraminidase activity; upper right sample: #24560 is H. parasuis and negative for neuraminidase activity; lower left sample: #24657 is H. parasuis and positive for neuraminidase activity; lower right sample: P. multocida that is known for the presence of neuraminidase activity as positive control.
Figure 2: Decreasing of bacterial neuraminidase activity. Sample A: #24467
is H. parasuis and positive for neuraminidase activity; sample B: #24467 bacterial suspension is diluted ten fold and showing decreased neuraminidase activity; sample C: #24467 bacterial suspension is diluted 100 fold and showing further decreased neuraminidase activity; sample D: #24467 bacterial suspension was incubated with antiserum against H. parasuis for 90 minutes and showing remarkable reduction of neuraminidase activity.
112

113
References 1. Rapp-Gabrielson, V. J. 1999. Haemophilus parasuis, p. 475–481. In B.
Straw et al. (ed), Disease of swine, 8th ed. Iowa State University Press, Ames. 2. Kielstein, P., and Rassbach, A. 1991. Serologische Typisierung und
Nachweis immunogener Kreuzreaktionen von Haemophilus parasuis (Glassersche Krankheit). Mh Vet-Med 46:586–589.
3. Bakos, K.; Nilsson, A.; and Thal, E. 1952. Untersuchungen uber Haemophilus suis. Nord Vet-Med 4:241–255.
4. Kielstein, p., and Rapp-Gabrielson, V. J. 1992. Designation of 15 serovars of Haemophilus parasuis based on immunodiffusion using heat-stable antigen extracts. J Clin Microbiol 30:862–865.
5. Morozumi, T., and Nicolet, J. 1986. Some antigenic properties of Haemophilus parasuis and a proposal for serological classification. J Clin Microbiol 23:1022–1025.
6. Rafiee, M., Bara, M., Stephens, C. P. , and Blackall, P. J. 2000. Applica-tion of ERIC-PCR for the comparison of isolates of Haemophilus parasuis. Aust Vet J 78:846–849.
7. Oliveira, S., Choi, Y. K., and Pijoan, C. 2002. Use of PCR-RFLP as an alternative method for Haemophilus parasuis genotyping. Proceedings of the 17th IPVS Congress, Ames, Iowa, USA, 2002, 2:336.
8. Lichtensteiger C. A., and Vimr, E.R. 2003. Purification and renaturation of membrane neuraminidase from Haemophilus parasuis. Vet Microbiol 2;93(1):79–87.
9. Wiggins, R., Crowley, T. , Homer, P. J. Soothill, P. W. , Millar, M. R., and Corfield, A. P. 2000. Use of 5-Bromo-4-Chloro-3-Indolyl-alpha-D-N-Acetyl-neuraminic acid in a novel spot test to identify sialidase activity in vaginal swabs from women with bacterial vaginosis. J Clin Microbiol 38:3096–3097.
10. Rapp-Gabrielson, V. J., and Gabrielson, D. A. 1992. Prevalence of Haemophilus parasuis serovars among isolates from swine. Am J Vet Res 53:659–664.
11. Oliveira, S., alina, L., and Pijoan, C. 2001. Development of a PCR test to diagnose Haemophilus parasuis infections. J Ve t Diagn Invest 13:495–501.
12. Mizan S., Henk, A., Stallings, A., Maier, M., and Lee, M. D. 2000. Cloning and characterization of sialidase with 2–6’ and 2–3’ sialyl lactose specificity from Pasteurella multocida. J Bacteriol 182:6874–6883.
13. Straus D. C., Jolley, W. L., and Purdy, C. W. 1996. Characterization of neuraminidases produced by various serotypes of Pasteurella multocida. Infect Immun64:1446–1449.

114
115
PATHOTYPING OF AVIAN INFLUENZA VIRUS IN ROMANIA
R.S. SINGER1, M.A. TURCITU2, Gh. BĂRBOI1, M. WARD3, Elke STARICH4, Raluca CIORANU1, Iuliana ONIŢĂ1, Graţiela NEAGOE1,
Adriana NEICUŢ1, Handan COSTE1, Ioana CONSTANTINESCU1
Abstract
Avian influenza (AI), like all viruses belonging to type A, is usually situated at one of the extreme regarding virulence, therefore two categories of manifestation can be identified: highly pathogenic avian influenza (HPAI), with systemic implication and morbidity and mortality indexes often reaching 100% in poultry and low pathogenic avian influenza (LPAI), characterized by less aggressiveness, usually located at respiratory and digestive levels (low morbidity and mortality, unless secondary infections occurs).
Viruses belonging to AI allow the molecular identification of virulence (pathotyping) and confirm the advantages of molecular techniques in the diagnosis. The techniques rely on identification and characterization of amino acids belonging to the cleavage site of hemagglutinin gene and consequently the ability of host proteases to be able to cut the protein precursors for the virus to become infectious.
In Romania, several episodes of AI have been identified, including years 2005, 2006, 2007 and 2009. Pathotyping of the isolates from those years has shown that for 2005-2007 episodes, all isolates belonged to HPAI category, whereas 2009 isolate showed low virulence (LPAI). Moreover, using molecular markers, we were able to assess virus affinity for avian host and susceptibility to antiviral treatment with neuraminidase inhibitors (oseltamivir).
Keywords: Avian influenza virus, hemagglutinin gene, pathotyping
1 Institute for Diagnosis and Animal Health, Dr. Staicovici No63, district 5,
Bucharest. 2 University of Minnesota, Department of Veterinary and Biomedical Sciences, 1971
Commonwealth Ave, Minnesota. 3 University of Sydney, Faculty of Veterinary Science, 425 Werombi Rd, Sydney. 4 Institute of Diagnostic Virology, Friedrich-Loeffler-Institute, 17493 Greifswald-
Insel Riems, Germany.

116
Introduction Type A influenza viruses have a virion composed by eight genic segment
which encodes ten different proteins, categorized, depending on their localization, in surface and internal proteins. From surface proteins, those involved in heamagglutination (HA protein) and neuraminidase substrate protein (NA) plays an important role in viral pathogenicity characterization. NA and HA proteins offer the most important sites for immune response induction, initially by neutralizing antibody. However, these proteins have a wide antigenic variability, which allows classification into 16 subtypes (H1 – H16) for HA and 9 subtypes (N1 – N9) for NA through hemagglutinin and neuraminidase inhibition tests. Each virus has a single type of HA and NA protein, from a total of 144 possible combinations (6).
Although, from the genetic point of view, Avian Influenza isolates virulence is a true polygenic factor, one of those is correlated with hemagglutinin (HA) cleavage site (12). This glycoprotein is synthesized as precursor (HAO) that requires a post-translational cleavage to become functional and subsequently the viral particle to become infectious (HAo cleaved into HA1 and HA2) (7). This event is mediated by host proteases. The number and nature of amino acids that are located in the cleavage site constitute the determinant factor, being the region that contains the recognition site for host proteases. For HPAI viruses, glycoprotein can be cleaved by all ubiquitary host proteases, therefore such viruses have a systemic dissemination pattern, whereas LPAI viruses glycoprotein contain recognition site only for trypsin-like proteases and so they are located only where the enzyme is primarily present (lung, intestine) (2, 13, 15).
According to OIE, isolates belonging to HPAI category implies a high virulence for poultry and fulfilling one or more of the following three criteria (3):
1. any virus which proves to be lethal for six, seven or eight from a total of eight susceptible chicken between six and seven weeks old, in a ten days interval which succeeds inoculation with 0,2ml allantoic bacteria free fluid, 1:10dilution.
2. any virus belonging to H5 and H7 subtype which do not fulfill the criteria above, but which possess an amino-acid sequence at the cleavage site of HA gene compatible with HPAI category.
3. any virus which do not belong to H5 or H7 subtypes, but proves to be lethal for one to five from a total of eight inoculated chicken and grow on cell culture without trypsin enrichment.
The aim of this study was to characterize the Romanian AIV isolates for years 2005, 2006, 2007 and 2009 regarding pathogenicity, resistance to neuraminidase inhibitors (oseltamivir), as well as host specificity.
Material and methods
Biological material was represented by allantoic fluids virus isolates from
positive cases of AI, originated from the main episodes of the disease in Romania: years 2005-2006, 2007 and 2009.
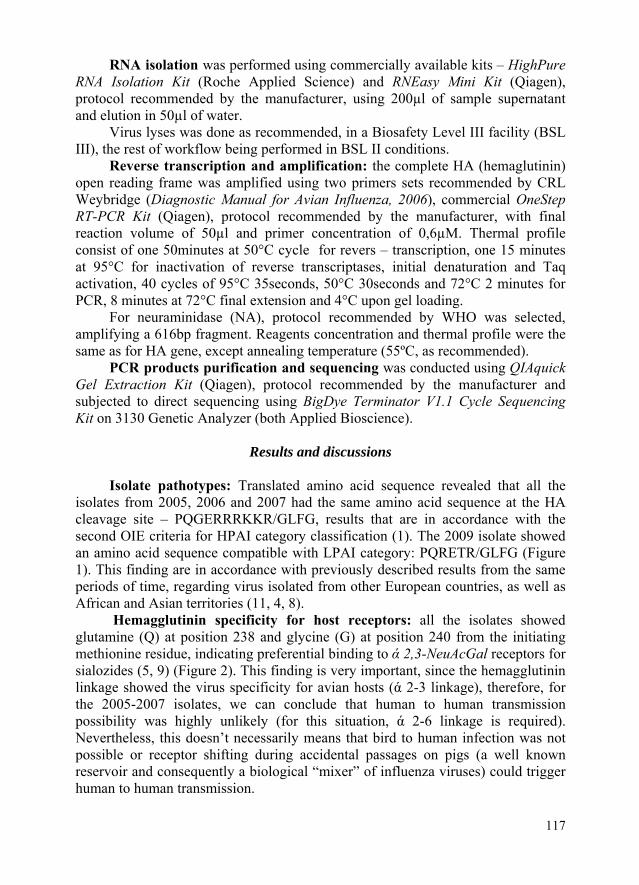
117
RNA isolation was performed using commercially available kits – HighPure RNA Isolation Kit (Roche Applied Science) and RNEasy Mini Kit (Qiagen), protocol recommended by the manufacturer, using 200µl of sample supernatant and elution in 50µl of water.
Virus lyses was done as recommended, in a Biosafety Level III facility (BSL III), the rest of workflow being performed in BSL II conditions.
Reverse transcription and amplification: the complete HA (hemaglutinin) open reading frame was amplified using two primers sets recommended by CRL Weybridge (Diagnostic Manual for Avian Influenza, 2006), commercial OneStep RT-PCR Kit (Qiagen), protocol recommended by the manufacturer, with final reaction volume of 50µl and primer concentration of 0,6µM. Thermal profile consist of one 50minutes at 50°C cycle for revers – transcription, one 15 minutes at 95°C for inactivation of reverse transcriptases, initial denaturation and Taq activation, 40 cycles of 95°C 35seconds, 50°C 30seconds and 72°C 2 minutes for PCR, 8 minutes at 72°C final extension and 4°C upon gel loading.
For neuraminidase (NA), protocol recommended by WHO was selected, amplifying a 616bp fragment. Reagents concentration and thermal profile were the same as for HA gene, except annealing temperature (55ºC, as recommended).
PCR products purification and sequencing was conducted using QIAquick Gel Extraction Kit (Qiagen), protocol recommended by the manufacturer and subjected to direct sequencing using BigDye Terminator V1.1 Cycle Sequencing Kit on 3130 Genetic Analyzer (both Applied Bioscience).
Results and discussions
Isolate pathotypes: Translated amino acid sequence revealed that all the
isolates from 2005, 2006 and 2007 had the same amino acid sequence at the HA cleavage site – PQGERRRKKR/GLFG, results that are in accordance with the second OIE criteria for HPAI category classification (1). The 2009 isolate showed an amino acid sequence compatible with LPAI category: PQRETR/GLFG (Figure 1). This finding are in accordance with previously described results from the same periods of time, regarding virus isolated from other European countries, as well as African and Asian territories (11, 4, 8).
Hemagglutinin specificity for host receptors: all the isolates showed glutamine (Q) at position 238 and glycine (G) at position 240 from the initiating methionine residue, indicating preferential binding to ά 2,3-NeuAcGal receptors for sialozides (5, 9) (Figure 2). This finding is very important, since the hemagglutinin linkage showed the virus specificity for avian hosts (ά 2-3 linkage), therefore, for the 2005-2007 isolates, we can conclude that human to human transmission possibility was highly unlikely (for this situation, ά 2-6 linkage is required). Nevertheless, this doesn’t necessarily means that bird to human infection was not possible or receptor shifting during accidental passages on pigs (a well known reservoir and consequently a biological “mixer” of influenza viruses) could trigger human to human transmission.
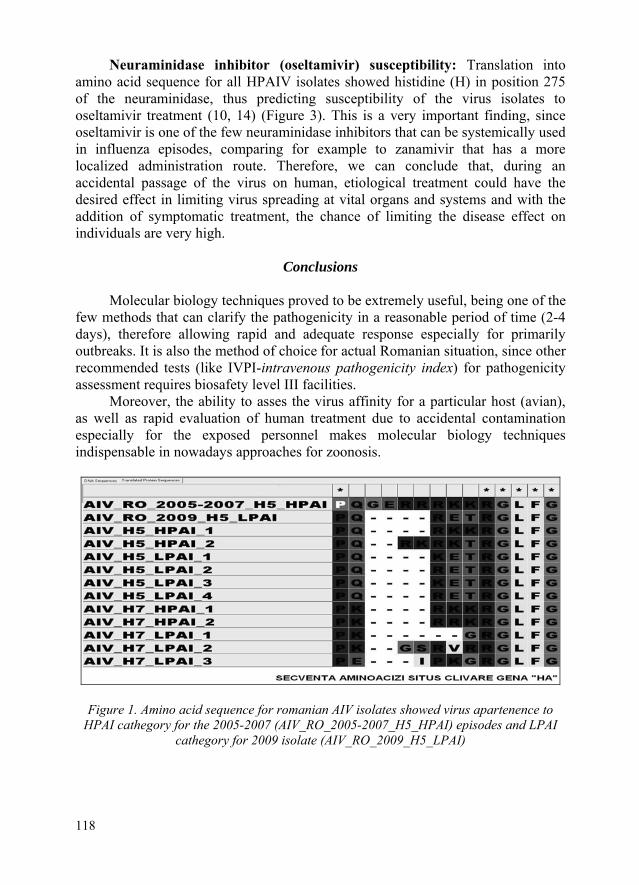
Neuraminidase inhibitor (oseltamivir) susceptibility: Translation into amino acid sequence for all HPAIV isolates showed histidine (H) in position 275 of the neuraminidase, thus predicting susceptibility of the virus isolates to oseltamivir treatment (10, 14) (Figure 3). This is a very important finding, since oseltamivir is one of the few neuraminidase inhibitors that can be systemically used in influenza episodes, comparing for example to zanamivir that has a more localized administration route. Therefore, we can conclude that, during an accidental passage of the virus on human, etiological treatment could have the desired effect in limiting virus spreading at vital organs and systems and with the addition of symptomatic treatment, the chance of limiting the disease effect on individuals are very high.
Conclusions
Molecular biology techniques proved to be extremely useful, being one of the
few methods that can clarify the pathogenicity in a reasonable period of time (2-4 days), therefore allowing rapid and adequate response especially for primarily outbreaks. It is also the method of choice for actual Romanian situation, since other recommended tests (like IVPI-intravenous pathogenicity index) for pathogenicity assessment requires biosafety level III facilities.
Moreover, the ability to asses the virus affinity for a particular host (avian), as well as rapid evaluation of human treatment due to accidental contamination especially for the exposed personnel makes molecular biology techniques indispensable in nowadays approaches for zoonosis.
Figure 1. Amino acid sequence for romanian AIV isolates showed virus apartenence to HPAI cathegory for the 2005-2007 (AIV_RO_2005-2007_H5_HPAI) episodes and LPAI
cathegory for 2009 isolate (AIV_RO_2009_H5_LPAI)
118

Figure 2. Aminoacid glutamine (Q) in position 238 and glycine (G) in position 240, showing preferential binding to ά 2,3-NeuAcGal receptors
Figure 3. Amino acid hystidine in position 275 showing susceptibility to oseltamivir treatment – image ruler is not the correct one –
References 1. Anon., 2005, Opinion of the Scientific Panel on AHAW on a request from
the Commission related to animal health and welfare aspects of Avian Influenza “EFSA J.”, 266, 1–21.
2. Banks J., Speidel E.S., Moore E., Plowright L., Piccirillo A., Capua I., 2001, Changes in the haemagglutinin and the neuraminidase genes prior to the emergence of highly pathogenic H7N1 avian influenza viruses in Italy, “Arch. Virol.”, 146, 963–973.
3. Disease of poultry: world trade and public health implications, Office International des Epizooties, Volume 19 (2) August 2000.
119
120
4. Ducatez, M.F., Olinger, C.M., Owoade, A.A., De Landtsheer, S., Ammerlaan, W., et al., 2006. Avian Flu: multiple introductions of H5N1 in Nigeria. Nature 442, 37.
5. Li, K.S., Guan, Y., Wang, J., Smith, G.J., Xu, K.M., et al., 2004. Genesis of a Highly Pathogenic and Potentially Pandemic H5N1 Influenza Virus in Eastern Asia, “Nature” 430, 209–212.
6. Munch, M., Nielsen L.P., Handberg K. J., Jorgensen P.H., 2001, Detection and subtyping (H5 and H7) of avian type A influenza virus by RT-PCR and PCR-ELISA, Arch, “Virol.”, 146, 87-97.
7. Rott R., 1992, The pathogenic determinant of influenza virus, “Vet Microbiol”., 33, 303–310.
8. Salzberg, S.L., Kingsford, C., Cattoli, G., Spiro, D.J., Janies, D.A., et al., 2007, Genome analysis linking recent European and African influenza (H5N1) viruses, Emerg. Infect. Dis. 13, 713–718.
9. Smith, G.J.D., Naipospos, T.S.P., Nguyen, T.D., de Jong, M.D., Vijaykrishna, D., et al., 2006, Evolution and adaptation of H5N1 influenza virus in avian and human hosts in Indonesia and Vietnam. Virology 350, 258–268.
10. Smith, G.J.D., Fan, X.H., Wang, J., Li, K.S., Qin, K., et al., 2006, Emergence and predominance of an H5N1 influenza variant in China, Proc. Natl. Acad. Sci. U.S.A. 103, 16936–16941.
11. Starick E., M. Beer, B. Hoffmann, C. Staubach, O. Werner, A. Globig, G. Strebelow, C. Grund, M. Durban, F.J. Conraths,T. Mettenleiter, T. Harder, Phylogenetic analyses of highly pathogenic avian influenza virus isolates from Germany in 2006 and 2007 suggest at least three separate introductions of H5N1 virus.
12. Suarez D.L., 2000, Evolution of avian influenza viruses, Vet Microbiol., 74, 15–27.
13. Vey M., Orlich M., Adler S., Klenk H.D., Rott R., Garten W., 1992, Hemagglutinin activation of pathogenic avian influenza viruses of serotype H7 requires the protease recognition motif R-X-K/R-R, “Virology”, 188, 408–413.
14. Who, 2005, WHOWriting Committee of theWHOConsultation on Human Influenza A/H5., 2005. Avian influenza A (H5N1) infection in humans. N. Engl. J. Med. 353, 1374–1385.
15. Wood G.W., Mccauley J.W., Bashiruddin J.B., Alexander D.J., 1993, Deduced amino acid sequences at the haemagglutinin cleavage site of avian influenza A viruses of H5 and H7 subtypes, “Arch. Virol.”, 130, 209–217.

121
USE OF RT-PCR TEST IN EQUINE VIRAL
ARTERITIS DIAGNOSTIC
M.A. TURCITU1, Gh. BĂRBOI1, Simona LEAU1, Lenuţa ZAMFIR1, V. VUŢĂ1, Handan COSTE1, Ioana CONSTANTINESCU1
Abstract
Equine viral arteritis is a specific contagious disease of horses that occur worldwide. Conventional diagnostic is performed using seroneutralization test and virus isolation in cell culture. Isolation and identification of the virus by cell culture demands a period of at least two or three weeks, with inconsistent results due to low adaptation of wild strains to cell lines or cytotoxic effect of the semen. Thus, the need for rapid, specific and sensitive alternative makes molecular antigen identification a true method of choice for diagnostic.
Two RT-PCR and one nested RT-PCR assays were evaluated for the detection of equine viral arteritis virus, using primers pairs selected from the conserved regions of viral genome. All three protocols were initially evaluated using in house laboratory virus isolates followed by protocol optimization especially for viral genome detection in semen samples, one of the most important matrices for analysis. The results obtained for each protocol were evaluated in order to asses the applicability of the individual method for virus detection.
In conclusion, once established in the laboratory workflow, RT-PCR techniques provide several important advantages over other available antigen detection methods, such as sensitivity, specificity, adaptability for difficult biological matrices and high throughput.
Keywords: equine viral arteritis, diagnostic, RT-PCR
Introduction Equine arteritis virus (EAV) is the etiological agent of equine viral arteritis, a
contagious disease of equids, with clinical signs represented mainly by fever, anorexia, conjunctivitis, nasal discharge, edema of the limbs and ventral body, and the risk of abortion in pregnant mares. EAV is the prototype virus of the arteriviruses, a group of small enveloped viruses with positive, single-stranded RNA genomes. The arterivirus replication strategy resembles that of the family
1 Institute for Diagnosis and Animal Health, Dr. Staicovici No63, district 5,
Bucharest.
122
Coronaviridae; namely, a nested set of 3'-coterminal mRNAs with common 5' leader sequences are produced (3, 4). The genome of EAV is 12.7 kb and consists of seven open reading frames (ORFs) (3). ORFs 2, 5, 6, and 7 encode the four structural proteins of the virus, whereas ORFs 1a and 1b encode the viral polymerase.
EAV causes a long-term persistent infection that is specifically localized to the ampulla of the reproductive tract of carrier stallions (13, 14). Infectious virus is continuously shed in the semen of carrier stallions, despite high titres of neutralizing antibodies in their serum. Persistently infected stallions act as a natural reservoir of EAV and transmit the virus to susceptible mares during artificial or natural breeding (2, 7).
EAV cannot be differentiated clinically from a number of other respiratory and systemic equine diseases. Diagnosis of EAV infection is based on virus isolation, detection of nucleic acid or viral antigen, or demonstration of a specific antibody response. Virus isolation should be attempted from appropriate clinical or post-mortem specimens in rabbit, equine, or monkey kidney cell culture. The identity of isolates of EAV should be confirmed by neutralization test, reverse-transcription polymerase chain reaction (RT-PCR) assay, or by immunocytochemical methods, namely indirect immunofluorescence (10).
Although reportedly not always successful in natural cases of EAV infection (6, 9), virus isolation should be attempted from clinical specimens or necropsied tissues using rabbit, equine or monkey kidney cell culture (6, 8, 9). Experience over the years has shown that primary isolation of EAV from semen can present more difficulty than from other clinical specimens or from infected tissues unless an appropriate cell culture system is used. Moreover, due to the long period of two or three weeks required for virus isolation, such techniques are not the methods of choice for routine diagnostic. Therefore, the need for rapid, sensitive and specific antigen identification methods lead to the development of numerous RT-PCR techniques that can fulfill these demands.
Material and methods
Biological material was represented by in house virus isolates from previous
infected animals and also by ten semen samples originated from annual international ring test. Virus isolates were used for initial optimization of the RT-PCR protocols, as well as comparison regarding sensitivity for each assay. Ring test samples were used for extraction protocols optimization, due to the difficulty of obtaining good quality RNA from semen (difficult extraction matrix).
RNA extraction: several extraction protocols were experimented for semen (data not shown), and the best combination was chosen for future examination. Briefly, the final protocol consists of initial samples lysis using Trizol Reagent (Invitrogen, Medist Life Science) followed by RNA purification and concentration using PureLink RNA Micro Kit (Invitrogen, Medist Life Science) or RNEasy Mini Kit (Qiagen, Omnivet). For virus isolates, all samples were processed without initial Trizol lysis. All protocols used followed manufacturer recommendation, with RNA elution in a final volume of 30-50μl.

123
Revers transcription and amplification: three assays were selected for revers transcription and amplification, with primers spanning the conserved regions of the EAV genome. First protocol use four primer pairs that amplify different fragments from ORF’s 1b, 3, 4 and 7 (11), the second is represented by one primer pair for partial amplification of the M gene (12) and the third one, amplifying a final fragment of 184bp from the ORF1bgene (5). First two protocols consist of conventional RT-PCR method of revers transcription and amplification, whereas the third one is a Nested RT-PCR. Enzymatic reactions were performed with “one step” technology, using commercial kits – OneStep RT-PCR Kit (Qiagen, Omnivet) and Superscript III with Platinum Taq (Invitrogen, Medist Life Science) – protocols available on request. For Nested PCR, GoTaq Flexi DNA Polymerase (Promega, Dexter) was used, according to manufacturer reccomendation.
Electroforesis: The amplification products were loaded into an agarose 1,5% gel stained with ethidium bromide for UV visualisation. Migration was performed using 1X TBE buffer.
Results and discussions
All three protocols used for antigen detection proved to be reliable enough,
with some advantages and disadvantages from the rest, as follows: 1. Sugita protocol, amplifying a 292bp fragment of the M gene, proved to be
useful for EAV genome detection, with good sensitivity and specificity (data not shown) (Figure 1).
2. Gilbert protocol, as somehow expected, proved to be the most sensitive, capable to detect very low amount of viral load (data not shown). This could be explained by the fact that it uses two primer pairs, including the nested PCR (Figure 1). Based on the overall results, we consider this protocol to be the method of choice for semen screening, especially when no other alternative method can be used. On the other hand, care should be taken when handling the PCR products, since cross-contamination and consequently false positive results might appear with high frequency (this protocol involves two amplification steps).
3. Laurent protocols showed different degrees of sensitivity, depending on the region that was amplified; thus, for ORF1b, ORF3 and ORF7, the results were satisfactory, whereas for ORF4 the sensitivity was rather poor (Figure 2). Nevertheless, this assay can be convenientely used as a „backup” protocol, since it has the advantage to amplify different genomic region (if a mismatch will occur for one of the regions).
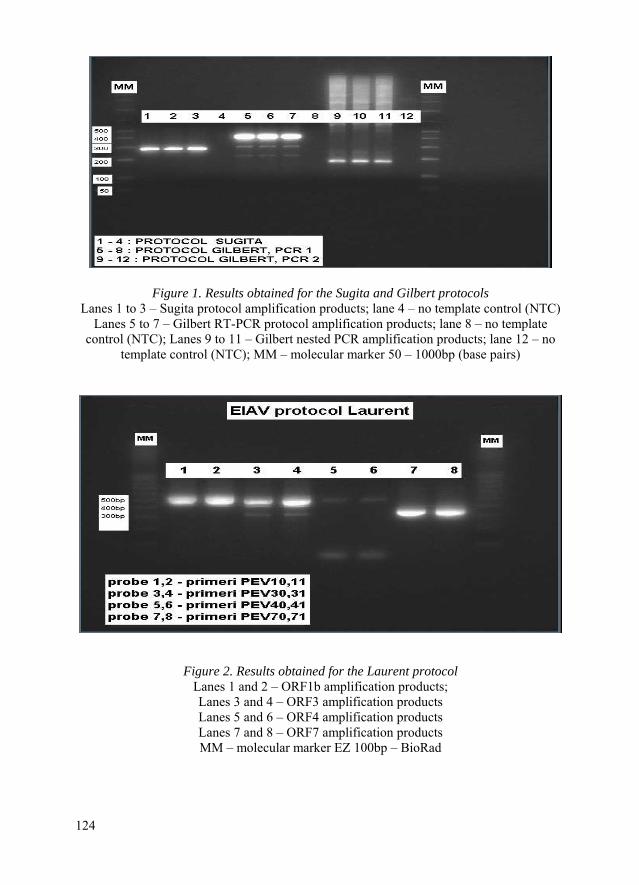
Figure 1. Results obtained for the Sugita and Gilbert protocols Lanes 1 to 3 – Sugita protocol amplification products; lane 4 – no template control (NTC)
Lanes 5 to 7 – Gilbert RT-PCR protocol amplification products; lane 8 – no template control (NTC); Lanes 9 to 11 – Gilbert nested PCR amplification products; lane 12 – no
template control (NTC); MM – molecular marker 50 – 1000bp (base pairs)
Figure 2. Results obtained for the Laurent protocol Lanes 1 and 2 – ORF1b amplification products; Lanes 3 and 4 – ORF3 amplification products Lanes 5 and 6 – ORF4 amplification products Lanes 7 and 8 – ORF7 amplification products MM – molecular marker EZ 100bp – BioRad
124
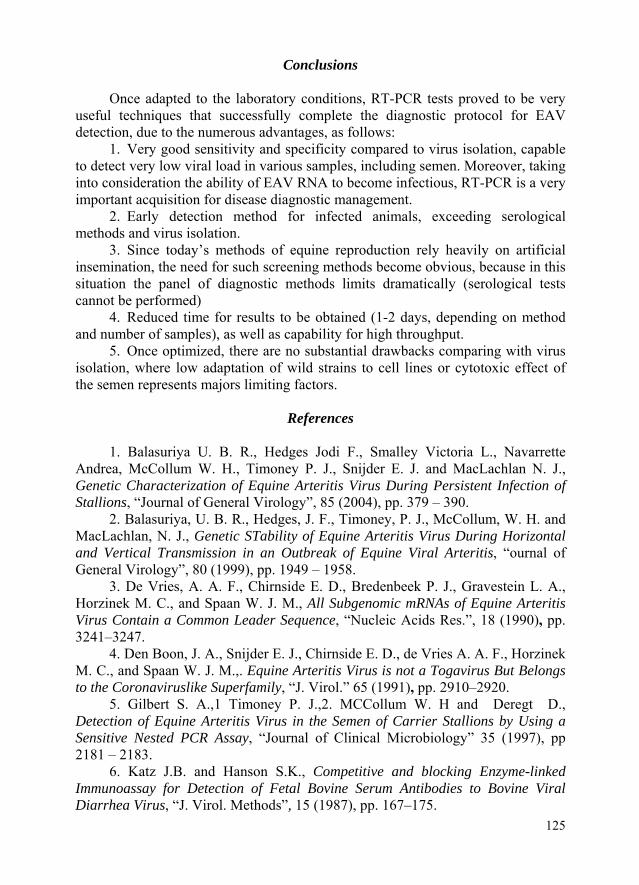
125
Conclusions Once adapted to the laboratory conditions, RT-PCR tests proved to be very
useful techniques that successfully complete the diagnostic protocol for EAV detection, due to the numerous advantages, as follows:
1. Very good sensitivity and specificity compared to virus isolation, capable to detect very low viral load in various samples, including semen. Moreover, taking into consideration the ability of EAV RNA to become infectious, RT-PCR is a very important acquisition for disease diagnostic management.
2. Early detection method for infected animals, exceeding serological methods and virus isolation.
3. Since today’s methods of equine reproduction rely heavily on artificial insemination, the need for such screening methods become obvious, because in this situation the panel of diagnostic methods limits dramatically (serological tests cannot be performed)
4. Reduced time for results to be obtained (1-2 days, depending on method and number of samples), as well as capability for high throughput.
5. Once optimized, there are no substantial drawbacks comparing with virus isolation, where low adaptation of wild strains to cell lines or cytotoxic effect of the semen represents majors limiting factors.
References
1. Balasuriya U. B. R., Hedges Jodi F., Smalley Victoria L., Navarrette
Andrea, McCollum W. H., Timoney P. J., Snijder E. J. and MacLachlan N. J., Genetic Characterization of Equine Arteritis Virus During Persistent Infection of Stallions, “Journal of General Virology”, 85 (2004), pp. 379 – 390.
2. Balasuriya, U. B. R., Hedges, J. F., Timoney, P. J., McCollum, W. H. and MacLachlan, N. J., Genetic STability of Equine Arteritis Virus During Horizontal and Vertical Transmission in an Outbreak of Equine Viral Arteritis, “ournal of General Virology”, 80 (1999), pp. 1949 – 1958.
3. De Vries, A. A. F., Chirnside E. D., Bredenbeek P. J., Gravestein L. A., Horzinek M. C., and Spaan W. J. M., All Subgenomic mRNAs of Equine Arteritis Virus Contain a Common Leader Sequence, “Nucleic Acids Res.”, 18 (1990), pp. 3241–3247.
4. Den Boon, J. A., Snijder E. J., Chirnside E. D., de Vries A. A. F., Horzinek M. C., and Spaan W. J. M.,. Equine Arteritis Virus is not a Togavirus But Belongs to the Coronaviruslike Superfamily, “J. Virol.” 65 (1991), pp. 2910–2920.
5. Gilbert S. A.,1 Timoney P. J.,2. MCCollum W. H and Deregt D., Detection of Equine Arteritis Virus in the Semen of Carrier Stallions by Using a Sensitive Nested PCR Assay, “Journal of Clinical Microbiology” 35 (1997), pp 2181 – 2183.
6. Katz J.B. and Hanson S.K., Competitive and blocking Enzyme-linked Immunoassay for Detection of Fetal Bovine Serum Antibodies to Bovine Viral Diarrhea Virus, “J. Virol. Methods”, 15 (1987), pp. 167–175.
7. McCollum, W. H. and Timoney, P. J., Experimental Observation on the Virulence of Isolates of Equine Arteritis Virus, “Equine Infectious Diseases” VIII (1999), pp. 558–559.
8. Neaton H.J., Which BVD Vaccine Should I use? “Vet. Med”., 81(1986), pp. 876–881.
9. Niskanen R., Alenius S., Belak K., Baule C., Belak S., Voges H. and Gustafsson H., Insemination of Susceptible Heifers with Semen from a Non-viraemic bull with Persistent Bovine Virus Diarrhoea Virus Infection Localized in the Testes, “Reprod. Domest. Anim”., 37 (2002), pp. 171–175.
10. OIE Manual of Diagnostic Tests and Vaccines for Terrestrials Animals 2009, Volume 2, chapter 2.4.8.
11. St-Laurent G., Morin G. and Archambault D., Detection of Equine Arteritis Virus following Amplification of Structural and Nonstructural Viral Genes by Reverse Transcription-PCR, “Journal of Clinical Microbiology” 32 (1994), pp. 658 – 665.
12. Sugita S., Imagawa H., Wada R., Fukunaga Y., RT-PCR Detection of Ecquine Arteritis Virus From Various Samples of an Experimentally Infected Pregnant Mare, “Journal of Equine Science”, 8 (1997), pp. 29 – 33.
13. Timoney, P. J. and McCollum, W. H., Equine Viral Arteritis, “Vet Clin North Am Equine Pract”, 9 (1993), pp. 295–309.
14. Timoney, P. J., McCollum, W. H., Roberts, A. W. and Murphy, T. W., Demonstration of the Carrier State in Naturally Acquired Equine Arteritis Virus Infection in the Stallion, “Res. Vet. Sci.”, 41 (1986), pp. 279 – 280.
126

127
PRELIMINARY RESULTS REGARDING BOVINE VIRAL DIARRHEA VIRUS EPIDEMIOLOGY IN ROMANIAN WILD BOARS
M.A. TURCITU1, Gh. BĂRBOI1, V. VUŢĂ1, Lenuţa ZAMFIR1, Handan
COSTE1, D. BONCEA1 [email protected]
Abstract
Bovine viral diarrhea is an important infectious disease of the
cattle due to the specific nature of virus epidemiology and pathogenesis together with economical losses that follows a herd infection. It belongs to the Pestivirus genus that comprises three important veterinary pathogens: bovine viral diarrhea virus (BVDV), border disease virus (BDV) and classical swine fever virus (CSFV). Pestiviruses are, however, able to cross species barriers to infect a wide range of hosts within the Artiodactyla. This conclusion is mainly based on serological investigations, where pestivirus-specific antibodies have been detected in a wide variety of species.
For this study, a number of 32 wild boars pooled samples originated from two counties were initially analyzed for pestiviruses genome detection using conventional RT-PCR; all positive samples were subjected afterwards to real time RT-PCR for BVDV identification. Results obtained showed 9 positive cases for pestivirus and consequently BVDV genome detection, suggesting a rather high incidence of infection, at least for the counties being analyzed. Thus, with the implementation of molecular techniques for virus genome identification, rapid and accurate antigen surveillance can be made, providing direct proofs regarding the role of this species as reservoir for pestiviruses in general and BVDV in particular, as well as individual status, being able to identify the carrier animals.
Keywords: BVDV, wild boar population, virus reservoir
Introduction Classical swine fever virus (CSFV), bovine viral diarrhea virus (BVDV) and
border disease virus (BDV) belong to the genus Pestivirus in the Flaviviridae family (2). Only CSF has been classified as a disease notifiable to the OIE. CSFV
1 Institute for Diagnosis and Animal Health, Dr. Staicovici No63, district 5,
Bucharest.

128
infections occur only in domestic pigs and wild boar, and lead to classical swine fever, which is often lethal and is characterized by high fever, lethargy, yellow diarrhea and skin lesions at ears, abdomen and legs.
BVDV infections occur primarily in cattle, causing fever, diarrhea, decreased milk production and reproductive problems and in some cases severe mucosal disease. Although the nomenclature suggests species specificity, BVDV is capable of infecting pigs and sheep (11, 15). BVDV interspecies transmission to pigs commonly requires direct contact with cattle (8) and although some have claimed that transmission of BVDV among pigs does not occur (3), the actual transmission ratio in pigs still remains unclear (14).
Because BVDV and CSFV are very closely related, pigs infected with BVDV show a certain degree of clinical protection against classical swine fever. This clinical protection has been repeatedly described (1, 4, 9, 10), and although the risk of CSF virus excretion in BVDV infected pigs has been discussed (5, 6), CSF transmission studies in BVDV infected pigs have not yet been reported.
In Romania, so far there are little data regarding the status of wild boar population for BVDV, the vast majority of the studies being focused on serological investigation (12). However, to our knowledge, there are no literature data regarding virus isolation or other methods of virus identification, so the effective role of wild boar as virus carrier has not been yet documented. Therefore, through the preliminary data obtained using molecular biology for genome identification, this study can give the researchers an insight on the actual situation.
Material and methods
Biological samples were represented by 32 wild boar organs pooled samples
(spleen, lymph nodes, tonsils) originated from Buzău and Giurgiu counties, during the hunting seasons from January 2008 to January 2009. Initial preparation consists of mechanical tissue disruption using MagNa Lyzer Instrument (Roche Applied Science), with 10mg of sample resuspended in 800μl of PBS (1X phosphate buffer saline). After homogenization, samples were centrifuged at 13.000rpm for 1 minute to obtain the supernatant.
RNA extraction was performed using commercially available kits – RNeasy Mini Kit (Qiagen, Omnivet) following manufacturer recommendations, with 200μl of sample supernatant. The nucleic acid was eluted in a final volume of 50μl.
Revers transcription and amplification was initially performed using primers that amplify all members of the genus (12), located on 5’ NTR region (non translated region), a well conserved region among Pestiviruses. Enzymatic reactions were performed with “one step” technology, using commercial kits – OneStep RT-PCR Kit (Qiagen, Omnivet) and Superscript III with Platinum Taq (Invitrogen, Medist Life Science).
All positive samples were tested afterward for CSFV (classical swine fever virus), BVDV and BDV (border disease virus). For BVDV, a real time TaqMan RT-PCR protocol was used (7), with primers and probes spanning for 5’NTR region. All enzymatic reactions were performed with “one step” technology, using commercial kits – OneStep RT-PCR Kit (Qiagen, Omnivet) (Figure 1).

Electroforesis: For the pestivirus protocol, the amplification products were loaded into an agarose 1,5% gel stained with ethidium bromide for UV visualisation. Migration was performed using 1X TBE buffer (Figure 2).
Figure 1. Amplification curves obtained for laboratory BVDV standard; the reaction was initially performed to asses sensitivity using serial ten fold dilution from the BVDV standard
Figure 2. Results obtained for the pestivirus protocol Lane 1 – 100bp molecular marker;
Lanes 2 to 9 (numbers 32 to 39 on photo) – amplification products Lane 10 – no template control (NTC)
Lane 11 - positive standard
Result and discussions From the total number of 32 samples, 9 were found positive for pestivirus
RT-PCR; further tests for the BVDV performed on those samples showed that all of pestivirus positive samples gave the same result for this particular pathogen (BVDV positive).
129

130
Although the study is not comprehensive, the results obtained showed a rather high incidence of infected animals (28.12%), at least for the two counties investigated; this situation show the importance of the wild boar in the epidemiology of BVDV, since it clearly states the role of carrier for this particular virus, which, corroborated with the traditional system of cattle raising (free range growing system) increases the possibilities for the herds to become infected. Moreover, this situation could lead to the possibility for the wild ruminants to become infected, since they share the same habitat with the wild boars so virus transmission becomes possible. Nevertheless, this situation remains to be further investigated for both of the hypotheses.
Another matter that worth being discussed is the possibility of BVDV virus to show a certain degree of clinical protection against classical swine fever virus, since those two viruses are so closely related. This suspicion is further emphasized by the fact that, so far, CSF transmission studies in BVDV infected pigs have not yet been reported; also, from all the 9 samples found positive for pestiviruses, neither showed positive results for CSFV (again, it is true that this finding need more sustainable results, from a significant number of samples and perhaps counties, but could be a starting point for further analysis).
Conclusions
Through the results obtained, for the first time in Romania, the hypothesis of
wild boar population as being reservoir and consequently carrier for BVDV has been made possible by direct antigen detection (genome identification). However, it remains to further analyze samples from the other counties and perhaps in a more representative number to have solid evidence about this matter.
References
1. Atkinson G.F., Baker J.A., Campbell C., Coggins L., Nelson D., Robson
D., Sheffy B.E., Sippel W. and Nelson S., Bovine Virus Diarrhea (BVD) Vaccine for Protection of Pigs Against hog Cholera, “Proceedings of the Annual Meeting of the United States Livest”, vol. 66 (1962), pp. 326–388.
2. Becher P., Ramirez R.A., Orlich M., Rosales S.C., König M., Schweizer M., Stalder H., Schirrmeier H. and Thiel H.J., Genetic and Antigenic Characterization of Novel Pestivirus Genotypes: Implications for Classification, “Virology”, 311 (2003), pp. 96–104.
3. Beckenhauer W.H., Brown A.L., Lidoph A.A. and Norden C.J., Immunization of Swine Against hog Cholera with a Bovine Entrero Virus, “Vet. Med”. 56 (1961), pp. 108–112.
4. Castrucci G., Torlone V., Cilli V., Titoli F. and Valente C., The Capacity of Strain TVM2 of Bovine Viral Diarrhea (BVD) Virus, at Different Passage Level in cell Culture, to Protect Pigs Against hog Cholera (HC) Virus, “Boll. Ist. Sieroter. Milan.”, 52 (1973), pp. 85–88.

131
5. Dahle J., Schagemann G., Moennig V.and Liess B., Clinical Virological and Serological Findings after Intranasal Inoculation of pigs with Bovine Viral Diarrhoea Virus and Subsequent Intranasal Challenge with hog Cholera Virus, “J. Vet. Med.”, B 40 (1993), pp. 46–54.
6. Dahle J., Patzelt T., Schagemann G.and Liess B., Antibody Prevalence of hog Cholera, Bovine Viral Diarrhoea and Aujeszky's Disease Virus in wild Boars in Northern Germany, “Dtsch tierärtzl Wschr”, 100 (1993), pp. 301–340.
7. Letellier C. and Kerkhofs P., Real-time PCR for Simultaneous Detection and Genotyping of Bovine Viral diaRrhea Virus, “Journal of Virological Methods”, 114 (2003), pp.21–27.
8. Paton D.J., Simpson V.and Done S.H., Infection of Pigs and cattLe with Bovine Viral Diarrhoea virus on a farm in England, “Vet. Rec.”, 131 (1992), pp. 185–188.
9. Sheffy B.E., Coggins L.and Baker J.A., Protection of Pigs Against hog Cholera with Virus Diarrhea Virus of Cattle, “Proceedings of the Annual Meeting of the United States Livest”, vol. 65 (1961), pp. 347–353.
10. Simonyi E.and Biró J., Immunization Experiments Against hog Cholera with the Bovine Viral Diarrhoea Virus Strain Oregon C24V, “Act. Vet. Aca. Sci. Hung. Tomus”. 17 (1967) (I), pp. 55–62.
11. Terpstra C. and Wensvoort G., Natural Infection of Pigs with Bovine Viral Diarrhoea Virus assocIated with signs Resembling Swine Fever, “Res. Vet. Sci”., 45 (1988), pp. 137–142.
12. Vilcek S., Stadejek T., Ballagi-Pordany A., Lowings J. P., Paton D.J., Belak S., Genetic Variability of Classical Swine Fever Virus, “Virus Research”, 43 (1996), pp 137 - 147S.
13. Vuţă V., Bărboi Gh., Olvedi Irina, Nicolae St., Leau Simona, Zamfir Lenuta, Boncea D., Mihai I. And Sandu Alina, The Presence of Antibodies to Aujeszky’s Disease, Bovine Viral Diarrhea and Porcine Reproductive and Respiratory Syndrome in wild boars. Preliminary data, “Romanian Magazine of Veterinary Medicine”, No1/2009, pp75 – 82.
14. Wieringa-Jelsm T., Quak S. and Loeffen W.L.A., Limited BVDV Transmission and full Protection Against CSFV Transmission in Pigs Experimentally Infected with BVDV type 1b, “Veterinary Microbiology”, Volume 118 (2006), pp 26 – 36.
15. Zupancic Z., Jikic B., Lojkic M., Cac Z., Jemersic L.and Staresina V., Prevalence of Antibodies to Classical Swine Fever Aujeszky's Disease Porcine Reproductive and Respiratory Syndrome and Bovine Viral Diarrhoea Viruses in wild Boars in Croatia, “J. Ved. Med. B Infect. Dis. Vet. Public Health”, 49 (2002) (5), pp. 253–256.

132 132
133
ETIOLOGY AND DIAGNOSIS OF ENDOMETRITIS STUDIES ON THE BITCH
P. GRIGORESCU , A. SALLAY , D.TURCU1 1 1
email: [email protected]
Abstract
Inflammatory diseases of the uterus in the bitch are commonly found in cases at the Clinic of Reproduction, Obstetrics and Gynecology, the most common sexual diseases in this species. Because the etiology of these disorders in the bitch is not fully elucidated, it was necessary to perform this study.
However, from the etiological point of view, to the emergence of endometritis in the bitch behind an endocrine disorder acting on a background of permissiveness uterus to progesterone action. Because alternating estrogen dominance, followed by a longer period of dominance of progesterone reaches cystic degeneration of endometrial glands. This change induces the appearance of pyometra mucus in uterus. The disease onset occurs at the beginning metestrus or about three months of estrus. Endometritis were also found in specimens treated with estrogen to avoid implantation or fecundation after misalliance or unwanted matings.
Other females were applied during treatment with progestagens, to control oestrus, which has led to pyometra.
Materials and methods
This study was conducted during March 2009 - March 2010 on 15 bitches of
different breeds and ages 4 to 12 years. In females investigated there were found the following clinical signs: anorexia, sad facies, fever, ventricular tachycardia, polydipsia, weakness, distension and abdominal pain. Clinical diagnosis was confirmed by ultrasound examination.
Materials
The materials used were represented by: – Medicinal substances to induce anesthesia; – Surgical kits; – Suture materials;
1 Faculty of Veterinary Medicine, Spiru Haret University, Bucharest, Romania.

– Consumable materials and substances; – Antibiotics; – Culture media; – Thermostatic; – Materials and glassware; – Microscope, etc.
Working Methods All females diagnosed with endometritis were presented and applied
ovariohisterectomia. Intraoperative were taken samples from pathological uterine secretions. These secretions were sown on culture medium and then developed bacterial colonies were identified and individualized.
Results and Discussions
Results
The 15 cases studied belonged to bitches of many breeds: – 5 cases common breed; – 3 cases of German shepherd; – 3 cases Spaniel cocker; – 2 cases Irish setter; – 1 case boxer; – 1 case teckel.
rasă comunăciobănesc germancocker spanielsetter irlandezboxer
teck
el
Graph I Age distribution was as follows: – 4-6 years → 2 cases; – 6-8 years → 6 cases; – 8-10 years → 4 cases; – 10 to 12 years → 3 cases
134
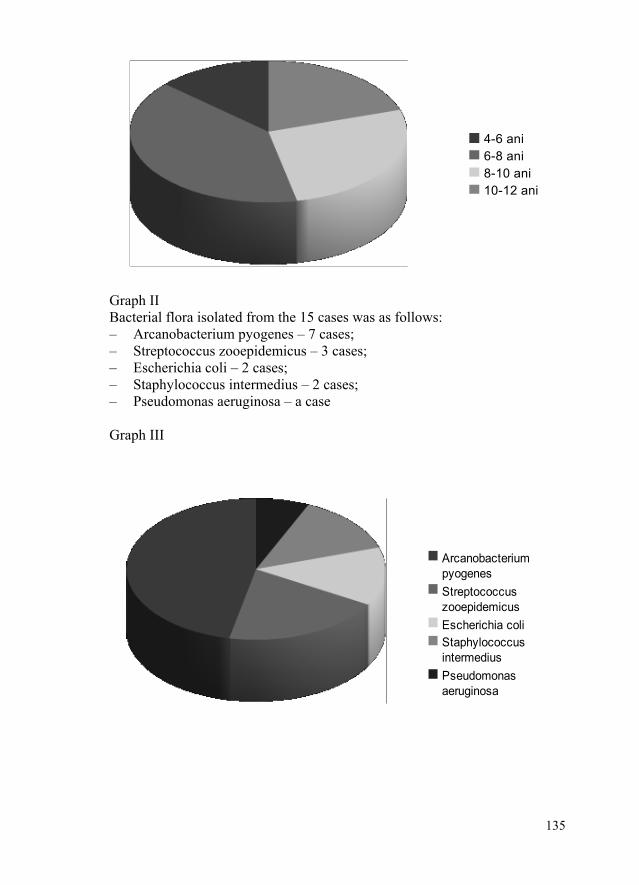
4-6 ani6-8 ani8-10 ani10-12 ani
Graph II Bacterial flora isolated from the 15 cases was as follows: – Arcanobacterium pyogenes – 7 cases; – Streptococcus zooepidemicus – 3 cases; – Escherichia coli – 2 cases; – Staphylococcus intermedius – 2 cases; – Pseudomonas aeruginosa – a case Graph III
Arcanobacterium pyogenesStreptococcus zooepidemicusEscherichia coliStaphylococcus intermediusPseudomonas aeruginosa
135
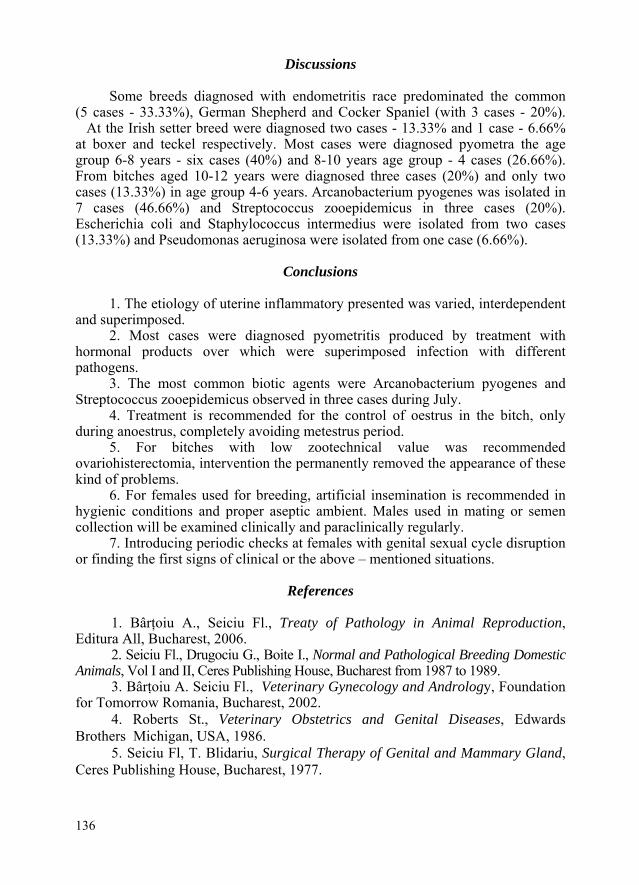
136
Discussions
Some breeds diagnosed with endometritis race predominated the common (5 cases - 33.33%), German Shepherd and Cocker Spaniel (with 3 cases - 20%). At the Irish setter breed were diagnosed two cases - 13.33% and 1 case - 6.66% at boxer and teckel respectively. Most cases were diagnosed pyometra the age group 6-8 years - six cases (40%) and 8-10 years age group - 4 cases (26.66%). From bitches aged 10-12 years were diagnosed three cases (20%) and only two cases (13.33%) in age group 4-6 years. Arcanobacterium pyogenes was isolated in 7 cases (46.66%) and Streptococcus zooepidemicus in three cases (20%). Escherichia coli and Staphylococcus intermedius were isolated from two cases (13.33%) and Pseudomonas aeruginosa were isolated from one case (6.66%).
Conclusions
1. The etiology of uterine inflammatory presented was varied, interdependent
and superimposed. 2. Most cases were diagnosed pyometritis produced by treatment with
hormonal products over which were superimposed infection with different pathogens.
3. The most common biotic agents were Arcanobacterium pyogenes and Streptococcus zooepidemicus observed in three cases during July.
4. Treatment is recommended for the control of oestrus in the bitch, only during anoestrus, completely avoiding metestrus period.
5. For bitches with low zootechnical value was recommended ovariohisterectomia, intervention the permanently removed the appearance of these kind of problems.
6. For females used for breeding, artificial insemination is recommended in hygienic conditions and proper aseptic ambient. Males used in mating or semen collection will be examined clinically and paraclinically regularly.
7. Introducing periodic checks at females with genital sexual cycle disruption or finding the first signs of clinical or the above – mentioned situations.
References
1. Bârţoiu A., Seiciu Fl., Treaty of Pathology in Animal Reproduction,
Editura All, Bucharest, 2006. 2. Seiciu Fl., Drugociu G., Boite I., Normal and Pathological Breeding Domestic
Animals, Vol I and II, Ceres Publishing House, Bucharest from 1987 to 1989. 3. Bârţoiu A. Seiciu Fl., Veterinary Gynecology and Andrology, Foundation
for Tomorrow Romania, Bucharest, 2002. 4. Roberts St., Veterinary Obstetrics and Genital Diseases, Edwards
Brothers Michigan, USA, 1986. 5. Seiciu Fl, T. Blidariu, Surgical Therapy of Genital and Mammary Gland,
Ceres Publishing House, Bucharest, 1977.

137
EPIDEMIOLOGICAL ASPECTS OF THE TOXOPLASMOSIS DISEASE IN HUMANS, BETWEEN 2000-2005 IN BUCHAREST
Adriana AMFIM1, Violeta – Elena SIMION1, Monica PÂRVU1,
Abstract
At the moment, we are dealing with zoonosis globally, for their impact. On general human health becomes a serious issue, with a high economical input as well. Internationally, we have found toxoplasmosis to have a 30% prevalence in children and youth (Cretu, 2005) between 10-19 years of age, to what it’s regarding the congenital toxoplasmosis we’ve found that variations will differ from a country to another, with direct correlation between the registered number of anti pregnancy tests that was registered and the methods of prevention applied.
The purpose of this staty is to setting the dynamics of toxoplasmosis incidence at human, in Romania for the determined period. In the same time will be determined the category of age with the highest risk of contamination with T. gondii.
We’ve used all the data base offered by the National Centre of Insurance of the Informational System of the Health Department, Bucharest, Romania. The deta base was represented by the registered number of sick cases, between the years 2000-2005, in Bucharest, only through the reports the general practitioners offered us, with the help of the reports sent by the speciality ambulatories. One of the criteria on which the epidemiological evaluation was conducted was the age of the subjects involved, hence 4 categories were chosen, (under one year of age, between 1-14 years, 15-64, and over 64 years of age).
The operational working method was the retrospective analisys, based on analitic investigations and with statistic remaking of data, obtained from quantitative operational researches of epidemiological parameters (incidence).
The category of age with the highest risk of contamination was chosen from the age between 15-64 years and the year with the maximum incidence was 2001( 138 new cases).
Keywords: toxoplasmosis, zoonosis, epidemiological, incidence
1 Faculty of Veterinary Medicine, University Spiru Haret, Bucharest, Romania.
138
Introduction Toxoplasmosis is a zoonosis caused by the protozoan parasite Toxoplasma
gondii, present in all geographical areas either in an acquired form or as congenital form. The most common forms are incospicuous (asymptomatic), however the frequency of clinical manifestations vary between 20-80% (2).
The incidence and prevalence around the world have different values, either because the disease is not reported in all countries or because of effective methods of diagnosis, treatment and prevention which make the disease be prevented, diagnosed and treated efficiently.
In Romania, toxoplasmosis in humans is a parasitic zoonosis with different values of incidence by source of supply of statistical data and methods of making epidemiological survey. Such high incidence is reported in the persons who have direct contact with the animals according to their profession (veterinarians, zootechnicians, breeders, etc) (6)
For Romania, some data indicate the incidence divided by gender as having high values for women (39.5%). Most new cases reported annually were reported: Bucharest City (76 cases/2000; cases/2001 138, 136 cases/2002), Mureş (68 cases/2000; cases/2001 73, 41 cases/2002) Timiş County (32 cases/2000; cases/2001 25, 25 cases/2002) etc (1).
Worldwide prevalence of toxoplasmosis is set to values between 4.3% -90%. In France, the Netherlands and Germany, disease prevalence reaches 80% and South Korea is only 4.3% prevalence. For France, Turkey, Brazil and Central America, seroprevalence is 90% in people over 40 years (2). In England, the prevalence is 16-40% and in South America, prevalence is higher (50-80%) (4). Sex distribution of disease has led Iran to establish a value for the prevalence higher in women (71.1%) compared with 61.91% in men, 70% in Poland, 58% in France, 77.1% in Turkey (1).
Disease prevalence varies according to age, with values of 30% in persons 10-19 years and people over 20 years (2). Also for women of childbearing potential, disease prevalence is meant to 85% and annual casuistry congenital toxoplasmosis cases is 400 to 4000 cases per calendar year (3)
Depending on the immune status it is considered that in the U.S. about 10% of HIV patients who contracted T. gondii and 30% in Europe die. In Europe as in Africa, the seroprevalence rate in people infected with HIV is 50-78% (5).
Material and methods
This study was conducted to monitor the health of human population in
Bucharest in a specified time period (2000 - 2005) in the incidence of toxoplasmosis, using two sources of data provision. The study was the number of new cases of toxoplasmosis in humans during 2000-2005, reported by family practitioners and specialist outpatient Bucharest. Centralization of data was made at the National Center for Organization and Information System and Information Assurance in Health in Bucharest.

139
Mode consisted of a survey of descriptive epidemiology using transversal descriptive study, with applications in assessing and monitoring the health of human population between 2000 to 2005.
In carrying out epidemiological investigation the following objectives have been established:
1.Selection of data sources; 2. Preparation of the database; 3. Establishment of criteria by which to make interpretation of data; 4. Analysis and statistical processing of data; 5. Dissemination of results. 1. Selection of data sources was consistent with this model in descriptive
epidemiological investigation. It took so only data sources provided by secondary care (family offices / outpatient specialist) using medical records. Centralization of data was made by a national body empowered under Art. 108 of the Romanian Constitution, republished, art. 14 and art. 43 para. (2) of Law no. 95/2006, represented by the National Center for Organization and Information System and Information Assurance in Health, Bucharest, Romania.
2. In preparing the database the following steps have been taken: evaluation of data for monitoring the human population in Bucharest
toxoplasmosis throughout 6 years; data collection; entering data into the database; data management
3.The criteria according to which the database have been processed: epidemiological index to assess the epidemiological situation (incidence or
frequency of new cases of toxoplasmosis in humans); sources reporting new cases of disease (family offices and outpatient
specialist); temporal distribution of disease (time with established scope - 2000 to
2005); measurement of disease distribution by age (less than one year, 1-14 years,
15 to 64, over 64). 4. Data analysis was done using descriptive variables such quantity – the
incidence of toxoplasmosis in the human population per calendar year, age group and source of data reporting. It was obtained by comparing the incidence of new cases of disease occurring each year from 100,000 during the study. Most convenient summary format and presentation of data was by frequency distribution charts (line graphs, chart structure, Chart, Scatter Diagram, etc.). Epidemiological Analysis of toxoplasmosis in humans was done by linking incidence data with calendar period, age group and compared the two reporting sources.
5. Dissemination of results may be in the form of reports aimed to provide knowledge and raise awareness of health problems in humans.
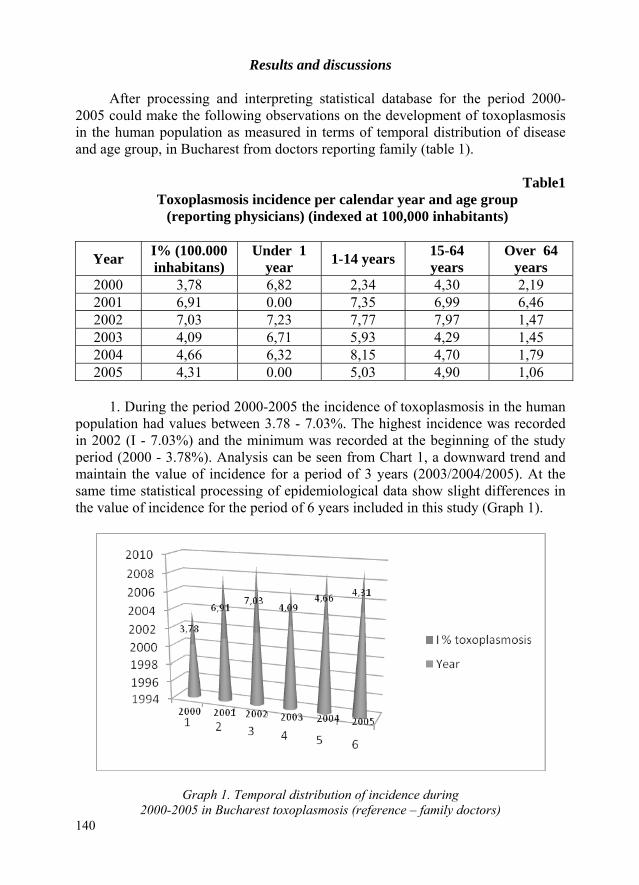
Results and discussions After processing and interpreting statistical database for the period 2000-
2005 could make the following observations on the development of toxoplasmosis in the human population as measured in terms of temporal distribution of disease and age group, in Bucharest from doctors reporting family (table 1).
Table1
Toxoplasmosis incidence per calendar year and age group (reporting physicians) (indexed at 100,000 inhabitants)
Year I% (100.000 inhabitans)
Under 1 year 1-14 years 15-64
years Over 64
years 2000 3,78 6,82 2,34 4,30 2,19 2001 6,91 0.00 7,35 6,99 6,46 2002 7,03 7,23 7,77 7,97 1,47 2003 4,09 6,71 5,93 4,29 1,45 2004 4,66 6,32 8,15 4,70 1,79 2005 4,31 0.00 5,03 4,90 1,06
1. During the period 2000-2005 the incidence of toxoplasmosis in the human
population had values between 3.78 - 7.03%. The highest incidence was recorded in 2002 (I - 7.03%) and the minimum was recorded at the beginning of the study period (2000 - 3.78%). Analysis can be seen from Chart 1, a downward trend and maintain the value of incidence for a period of 3 years (2003/2004/2005). At the same time statistical processing of epidemiological data show slight differences in the value of incidence for the period of 6 years included in this study (Graph 1).
Graph 1. Temporal distribution of incidence during 2000-2005 in Bucharest toxoplasmosis (reference – family doctors)
140

2. Value of toxoplasmosis incidence correlated with patient age and reported per calendar year ranged as it follows (Graph 2).
Graph 2. Measurement of distribution of toxoplasmosis incidence in the period 2000-2005, according to age (reporting – family physicians)
For the year 2000 the population segment most affected was that of
children aged under one year (I - 6.82%), while for children aged 1-14 years was minimal incidence value (I-2.34% ) (graph 2);
For the year 2001 the most affected segment of the population was that of children aged 1-14 years (I-7.35%) and for children under one year the amount of toxoplasmosis incidence was 0.00%;
For 2002 it was observed a lower incidence between 1.47% for people over 64 years and 7.97% (maximum) for the age group 15-64 years;
In 2003 the population segment most affected was that of children aged under one year (I - 6.71%);
The highest incidence was recorded in 2004 by the age group of 1-14 years (I - 8.15%);
In 2005, the age group – children under one year – in Bucharest, there were no new cases of disease, the incidence being 0.00%, although during the previous years (2000, 2003) for the same segment it showed maximum population toxoplasmosis. For this year, the most affected age group was that of children of 1-14 years (Chart 2).
Similarly to the statistics reported by family physicians, it has been worked epidemiological database for information reported by outpatient specialty. The epidemiological analysis established the following (table 2).
141

Table 2 Toxoplasmosis incidence per calendar year and age group (hospital specialist)
(indexed at 100,000 inhabitants)
Year Total under 1 year 1-14 years 15-64
years over 64
years 2000 1.14 0.00 3.90 0.75 0.73 2001 10.56 6.58 3.09 10.26 13.64 2002 23.93 7.23 10.79 26.87 20.62 2003 11.03 0.00 5.93 12.88 6.17 2004 10.58 0.00 7.19 11.64 8.26 2005 1.14 0.00 2.51 1.19 0.00
1. During the period 2000-2005 the incidence of toxoplasmosis in the human
population, after reporting specialty ambulatory, had values between 1.14 - 23.93%. The highest incidence was recorded in 2002 (I - 23.93%), and the minimum value was recorded as the beginning of the study period (2000 - 1.14%) and at the end of the period (2005 - 1.14%). The graphic analysis of the 2 shows a major difference between the values by reference to the beginning and end of study for which the incidence is 1.14% compared with the maximum recorded in 2002 (I - 23.93%) (Graph 3).
Graph 3. Temporal distribution of toxoplasmosis incidence in the period 2000-2005, in Bucharest (reporting – hospital specialist)
2. Value of toxoplasmosis incidence correlated with age of patients reported
per calendar year according to data provided by specialist doctors in hospital, ranged as it follows (Graph 4).
142
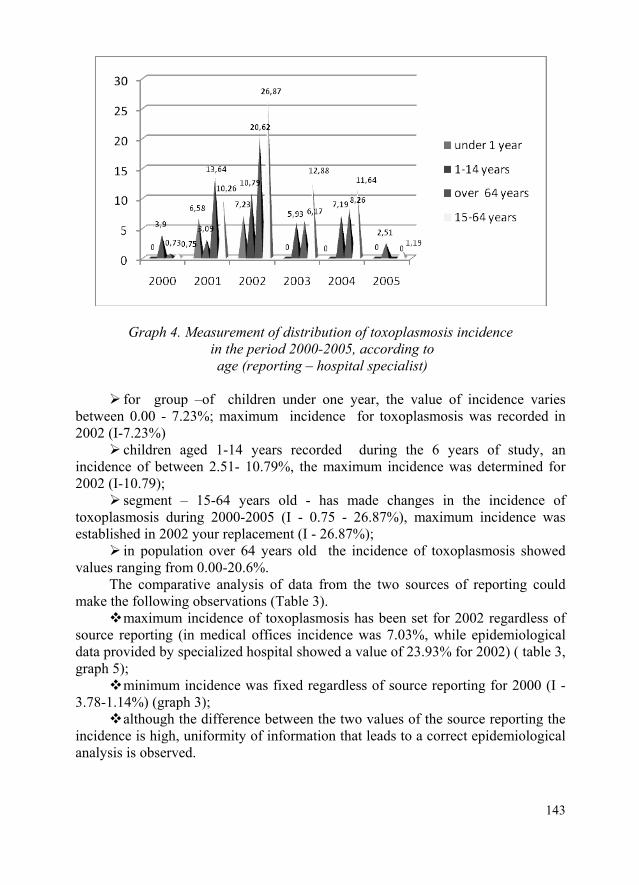
Graph 4. Measurement of distribution of toxoplasmosis incidence in the period 2000-2005, according to age (reporting – hospital specialist)
for group –of children under one year, the value of incidence varies
between 0.00 - 7.23%; maximum incidence for toxoplasmosis was recorded in 2002 (I-7.23%)
children aged 1-14 years recorded during the 6 years of study, an incidence of between 2.51- 10.79%, the maximum incidence was determined for 2002 (I-10.79);
segment – 15-64 years old - has made changes in the incidence of toxoplasmosis during 2000-2005 (I - 0.75 - 26.87%), maximum incidence was established in 2002 your replacement (I - 26.87%);
in population over 64 years old the incidence of toxoplasmosis showed values ranging from 0.00-20.6%.
The comparative analysis of data from the two sources of reporting could make the following observations (Table 3).
maximum incidence of toxoplasmosis has been set for 2002 regardless of source reporting (in medical offices incidence was 7.03%, while epidemiological data provided by specialized hospital showed a value of 23.93% for 2002) ( table 3, graph 5);
minimum incidence was fixed regardless of source reporting for 2000 (I - 3.78-1.14%) (graph 3);
although the difference between the two values of the source reporting the incidence is high, uniformity of information that leads to a correct epidemiological analysis is observed.
143

Table 3 Incidence of toxoplasmosis in Bucharest during 2000-2005 according to the
source reporting
Year I% toxoplasmosis (family doctors)
I% toxopasmosis (hospital specialist)
2000 3.78 1.14 2001 6.91 10.56 2002 7.03 23.93 2003 4.09 11.03 2004 4.66 10.58 2005 4.31 1.14
Graph 5. Comparative measurement of the distribution of toxoplasmosis incidence in the period 2000-2005, according to the source reporting
Conclusions
In the present study using epidemiological research such as descriptive
epidemiological investigation, it appears desirable to establish the frequency with which new cases of toxoplasmosis in humans appeared in Bucharest, in a period of time. Database for processing and interpretation of data obtained was made taking into account the temporal characteristic of the disease, measuring the distribution by age, different sources of reporting.
Statistical analysis of the database under study, as reported by the physicians, found that the most affected segment of the population was that of children aged under one year old and 1-14 years old, with values ranging incidence of
144

145
toxoplasmosis between 6.71 - 8.15%. At the same time over 64 years old the population of Bucharest shows the lowest risk of contamination with T.gondii (I - 1.06-6.46%) during 2000-2005. Maximum incidence of toxoplasmosis was established in 2000 (I -7.03%).
For the period 2000-2005, by reports made by outpatient specialty physicians, a maximum incidence for 2002 (I - 23.93%) was set. The highest risk of contamination with T. gondii was established for the population aged 15-64 years (I 0.75/26.87%), while children under one year present less risk of contracting disease (I 0.00-7.23%).
Regarding the maximum and minimum values of the incidence both family offices and specialized outpatient doctors established the same period of time, namely maximum values for 2002 (7.03-7.23%), and minimum values for 2000 (I 1.1-3.8%).
Distribution of disease according to age, however, is different depending on the source reporting. Age group – less than a year – has the highest incidence (as reported by family physicians) in reporting of medical specialty hospital for the period 2000-2005 the highest incidence was in people aged 15-64 years. Differences between data reported by two sources of reporting could be analyzed further by using other types of parasitic zoonoses monitoring of such investigations longitudinal epidemiological survey – retrospective cohort.
References
Antoniu, Silvia; Gonciarov, Magdalena, Incidenţa toxoplasmozei la om în
România şi pe plan mondial în ultimii 10 ani. „Revista Română de Parazitologie”, vol. XV, Nr. 2, pag. 143, 2005.
Creţu, Carmen, Parazitologie Medicală, Editura Univ. Carol Davila, Bucureşti, 2005.
Jones J., Adriana Lopez, Marianna Wilson. Congenital Toxoplasmosis, Centers for Disease Control and Prevention, Atlanta, Georgia Am Fam Physician 2003;67:2131-8,2145-6. Copyright© 2003 American Academy of Family Physicians.
Palmer, S.R. et al., Zoonoze, Editura Ştinţelor Medicale, 2005. ***Centers for Disease Control and Prevention, [email protected]. ***National Association of State Public Health Veterinarians Veterinary
Infection Control Committee, Compendium of Veterinary Standard Precautions: Zoonotic Disease Prevention in Veterinary Personnel, 2006.

146
147
RESEARCHES ABOUT ORCHIDECTOMY FOR MALE CATS AND DOGS
Laura Aneta TUDOR*, P. GRIGORESCU*
Email: [email protected]
Abstract
Orchidectomy represents a very important medical procedure considering the health of the pets. This research evaluated several secure and less traumatizing methods for this procedure, applied on male cats and dogs. For this study, 140 animals were examined (70 male cats and 70 dogs), anesthesized, subjected to surgery and observed post-surgery in order to evaluate their health status, according to the chosen method. From the total number of studied cases, only two dogs (both with a weight of more than 50 kg) suffered from a medium edema (and liquid accumulation), which needed draining of accumulated sero-sanguinolent content, Betadine application and antibiotic therapy prolongation.
Keywords: orchidectomy, cats, dogs, surgery
Introduction The evaluation of less traumatizing and secure methods for orchidectomy for
male cats and dogs; the evaluation by comparison of double or simple incision of the scrotum through orchidectomy (with a section of the interdartoic septum) and hemostasis through ligation of both testicular belts with resorbable wire in comparison to deferent channel knot along with vascular-nervous conduct.
This study was performed in the reproduction clinic of the Faculty of Veterinary Medicine (Spiru Haret University), during October 2008 and January 2010.
Materials and methods
The study comprised a comparison between minimal invasive techniques
considering the incision of scrotum bags separated incisions for each testicular lodge versus a single incision at scrotum bags basis, with interdartoic septum section and exposure of both testiculi through this unique incision, and also hemostasis methods of vascular-nervous belt (by transfix ligation with resorbable wire, or tied along with deferent channel; the only mention is that the section of both portions is made in the back of the tied part, at a distance of 0,5-1 cm). A total number of 140 animals (70 cats – male; and 70 dogs) was used for investigations.
* Faculty of Veterinary Medicine Bucharest, Romania.
148
Made in case of using transfix ligation with resorbable wires, Vicryl, Dexon and Sorbifil were used; anesthetic – neurolept-analgesics with Domitor/ Ketamine/ Antisedan or inhalation anesthetic with Isoflurane.
Considering the male cats, the scrotum remained sutureless in all cases, and in dogs we made a suture of scrotum bags with wires that were discarded after 8-10 days (in all cases). In 15 dogs and 20 male cats, biochemical blood tests were made, along with complete blood count and coagulation tests.
In biochemical tests, usual parameters were obtained, using Panel 1 (glucose, cholesterol, urea, bilirubin, GOT, GPT) and separated bands for amylasemy, creatinemy and creatinphosphokinazemy. Biochemical parameters (ARCKRAY device was used with this purpose) were comprised in the normal physiologic limits, with several exceptions, 3 dogs presenting high values of GPT (86, 91, 98); in these cases, the surgery was delayed for a period of three months, meanwhile liver-protecting treatments were followed (Liquid Hepato RX) and special food was administered (Hill’s L/D and Royal Canine - Hepatic).
After the surgery, in all the 140 cases existent, for a period of 3-5 days, an antibiotic treatment was applied, with large spectrum medicines like Synulox, Cobactan, Amoxi-kel;
The cases were monitored after surgery, each trimester. In 2 of the cases, at dogs, hyperthermia was observed, along with edema of
scrotum bags and sero-sanguinolent liquid accumulation. In all these cases, antibiotic therapy was prolonged with 1-3 days, considering the gravity of each particular case. Also, Betadine was applied on the area, which completed the general treatment.
None of the cases needed adjuvant therapy (therapy with fluids, therapy with vitamins, etc.), and all the animals recovered in maximum a week after the surgery.
Results and discussions
The healing was realized in minimal periods of time, with no post-surgery
complications, with 2 exceptions, at dogs (both with a weight of more than 50 kg), at which, post-surgery, a medium edema (and liquid accumulation) was observed, which needed draining of accumulated sero-sanguinolent content, Betadine application and antibiotic therapy prolongation.
Table 1
Comparative investigations about orchidectomy in male cats and dogs
Clinical cases C1 C2 C3 C4 C5
Results 38 32 21 23 26

05
10152025303540
Clinicalcases /
rank
C1 C2 C3 C4 C5
Comparative results between male cats and dogs orchidectomy
Series1Series2Series3
Figure 1 Orchidectomy is commonly performed on domestic animals not intended for
breeding. Domestic animals are usually castrated to avoid unwanted or uncontrolled reproduction. Methods of veterinary orchidectomy include instant surgical removal, the use of an elastrator tool to secure a band around the testicles that disrupts the blood supply, the use of a tool or emasculators to crush the spermatic cords and disrupt the blood supply, pharmacological injections and implants and immunological techniques to inoculate the animal against its own sexual hormones. In this practice an “open” orchidectomy refers to a castration in which the inguinal tunic is incised and not sutured. A “closed” one refers to when the procedure is performed so that the inguinal tunic is sutured together after incision.
Conclusions
The statistically interpretation of the data obtained during this study
conducted to the following conclusions: 1. The least traumatizing method for male cats was the simple paramedian
incision of interdartoic septum, and for dogs the unique perpendicular incision along the interdartoic axis, antescrotum;
2. It is recommended that these interventions should be used only on normoponderal animals, clinically and paraclinically healthy, in order to avoid any post-surgery complications.
149
150
References 1. Bojrab M.J., Ellison G.W., Slocum B., Current Techniques in Small
Animal Surgery, 1998. 2. Dean D. H.; Hiramoto R. N.; Ghanta V. K.; Hiramoto N. S.; Wall C. N,
Effects of Orchidectomy on Spleen Cell Mitogen Response and on the Thymus of Aged Mice, Experimental Aging Research, vol. 10, 2004, 204-209.
3. Haug Anna, Spydevold Øystein, Høstmark Arne T., Effect of Orchidectomy and Testosterone Substitution on Enzyme Activities and DNA Content in Rat Liver and Epididymal Fat, “International Journal of Biochemistry”, vol. 17, 1, 1985, pages 31-36.
4. Kirkham A.P.S., Kumar P., Minhas S., Freeman A.A., Ralph D.J., Muneer A., Allen C., Targeted Testicular Excision Biopsy: When and How Should We Try to Avoid Radical Orchidectomy?, Clinical Radiology, vol. 64, 12, 2009, pages 1158-1165.
5. Kumar P., Pati J., History of Orchidectomy – from Chronos to the Nobel Prize, European Urology Supplements, vol. 4, 3, 2005, page 240.
6. Lumb W.V., Jones E.W., Veterinary Anesthesia, Editions Lea & Febiger, Philadelphia.
7. Martin, Lucille; Siliart Brigitte; Dumon H., Nguyen P., Spontaneous Hormonal Variations in Male Cats Following Gonadectomy, “Journal of Feline Medicine and Surgery” (2006), 8, 309-314.
8. Moraillon R., Legeaz Y., Fourrier P., Lapeire C., Dictionnaire Pratique de Thérapeutique Canine et Féline, 2e édition revue et complétéé. Editions Masson, Paris, 1997.
9. Most W., van der Wee-Pals L., Ederveen A., Papapoulos S., Löwik C., Ovariectomy and Orchidectomy Induce a Transient Increase in the Osteoclastogenic Potential of Bone Marrow Cells in the Mouse Bone, vol. 20, 1997, pages 27-30.
10. Plunkett S.J., Emergency Procedures for the Small Animal Veterinarian, W.B. Saunders Company, Philadelphia, 1989.
11. Ramani V.A.C., Grey B.R., Addla S.K., Dunham M.P., Sangar V.K., Clarke N.W., Histological Outcome of Delayed Orchidectomy after Primary Chemotherapy for Metastatic Germ Cell Tumour of the Testis, Clinical Oncology, Volume 20, Issue 3, April 2008, Pages 247-252.
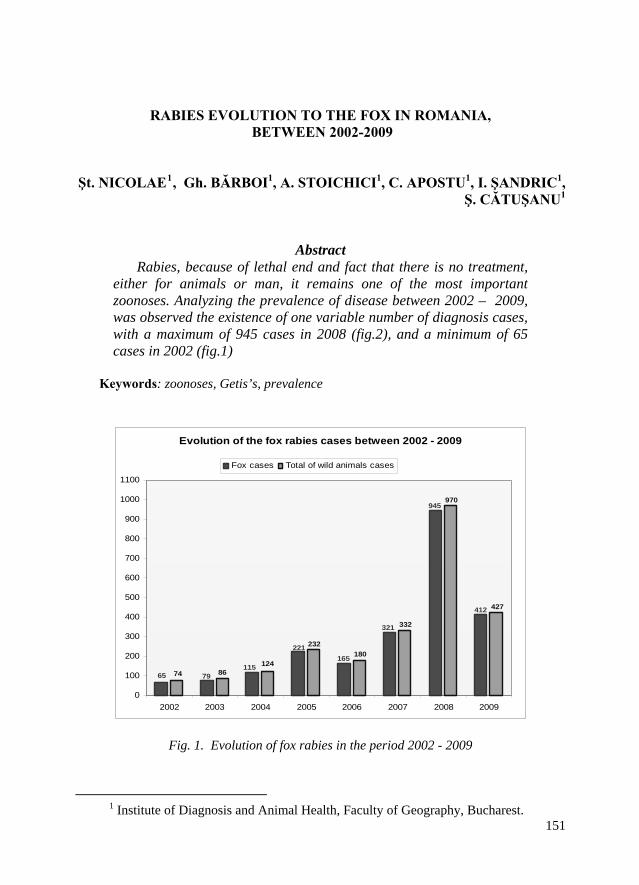
RABIES EVOLUTION TO THE FOX IN ROMANIA, BETWEEN 2002-2009
Şt. NICOLAE1, Gh. BĂRBOI1, A. STOICHICI1, C. APOSTU1, I. ŞANDRIC1, Ş. CĂTUŞANU1
Abstract
Rabies, because of lethal end and fact that there is no treatment, either for animals or man, it remains one of the most important zoonoses. Analyzing the prevalence of disease between 2002 – 2009, was observed the existence of one variable number of diagnosis cases, with a maximum of 945 cases in 2008 (fig.2), and a minimum of 65 cases in 2002 (fig.1)
Keywords: zoonoses, Getis’s, prevalence
Evolution of the fox rabies cases between 2002 - 2009
945
412
321
65 79115
221165
970
427
332
180232
1248674
0
100
200
300
400
500
600
700
800
900
1000
1100
2002 2003 2004 2005 2006 2007 2008 2009
Fox cases Total of wild animals cases
Fig. 1. Evolution of fox rabies in the period 2002 - 2009
1511 Institute of Diagnosis and Animal Health, Faculty of Geography, Bucharest.
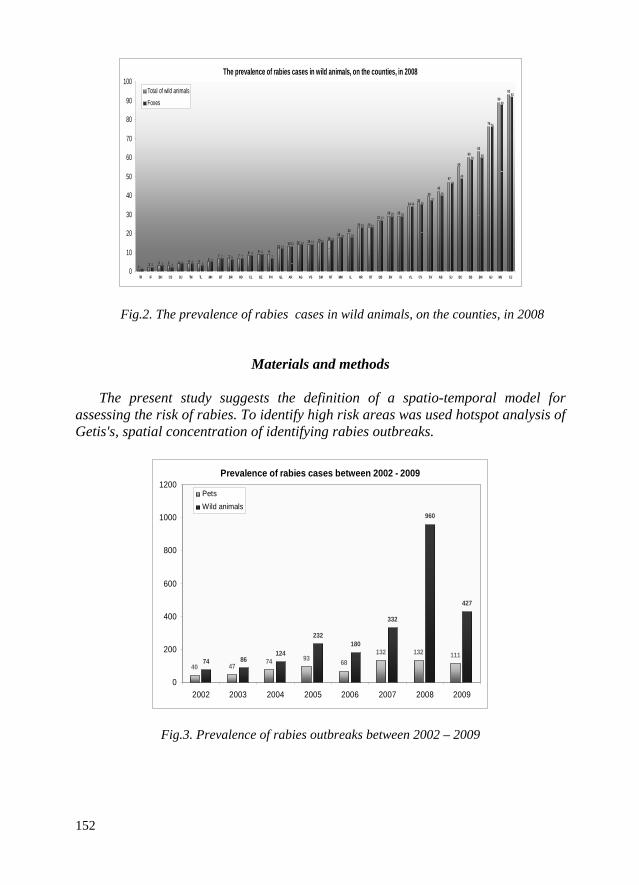
The prevalence of rabies cases in wild animals, on the counties, in 2008
93
89
76
6360
55
47
4239
3634
292927
232320
1816
1 2 3 3 4 4 4 57 7 7
8 9 912
13 14 14 15
92
88
76
6059
4946
4037
3534
292927
2323
181816
12 3 2
4 4 35
7 6 78 9
7
1213 14 14 15
0
10
20
30
40
50
60
70
80
90
100
TR IF BH CS DJ TM TL MH BT BR HD CL BZ PH GL AR AG VS SM NT MM IL HR OT DB BV IS VL CV SV AB SJ BC SB BN GJ MS CJ
Total of wild animalsFoxes
Fig.2. The prevalence of rabies cases in wild animals, on the counties, in 2008
Materials and methods The present study suggests the definition of a spatio-temporal model for
assessing the risk of rabies. To identify high risk areas was used hotspot analysis of Getis's, spatial concentration of identifying rabies outbreaks.
Prevalence of rabies cases between 2002 - 2009
40 4774 93 68
132 132 11174 86
124
232180
332
960
427
0
200
400
600
800
1000
1200
2002 2003 2004 2005 2006 2007 2008 2009
PetsWild animals
Fig.3. Prevalence of rabies outbreaks between 2002 – 2009
152

Fig.4. Spatial evolution of the fox rabies in 2009
Conclusions
1. Increasing prevalence of rabies is directly influenced by the level of disease control and epidemiological surveillance, especially in wild environment;
2. Increased prevalence of rabies wild environment is due rabies virus circulation in this area (fig.3);
3. To reduce the incidence of rabies in the wild environment required geographic zoning of the territory of Romania and disease eradication zones progressively through vaccination of wild foxes.
References
1. Mitchell Andy , The ESRI Guide to GIS Analysis, Volume 2. ESRI Press,
2005. 2. Scott, L. and Warmerdam, N., Extend Crime Analysis with ArcGIS Spatial
Statistics Tools in ArcUser Online, April - June 2005. 3. Toma B., Dufour Barbara. and colab. Aplied veterinary Epidemiology and
the Control of Disease in Populations , 2000. 4. Pfeiffer D., Robinson T. and colab., Spatial Analysis in Epidemiology,
2008.
153

154
155
THE IDENTIFICATION OF RISK FACTORS FOR BSE TO FACILITATE PERFORMING THE RISK ANALYSIS FOR THIS DISEASE
Dr. Clara VASILESCU1, dr. Gh. ONŢANU1
[email protected], [email protected]
Abstract
BSE is one of the strangest diseases in animals. Usually considered as an emergent disease, its origin was confused for a long period of time, firstly described in 1986, its spreading and pathways remained unknown for almost a decade. Considered as a non-direct transmissible disease at the beginning of its onset on the “place” of animal health, tremendous changes have been revealed during the last two decades, its transmissibility being proved not only for cattle but for small ruminants and even other animal species. Due to its particularly features, the disease caused seriously problems for international trade and unsustainable considered protective measures and were in place. These aspects draw in the urgent laying down the specific risk analysis for this disease for the sake of trade. Attempts to draw up a risk analysis for BSE related to cattle imports in Romania from different countries with unknown or unacceptable risk of BSE. This paper has as aim to clearly shape an official model of risk analysis for BSE that could be used by veterinary authorities when they decide to approve the bovine imports into Romania. In order to perform this task the Corvello – Merckhofer risk analysis model, with some amendments, has been used. This model is particularly used for risk analysis in animal health. All technical and legal aspects have been considered. The first step of risk analysis – risk identification was done taking into account risk factors related to exporting countries, risk factors related to commodity (live bovine and other ruminants), the assessment of veterinary services and the legal acts and legal powers of veterinary services. For the second step of this kind of risk analysis – risk assessment – the border inspection post procedures, protective measures in place and animal surveillance tools were used. Specific preventive measures were used to define monitoring and management of risk, as well as risk communication procedures along this.
1 Institute for Diagnosis and Animal Health, Street: Dr. Staicovici, no 63, sector 5, code 050557, Bucharest, Romania.

156
Introduction Some spongiform encephalopaties have been earlier described in humans,
such: Creutzfeldt-Jacob Diseases (CJD), Kuru-Kuru Diseases, Gerstmann-Straussler-Scheinker Syndrom (GSSS), Familial Fatal Insomnia (FFI), Multiple Sclerosis and Huntington Diseases. The only one spongiform encephalopaties in the animals, till the eighth decade of the last century, was scrapie, for more than two hundred years. At the beginning of eighth decade some stranger cases of illness occurred in Great Britain and Northern Ireland without any explications and no causal agent was identified till 1986, when the veterinary practitioners and veterinary research workers point it out that disease occurs mostly in cattle which were fed with feedingstuffs containing bovine processed proteins. At the same time it was revealed that lesions in affected animals, at post-mortem morphopathological investigations, are almost similar with those detected in human cases of spongiform encephalopaties. The new disease was called bovine spongiform encephalopaties as mad cow diseases created a huge syndrome of paranoia in relation with beef and beef trade. Its transmission to bovine – bovine, bovine – small ruminants and among the other animals has been proved in the last years. This aspect is supported by a new spongiform encephalopathy in humans called Creutzfeldt-Jacob Diseases and its relation with BSE, firstly by eating meet brain and other organs from bovine and lastly by other pathways. It is obvious that only risk analysis could convince the veterinary services “to melt” the unreasonable protective measures against trade with bovine and bovine origin products coming from countries with indigenous case of BSE. This item was facilitated by developing the legal framework for BSE including trade rules, and contributed to an acceptable manner of monitor and management of disease, specified in the third step of risk analysis – risk monitoring and management. It is unanimous accepted that, taking into account its proved transmissibility, the risk analysis is the main tool to approve bovine and bovine origin products imports together with secondary measures such as border inspections post procedures, protective measures in place and animal surveillance tools, as well as specific measures taken in slaughterhouses in relations with specific risk materials. This is part of BSE risk management, but finally conducts to express the practical opinions of measures; for each of those charged with making decisions are able to select the corrective measures to make the risk acceptable or in this case near to zero, ensuring the fluency of trade but in safety conditions. This paper is conducted only to identify risk factors for BSE in order to facilitate performing risk analysis for this disease.
Materials and methods
In order to perform this particular risk analysis, some reference written
materials regarding transmissible spongiform encephalopaties in human and animals, the community and national legal framework on BSE, national strategically programs issued by national veterinary authority for the period 2000 –

157
2010, Terrestrial Animal Health Code of World Animal Health Organization (WAHO), the European Commission official document regarding the hierarchy of member states and third countries in relation with BSE, the final document concerning geographic BSE risk analysis for Romania sent to European Commission, Official Position Papers and Supplementary Information Documents presented by Romania to European Commission during the accession negotiations, have been used.
For different stages of risk identification, the following materials were used: the Annual Animal Health Manual of World Animal Health Organization, in order to identify the stratified position for each plausible exporting country to Romania, using the criteria to set up four classes of geographical BSE risk.
In order to assess the capability and powers of veterinary services from exporting countries the document Performance Vision and Strategy – a tool for governance of veterinary services issued by WAHO was used, as well as searching their national legislation in relation with BSE and assessment of its equivalency level with Community and Romanian legislation.
At the same time technical provisions and measures to survey the animal health on BSE have also been evaluated and assessed. For the sake of risk exposure, the measures and rules imposed at veterinary inspection and controls at the Romanian borders were used.
The capability of Romanian veterinary services to survey both indigenous ruminants’ livestock and imported ruminants has been taken into account.
The other commodities posing a risk for our livestock such as import of meat meal, meat and bone meal, animal origin products and by-products, semen, embryos and ovules from bovine were considered in order to identify a real whole list of risks associated with BSE.
Results and discussions
The imports of live bovine from Member States earlier or subsequently
affected by BSE, as a main risk factor identified, are:
For the period 1981 - 2000
Country UK IT DE NL DK FR IRL Non-UK Source CD EU UK CD EU CD EU CD EU CD EU EU EU CD EU
1981 6,598 6,598 889 7,787
1982 3 3 651 651 651
1985 425 425 425
80-87: 3 3 7,674 0 0 889 8,563
1991 800 800 800
1992 3187 3,187 3,187 1993 149 149 1760 1,818 293 294 64/64 2,325
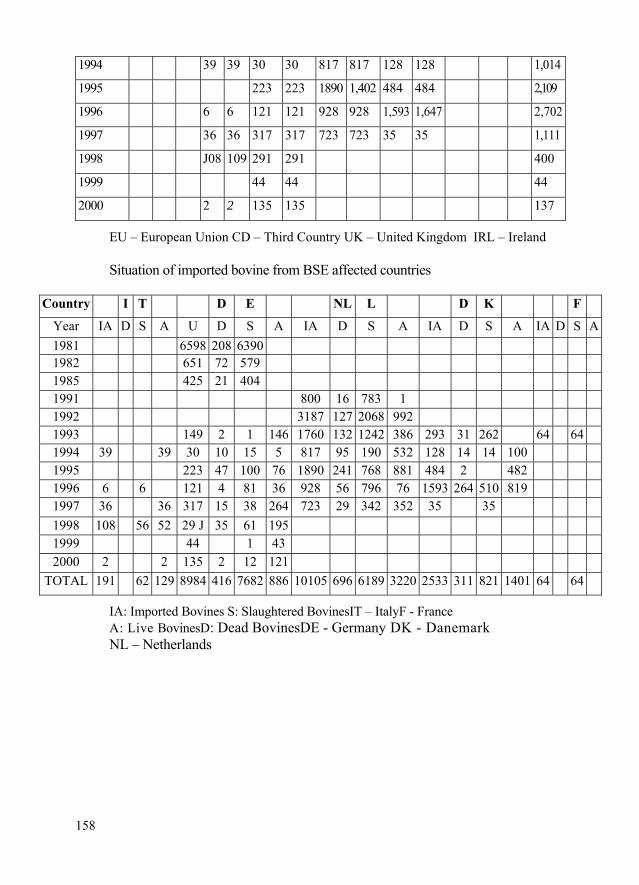
158
1994 39 39 30 30 817 817 128 128 1,014
1995 223 223 1890 1,402 484 484 2,109
1996 6 6 121 121 928 928 1,593 1,647 2,702
1997 36 36 317 317 723 723 35 35 1,111
1998 J08 109 291 291 400
1999 44 44 44
2000 2 2 135 135 137
EU – European Union CD – Third Country UK – United Kingdom IRL – Ireland Situation of imported bovine from BSE affected countries
Country I T D E NL L D K F
Year IA D S A U D S A IA D S A IA D S A IA D S A 1981 6598 208 6390 1982 651 72 579 1985 425 21 404 1991 800 16 783 1 1992 3187 127 2068 992 1993 149 2 1 146 1760 132 1242 386 293 31 262 64 64 1994 39 39 30 10 15 5 817 95 190 532 128 14 14 100 1995 223 47 100 76 1890 241 768 881 484 2 482 1996 6 6 121 4 81 36 928 56 796 76 1593 264 510 819 1997 36 36 317 15 38 264 723 29 342 352 35 35 1998 108 56 52 29 J 35 61 195 1999 44 1 43 2000 2 2 135 2 12 121
TOTAL 191 62 129 8984 416 7682 886 10105 696 6189 3220 2533 311 821 1401 64 64
IA: Imported Bovines S: Slaughtered BovinesIT – ItalyF - France A: Live BovinesD: Dead BovinesDE - Germany DK - Danemark NL – Netherlands
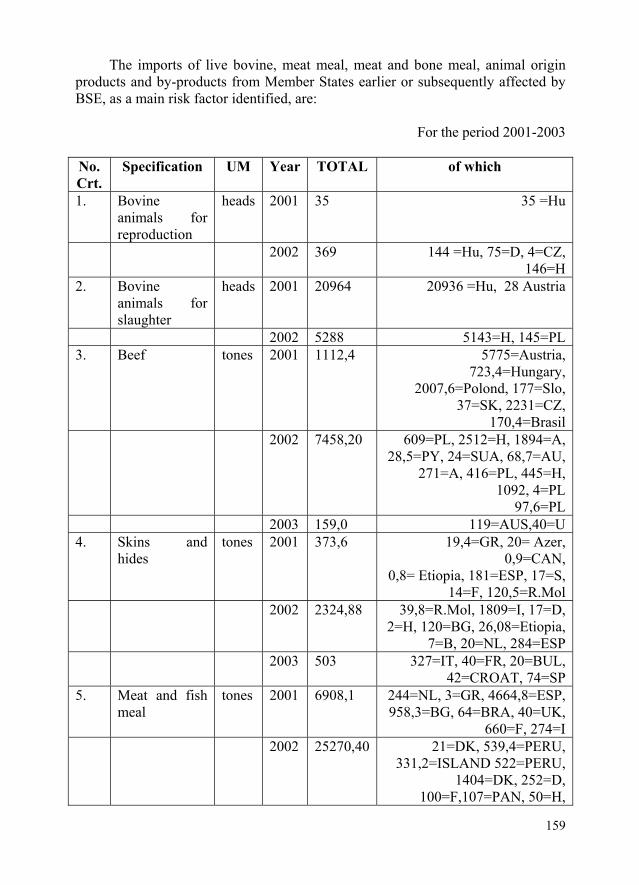
159
The imports of live bovine, meat meal, meat and bone meal, animal origin products and by-products from Member States earlier or subsequently affected by BSE, as a main risk factor identified, are:
For the period 2001-2003
No. Crt.
Specification UM
Year TOTAL of which
1. Bovine animals for reproduction
heads 2001 35
35 =Hu
2002 369 144 =Hu, 75=D, 4=CZ, 146=H
2. Bovine animals for slaughter
heads 2001 20964
20936 =Hu, 28 Austria
2002 5288 5143=H, 145=PL 3. Beef tones 2001 1112,4
5775=Austria,
723,4=Hungary, 2007,6=Polond, 177=Slo,
37=SK, 2231=CZ, 170,4=Brasil
2002 7458,20 609=PL, 2512=H, 1894=A, 28,5=PY, 24=SUA, 68,7=AU,
271=A, 416=PL, 445=H, 1092, 4=PL
97,6=PL 2003 159,0 119=AUS,40=U 4. Skins and
hides tones 2001 373,6
19,4=GR, 20= Azer,
0,9=CAN, 0,8= Etiopia, 181=ESP, 17=S,
14=F, 120,5=R.Mol 2002 2324,88 39,8=R.Mol, 1809=I, 17=D,
2=H, 120=BG, 26,08=Etiopia, 7=B, 20=NL, 284=ESP
2003 503 327=IT, 40=FR, 20=BUL, 42=CROAT, 74=SP
5. Meat and fish meal
tones 2001 6908,1 244=NL, 3=GR, 4664,8=ESP, 958,3=BG, 64=BRA, 40=UK,
660=F, 274=I 2002 25270,40 21=DK, 539,4=PERU,
331,2=ISLAND 522=PERU, 1404=DK, 252=D,
100=F,107=PAN, 50=H,

160
50=ISL, 39,1=PL 5422,12=ESP , 610,18=DK,
8277,8=PE, 195=VN, 358,5=CL, 450=MA,
1375,3=NA, 982,8=F, 80=GB, 200=DK, 820=F, 90=ISL,
2655=PERU, 257=NL, 20=PANAMA, 60=ISL
2003 534,7 151=FR, 20=POL, 68=PERU, 66=DAN,104,7=SP,
125=GER Situation on imports of live bovines, bovine origin animals products and
proteic meals
For the period 2004-2006
No. Crt.
Specification UM
Year TOTAL of which
1. Bovine animals for
reproduction
heads 2004 2176 Austria, Germany, Netherlands, France, Swiss,
Hungary and Bulgaria 2005 4979 Austria, Germany,
Netherlands, France, Swiss, Hungary, Italy, Denmark,
Belgium, 2006 4508 Austria, Germany,
Netherlands, France, Swiss, Hungary,
2. Bovine animals for slaughter
heads 2004 105 Netherlands
2005 127 Austria 3. Bovine origine
products tones 2004 12060 Austria, Germany,
Netherlands, France, Swiss, Hungary, Australia, Italy,
Denmark, USA, Chile, Poland, Czech Republic
2005 33569 Austria, Germany, Netherlands, France, Hungary,
Australia, Italy, Denmark, USA, Chile, Poland, Czech
Republic, Brasil, Greece, Belgium, Slovenia,, Spain,
Uruguay, New Zeeland,
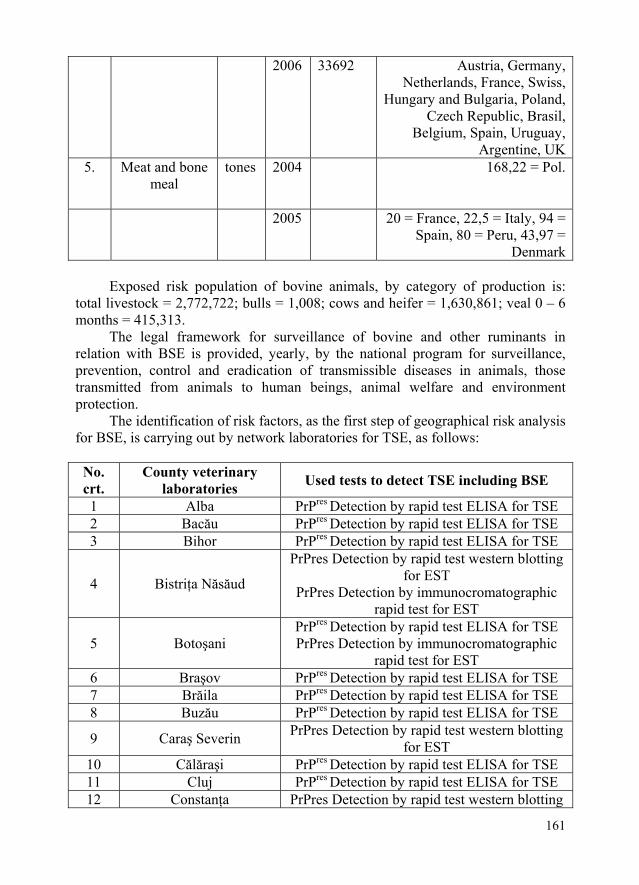
161
2006 33692 Austria, Germany, Netherlands, France, Swiss,
Hungary and Bulgaria, Poland, Czech Republic, Brasil,
Belgium, Spain, Uruguay, Argentine, UK
5. Meat and bone meal
tones 2004 168,22 = Pol.
2005 20 = France, 22,5 = Italy, 94 = Spain, 80 = Peru, 43,97 =
Denmark Exposed risk population of bovine animals, by category of production is:
total livestock = 2,772,722; bulls = 1,008; cows and heifer = 1,630,861; veal 0 – 6 months = 415,313.
The legal framework for surveillance of bovine and other ruminants in relation with BSE is provided, yearly, by the national program for surveillance, prevention, control and eradication of transmissible diseases in animals, those transmitted from animals to human beings, animal welfare and environment protection.
The identification of risk factors, as the first step of geographical risk analysis for BSE, is carrying out by network laboratories for TSE, as follows:
No. crt.
County veterinary laboratories Used tests to detect TSE including BSE
1 Alba PrPres Detection by rapid test ELISA for TSE 2 Bacău PrP P
res Detection by rapid test ELISA for TSE 3 Bihor PrPres Detection by rapid test ELISA for TSE
4 Bistriţa Năsăud
PrPres Detection by rapid test western blotting for EST
PrPres Detection by immunocromatographic rapid test for EST
5 Botoşani PrPres Detection by rapid test ELISA for TSE PrPres Detection by immunocromatographic
rapid test for EST 6 Braşov PrP P
res Detection by rapid test ELISA for TSE 7 Brăila PrPres Detection by rapid test ELISA for TSE 8 Buzău PrP P
res Detection by rapid test ELISA for TSE
9 Caraş Severin PrPres Detection by rapid test western blotting for EST
10 Călăraşi PrPres Detection by rapid test ELISA for TSE 11 Cluj PrPres Detection by rapid test ELISA for TSE 12 Constanţa PrPres Detection by rapid test western blotting

162
for EST PrPres Detection by immunocromatographic
rapid test for EST
13 Covasna PrPres Detection by rapid test western blotting for EST
14 Dolj
PrPres Detection by rapid test western blotting for EST
PrPres Detection by immunocromatographic rapid test for EST
15 Gorj PrPres Detection by rapid test ELISA for TSE 16 Harghita PrPres Detection by rapid test ELISA for TSE
17 Hunedoara
PrPres Detection by rapid test ELISA for TSE PrPres Detection by rapid test western blotting
for EST PrPres Detection by immunocromatographic
rapid test for EST 18 Iaşi PrPres Detection by rapid test ELISA for TSE
19 Maramureş
PrPres Detection by rapid test western blotting for EST
PrPres Detection by immunocromatographic rapid test for EST
20 Mureş PrPres Detection by rapid test ELISA for TSE 21 Neamţ PrPres Detection by rapid test ELISA for TSE 22 Olt PrPres Detection by rapid test ELISA for TSE 23 Satu Mare PrPres Detection by rapid test ELISA for TSE 24 Sibiu PrPres Detection by rapid test ELISA for TSE
25 Suceava
PrPres Detection by rapid test western blotting for EST
PrPres Detection by immunocromatographic rapid test for EST
26 Teleorman PrPres Detection by rapid test ELISA for TSE 27 Timiş PrPres Detection by rapid test ELISA for TSE
28 Tulcea
PrPres Detection by rapid test western blotting for EST
PrPres Detection by immunocromatographic rapid test for EST
29 Vaslui PrPres Detection by rapid test ELISA for TSE 30 Vâlcea PrPres Detection by rapid test ELISA for TSE
31 Vrancea
PrPres Detection by rapid test western blotting for EST
PrPres Detection by immunocromatographic rapid test for EST
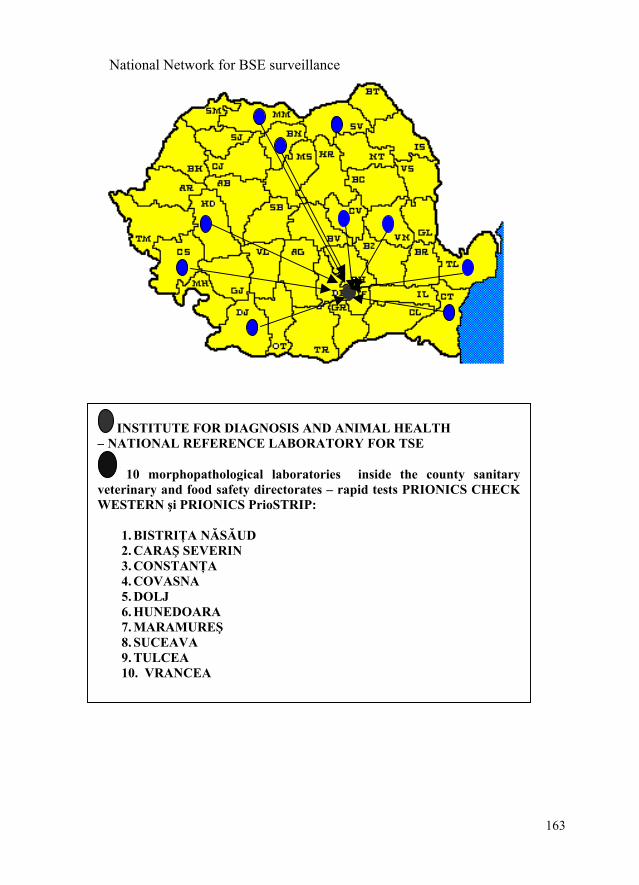
National Network for BSE surveillance
INSTITUTE FOR DIAGNOSIS AND ANIMAL HEALTH – NATIONAL REFERENCE LABORATORY FOR TSE
10 morphopathological laboratories inside the county sanitaryveterinary and food safety directorates – rapid tests PRIONICS CHECKWESTERN şi PRIONICS PrioSTRIP:
1. BISTRIŢA NĂSĂUD 2. CARAŞ SEVERIN 3. CONSTANŢA 4. COVASNA 5. DOLJ 6. HUNEDOARA 7. MARAMUREŞ 8. SUCEAVA 9. TULCEA 10. VRANCEA
163
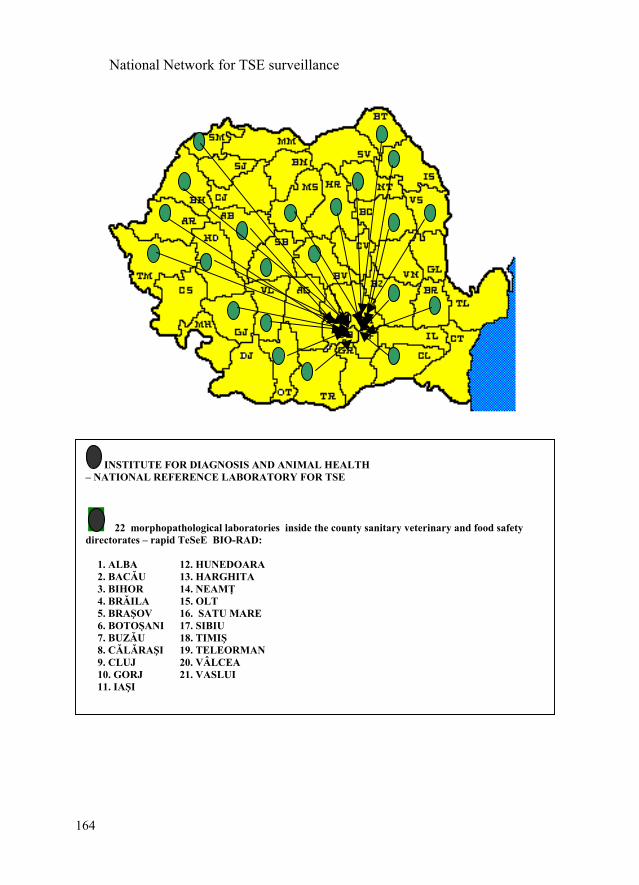
National Network for TSE surveillance
INSTITUTE FOR DIAGNOSIS AND ANIMAL HEALTH – NATIONAL REFERENCE LABORATORY FOR TSE
22 morphopathological laboratories inside the county sanitary veterinary and food safety directorates – rapid TeSeE BIO-RAD:
1. ALBA 12. HUNEDOARA 2. BACĂU 13. HARGHITA 3. BIHOR 14. NEAMŢ 4. BRĂILA 15. OLT 5. BRAŞOV 16. SATU MARE 6. BOTOŞANI 17. SIBIU 7. BUZĂU 18. TIMIŞ 8. CĂLĂRAŞI 19. TELEORMAN 9. CLUJ 20. VÂLCEA 10. GORJ 21. VASLUI 11. IAŞI
164
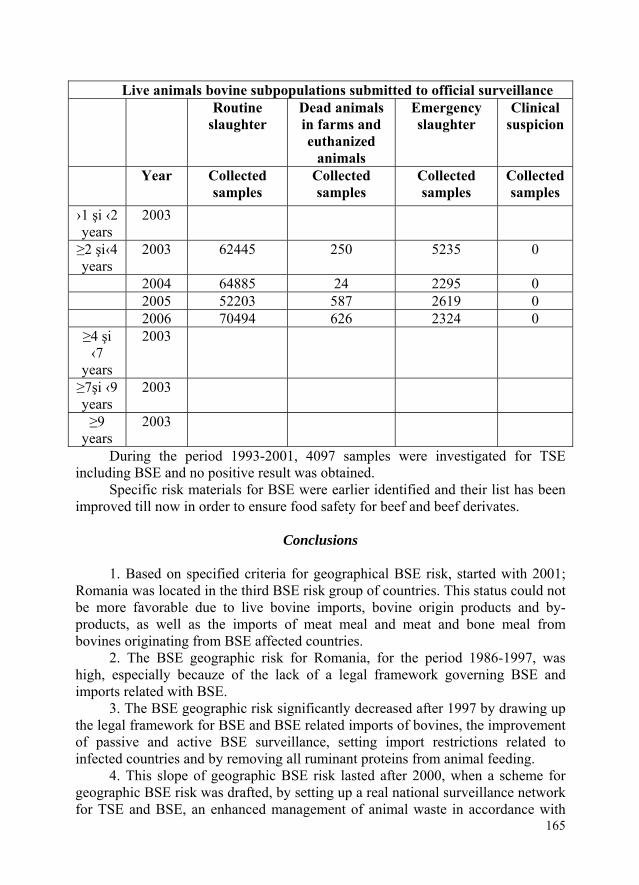
During the period 1993-2001, 4097 samples were investigated for TSE including BSE and no positive result was obtained.
Live animals bovine subpopulations submitted to official surveillance Routine
slaughter Dead animals in farms and euthanized
animals
Emergency slaughter
Clinical suspicion
Year Collected samples
Collected samples
Collected samples
Collected samples
›1 şi ‹2 years
2003
≥2 şi‹4 years
2003 62445 250 5235 0
2004 64885 24 2295 0 2005 52203 587 2619 0 2006 70494 626 2324 0
≥4 şi ‹7
years
2003
≥7şi ‹9 years
2003
≥9 years
2003
Specific risk materials for BSE were earlier identified and their list has been improved till now in order to ensure food safety for beef and beef derivates.
Conclusions
1. Based on specified criteria for geographical BSE risk, started with 2001;
Romania was located in the third BSE risk group of countries. This status could not be more favorable due to live bovine imports, bovine origin products and by-products, as well as the imports of meat meal and meat and bone meal from bovines originating from BSE affected countries.
2. The BSE geographic risk for Romania, for the period 1986-1997, was high, especially becauze of the lack of a legal framework governing BSE and imports related with BSE.
3. The BSE geographic risk significantly decreased after 1997 by drawing up the legal framework for BSE and BSE related imports of bovines, the improvement of passive and active BSE surveillance, setting import restrictions related to infected countries and by removing all ruminant proteins from animal feeding.
165
4. This slope of geographic BSE risk lasted after 2000, when a scheme for geographic BSE risk was drafted, by setting up a real national surveillance network for TSE and BSE, an enhanced management of animal waste in accordance with
166
EU legislation and an adequate management for specific risk materials harvested in slaughterhouses, by improving the diagnosis and surveillance methods, as well as national and international notification for TSE and BSE.
5. This paper constitutes useful guide to perform the first step of risk analysis for BSE – risk identification.
References
1. World Animal Health Organization (WAHO), Bovine Spongiform
Encephalopathy an Update, “Rev. Sci. Tech. Off. Int. Epiz”. 1996, 15 (3), p. 1087-1118.
2. World Animal Health Organization (WAHO), Risk Analysis of Prion Diseases in Animals , vol. 22 (1) Aprilie, 2003, p. 251-256.
3. Food and Agricultural Organisation (FAO) “Bovine Spongiform Encephalopathy”, nr. 109, 2002, p. 1-63.
4. World Animal Health Organization (WAHO), A Review of the Epidemiology of Scrapie in Sheep, “Rev. Sci. Tech. Off. Int. Epiz”. 1996, 15 (3), p. 827-852.
5. Official Position Papers and Supplementary Information Documents presented by Romania to European Commission, 2001.
6. National Strategic Plans for the period 2000-2009.

167
RISK ANALYSIS MODEL FOR VETERINARY LABORATORIES
Dr. Clara VASILESCU1, dr. Gh. ONŢANU1, [email protected], [email protected]
Abstract
The notion of risk analysis and earlier definitions of this new concept has
been proposed by Starr in Newsletter Science in 1969 and first applied for spatial launchings. Lawrance expended to six the number of areas in which it could be used, such as naturally catastrophes and socio-political disruptions, as well as infection diseases. Since 1969 risk analysis has emerged as a formal discipline, with its namesake Journal Risk Analysis Newsletter. OMSA, EFSA, AFSSA and FAO have developed risk analysis pattern for animal health, food safety and agricultural products. The initial official release of risk analysis concept for animal health has been developed in Romania by Onţanu & col. ISO, also, developed international standards for risk analysis and European Agency for Safety and Health at Work (OSHA) drawn up risk assessment tools database. No fully risk analysis for testing laboratories, including diagnosis and surveillance have been performed. The purpose of this paper is the attempt to shape a risk analysis model for veterinary laboratories. A lot of books and special papers or official standards have been used to cover all required steps to draw up a risk analysis model for all kind of laboratories. The need to perform such a risk analysis has been supported as legal aspect, healthy and social aspects, based on laboratory infections, historical background and their epidemiology. The main target and subsequent objectives of this risk analysis, as well as its principles, have also been identified and specified. Procedural aspects have been initially established, the risk analysis pattern for animal health being used with some specific elements introduced by OSHA. A qualitative risk analysis model and at the same time a semi-quantitative risk analysis were used.
Introduction
Since Starr proposed for the first time the new notion of risk and its
analysis, this concept has been enhanced, upgraded, amended and completed. Many efforts have been done to define a practical and useful pattern. International organisations and institutions were engaged to adapt the initial risk analysis model to animal health and animal diseases, as well as to food safety. In Romania, Onţanu & col. identified at least five domains of competence for veterinary and food safety services that could apply risk analysis, such: transboundary animal diseases,
1 Institute for Diagnosis and Animal Health, Street: Dr. Staicovici, no 63, sector 5,
code 050557, Bucharest, Romania.
168
animals and animal origin product trade, food safety, veterinary medicines and of course veterinary laboratories. Even if some steps of risk analysis for veterinary laboratories have been already performed, some stages such as risk communication and a really risk management have not been practically described. No whole risk analysis for veterinary laboratories was described. So, the main purpose of this paper is an attempt to realise a completed risk analysis for veterinary laboratories, both for biological identified risks and non-biological risks.
Materials and methods
In order to perform our paper, a lot of books and special papers or official
standards have been used to cover all required steps to draw up risk analysis model for kind of laboratories.
The legal aspects have also been taken into consideration for the consistency of this work.
The following technical documents were used to precisely define each step and stage of risk analysis: Laboratory biosafety manual – OMS, Biorisk management Laboratory biosecurity guidance – OMS, Biosafety Guide for Medical Laboratoriès – Ministry of Health, Laboratory biorisk management standard - European Committee for Standardization, Risk assessment and Risk assessment tools – European Agency for Safety and Health at Work, Checklist for the prevention of accidents in laboratories – OHSA, Risk Assessment for Care Workers – OHSA, Stress – Mind – Health, The START procedure for the risk assessment and risk management of work-related stress - Rolf Satzer, Guidance on risk assessment at work – European Commission, Risk assessment tool – Basic Information/Risk Assessment – OHSA.
Some legal documents were also studied, as: Council Directive 89/391/EEC of 12 June 1989 on the introduction of measures to encourage improvements in the safety and health of workers at work, Directive 2000/54/EC of the European Parliament and of the Council of 18 September 2000 on the protection of workers from risks related to exposure to biological agents at work, Health and Security Law at Work no. 319/2006 and Government Decision no. 1425/2006 for its methodological appliance, Government Decision no. 1048/2006 on minimal security and health requirements for workers using individual protection equipments at work, Government Decision no. 1091/2006 on basic security and health requirements for working places, Government Decision no. 1092/2006 regarding worker protection against risks of exposure to biological agents at work, Ministry of Labour, Family and Social Protection Order no. 706/2006 concerning basic security and health requirements on worker exposure to risks caused by artificial optic radiations, Government Decision no. 355/2007 on workers’ health surveillance.
The risk analysis model was shaped in order to respect the following principles: the principle of proportionality between the level of identified risks, the tools for their management and communication and the practically corrective measures which could put in place, in order to bring the risks at a low or acceptable

169
level; the principle of objectivity, especially in the process of risk identification and select the appropriate and correspondent corrective measures; and finally, the principle of equivalence in notification, especially for promptly and clearly risk communication.
The risk analysis model used the following structure: risk identification step with the following stages: identification of risk origin, identification of risk pathway, identification of risk emission, identification of risk exposure and risk consequences; risk assessment with the following stages: emission estimation, exposure estimation, risk assessment and the estimation of consequences; risk monitoring and management; risk communication and finally risk analysis evaluation and upgrading.
In the first step – risk identification – the specific procedures to collect information, to identify the dangers and the risks inside them, to identify the personnel exposed to risks, the type of exposure, the risks involved for samples, for surrounding environment, for equipment and for animal and human population, as well as the environment around the lab, were established.
The second step of risk analysis – risk assessment – was carried out, comparing the level of risks already identified with the acceptable risks level specified by international standards and guidelines or by legal framework. Taking into consideration the result of the second step, the monitoring and management procedures have been identified.
At the end of this step, reasonable options have to be presented to making decision operators or management board. In the next step the management board have to select, based on aforementioned criteria, the most practical options which are to be in place as corrective measures. The risk communication, step lasts throughout risk analysis process.
For a good management of risks, risk factors were classified, as well: risk factors for their own means of production (a), risk factors for working places (b), risk factors for their own labour tasks (c) and risk factors for performers (d). The risks factors (a) and (b) were classified in two classes: biotic risk factors and abiotic risk factors. The identification of biotic risk factors was carried out using the list of pathogens for human and animals mentioned by Directive 2000/54/EC.
These pathogens were classified having lethal effect, systemic effect, effect affecting organs and tissues and, finally, pathogens with condition pathogenity.
The abiotic risk factors were classified in two major groups: material abiotic risk factors and immaterial abiotic risk factors. In the first subclass were identified the following origin risk factors: toxic (a), chemical (b), tumoral and cancer (c), electric (d), pyrogenic (e), thermic (f), radiant (g), dust (h), sonic (i), vibratory (j), factors correlated with special length of light (k), factors correlated with temperature conditioning (l), factors correlated with devices out of service, circulation accidents, explosive materials and devices, mechanical accident (m), sectioning and crushing accidents (n), puncture accidents (o), animal poke and bite, contusions, bruises and fractures caused by animals, meteorological and geological risk factors (overflows and earthquake).
170
The risk factors from (a) to (o) are considered specific risk factors for laboratories, and the remaining factors are specific for auxiliary sectors of laboratories and the last ones are not subject to this paper. In the second subclass were selected: stress factors, anticrissis measures and engramic factors. In the same manner, these are also not subject for this paper.
The identification of origin biotic risk factors results as: bacterial, viral, parasitic, fungal, genetically modified organisms, prions, nucleic acids or genome, found in animal corps, animal organs and tissues, inoculated animals, partially processed samples, bacterial, viral and fungal cultures.
The list of biotic risk factors was established for each laboratory profile, as well as the level of risk, occurrence probability level and seriousness class for each factor in according with EN 292-1/1991.
For personnel, the risk level for infectious diseases with lethal or systemic effects caused by direct contact with the biological samples is: 7 for seriousness class, 3 for occurrence probability level and risk classified as high risk H-5; those due to direct contact with inoculated animals from animalery is: 7, 2, H-4, respectively; those due to direct contact with partially processed samples and pathogen cultures is: 7, 1, H-5, respectively.
The risk level for infectious diseases affecting organs and tissues caused by direct contact with the biological samples is: 5 for seriousness class, 3 for occurrence probability level and risk classified as medium risk M-3; those due to direct contact with inoculated animals from animalery is: 5, 3, M-3, respectively; those due to direct contact with partially processed samples and pathogen cultures is: 5, 1, M-3, respectively.
The risk level for infectious diseases caused by conditioned pathogens by direct contact with the biological samples is: 3 for seriousness class, 3 for occurrence probability level and risk classified as low risk L-1; those due to direct contact with inoculated animals from animalery is: 3, 3, L-1, respectively; those due to direct contact with partially processed samples and pathogen cultures is: 3, 1, L-1, respectively.
For laboratory environment, the risk level for infectious diseases with lethal effect caused by accidentally damaging of samples is: 7 for seriousness class, 1 for occurrence probability level and risk classified as high risk H-5; those with damaging samples collected from animalery is: 7, 1, H-4, respectively; those due to direct contact with partial processed samples or damaging samples of pathogen cultures is: 7, 1, H-5, respectively.
The risk level for infectious diseases with systemic effects caused by accidentally damaging of samples is: 7 for seriousness class, 1 for occurrence probability level and risk classified as high risk M-3; those with damaging samples collected from animalery is: 7, 1, M-3, respectively; those due to direct contact with partial processed samples or damaging samples of pathogen cultures is: 7, 1, M-3, respectively.
The risk level for infectious diseases affecting organs and tissues caused by accidentally damaging of samples is: 5 for seriousness class, 1 for occurrence
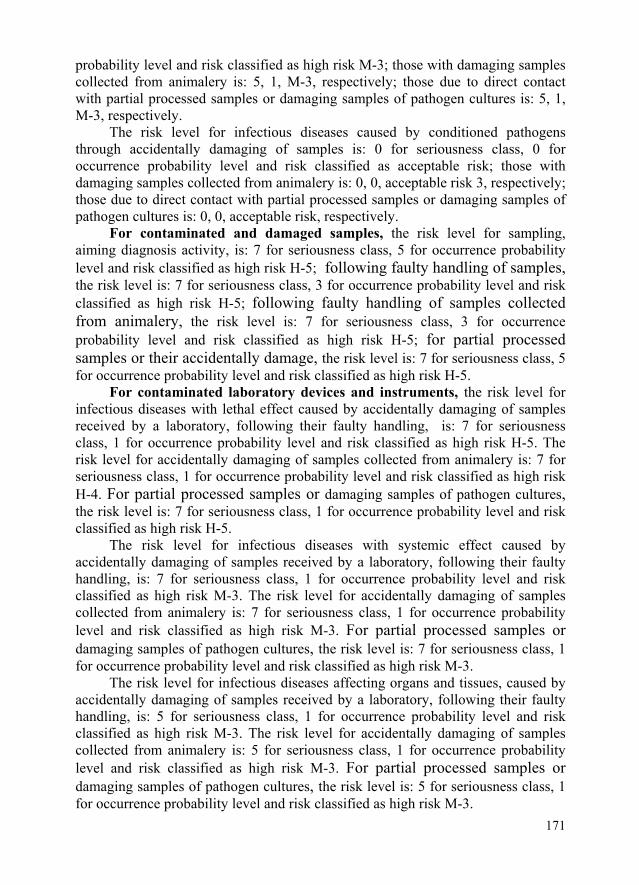
171
probability level and risk classified as high risk M-3; those with damaging samples collected from animalery is: 5, 1, M-3, respectively; those due to direct contact with partial processed samples or damaging samples of pathogen cultures is: 5, 1, M-3, respectively.
The risk level for infectious diseases caused by conditioned pathogens through accidentally damaging of samples is: 0 for seriousness class, 0 for occurrence probability level and risk classified as acceptable risk; those with damaging samples collected from animalery is: 0, 0, acceptable risk 3, respectively; those due to direct contact with partial processed samples or damaging samples of pathogen cultures is: 0, 0, acceptable risk, respectively.
For contaminated and damaged samples, the risk level for sampling, aiming diagnosis activity, is: 7 for seriousness class, 5 for occurrence probability level and risk classified as high risk H-5; following faulty handling of samples, the risk level is: 7 for seriousness class, 3 for occurrence probability level and risk classified as high risk H-5; following faulty handling of samples collected from animalery, the risk level is: 7 for seriousness class, 3 for occurrence probability level and risk classified as high risk H-5; for partial processed samples or their accidentally damage, the risk level is: 7 for seriousness class, 5 for occurrence probability level and risk classified as high risk H-5.
For contaminated laboratory devices and instruments, the risk level for infectious diseases with lethal effect caused by accidentally damaging of samples received by a laboratory, following their faulty handling, is: 7 for seriousness class, 1 for occurrence probability level and risk classified as high risk H-5. The risk level for accidentally damaging of samples collected from animalery is: 7 for seriousness class, 1 for occurrence probability level and risk classified as high risk H-4. For partial processed samples or damaging samples of pathogen cultures, the risk level is: 7 for seriousness class, 1 for occurrence probability level and risk classified as high risk H-5.
The risk level for infectious diseases with systemic effect caused by accidentally damaging of samples received by a laboratory, following their faulty handling, is: 7 for seriousness class, 1 for occurrence probability level and risk classified as high risk M-3. The risk level for accidentally damaging of samples collected from animalery is: 7 for seriousness class, 1 for occurrence probability level and risk classified as high risk M-3. For partial processed samples or damaging samples of pathogen cultures, the risk level is: 7 for seriousness class, 1 for occurrence probability level and risk classified as high risk M-3.
The risk level for infectious diseases affecting organs and tissues, caused by accidentally damaging of samples received by a laboratory, following their faulty handling, is: 5 for seriousness class, 1 for occurrence probability level and risk classified as high risk M-3. The risk level for accidentally damaging of samples collected from animalery is: 5 for seriousness class, 1 for occurrence probability level and risk classified as high risk M-3. For partial processed samples or damaging samples of pathogen cultures, the risk level is: 5 for seriousness class, 1 for occurrence probability level and risk classified as high risk M-3.
172
The risk level for contaminated laboratory devices and instruments which could by caused by conditioned pathogen agents is an acceptable or tolerable risk.
For surrounding animal and human populations, the risk level for infectious diseases with lethal effect is: 5 for seriousness class, 1 for occurrence probability level and risk classified as high risk M-3; for diseases with systemic effect this is: 3 for seriousness class, 1 for occurrence probability level and risk classified as high risk L-1; for those with organic and on tissues effect and for diseases with conditioning pathogenic effect the risk is an acceptable or tolerable level.
For outer environment, the risk level for infectious diseases with lethal effect is: 5 for seriousness class, 1 for occurrence probability level and risk classified as high risk M-3; for diseases with systemic effect this is: 3 for seriousness class, 1 for occurrence probability level and risk classified as high risk L-1; for those with organic and on tissues effect and for diseases with conditioning pathogenic effect the risk is an acceptable or tolerable level.
For abiotic risk factors, the level of risk for seriousness class, occurrence probability level and risk classified are specified.
For each laboratory profile a list of laboratory equipment and instruments, devices aggregate and facilities that provide functionality to work places, machines, tools and other tools used at work, has been drawn up and for every of these the level of exposure probability (H = high, M = medium, L = low) and specific type of risk (from (a) to (o)) were set.
In the framework of risk identification, the pathway and the mode of their transmission were pointed out, as: direct transmission, by contact with source of risk aforementioned and indirect transmission by tools contaminated with biotic risk.
In the second step – risk assessment – the first stage – emission estimation was done together with risk identification. The second stage – exposure estimation – identified the following targets: laboratory personnel, laboratory environment, analit or sample, laboratory equipment and instruments, surrounding animal and human populations around laboratory and outer environment. In order to have a real situation and to facilitate the appliance of specific corrective measures for each of them, the identification of working places, personnel, devices and instruments have been performed. The following stages were the proper risk assessment, comparing the level of risks already identified and estimated with the acceptable risks level specified by international standards and guidelines or by legal framework already mentioned in Materials.
Results and discussions
The calculation of risk indexes and risk levels were performed for: working
personnel, laboratory environment, samples, laboratory devices and instruments, animal and human populations around the laboratory and outer environment. Having as example the animal health service, the procedures could be applied in

the same manner for every laboratory profiles, the calculation of risk factor indexes and real risk factor indexes took into account all biotic and abiotic risk factors.
The number of 57 risk factors were identified for working personnel, classified as: 33 factors for their own means of production, 1 factor for working places, 14 risk factors for their own labour tasks and 9 risk factors for performers.
Among those 57 risk factors, 13 were of level 1, 11 of level 2, 24 of level 3, 5 of level 4 and 4 of level 5.
The overall risk level (Nor) for working personnel, calculated in accordance
with classical formula is 57 ∑ ri x Ri i=1 5(5x5) + 4(4x4) + 24(3x3) + 11(2x2) + 13(1x1) Nor= =
= 3,121 57 5x5 + 4x4 + 24x3 + 11x2 + 13x1 ∑ ri i=1 Nor = 3,121 The biotic risk level (Nbr) for working personnel, calculated in accordance
with classical formula is 13 ∑ ri x Ri i=1 4(5x5) + 2(4x4) + 4(3x3) + 3(1x1) Nbr = = = 3,976 13 4x5 + 2x4 + 4x3 + 3x1 ∑ ri i=1 Nbr = 3,976 The abiotic risk level (Nabr) for working personnel, calculated by median
difference is 3,976 + X = 3,121 2 3,976 + X = 3,121 x 2 (6,242) X = 6,242 – 3,976 = 2,434 Nabr = 2,266
173
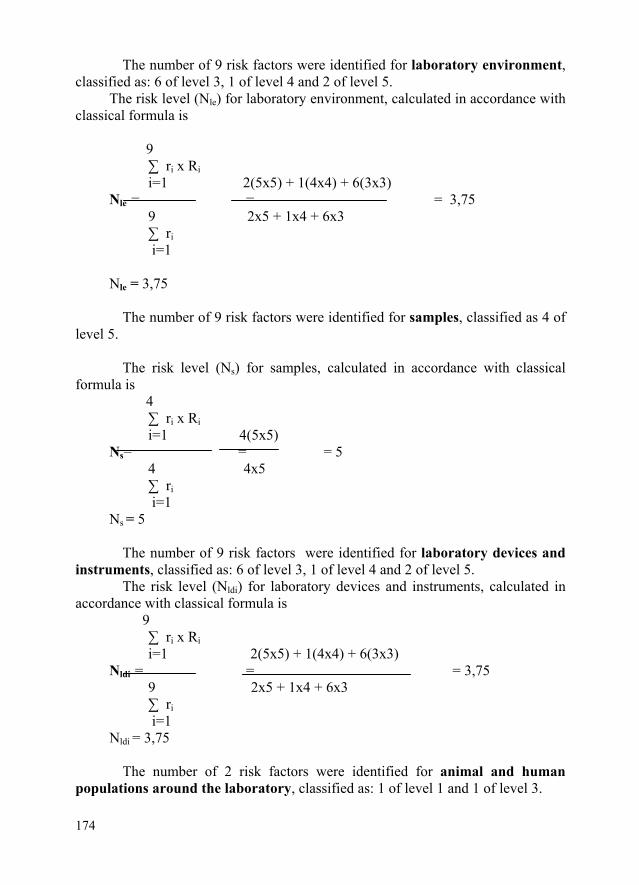
The number of 9 risk factors were identified for laboratory environment, classified as: 6 of level 3, 1 of level 4 and 2 of level 5.
The risk level (Nle) for laboratory environment, calculated in accordance with classical formula is
9 ∑ ri x Ri i=1 2(5x5) + 1(4x4) + 6(3x3) Nle = = = 3,75 9 2x5 + 1x4 + 6x3 ∑ ri i=1
174
Nle = 3,75 The number of 9 risk factors were identified for samples, classified as 4 of
level 5. The risk level (Ns) for samples, calculated in accordance with classical
formula is 4 ∑ ri x Ri i=1 4(5x5) Ns= = = 5 4 4x5 ∑ ri i=1 Ns = 5 The number of 9 risk factors were identified for laboratory devices and
instruments, classified as: 6 of level 3, 1 of level 4 and 2 of level 5. The risk level (Nldi) for laboratory devices and instruments, calculated in
accordance with classical formula is 9 ∑ ri x Ri i=1 2(5x5) + 1(4x4) + 6(3x3) Nldi = = = 3,75 9 2x5 + 1x4 + 6x3 ∑ ri i=1 Nldi = 3,75 The number of 2 risk factors were identified for animal and human
populations around the laboratory, classified as: 1 of level 1 and 1 of level 3.

The risk level (Nahp) for animal and human populations around the laboratory, calculated in accordance with classical formula is
2 ∑ ri x Ri i=1 1(3x3) + 1(1x1) Nahp = = = 2,5 2 1x3 + 1x1 ∑ ri i=1 Nahp = 2,5
175
The number of 2 risk factors were identified for outer environment,
classified as: 1 of level 1 and 1 of level 3. The risk level (Noe) for outer environment, calculated in accordance with
classical formula is 2 ∑ ri x Ri i=1 1(3x3) + 1(1x1) Noe = = = 2,5 2 1x3 + 1x1 ∑ ri i=1 Noe = 2,5 The real risk indexes are determined using the Corvello and Merkhofer
formula. For working personnel the real biotic risk index (Nbrr) is ∑ R m 3,976 Ri = = = 0,795 ∑ R M 5 ∑ Ri Rr = + Rc = 0,795 + 3,976 = 4,771 ∑ nRi Nbrr = 4,771 The real abiotic risk index for working personnel (Nrab) is ∑ R m 2,266 Ri = = = 0,817 ∑ R M 2,771

∑ Ri Rr = + Rc = 0,817 + 2,266 = 3,083 ∑ nRi Nrab = 3,083 The overall real risk index for working personnel (Norr) is ∑ R m 3,121 Ri = = = 0,943 ∑ R M 3,309 ∑ Ri Rr = + Rc = 0,943 + 3,121 = 4,064 ∑ nRi Norr = 4,064 For laboratory environment real risk index (Nrle) is ∑ R m 3,75 Ri = = = 0,927 ∑ R M 4,043 ∑ Ri Rr = + Rc = 0,927 + 3,75 = 4,677 ∑ nRi Nrle = 4,677 For sample or analit real risk index (Nrsr) is ∑ R m 5 Ri = = = 1 ∑ R M 5 ∑ Ri Rr = + Rc = 1 + 5 = 6 ∑ nRi Nrsr = 6 For laboratory devices and instruments real risk index (Nrldi) is ∑ R m 3,75 Ri = = = 0,927
176

∑ R M 4,043 ∑ Ri Rr = + Rc = 0,927 + 3,75 = 4,677 ∑ nRi Nrldi = 4,677
177
For surrounding animal and human populations real risk index (Nrahp) is ∑ R m 2,5 Ri = = = 1 ∑ R M 2,5 ∑ Ri Rr = + Rc = 1 + 2,5 = 3,5 ∑ nRi Nrahp = 3,5 For outer environment real risk index (Nroe) is ∑ R m 2,5 Ri = = = 1 ∑ R M 2,5 ∑ Ri Rr = + Rc = 1 + 2,5 = 3,5 ∑ nRi Nroe = 3,5 In order to ensure the appropriate monitoring and management of identified
and assessed risk factors for each laboratory, a Biosafety and Biosecurity Manual has to be written, taking as example the provisions of Council Directive no. 2000/54 and the Ghid Naţional de Biosiguranţă pentru Laboratoarele Medicale having in view their categorisation as laboratory of 1, 2, 3 or 4 level, applying specific criteria thereof.
General procedures, specific operational procedures and working procedures have to be drawn up and applied to ensure a real management of identified and assessed risk factors. These aspects are not subject to this paper, but there is an important step of risk analysis for veterinary laboratories, as well as the process of expression the real options which are to be selected by making decisions body to correct unacceptable risks to an acceptable risk.
178
Conclusions 1. The risk analysis concept is a quite new and useful tool to identify, assess
and correct risk factors. 2. Four veterinary domains have been identified suitable for risk analysis
appliance. 3. Even if some steps of risk analysis have been already done, no fully risk
analysis for veterinary laboratory has been carried out. 4. An attempt to present a whole risk analysis for veterinary laboratories is
carried out in this paper. 5. The risk analysis for veterinary laboratories is of crucial importance in
order to identify all the risk factors in this field, to monitor and manage them and to identify and select the appropriate corrective measures to bring them at an acceptable level, protecting laboratory personnel, samples, laboratory devices and instruments, laboratory environment, animal and human populations around laboratory and outer environment against the effects of these risk factors.
References
1. Concepte moderne în medicina veterinară – analiza de risc (Cadru
metodologic general), Editura Coral Sanivet, Bucureşti, 2003. 2. Handbook on Import Risk Analysis for Animals and Animal Products, Vol.
1 – Introduction and Qualitative Risk Analysis, OIE, Paris, 2004. 3. Handbook on Import Risk Analysis for Animals and Animal Products, Vol.
2 – Quantitative Risk Assessment, OIE, Paris, 2004. 4. Risk Analysis – A Quantitative Guide, Third Edition, John Wiley & Sons,
Ltd, Chichester (England), 2008. 5. Risk Management – Principles and Guidelines, Geneva, 2009. 6. Risk Management – Risk Assessment Techniques, International Standard,
International Electrotechnical Commission, Geneva, 2009. 7. Risk Management – Vocabulary, Guide 73, Geneva, 2009. 8. Scientific Panel on Biological Hazards, Seminar on “EFSA and Food
Safety in Europe”, Budapest, 2008. 9. Trasabilitatea în lanţul alimentar – Principii generale şi cerinţe
fundamentale pentru proiectarea şi implementarea sistemului, Asociaţia de standardizare din România, Bucureşti, 2007.
10. Une méthode qualitative d’estimation du risque en santé animale, Agence Française de Sécurité Sanitaire des Aliments, Nancy, 2008.
11. The documents referred to materials and methods.

Redactor: Andreea DIACONESCU Tehnoredactor: Georgiana GÎRJOI
Coperta: Magdalena ILIE Bun de tipar:.19.10.2010; Coli tipar: 11,25
Format: 16/70 × 100 Editura Fundaţiei România de Mâine
Bulevardul Timişoara nr. 58, Bucureşti, Sector 6 Tel./Fax 021/444.20.91; www.spiruharet.ro
179
e-mail: [email protected]

180 180