structurile regionale ale ocupĂrii regional … · după formarea statului unitar român prin...
TRANSCRIPT
167
STRUCTURILE REGIONALE ALE OCUPĂRII FORŢEI DE MUNCĂ ŞI ALE ŞOMAJULUI ÎN
ROMÂNIA
Student: Ana Delia Băbeanu Universitatea din Amsterdam – Olanda
Facultatea de Economie şi Afaceri Abstract: Lucrarea analizează fenomenele de ocupare a forţei de muncă şi de şomaj în profil regional. A fost particularizată relaţia funcţională dintre nivelul de dezvoltare şi profilul regiunilor României, pe de o parte, şi procesele de ocupare şi şomaj, pe de altă parte. În esenţă, au fost urmărite trei probleme: participarea populaţiei regiunilor la activităţile economice şi sociale, evoluţiile şi structurile populaţiei ocupate, evoluţiile şi structurile fenomenului şomajului. De asemenea, au fost reliefate deosebirile şi decalajele dintre regiunile de dezvoltare ale României în privinţa utilizării forţei de muncă şi a şomajului, ca argumente faptice pentru îmbunătăţirea politicii de dezvoltare regională şi de intensificare a unor acţiuni eficiente pentru ocuparea resurselor de muncă disponibile
Cuvinte cheie: regiuni de dezvoltare, dezvoltare regională, populaţie activă, rata de activitate, populaţie ocupată, rata de ocupare, şomaj, rata şomajului. Regiunile de dezvoltare prezintă o importanţă deosebită în procesul de integrare europeană. Din punctul de vedere al sprijinului financiar, Uniunea Europeană asigură un tratament egal ţărilor şi regiunilor de dezvoltare din care este alcătuită. Tratatul de la Maastricht a transformat regiunile în unul din pilonii integrării, Europa de azi fiind alcătuită dintr-un mozaic de regiuni, ca rezultat al diversităţii vieţii economice, sociale şi culturale.
1. Dezvoltarea regională a României şi utilizarea resurselor de muncă
Regionalismul are o tradiţie destul de puternică în ţara noastră. Încă de la formarea statului român modern, subdiviziunile statale s-au manifestat ca unităţi administrativ-teritoriale solide, având fiecare particularităţile ei.
După formarea statului unitar român prin unirea Transilvaniei cu Regatul României, până la trecerea ţării noastre la socialism, teritoriul României a fost împărţit în mai multe ţinuturi sau provincii, fiecare cuprin-zând mai multe judeţe. Apoi, la începutul anilor '50, a fost adoptat modelul de organizare administrativ-teritorială în regiuni şi raioane. Acest model era specific centralismului birocratic promovat de sistemul. La 1 ianuarie 1968 s-a trecut de la acest model greoi la actuala formă de organizare, cu 39 de judeţe plus municipiul Bucureşti, la început, şi 41 de judeţe plus municipiul Bucureşti, în prezent. Organizarea administrativ-terito-rială a României
REGIONAL EMPLOYMENT AND UNEMPLOYMENT STRUCTURES IN ROMANIA
Student: Ana Delia Băbeanu
University of Amsterdam – The Netherlands The Faculty of Economics and Business
Abstract: This paper analyses the employment phenomena of the workforce and unemployment on a regional level. It has been outlined the functional relation between the development level and the profile of the regions from Romania on one hand, and the employment and unemployment processes on the other hand. The main focus was on three main problems: the participation of the population from the regions in the economic and social activities, the evolutions and structures of the employed population, the evolutions and structures of the unemployment phenomenon. There have also been pointed out the disparities between the development regions in Romania regarding the use of the labour force and unemployment as factual arguments for the improvement of the regional development policy and the intensification of some efficient actions for the employment of the available labour resources.
Keywords: development regions, regional development, active population, rate of activity, employed population, employment rate, unemployment rate.
The development regions are very important in the European integration process. From the point of view of the financial support, the European Union provides an equal treatment for its countries and development regions. The Maastricht Treaty transformed the regions in one of the pillars of integration, the Europe from today consisting of a mosaic of regions, as a result of the diversity of economic, social and cultural life.
1. The Romanian Regional Development and the Use of the Labour Resources
Regionalism has a powerful tradition in our country. Even since the Romanian modern state formation, the state subdivisions were represented as solid administrative-territorial bodies, each of them having individual particularities.
After the Romanian unitary state formation as a consequence of the unification of Transylvania with the Kingdom of Romania and until our country passed to socialism, Romania’s territory was divided into several lands or provinces, each of them being further divided into counties. At the beginning of the 50s, our country adopted the administrative-territorial in regions and districts. This was a characteristic model for bureaucratic centralism promoted by the system. On 1 January 1968, this model was changed in the current organisation form, with 39 counties plus the municipality of Bucharest, at the beginning, and presently 41 counties plus the municipality of Bucharest. The administrative-territorial organisation of Romania will have to get closer, as principles and
168
va trebui să se apropie cât mai mult, ca principii şi orientări, de organizarea ţărilor membre ale Uniunii Europene.
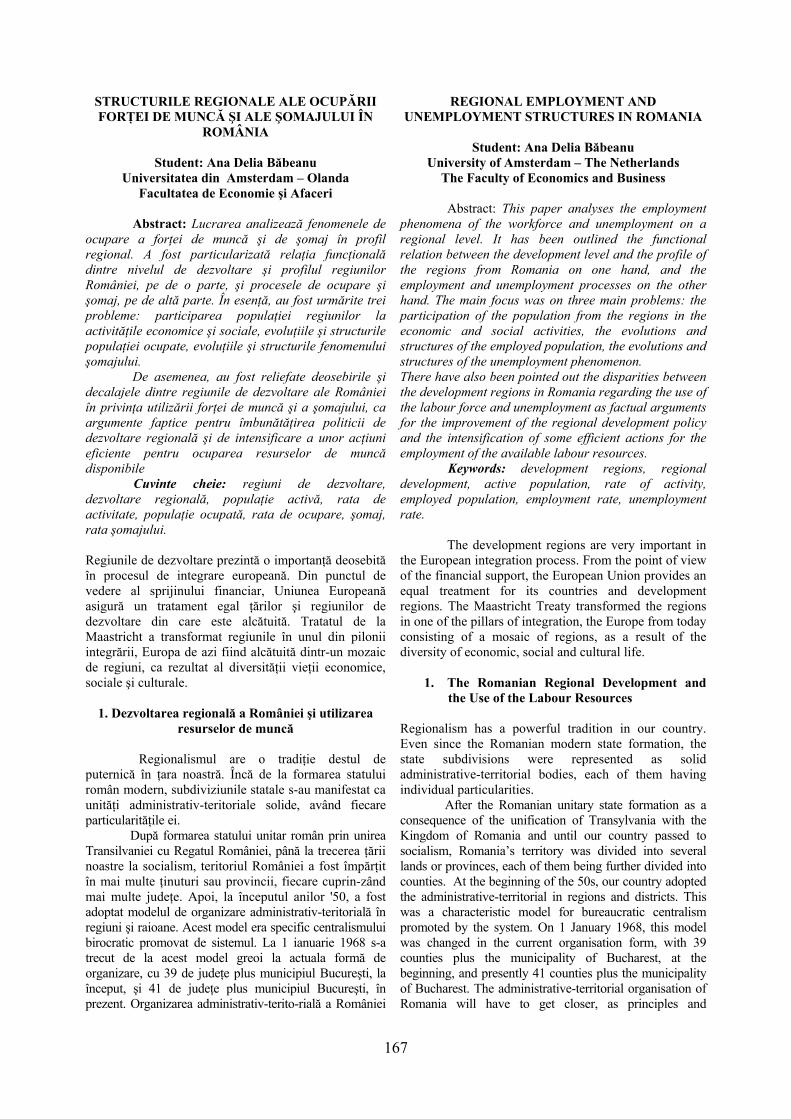
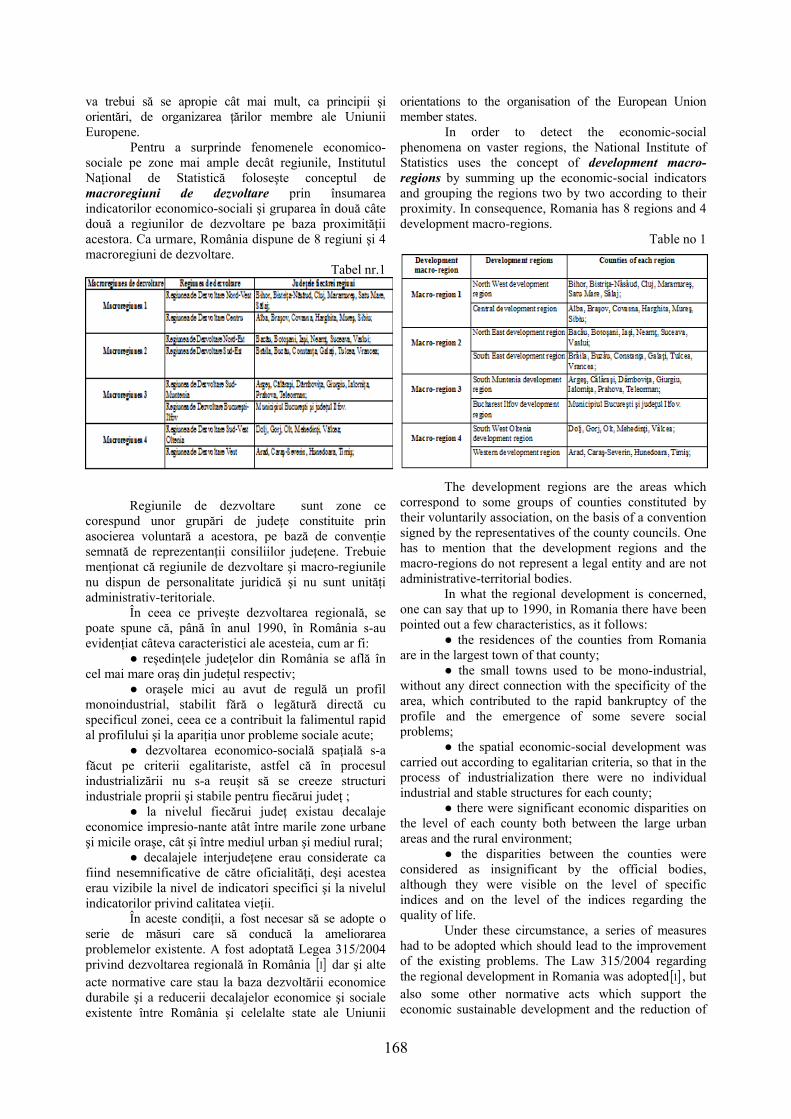
Pentru a surprinde fenomenele economico-sociale pe zone mai ample decât regiunile, Institutul Naţional de Statistică foloseşte conceptul de macroregiuni de dezvoltare prin însumarea indicatorilor economico-sociali şi gruparea în două câte două a regiunilor de dezvoltare pe baza proximităţii acestora. Ca urmare, România dispune de 8 regiuni şi 4 macroregiuni de dezvoltare.
Tabel nr.1
Regiunile de dezvoltare sunt zone ce
corespund unor grupări de judeţe constituite prin asocierea voluntară a acestora, pe bază de convenţie semnată de reprezentanţii consiliilor judeţene. Trebuie menţionat că regiunile de dezvoltare şi macro-regiunile nu dispun de personalitate juridică şi nu sunt unităţi administrativ-teritoriale.
În ceea ce priveşte dezvoltarea regională, se poate spune că, până în anul 1990, în România s-au evidenţiat câteva caracteristici ale acesteia, cum ar fi:
● reşedinţele judeţelor din România se află în cel mai mare oraş din judeţul respectiv;
● oraşele mici au avut de regulă un profil monoindustrial, stabilit fără o legătură directă cu specificul zonei, ceea ce a contribuit la falimentul rapid al profilului şi la apariţia unor probleme sociale acute;
● dezvoltarea economico-socială spaţială s-a făcut pe criterii egalitariste, astfel că în procesul industrializării nu s-a reuşit să se creeze structuri industriale proprii şi stabile pentru fiecărui judeţ ;
● la nivelul fiecărui judeţ existau decalaje economice impresio-nante atât între marile zone urbane şi micile oraşe, cât şi între mediul urban şi mediul rural;
● decalajele interjudeţene erau considerate ca fiind nesemnificative de către oficialităţi, deşi acestea erau vizibile la nivel de indicatori specifici şi la nivelul indicatorilor privind calitatea vieţii.
În aceste condiţii, a fost necesar să se adopte o serie de măsuri care să conducă la ameliorarea problemelor existente. A fost adoptată Legea 315/2004 privind dezvoltarea regională în România [ ]1 dar şi alte acte normative care stau la baza dezvoltării economice durabile şi a reducerii decalajelor economice şi sociale existente între România şi celelalte state ale Uniunii
orientations to the organisation of the European Union member states.
In order to detect the economic-social phenomena on vaster regions, the National Institute of Statistics uses the concept of development macro-regions by summing up the economic-social indicators and grouping the regions two by two according to their proximity. In consequence, Romania has 8 regions and 4 development macro-regions.
Table no 1
The development regions are the areas which correspond to some groups of counties constituted by their voluntarily association, on the basis of a convention signed by the representatives of the county councils. One has to mention that the development regions and the macro-regions do not represent a legal entity and are not administrative-territorial bodies.
In what the regional development is concerned, one can say that up to 1990, in Romania there have been pointed out a few characteristics, as it follows:
● the residences of the counties from Romania are in the largest town of that county;
● the small towns used to be mono-industrial, without any direct connection with the specificity of the area, which contributed to the rapid bankruptcy of the profile and the emergence of some severe social problems;
● the spatial economic-social development was carried out according to egalitarian criteria, so that in the process of industrialization there were no individual industrial and stable structures for each county;
● there were significant economic disparities on the level of each county both between the large urban areas and the rural environment;
● the disparities between the counties were considered as insignificant by the official bodies, although they were visible on the level of specific indices and on the level of the indices regarding the quality of life.
Under these circumstance, a series of measures had to be adopted which should lead to the improvement of the existing problems. The Law 315/2004 regarding the regional development in Romania was adopted [ ]1 , but also some other normative acts which support the economic sustainable development and the reduction of
169
Europene. Politica de dezvoltare regională reprezintă un
ansamblu de măsuri planificate şi promovate de autorităţile administraţiei publice locale şi centrale, în scopul asigurării unei creşteri economice, dinamice şi durabile, prin valorificarea eficientă a potenţialului regional şi local, în vederea îmbunătăţirii condiţiilor de viaţă. Principalele domenii care pot fi vizate de politicile regionale sunt: dezvoltarea întreprinderilor, piaţa forţei de muncă, atragerea investiţiilor, transferul de tehnologie, dezvoltarea sectorului întreprinderilor mici şi mijlocii, îmbunătăţirea infrastructurii, calitatea mediului înconjurător, dezvoltarea rurală, sănătatea, educaţia, învăţământul şi cultura.
Obiectivele de bază ale politicii de dezvoltare regională în România constau în:
● diminuarea dezechilibrelor regionale existente, cu accent pe stimularea dezvoltării echilibrate şi pe revitalizarea zonelor defavorizate (cu dezvoltare întârziată);
● stimularea cooperării inter-regionale, interne şi internaţionale, care promovează dezvoltarea economico-socială şi instituţională a acestora, în scopul realizării unor proiecte de interes comun,;
● corelarea politicilor sectoriale guvernamentale la nivelul regiunilor prin stimularea iniţiativelor şi prin valorificarea resurselor locale şi regionale, în scopul dezvoltării economico-sociale durabile şi culturale a acestora.
Principiile care stau la baza elaborării şi aplicării politicilor de dezvoltare regională sunt:
a) descentralizarea procesului de luare a deciziilor;
b) parteneriaiul în demararea programelor şi proiectelor de dezvol-tare regională;;
c) planificarea acţiunilor pentru a spori eficienţa resurselor limitate disponibile;
d) cofinanţarea sau contribuţia financiară a diverşilor actori implicaţi în realizarea programelor şi proiectelor de dezvoltare regională;
e) concentrarea sau focalizarea asupra unor aspecte şi probleme limitate şi clar identificabile, astfel încât activitatea asistată să fie legată de strategiile explicite şi obiectivele specifice şi, totodată, de resursele relativ limitate care să fie utilizate la maximum.
Creşterea economică în România a urmat direcţia Vest-Est, apropierea de pieţele din Vestul Europei acţionând ca un factor de difuzare a creşterii. Zonele subdez-voltate din România sunt concentrate în Nord-Est şi în Sud, de-a lungul Dunării.
Subdezvoltarea acestor zone este corelată cu un şomaj mai ridicat, cu preponderenţa activităţilor rurale şi cu o capacitate redusă de a atrage investiţii străine directe.
Subdezvoltarea Regiunii Nord-Est este determinată mai ales de dependenţa sa de agricultură. O situaţie similară înregistrează Regiunea Sud-Muntenia, unde agricultura reprezintă activitatea de bază (în special în judeţele din sudul regiunii) şi unde Dunărea
the economic and social disparities between Romania and the other states of the European Union.
The regional development policy de represents a framework of planned and promoted measures b the authorities of the local public and central administration, in order to provide a economic, dynamic and sustainable growth through the efficient capitalization of the regional and local potential in order to improve the living conditions. The main fields of the regional policy are: the development of the enterprises, the labour market, attracting investors, technology transfer, the development of the small and middle enterprises, the improvement of the infrastructure, the quality of the environment, rural development, health, education and culture.
The basic objectives of the regional development policy in Romania are:
● the reduction of the regional existing disparities, with an accent put on stimulating the balanced development and the revitalisation of the less favoured regions (with a late development);
● stimulating the inter-regional, internal and international cooperation which is promoting the economic-social and institutional development in order to accomplish some common interest projects;
● the correlation of the governmental sector policies on the level of the regions by stimulating the initiatives and capitalizing the local and regional resources for the sustainable economic-social and cultural development.
The principles which lie at the basis of the elaboration and application of the regional development policies are:
a) decentralization of the decision making process;
b) partnership in starting the programs and regional development projects;
c) planning the actions in order to increase the efficiency of the limited available resources;
d) co-financing or financial contribution of the different actors involved in carrying out the programs and regional development projects;
e) concentration or focus on some limited and clearly identifiable problems, so that the assisted activity could be related to the explicit strategies and specific goals, to relatively limited resources which should be used to a maximum.
The economic growth from Romania was focused on the West-East direction, the closeness to the markets from Western Europe acting as a factor of diffusing the growth. The underdeveloped regions from Romania are concentrated in North East and South along the Danube.
The underdevelopment of these regions is correlated with a higher unemployment, with the preponderance of the rural activities and with a low capacity of drawing foreign direct investments.
The underdevelopment of the North-Eastern Region is determined especially by its dependence to agriculture. A similar situation is registered by the
170
acţionează ca o barieră în calea comerţului transfrontalier. Părţile vestice şi centrale ale ţării au fost avantajate de poziţia lor mai apropiată de pieţele vestice şi de dependenţa redusă de sectorul primar. Beneficiind de aceste avantaje (poziţie geografică favorabilă comerţului exterior, un sector industrial dezvoltat şi forţă de muncă bine calificată în acest domeniu, infrastructură de transport şi comuni-caţii), regiunile vestice şi centrale au atras cel mai mult din investiţii străine directe.
2. Participarea populaţiei regiunilor la activitatea economică
După anul 1990, scăderea numărului de locuitori ai României, ca urmare a sporului natural negativ şi a emigrărilor masive în scop de muncă, a avut drept rezultat reducerea populaţiei active şi a populaţiei ocupate în toate cele opt regiuni de dezvoltare din ţară[2]. În anul 2008, comparativ cu anul 2003, se constată că a scăzut numărul persoanelor active din regiunile Nord-Vest, Centru, Nord-Est, Sud-Est şi Sud-Vest Oltenia, în timp ce în regiunile Sud-Muntenia, Bucureşti-Ilfov şi Vest a crescut numărul persoanelor active.
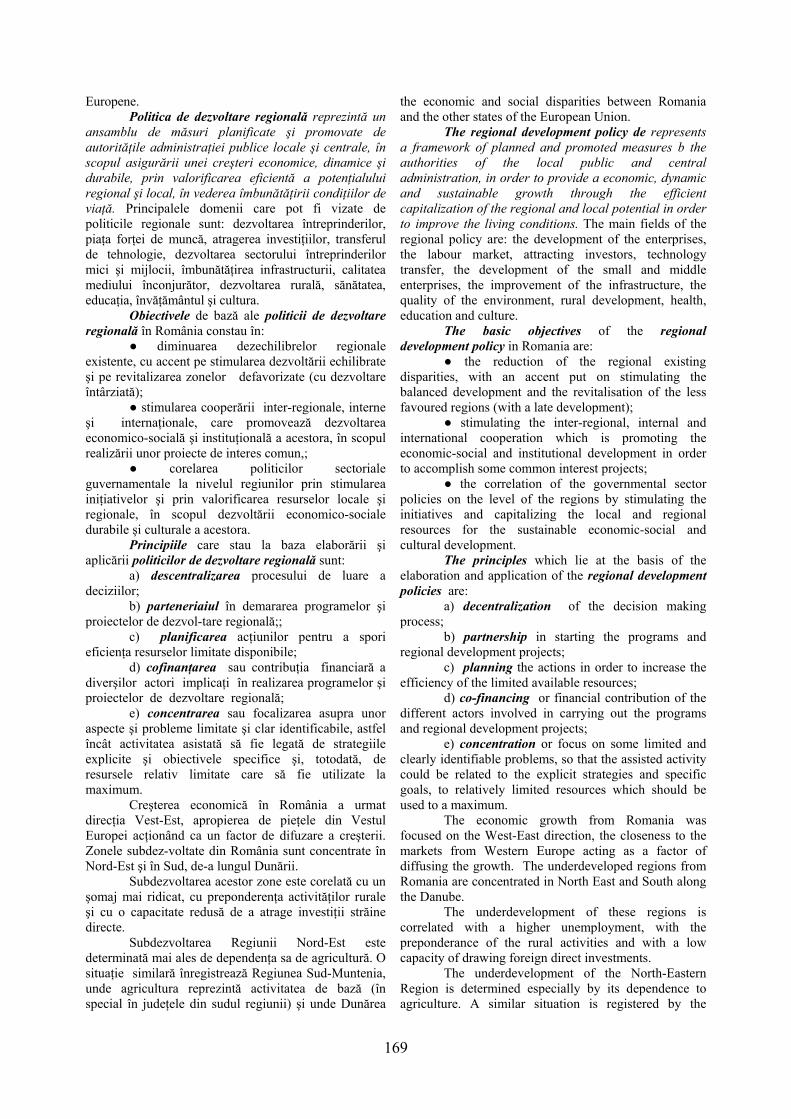
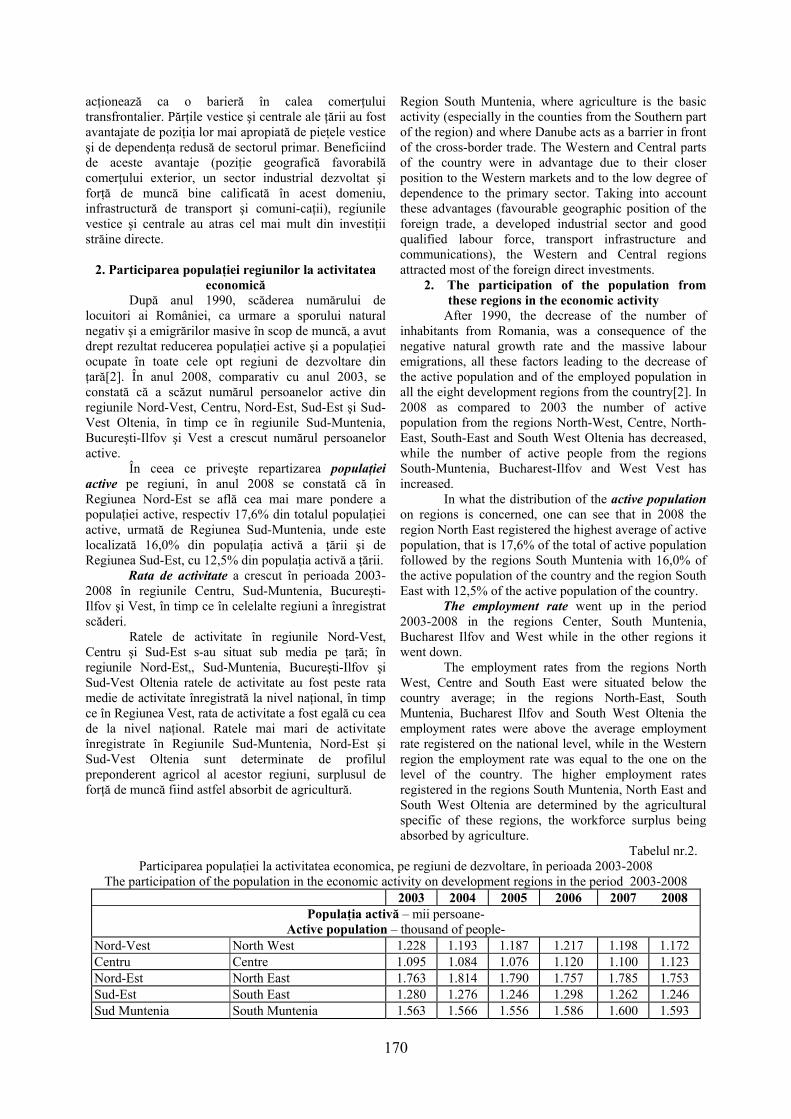
În ceea ce priveşte repartizarea populaţiei active pe regiuni, în anul 2008 se constată că în Regiunea Nord-Est se află cea mai mare pondere a populaţiei active, respectiv 17,6% din totalul populaţiei active, urmată de Regiunea Sud-Muntenia, unde este localizată 16,0% din populaţia activă a ţării şi de Regiunea Sud-Est, cu 12,5% din populaţia activă a ţării.
Rata de activitate a crescut în perioada 2003-2008 în regiunile Centru, Sud-Muntenia, Bucureşti-Ilfov şi Vest, în timp ce în celelalte regiuni a înregistrat scăderi.
Ratele de activitate în regiunile Nord-Vest, Centru şi Sud-Est s-au situat sub media pe ţară; în regiunile Nord-Est,, Sud-Muntenia, Bucureşti-Ilfov şi Sud-Vest Oltenia ratele de activitate au fost peste rata medie de activitate înregistrată la nivel naţional, în timp ce în Regiunea Vest, rata de activitate a fost egală cu cea de la nivel naţional. Ratele mai mari de activitate înregistrate în Regiunile Sud-Muntenia, Nord-Est şi Sud-Vest Oltenia sunt determinate de profilul preponderent agricol al acestor regiuni, surplusul de forţă de muncă fiind astfel absorbit de agricultură.
Region South Muntenia, where agriculture is the basic activity (especially in the counties from the Southern part of the region) and where Danube acts as a barrier in front of the cross-border trade. The Western and Central parts of the country were in advantage due to their closer position to the Western markets and to the low degree of dependence to the primary sector. Taking into account these advantages (favourable geographic position of the foreign trade, a developed industrial sector and good qualified labour force, transport infrastructure and communications), the Western and Central regions attracted most of the foreign direct investments.
2. The participation of the population from these regions in the economic activity
After 1990, the decrease of the number of inhabitants from Romania, was a consequence of the negative natural growth rate and the massive labour emigrations, all these factors leading to the decrease of the active population and of the employed population in all the eight development regions from the country[2]. In 2008 as compared to 2003 the number of active population from the regions North-West, Centre, North-East, South-East and South West Oltenia has decreased, while the number of active people from the regions South-Muntenia, Bucharest-Ilfov and West Vest has increased.
In what the distribution of the active population on regions is concerned, one can see that in 2008 the region North East registered the highest average of active population, that is 17,6% of the total of active population followed by the regions South Muntenia with 16,0% of the active population of the country and the region South East with 12,5% of the active population of the country.
The employment rate went up in the period 2003-2008 in the regions Center, South Muntenia, Bucharest Ilfov and West while in the other regions it went down.
The employment rates from the regions North West, Centre and South East were situated below the country average; in the regions North-East, South Muntenia, Bucharest Ilfov and South West Oltenia the employment rates were above the average employment rate registered on the national level, while in the Western region the employment rate was equal to the one on the level of the country. The higher employment rates registered in the regions South Muntenia, North East and South West Oltenia are determined by the agricultural specific of these regions, the workforce surplus being absorbed by agriculture.
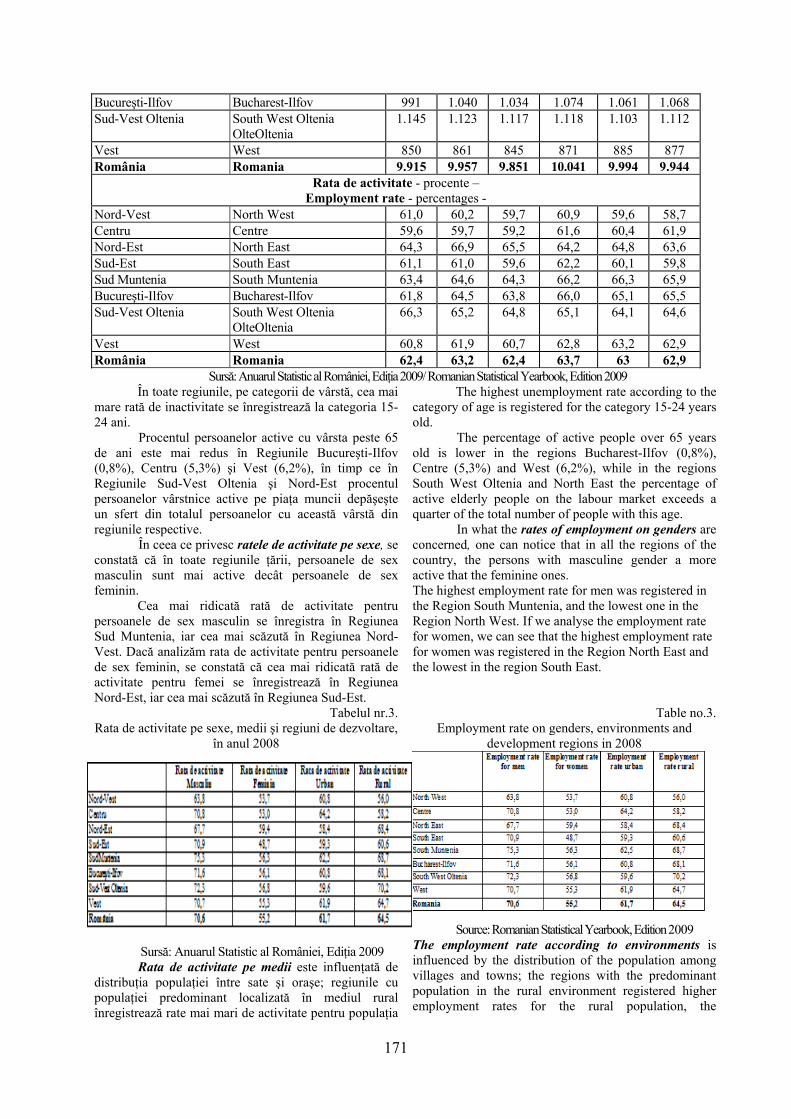
Tabelul nr.2. Participarea populaţiei la activitatea economica, pe regiuni de dezvoltare, în perioada 2003-2008
The participation of the population in the economic activity on development regions in the period 2003-2008 2003 2004 2005 2006 2007 2008
Populaţia activă – mii persoane- Active population – thousand of people-
Nord-Vest North West 1.228 1.193 1.187 1.217 1.198 1.172 Centru Centre 1.095 1.084 1.076 1.120 1.100 1.123 Nord-Est North East 1.763 1.814 1.790 1.757 1.785 1.753 Sud-Est South East 1.280 1.276 1.246 1.298 1.262 1.246 Sud Muntenia South Muntenia 1.563 1.566 1.556 1.586 1.600 1.593
171
Bucureşti-Ilfov Bucharest-Ilfov 991 1.040 1.034 1.074 1.061 1.068 Sud-Vest Oltenia South West Oltenia
OlteOltenia 1.145 1.123 1.117 1.118 1.103 1.112
Vest West 850 861 845 871 885 877 România Romania 9.915 9.957 9.851 10.041 9.994 9.944
Rata de activitate - procente – Employment rate - percentages -
Nord-Vest North West 61,0 60,2 59,7 60,9 59,6 58,7 Centru Centre 59,6 59,7 59,2 61,6 60,4 61,9 Nord-Est North East 64,3 66,9 65,5 64,2 64,8 63,6 Sud-Est South East 61,1 61,0 59,6 62,2 60,1 59,8 Sud Muntenia South Muntenia 63,4 64,6 64,3 66,2 66,3 65,9 Bucureşti-Ilfov Bucharest-Ilfov 61,8 64,5 63,8 66,0 65,1 65,5 Sud-Vest Oltenia South West Oltenia
OlteOltenia 66,3 65,2 64,8 65,1 64,1 64,6
Vest West 60,8 61,9 60,7 62,8 63,2 62,9 România Romania 62,4 63,2 62,4 63,7 63 62,9
Sursă: Anuarul Statistic al României, Ediţia 2009/ Romanian Statistical Yearbook, Edition 2009 În toate regiunile, pe categorii de vârstă, cea mai
mare rată de inactivitate se înregistrează la categoria 15-24 ani.
Procentul persoanelor active cu vârsta peste 65 de ani este mai redus în Regiunile Bucureşti-Ilfov (0,8%), Centru (5,3%) şi Vest (6,2%), în timp ce în Regiunile Sud-Vest Oltenia şi Nord-Est procentul persoanelor vârstnice active pe piaţa muncii depăşeşte un sfert din totalul persoanelor cu această vârstă din regiunile respective.
În ceea ce privesc ratele de activitate pe sexe, se constată că în toate regiunile ţării, persoanele de sex masculin sunt mai active decât persoanele de sex feminin.
Cea mai ridicată rată de activitate pentru persoanele de sex masculin se înregistra în Regiunea Sud Muntenia, iar cea mai scăzută în Regiunea Nord-Vest. Dacă analizăm rata de activitate pentru persoanele de sex feminin, se constată că cea mai ridicată rată de activitate pentru femei se înregistrează în Regiunea Nord-Est, iar cea mai scăzută în Regiunea Sud-Est.
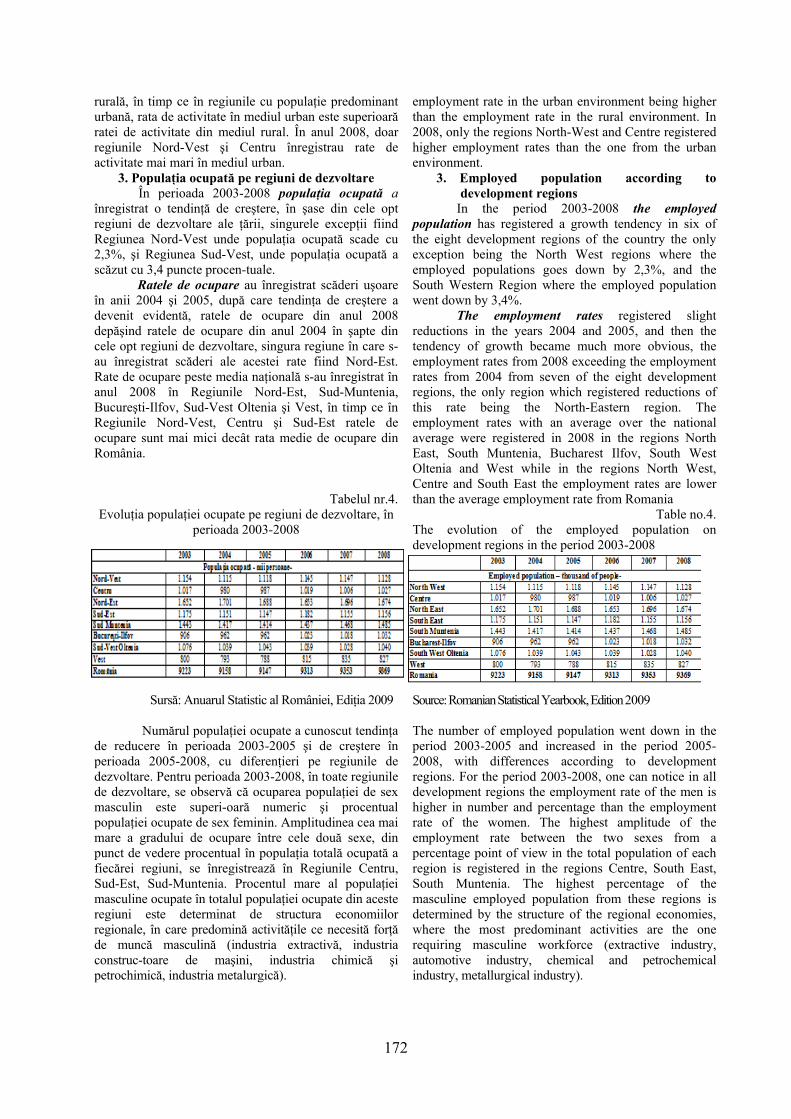
Tabelul nr.3. Rata de activitate pe sexe, medii şi regiuni de dezvoltare,
în anul 2008
Sursă: Anuarul Statistic al României, Ediţia 2009 Rata de activitate pe medii este influenţată de
distribuţia populaţiei între sate şi oraşe; regiunile cu populaţiei predominant localizată în mediul rural înregistrează rate mai mari de activitate pentru populaţia
The highest unemployment rate according to the category of age is registered for the category 15-24 years old.
The percentage of active people over 65 years old is lower in the regions Bucharest-Ilfov (0,8%), Centre (5,3%) and West (6,2%), while in the regions South West Oltenia and North East the percentage of active elderly people on the labour market exceeds a quarter of the total number of people with this age.
In what the rates of employment on genders are concerned, one can notice that in all the regions of the country, the persons with masculine gender a more active that the feminine ones. The highest employment rate for men was registered in the Region South Muntenia, and the lowest one in the Region North West. If we analyse the employment rate for women, we can see that the highest employment rate for women was registered in the Region North East and the lowest in the region South East.
Table no.3. Employment rate on genders, environments and
development regions in 2008
Source: Romanian Statistical Yearbook, Edition 2009
The employment rate according to environments is influenced by the distribution of the population among villages and towns; the regions with the predominant population in the rural environment registered higher employment rates for the rural population, the
172
rurală, în timp ce în regiunile cu populaţie predominant urbană, rata de activitate în mediul urban este superioară ratei de activitate din mediul rural. În anul 2008, doar regiunile Nord-Vest şi Centru înregistrau rate de activitate mai mari în mediul urban.
3. Populaţia ocupată pe regiuni de dezvoltare În perioada 2003-2008 populaţia ocupată a
înregistrat o tendinţă de creştere, în şase din cele opt regiuni de dezvoltare ale ţării, singurele excepţii fiind Regiunea Nord-Vest unde populaţia ocupată scade cu 2,3%, şi Regiunea Sud-Vest, unde populaţia ocupată a scăzut cu 3,4 puncte procen-tuale.
Ratele de ocupare au înregistrat scăderi uşoare în anii 2004 şi 2005, după care tendinţa de creştere a devenit evidentă, ratele de ocupare din anul 2008 depăşind ratele de ocupare din anul 2004 în şapte din cele opt regiuni de dezvoltare, singura regiune în care s-au înregistrat scăderi ale acestei rate fiind Nord-Est. Rate de ocupare peste media naţională s-au înregistrat în anul 2008 în Regiunile Nord-Est, Sud-Muntenia, Bucureşti-Ilfov, Sud-Vest Oltenia şi Vest, în timp ce în Regiunile Nord-Vest, Centru şi Sud-Est ratele de ocupare sunt mai mici decât rata medie de ocupare din România.
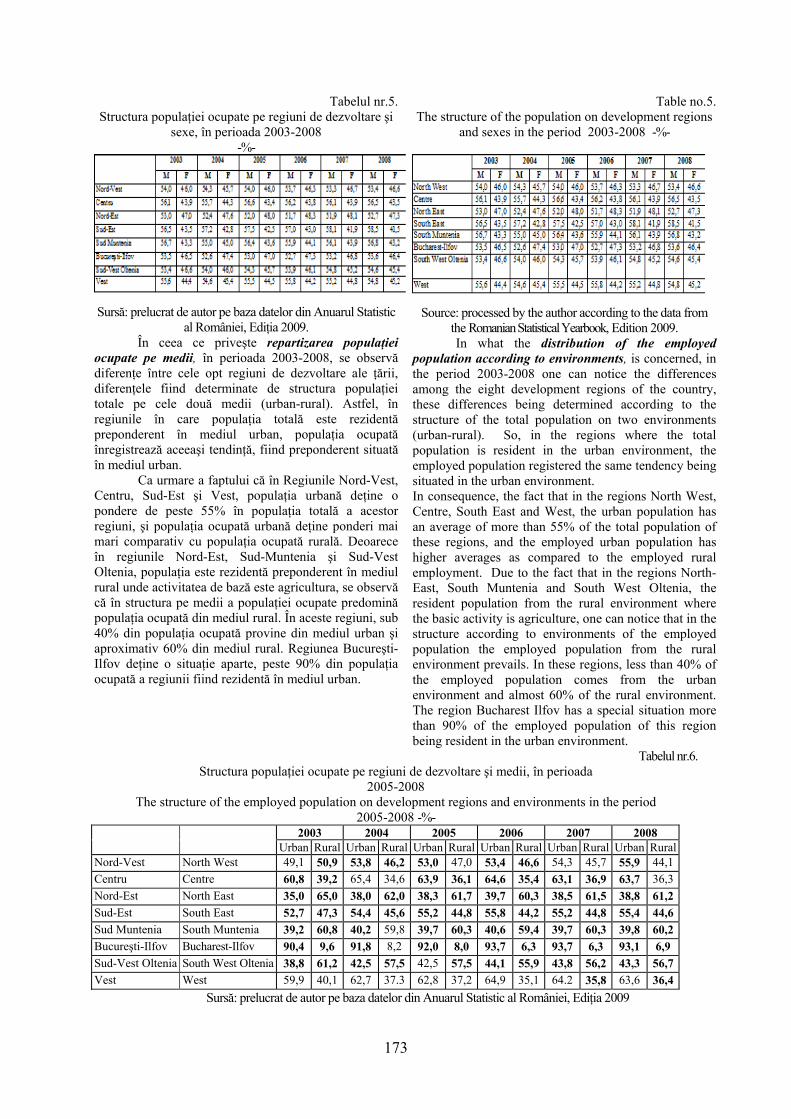
Tabelul nr.4. Evoluţia populaţiei ocupate pe regiuni de dezvoltare, în
perioada 2003-2008
Sursă: Anuarul Statistic al României, Ediţia 2009 Numărul populaţiei ocupate a cunoscut tendinţa
de reducere în perioada 2003-2005 şi de creştere în perioada 2005-2008, cu diferenţieri pe regiunile de dezvoltare. Pentru perioada 2003-2008, în toate regiunile de dezvoltare, se observă că ocuparea populaţiei de sex masculin este superi-oară numeric şi procentual populaţiei ocupate de sex feminin. Amplitudinea cea mai mare a gradului de ocupare între cele două sexe, din punct de vedere procentual în populaţia totală ocupată a fiecărei regiuni, se înregistrează în Regiunile Centru, Sud-Est, Sud-Muntenia. Procentul mare al populaţiei masculine ocupate în totalul populaţiei ocupate din aceste regiuni este determinat de structura economiilor regionale, în care predomină activităţile ce necesită forţă de muncă masculină (industria extractivă, industria construc-toare de maşini, industria chimică şi petrochimică, industria metalurgică).
employment rate in the urban environment being higher than the employment rate in the rural environment. In 2008, only the regions North-West and Centre registered higher employment rates than the one from the urban environment.
3. Employed population according to development regions
In the period 2003-2008 the employed population has registered a growth tendency in six of the eight development regions of the country the only exception being the North West regions where the employed populations goes down by 2,3%, and the South Western Region where the employed population went down by 3,4%.
The employment rates registered slight reductions in the years 2004 and 2005, and then the tendency of growth became much more obvious, the employment rates from 2008 exceeding the employment rates from 2004 from seven of the eight development regions, the only region which registered reductions of this rate being the North-Eastern region. The employment rates with an average over the national average were registered in 2008 in the regions North East, South Muntenia, Bucharest Ilfov, South West Oltenia and West while in the regions North West, Centre and South East the employment rates are lower than the average employment rate from Romania
Table no.4. The evolution of the employed population on development regions in the period 2003-2008
Source: Romanian Statistical Yearbook, Edition 2009 The number of employed population went down in the period 2003-2005 and increased in the period 2005-2008, with differences according to development regions. For the period 2003-2008, one can notice in all development regions the employment rate of the men is higher in number and percentage than the employment rate of the women. The highest amplitude of the employment rate between the two sexes from a percentage point of view in the total population of each region is registered in the regions Centre, South East, South Muntenia. The highest percentage of the masculine employed population from these regions is determined by the structure of the regional economies, where the most predominant activities are the one requiring masculine workforce (extractive industry, automotive industry, chemical and petrochemical industry, metallurgical industry).
173
Tabelul nr.5. Structura populaţiei ocupate pe regiuni de dezvoltare şi
sexe, în perioada 2003-2008 -%-
Sursă: prelucrat de autor pe baza datelor din Anuarul Statistic al României, Ediţia 2009.
În ceea ce priveşte repartizarea populaţiei ocupate pe medii, în perioada 2003-2008, se observă diferenţe între cele opt regiuni de dezvoltare ale ţării, diferenţele fiind determinate de structura populaţiei totale pe cele două medii (urban-rural). Astfel, în regiunile în care populaţia totală este rezidentă preponderent în mediul urban, populaţia ocupată înregistrează aceeaşi tendinţă, fiind preponderent situată în mediul urban.
Ca urmare a faptului că în Regiunile Nord-Vest, Centru, Sud-Est şi Vest, populaţia urbană deţine o pondere de peste 55% în populaţia totală a acestor regiuni, şi populaţia ocupată urbană deţine ponderi mai mari comparativ cu populaţia ocupată rurală. Deoarece în regiunile Nord-Est, Sud-Muntenia şi Sud-Vest Oltenia, populaţia este rezidentă preponderent în mediul rural unde activitatea de bază este agricultura, se observă că în structura pe medii a populaţiei ocupate predomină populaţia ocupată din mediul rural. În aceste regiuni, sub 40% din populaţia ocupată provine din mediul urban şi aproximativ 60% din mediul rural. Regiunea Bucureşti-Ilfov deţine o situaţie aparte, peste 90% din populaţia ocupată a regiunii fiind rezidentă în mediul urban.
Table no.5. The structure of the population on development regions
and sexes in the period 2003-2008 -%-
Source: processed by the author according to the data from the Romanian Statistical Yearbook, Edition 2009. In what the distribution of the employed
population according to environments, is concerned, in the period 2003-2008 one can notice the differences among the eight development regions of the country, these differences being determined according to the structure of the total population on two environments (urban-rural). So, in the regions where the total population is resident in the urban environment, the employed population registered the same tendency being situated in the urban environment. In consequence, the fact that in the regions North West, Centre, South East and West, the urban population has an average of more than 55% of the total population of these regions, and the employed urban population has higher averages as compared to the employed rural employment. Due to the fact that in the regions North-East, South Muntenia and South West Oltenia, the resident population from the rural environment where the basic activity is agriculture, one can notice that in the structure according to environments of the employed population the employed population from the rural environment prevails. In these regions, less than 40% of the employed population comes from the urban environment and almost 60% of the rural environment. The region Bucharest Ilfov has a special situation more than 90% of the employed population of this region being resident in the urban environment.
Tabelul nr.6. Structura populaţiei ocupate pe regiuni de dezvoltare şi medii, în perioada
2005-2008 The structure of the employed population on development regions and environments in the period
2005-2008 -%- 2003 2004 2005 2006 2007 2008 Urban Rural Urban Rural Urban Rural Urban Rural Urban Rural Urban RuralNord-Vest North West 49,1 50,9 53,8 46,2 53,0 47,0 53,4 46,6 54,3 45,7 55,9 44,1Centru Centre 60,8 39,2 65,4 34,6 63,9 36,1 64,6 35,4 63,1 36,9 63,7 36,3Nord-Est North East 35,0 65,0 38,0 62,0 38,3 61,7 39,7 60,3 38,5 61,5 38,8 61,2Sud-Est South East 52,7 47,3 54,4 45,6 55,2 44,8 55,8 44,2 55,2 44,8 55,4 44,6Sud Muntenia South Muntenia 39,2 60,8 40,2 59,8 39,7 60,3 40,6 59,4 39,7 60,3 39,8 60,2Bucureşti-Ilfov Bucharest-Ilfov 90,4 9,6 91,8 8,2 92,0 8,0 93,7 6,3 93,7 6,3 93,1 6,9 Sud-Vest Oltenia South West Oltenia 38,8 61,2 42,5 57,5 42,5 57,5 44,1 55,9 43,8 56,2 43,3 56,7Vest West 59,9 40,1 62,7 37.3 62,8 37,2 64,9 35,1 64.2 35,8 63,6 36,4
Sursă: prelucrat de autor pe baza datelor din Anuarul Statistic al României, Ediţia 2009
174
Referitor la structura populaţiei ocupate pe
grupe de vârstă, în toate regiunile de dezvoltare ale ţării se constată o scădere a ponderii populaţiei tinere ocupate, cu vârsta sub 24 de ani, concomitent cu creşterea ponderii populaţiei ocupate din grupele de vârstă 35-44 ani şi 45-54 ani. Totodată, ca urmare a posibilităţilor de pensionare anticipată, înainte de limita de vârstă legală de pensionare, a scăzut şi ponderea persoanelor ocupate din categoria de vârstă 55-64 ani.
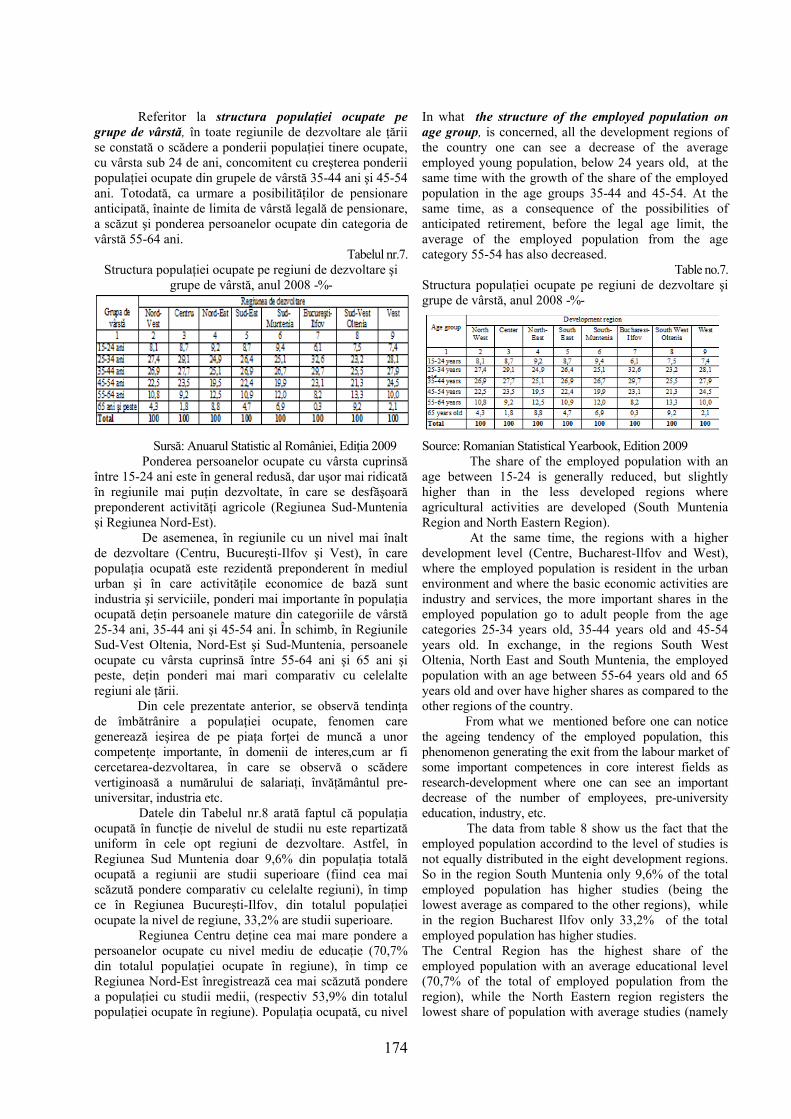
Tabelul nr.7. Structura populaţiei ocupate pe regiuni de dezvoltare şi
grupe de vârstă, anul 2008 -%-
Sursă: Anuarul Statistic al României, Ediţia 2009 Ponderea persoanelor ocupate cu vârsta cuprinsă
între 15-24 ani este în general redusă, dar uşor mai ridicată în regiunile mai puţin dezvoltate, în care se desfăşoară preponderent activităţi agricole (Regiunea Sud-Muntenia şi Regiunea Nord-Est).
De asemenea, în regiunile cu un nivel mai înalt de dezvoltare (Centru, Bucureşti-Ilfov şi Vest), în care populaţia ocupată este rezidentă preponderent în mediul urban şi în care activităţile economice de bază sunt industria şi serviciile, ponderi mai importante în populaţia ocupată deţin persoanele mature din categoriile de vârstă 25-34 ani, 35-44 ani şi 45-54 ani. În schimb, în Regiunile Sud-Vest Oltenia, Nord-Est şi Sud-Muntenia, persoanele ocupate cu vârsta cuprinsă între 55-64 ani şi 65 ani şi peste, deţin ponderi mai mari comparativ cu celelalte regiuni ale ţării.
Din cele prezentate anterior, se observă tendinţa de îmbătrânire a populaţiei ocupate, fenomen care generează ieşirea de pe piaţa forţei de muncă a unor competenţe importante, în domenii de interes,cum ar fi cercetarea-dezvoltarea, în care se observă o scădere vertiginoasă a numărului de salariaţi, învăţământul pre-universitar, industria etc.
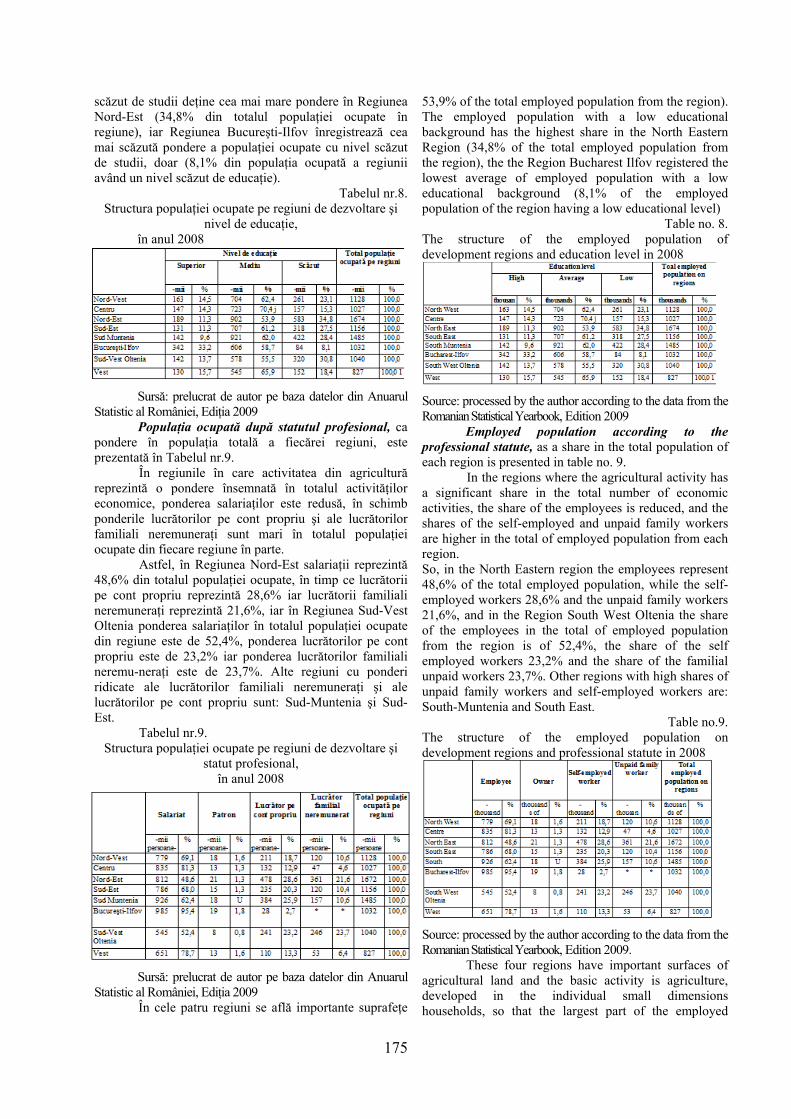
Datele din Tabelul nr.8 arată faptul că populaţia ocupată în funcţie de nivelul de studii nu este repartizată uniform în cele opt regiuni de dezvoltare. Astfel, în Regiunea Sud Muntenia doar 9,6% din populaţia totală ocupată a regiunii are studii superioare (fiind cea mai scăzută pondere comparativ cu celelalte regiuni), în timp ce în Regiunea Bucureşti-Ilfov, din totalul populaţiei ocupate la nivel de regiune, 33,2% are studii superioare.
Regiunea Centru deţine cea mai mare pondere a persoanelor ocupate cu nivel mediu de educaţie (70,7% din totalul populaţiei ocupate în regiune), în timp ce Regiunea Nord-Est înregistrează cea mai scăzută pondere a populaţiei cu studii medii, (respectiv 53,9% din totalul populaţiei ocupate în regiune). Populaţia ocupată, cu nivel
In what the structure of the employed population on age group, is concerned, all the development regions of the country one can see a decrease of the average employed young population, below 24 years old, at the same time with the growth of the share of the employed population in the age groups 35-44 and 45-54. At the same time, as a consequence of the possibilities of anticipated retirement, before the legal age limit, the average of the employed population from the age category 55-54 has also decreased.
Table no.7. Structura populaţiei ocupate pe regiuni de dezvoltare şi grupe de vârstă, anul 2008 -%-
Source: Romanian Statistical Yearbook, Edition 2009 The share of the employed population with an
age between 15-24 is generally reduced, but slightly higher than in the less developed regions where agricultural activities are developed (South Muntenia Region and North Eastern Region).
At the same time, the regions with a higher development level (Centre, Bucharest-Ilfov and West), where the employed population is resident in the urban environment and where the basic economic activities are industry and services, the more important shares in the employed population go to adult people from the age categories 25-34 years old, 35-44 years old and 45-54 years old. In exchange, in the regions South West Oltenia, North East and South Muntenia, the employed population with an age between 55-64 years old and 65 years old and over have higher shares as compared to the other regions of the country.
From what we mentioned before one can notice the ageing tendency of the employed population, this phenomenon generating the exit from the labour market of some important competences in core interest fields as research-development where one can see an important decrease of the number of employees, pre-university education, industry, etc.
The data from table 8 show us the fact that the employed population accordind to the level of studies is not equally distributed in the eight development regions. So in the region South Muntenia only 9,6% of the total employed population has higher studies (being the lowest average as compared to the other regions), while in the region Bucharest Ilfov only 33,2% of the total employed population has higher studies. The Central Region has the highest share of the employed population with an average educational level (70,7% of the total of employed population from the region), while the North Eastern region registers the lowest share of population with average studies (namely
175
scăzut de studii deţine cea mai mare pondere în Regiunea Nord-Est (34,8% din totalul populaţiei ocupate în regiune), iar Regiunea Bucureşti-Ilfov înregistrează cea mai scăzută pondere a populaţiei ocupate cu nivel scăzut de studii, doar (8,1% din populaţia ocupată a regiunii având un nivel scăzut de educaţie).
Tabelul nr.8. Structura populaţiei ocupate pe regiuni de dezvoltare şi
nivel de educaţie, în anul 2008
Sursă: prelucrat de autor pe baza datelor din Anuarul Statistic al României, Ediţia 2009
Populaţia ocupată după statutul profesional, ca pondere în populaţia totală a fiecărei regiuni, este prezentată în Tabelul nr.9.
În regiunile în care activitatea din agricultură reprezintă o pondere însemnată în totalul activităţilor economice, ponderea salariaţilor este redusă, în schimb ponderile lucrătorilor pe cont propriu şi ale lucrătorilor familiali neremuneraţi sunt mari în totalul populaţiei ocupate din fiecare regiune în parte.
Astfel, în Regiunea Nord-Est salariaţii reprezintă 48,6% din totalul populaţiei ocupate, în timp ce lucrătorii pe cont propriu reprezintă 28,6% iar lucrătorii familiali neremuneraţi reprezintă 21,6%, iar în Regiunea Sud-Vest Oltenia ponderea salariaţilor în totalul populaţiei ocupate din regiune este de 52,4%, ponderea lucrătorilor pe cont propriu este de 23,2% iar ponderea lucrătorilor familiali neremu-neraţi este de 23,7%. Alte regiuni cu ponderi ridicate ale lucrătorilor familiali neremuneraţi şi ale lucrătorilor pe cont propriu sunt: Sud-Muntenia şi Sud-Est.
Tabelul nr.9. Structura populaţiei ocupate pe regiuni de dezvoltare şi
statut profesional, în anul 2008
Sursă: prelucrat de autor pe baza datelor din Anuarul Statistic al României, Ediţia 2009
În cele patru regiuni se află importante suprafeţe
53,9% of the total employed population from the region). The employed population with a low educational background has the highest share in the North Eastern Region (34,8% of the total employed population from the region), the the Region Bucharest Ilfov registered the lowest average of employed population with a low educational background (8,1% of the employed population of the region having a low educational level)
Table no. 8. The structure of the employed population of development regions and education level in 2008
Source: processed by the author according to the data from the Romanian Statistical Yearbook, Edition 2009
Employed population according to the professional statute, as a share in the total population of each region is presented in table no. 9.
In the regions where the agricultural activity has a significant share in the total number of economic activities, the share of the employees is reduced, and the shares of the self-employed and unpaid family workers are higher in the total of employed population from each region. So, in the North Eastern region the employees represent 48,6% of the total employed population, while the self-employed workers 28,6% and the unpaid family workers 21,6%, and in the Region South West Oltenia the share of the employees in the total of employed population from the region is of 52,4%, the share of the self employed workers 23,2% and the share of the familial unpaid workers 23,7%. Other regions with high shares of unpaid family workers and self-employed workers are: South-Muntenia and South East.
Table no.9. The structure of the employed population on development regions and professional statute in 2008
Source: processed by the author according to the data from the Romanian Statistical Yearbook, Edition 2009.
These four regions have important surfaces of agricultural land and the basic activity is agriculture, developed in the individual small dimensions households, so that the largest part of the employed
176
de teren agricol iar activitatea de bază este agricultura, desfăşurată în gospodăriile individuale de mici dimensiuni, astfel încât, cea mai mare parte a populaţiei ocupate din aceste regiuni este încadrată drept lucrători pe cont propriu sau lucrători familiali neremuneraţi. De asemenea, nu trebuie pierdut din vedere nici faptul că peste 55% din populaţia regiunilor respective locuieşte în mediul rural, cea mai mare parte a populaţiei din acest mediu fiind ocupată în agricultură.
În regiunile din vestul şi centrul ţării, dar şi în Regiunea Bucureşti-Ilfov, în care s-au dezvoltat cu precă-dere activităţi industriale şi de servicii, ponderea salariaţilor în totalul populaţiei ocupate a regiunilor respective este ridicată.
De asemenea, în regiunile mai dezvoltate din punct de vedere econo-mic, se constată o pondere mai ridicată a numărului patronilor în totalul populaţiei ocupate din aceste regiuni. Astfel, în Regiunea Bucureşti-Ilfov ponderea patronilor este de 1,8%, iar în Regiunile Nord-Vest şi Vest aceştia reprezintă 1,6% din totalul populaţiei ocupate din aceste două regiuni de dezvoltare. Cea mai mică pondere a patronilor se înregistrează în Regiunea Sud-Vest Oltenia, unde doar 0,8% din populaţia ocupată din regiune este încadrată în această categorie.
În anul 2008, din totalul salariaţilor din România, 15,6% erau localizaţi în Regiunea Bucureşti-Ilfov, 14,7% în Regiunea Sud-Muntenia şi 8,6% în Regiunea Sud-Vest Oltenia. În celelalte regiuni de dezvoltare se constată o repartizare aproximativ uniformă a numărului de salariaţi, fiecare regiune deţinând 12-13 procente din numărul total de salariaţi ce îşi desfăşoară activitatea în economia românească. Ponderea mai mare sau mai mică a numărului de salariaţi din fiecare regiune a ţării este determinată de numărul populaţiei totale din fiecare regiune, precum şi de gradul de dezvoltare economică a regiunii şi de specificul activităţilor desfăşurate în aceste regiuni.
În structura populaţiei ocupate pe activităţi şi sectoare ale economiei naţionale, datorită mutaţiilor care s-au produs după 1989 au intervenit următoarele schimbări:
- restructurarea sectorului industriei grele, care a antrenat o scădere semnificativă a populaţiei ocupate în acest sector;
- şomajul industrial, care a determinat fenomenul de întoarcere la sat, şi deci creşterea forţei de muncă ocupate în agricultură;
- dinamica sectorului servicii, şi în special a comerţului, care a permis absorbţia unei părţi însemnate a populaţiei active.
În ceea ce priveşte ponderea populaţiei ocupate pe sectoare econo-mice, se poate observa că tendinţa este de scădere pentru agricultură şi industrie, dar din motive diferite. Agricultura reprezintă un sector neatractiv şi cu o productivitate a muncii scăzută, deşi în acest sector există un număr mare de persoane ocupate. În industrie, analiza trebuie defalcată pe ramuri industriale şi pe regiuni de dezvoltare, existând unele ramuri în dezvoltare, care atrag forţă de muncă, dar şi ramuri în declin, care generează şomaj. Sectorul construcţii înregistrează o tendinţă de creştere, ceea ce determină o creştere a ocupării în acest sector. Sectorul serviciilor manifestă o tendinţă de creştere
population from these regions consists of self-employed workers or unpaid family workers. At the same time one should not overcome the fact that more than 55% of the population from those regions lives in the rural environment, most of the population from this environment being employed in agriculture.
In the regions from the Western and Central part of the country, but also in the region Bucharest Ilfov, where industrial and services activities were developed, the share of the employees in the total of employed population is high. At the same time the more developed regions from an economic point of view register a higher average of the number of owners in the total of employed population from these regions. So, in the region Bucharest-Ilfov, the share of the owners is 1,6% of the total of employed population from these two development regions. The lowest share of the owners in registered in the region South-West Oltenia, where only 0,8% of the employed population goes to this category.
In 2008, from the total number of employees from Romania 15,6% were in the region Bucharest-Ilfov, 14,7% in the region South-Muntenia and 8,6% in the region South West Oltenia. In the other development regions one can see a almost homogenous distribution of the number of employees, each region having 12-13 percentages from the total number of employees which carry out their activity in the Romanian economy. The highest or lowest share of the number of employees from each region of the country is determined by the number of total population from each region as well as by the degree of economic development of the region and the specificity of the activities carried out in these regions.
The following changes have come up in the structure of employed population on activities and sectors of the national economy, due to the mutations which have been produced after 1989:
- restructuring the hard industry sector, which registered a significant decrease of the employed population in this sector;
- Industrial unemployment l, which determined the phenomenon of coming back to the village, so the growth of the workforce in agriculture;
- Dynamics of the services sector, and especially of trade which allowed the absorption of a significant part of the active population.
In what the share of the employed population is concerned one can notice that there is a tendency of reduction for agriculture for different reasons. Agriculture is not an attractive sector with a low labour productivity, although in this sector there are a high number of employed people. In industry, the analysis should divided on industrial branches and development regions, because there are some developing branches, which attract workforce, but also declining branches which generate unemployment. The construction sector registered a tendency of growth which determines a growth of the employment in this sector. The sector of the services manifests a fast development tendency, doubled by the emergence and development of some
177
rapidă, dublată de apariţia şi dezvoltarea unor subramuri ale acestui sector. Evoluţiile pozitive din servicii antrenează o creştere a populaţiei ocupate în acest sector.
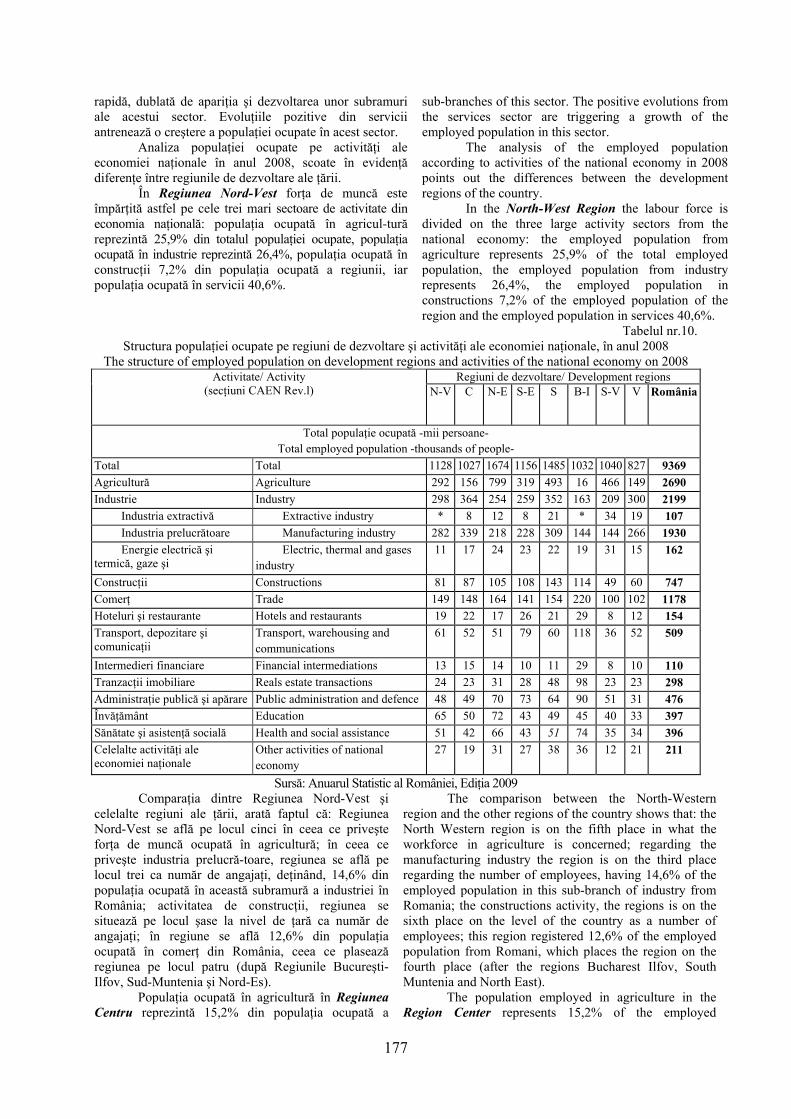
Analiza populaţiei ocupate pe activităţi ale economiei naţionale în anul 2008, scoate în evidenţă diferenţe între regiunile de dezvoltare ale ţării.
În Regiunea Nord-Vest forţa de muncă este împărţită astfel pe cele trei mari sectoare de activitate din economia naţională: populaţia ocupată în agricul-tură reprezintă 25,9% din totalul populaţiei ocupate, populaţia ocupată în industrie reprezintă 26,4%, populaţia ocupată în construcţii 7,2% din populaţia ocupată a regiunii, iar populaţia ocupată în servicii 40,6%.
sub-branches of this sector. The positive evolutions from the services sector are triggering a growth of the employed population in this sector.
The analysis of the employed population according to activities of the national economy in 2008 points out the differences between the development regions of the country.
In the North-West Region the labour force is divided on the three large activity sectors from the national economy: the employed population from agriculture represents 25,9% of the total employed population, the employed population from industry represents 26,4%, the employed population in constructions 7,2% of the employed population of the region and the employed population in services 40,6%.
Tabelul nr.10. Structura populaţiei ocupate pe regiuni de dezvoltare şi activităţi ale economiei naţionale, în anul 2008
The structure of employed population on development regions and activities of the national economy on 2008 Regiuni de dezvoltare/ Development regions Activitate/ Activity
(secţiuni CAEN Rev.l)
N-V C N-E S-E S B-I S-V V România
Total populaţie ocupată -mii persoane- Total employed population -thousands of people-
Total Total 1128 1027 1674 1156 1485 1032 1040 827 9369 Agricultură Agriculture 292 156 799 319 493 16 466 149 2690 Industrie Industry 298 364 254 259 352 163 209 300 2199 Industria extractivă Extractive industry * 8 12 8 21 * 34 19 107 Industria prelucrătoare Manufacturing industry 282 339 218 228 309 144 144 266 1930 Energie electrică şi termică, gaze şi
Electric, thermal and gases industry
11 17 24 23 22 19 31 15 162
Construcţii Constructions 81 87 105 108 143 114 49 60 747 Comerţ Trade 149 148 164 141 154 220 100 102 1178 Hoteluri şi restaurante Hotels and restaurants 19 22 17 26 21 29 8 12 154 Transport, depozitare şi comunicaţii
Transport, warehousing and communications
61 52 51 79 60 118 36 52 509
Intermedieri financiare Financial intermediations 13 15 14 10 11 29 8 10 110 Tranzacţii imobiliare Reals estate transactions 24 23 31 28 48 98 23 23 298 Administraţie publică şi apărare Public administration and defence 48 49 70 73 64 90 51 31 476 Învăţământ Education 65 50 72 43 49 45 40 33 397 Sănătate şi asistenţă socială Health and social assistance 51 42 66 43 51 74 35 34 396 Celelalte activităţi ale economiei naţionale
Other activities of national economy
27 19 31 27 38 36 12 21 211
Sursă: Anuarul Statistic al României, Ediţia 2009 Comparaţia dintre Regiunea Nord-Vest şi
celelalte regiuni ale ţării, arată faptul că: Regiunea Nord-Vest se află pe locul cinci în ceea ce priveşte forţa de muncă ocupată în agricultură; în ceea ce priveşte industria prelucră-toare, regiunea se află pe locul trei ca număr de angajaţi, deţinând, 14,6% din populaţia ocupată în această subramură a industriei în România; activitatea de construcţii, regiunea se situează pe locul şase la nivel de ţară ca număr de angajaţi; în regiune se află 12,6% din populaţia ocupată în comerţ din România, ceea ce plasează regiunea pe locul patru (după Regiunile Bucureşti-Ilfov, Sud-Muntenia şi Nord-Es).
Populaţia ocupată în agricultură în Regiunea Centru reprezintă 15,2% din populaţia ocupată a
The comparison between the North-Western region and the other regions of the country shows that: the North Western region is on the fifth place in what the workforce in agriculture is concerned; regarding the manufacturing industry the region is on the third place regarding the number of employees, having 14,6% of the employed population in this sub-branch of industry from Romania; the constructions activity, the regions is on the sixth place on the level of the country as a number of employees; this region registered 12,6% of the employed population from Romani, which places the region on the fourth place (after the regions Bucharest Ilfov, South Muntenia and North East).
The population employed in agriculture in the Region Center represents 15,2% of the employed
178
regiunii. Populaţia ocupată în industrie reprezintă 35,5% din totalul populaţiei ocupate din regiune, din care o pondere importantă o deţin persoanele ocupate în industria prelucrătoare. Persoanele ocupate în activităţile de servicii repre-zintă 39,9% din populaţia ocupată a regiunii. Judeţul Braşov deţine pondere cea mai mare a persoanelor ocupate în servicii (42,7%), precum şi ponderea cea mai mare a populaţiei ocupate în construcţii, comparativ cu celelalte judeţe, urmat de judeţul Sibiu, cu o structură asemănătoare a populaţiei ocupate.
Dacă analizăm situaţia ocupării în Regiunea Centru comparativ cu celelalte regiuni ale ţării, se desprind următoarele observaţii: regiunea se află pe locul şase între cele opt regiuni de dezvoltare ale ţării ca număr de persoane ocupate în agricul-tură, respectiv 5,8% din populaţia ocupată în agricultura României. Populaţia ocupată în industrie repre-zintă 16,6% din populaţia ocupată în industria din România şi se află pe primul loc comparativ cu celelalte regiuni ale ţării. Populaţia ocupată în comerţ reprezintă 12,6% din populaţia ocupată în această subramură a economiei româneşti. Ponderea populaţiei ocupate în celelalte servicii este mai redusă comparativ cu alte regiuni, şi reprezintă 11,3% din populaţia ocupată în servicii în România.
Din populaţia totală ocupată în Regiunea Nord-Est, 47,7% îşi desfăşoară activitatea în agricultură, 15,2% în industrie şi 37,1% în servicii.
Comparativ cu celelalte regiuni, Regiunea Nord-Est se află pe primul loc în ceea ce priveşte numărul persoanelor ocupate în agricultură; ponderea persoanelor ocupate în domeniul agricol din această regiune este de cel puţin l0 ori mai mare decât în regiunile din ţările Uniunii Europene.
Ponderea scăzută a populaţiei ocupate în industrie este determinată de faptul că industria din această regiune nu a beneficiat de avantajul unor investiţii importante (naţionale sau străine), precum şi de faptul că regiunea nu se află într-o poziţie geografică strategică favorabilă în raport cu pieţele externe de desfacere (în special din Uniunea Europeană).
Ponderea populaţiei ocupate în servicii este redusă comparativ cu situaţia la nivel naţional, Regiunea Nord-Est situându-se pe ultimele locuri în ceea ce priveşte populaţia ocupată în activităţile de hoteluri şi restaurante (locul 6), deşi regiunea dispune de un potenţial turistic deosebit, dar prea puţin valorificat şi pe locul 7 în ceea ce priveşte populaţia ocupată în activităţile de transport, depozitare şi comunicaţii.
În Regiunea Sud-Est, agricultura deţine prima poziţie din punct de vedere structural, cu 27,6%, în timp ce activitatea industrială reuneşte 22,4% din populaţia ocupată în teritoriul economic analizat. În sectorul servicii îşi desfăşoară activitatea 40,1% din populaţia ocupată a regiunii, în cadrul acestuia un loc aparte ocupându-1 comerţul.
Deşi dispune de un potenţial agricol ridicat,
population of the region. The employed population in industry represents 35,5% of the total of employed population in the region, of which an important share goes to the people employed in the manufacturing industry. The people employed in services activities represent 39,9% of the employed population of the region. The county Bra�ov has the highest average of the people employed in services (42,7%), as well as the highest average of the population in constructions as compared to the other counties followed by Sibiu with a structure similar to the one of the employed population.
If we analyse the situation of employment from the Central region as compared to the other regions of the country, one can notice the following remarks: the region is on the sixth place among the eight development regions of the country according to the number of employed people in agriculture, respectively 5,8% of the employed population in the Romanian agriculture. The employed population in industry represents 16,6% of the population employed in the Romanian industry and it is on the first place as compared to the other regions of the country. The employed population from trade represents 12,6% of the population employed in this sub-branch of the Romanian economy. The share of the employed population in other services is more reduced as compared to other regions and represents 11,3% of the population employed in services from Romania.
From the total employed population in the North-Eastern region, 47,7% carry out their activity in agriculture, 15,2% in industry and 37,1% in services.
As compared to the other regions, the North-Eastern region is on the first place in what the number of employed people in agriculture is concerned; the share of the employed people in agriculture from this region is at least 10 times higher than the one from the regions of the European Union countries.
The low share of the employed population in industry is determined by the fact that the industry from this region did not benefit from important investments (national or foreign), as well as by the fact that the region is not in a favourable strategic region in comparison to the external trade markets (especially from the European Union).
The share of the employed population in services is relatively low as compared to the situation on a national level, the North-Eastern region situating on the last places regarding the employed population in hotels and restaurants (6th place), although the region has a special tourism potential but which is not capitalized and on the 7th place regarding the employed population from transport, warehousing and communications.
In the South-Eastern Region, agriculture is on the first position from a structural point of view, with 27,6% while the industrial activity reunites 22,4% of the employed population in the analysed economic territory. In the services sector 40,1% of the employed population of the region are carrying out their activity a special place belonging to trade.
Although it has a high agricultural potential the region is on the fourth place as a number of people
179
regiunea se află pe locul patru ca număr de persoane ocupate în agricultură, ceea ce reprezintă 11,9% din populaţia ocupată în agricultura României. Populaţia ocupată în industrie reprezintă 12,8% din populaţia totală ocupată în industrie la nivel naţional. Datorită prezenţei în regiune a zonei litoralului, dar şi a Deltei Dunării (importante puncte de atracţie turistică, în care există un număr însemnat de capacităţi de cazare şi de restaurante), în activitatea de hoteluri şi restaurante lucrează un număr mai mare de persoane, comparativ cu celelalte regiuni ale ţării. De asemenea, în Regiunea Sud-Est, peste 79 mii persoane (aproximativ 16% din totalul persoanelor ocupate în această subramură de activitate) sunt ocupate în activităţile de transport, depozitare şi comunicaţii. Acest lucru este determinat de prezenţa în regiune a portului maritim Constanţa, a bogatei infrastructuri de transport, care permite practicarea în bune condiţii a tuturor formelor de transport.
În Regiunea Sud-Muntenia, în anul 2008, persoanele ocupate în agricultură reprezentau 33,2% din totalul populaţiei ocupate în regiune, persoanele ocupate în industrie 23,7%, circa 9,6% în construcţii şi 33,4% în servicii.
Regiunea Sud-Muntenia se află pe locul doi în ceea ce priveşte numărul de persoane ocupate în agricultură (după Regiunea Nord-Est), cu o pondere de 18% în totalul populaţiei ocupate în agricultura României. Populaţia ocupată în industrie repre-zintă 16% din populaţia ocupată în industria României. Regiunea Sud-Muntenia se află pe primul loc ca număr de persoane ocupate în activi-tatea de construcţii, respectiv 143 mii persoane, ceea ce reprezintă 19,2% din populaţia ocupată în România în domeniul construcţiilor. În cadrul serviciilor, se detaşează activitatea de comerţ, în care sunt ocupate 154 mii persoane, respectiv 13,0% din populaţia ocupată în comerţ în România.
În Regiunea Bucureşti-Ilfov ocuparea forţei de muncă pe sectoare are o structură diferită faţă de celelalte regiuni ale ţării. Agricultura este o activitate subsidiară, doar 1,5% din populaţia ocupată a regiunii fiind încadrată în acest sector de activitate; industria şi construcţiile deţin 26,8% din populaţia ocupată a regiunii, iar serviciile 71,6%. Deci, regiunea are o economie preponderent orientată spre servicii, în cadrul cărora, ponderi importante din populaţia ocupată deţin: comerţul (29,8% din totalul populaţiei ocupate în servicii în regiune), activităţile de transport, depozitare şi comunicaţii (care deţin 16,0% din populaţia ocupată în servicii) şi activităţile de tranzacţii imobiliare, (cu 13,3% din totalul populaţiei ocupate în servicii în regiune).
În comparaţie cu celelalte regiuni ale ţării, Regiunea Bucureşti-Ilfov se află pe ultimul loc în ceea ce priveşte ponderea populaţiei ocupate în agricultură şi în industrie în totalul populaţiei ocupate în România în cele două sectoare. Astfel, în agricultură lucrează 0,6% din populaţia ocupată în agricultura României, iar în industrie 7,4% din populaţia ocupată în industrie la nivelul economiei naţionale. În schimb, în ceea ce
employed in agriculture, which represents 11,9% of the employed population in the Romanian agriculture. The employed population from industry represents 12,8% of the total employed population in industry on a national level. Due to the presence in the region of the seaside but also of the Danube Delta (which are important sights, where there is a large number of accommodation places and restaurants), the hotel and restaurant activity includes a larger number of people as compared to the other regions of the country. In the South-Eastern Region more than 79 thousand people (almost 16% of the total number of employed people in this sub-branch of activity) are employed in the transport, warehousing and communications activities. This aspect is determined by the presence in the region of the maritime harbour Constanţa, of the rich transport infrastructure which allows the practicing of any type of sports under good circumstances.
In the region South-Muntenia, in 2008, the people employed in agriculture represented 33,2% of the total employed population from the region, people employed in industry 23,7%, almost 9,6% in constructions and 33,4% in services.
The region South Muntenia is on the second place in what the number of employed people in agriculture is concerned (after the North Eastern Region) with a share of 18% in the total of employed population in agriculture from Romania. The people employed in industry represent 16% of the people employed in the Romanian industry. The region South-Muntenia is on the first place as a number of people employed in the constructions activity respectively 143 thousand of people, which represent 19,2% of the population employed in Romania in the field of constructions. In the services field, the trade activity stands apart and 154 thousand people are employed in it, namely 13% of the population employed in trade from Romania.
In the region Bucharest Ilfov the employment of the workforce on sectors has a different structure from that of the other regions of the country. Agriculture is a subsidiary activity, only 1,5% of the employed population of the region being framed in this activity sector; industry and constructions have 26,8% of the employed population of the region and services 71,6%. So, the regions has a services-oriented economy where important shares of the employees are in the following fields: trade (29,8% of the total of employed population in services from the region), transport activities, warehousing and communications (which have 16,0% of the population employed in services) and the real estate transactions (with 13,3% of the total of employed population from the region).
In comparison to the other regions of the country, the region Bucharest Ilfov is on the last place in what the share of the employed population in agriculture and industry is concerned. So, in agriculture 0,6% of the employed population work in the Romanian agriculture, and in industry 7,4% of the employed population on the level of the national economy. In exchange in what the employed population in services activities is concerned, the region is on the last place as compared to the other
180
priveşte populaţia ocupată în activităţile de servicii, regiunea se situează pe primul loc, comparativ cu celelalte regiuni de dezvoltare.
Regiunea Sud- Vest Oltenia deţine un număr important de persoane ocupate în agricultură, respectiv 44,8% din populaţia ocupată a regiunii. În industrie lucrează 209 mii persoane, din care 16,3% în industria extractivă, 14,6% în activităţile de energie electrică şi termică, gaze şi apă şi 68,9% în industria prelucrătoare. Activitatea de construcţii este slab reprezentată în regiune, doar 4,7% din populaţia ocupată din regiune lucrând în acest domeniu. În activităţile de servicii sunt încadrate 313 mii persoane, dintre acestea aproximativ 32% lucrează în comerţ, 16,3% în administraţie publică şi apărare şi 12,8% în învăţământ.
Regiunea Sud-Vest Oltenia se află pe locul trei ca număr de persoane ocupate în agricultură (466 mii persoane) cu o pondere de 17,3% în total populaţie ocupată în agricultura României. Deşi ca număr al persoanelor ocupate în total industrie, regiunea se află pe ultimul loc, (cu 209 mii persoane ocupate), pe subramuri ale industriei se constată că regiunea deţine primul loc în ceea ce priveşte populaţia ocupată în industria extractivă (cu 36,5% din populaţia ocupată în industria extractivă la nivel naţional) şi în activităţile de energie electrică, termică, gaze şi apă (cu o pondere de 19,2% din populaţia ocupată în această subramură a economiei naţionale). În privinţa activităţilor de construcţii şi servicii, regiunea se situează pe ultimul loc, ca număr de persoane ocupate comparativ cu celelalte regiuni ale ţării. Astfel, regiunea contribuie cu 8,5% (100 mii persoane) la totalul populaţiei ocupate în comerţ, cu 5,2% (8 mii persoane) la totalul populaţiei ocupate în activităţile de hoteluri şi restaurante şi cu 7,3% la totalul populaţiei ocupate în activităţile de intermedieri financiare. Regiunea se situează pe ultimul loc şi în ceea ce priveşte populaţia ocupată în activităţile de transport, depozitare şi comunicaţii.
Urmare a faptului că Regiunea Vest are cel mai mic număr de locuitori dintre toate regiunile ţării, populaţia ocupată este corelată cu numărul populaţiei din regiune. În anul 2008, în sectorul terţiar îşi desfăşura activitatea 38,9% din populaţia ocupată, în industrie 36,3%, în agricultură 18,0%, iar în construcţii 7,3% din populaţia ocupată a regiunii.
Regiunea Vest deţine cel mai mic număr de persoane ocupate (827 mii persoane, ceea ce reprezenta 8,8% din populaţia ocupată a ţării), Agricultura regiunii contribuie cu 149 mii persoane la totalul populaţiei ocupate în agricultura naţională, populaţia ocupată în industrie reprezenta 13,7% din populaţia ocupată în industria României, iar persoanele ocupate în construcţii reprezenta 8,0% din populaţia ocupata în acest domeniu în economia naţională. În ceea ce priveşte serviciile, contribuţia regiunii este importantă în populaţia totală ocupată în activităţile de transport, depozitare şi comunicaţii (10,2% din populaţia ocupată în acest domeniu în România).
development regions. The region South West Oltenia has an important
number of people employed in agriculture namely 44,8% of the employed population from the region. In industry there are 209 thousand workers of which 16,3% in the extractive industry, 14,6% in electrical and thermal energy industry, gases and water and 68,9% in the manufacturing industry. The constructions activity is poorly represented in the region only 4,7% of the employed population working in this field. In the services field almost 313 thousand people are working of which 32% in trade, 16,3% in public administration and defence and 12,8% in education.
The South-Western region Oltenia is on the third place as a number of people employed in agriculture (466 thousand people) with a share of 17,3% in the total employed population from the Romanian agriculture. Although from the point of view of the people employed in industry this region is on the last place, (with 209 thousand employed people), on sub-branches of industry one can see that the region has the first place regarding the employed population in the extractive industry (with 36,5% of the employed population in the extractive industry on a national level) and in the activities electrical, thermal energy, gases and water (with a share of 19,2% of the employed population in this sub-branch of the national economy). In what the constructions, services activities are concerned the region is on the last place with a low number of employed people as compared to the other regions of the country. So the region contributes with 8,5% (100 thousand people) to the total of employed population in trade, with 5,2% (8 thousand people) to the total of employed population in hotels and restaurants and 7,3% to the total of employed people in financial operations. The region is on the last place regarding the people employed in transport, warehousing and communications activities.
As a consequence of the fact that the Western Region has the lowest number of inhabitants of all the regions of the country, the employed population is correlated with the number of people from the region. In 2008 in the tertiary sector 38.9% of the employed population in industry were carrying out their activity 36,3%, in agriculture 18,0%, and in constructions 7,3% of the employed population of the region. The Western region has the lowest number of employed people (827 thousand people which represented 8,8% of the employed population of the country), the agriculture of the region contributes to 149 thousand people in the total of employed population in national agriculture, the population employed in industry represented 13,7% of the population employed in the Romanian industry, and the people employed in constructions 8,0% of the people employed in this field from the national economy. In what the services are concerned, the contribution of the region is important in the total employed population in transport, warehousing and communications activities (10,2% of the population employed in this field in Romania).
181
4. Structura regională a şomajului Conceptul de şomaj desemnează situaţia
opusă ocupării depline a forţei de muncă sau existenţa unei părţi a populaţiei active care solicită locuri de muncă plătite la nivelul salariului real predominant pe piaţa muncii, dar nu găseşte asemenea locuri [3]. Şomajul constituie o realitate a economiei capitaliste, indiferent de modul în care a fost şi este caracterizat de către diferiţi economişti: efect al rigidităţii preţurilor şi plagă a economiei moderne care îi împiedică să lucreze pe oamenii dornici să muncească [4]; fenomen util şi justificativ generat de mecanismul pieţei muncii [5]; boală cronică a pieţei muncii pentru că echilibrul acesteia se realizează la un nivel inferior ratei ocupării depline [6]; fenomen normal şi mecanism de realocare permanentă a resurselor de muncă prin care se stimulează flexibilizarea pieţei muncii; pierdere de potenţial economic şi pericol social, deoarece rata garantată, deseori, devine inferioară ratei naturale de creştere economică [7]; efect al existenţei unor capacităţi de producţie neutilizate din motive de rentabilitate insuficientă [8]; efect al transferului de locuri de muncă dintr-o ţară în alta de către companiile transnaţionale [9] ş.a.
4. Regional unemployment structure The concept of unemployment represents the opposed situation of the full workforce employment or the existence of a part of the active population which is requesting well paid working placed on the level of the real predominant salary from the labour market, but cannot find such working places [3]. Unemployment represents a reality of the capitalist economy, irrespective of the way in which it was and it is characterised by different economists: as an effect of the rigidity of the prices and as a plague of the modern economy which stop the people willing to work to work [4]; a useful and justified phenomenon generated by the mechanism of the labour market [5]; a chronic disease of the labour market because its balance is carried out on an inferior level of the full employment [6]; normal phenomenon and mechanism of permanent reallocation of the labour resources through which the flexibility of the labour market is stimulated; a loss of economic potential and social danger because the guaranteed rate becomes inferior to the natural growth rate[7]; effect of the existence of some unused manufacturing capacities for insufficient profitability reasons [8]; effect of the transfer of working places from one country to another by trans-national companies [9] and so on.
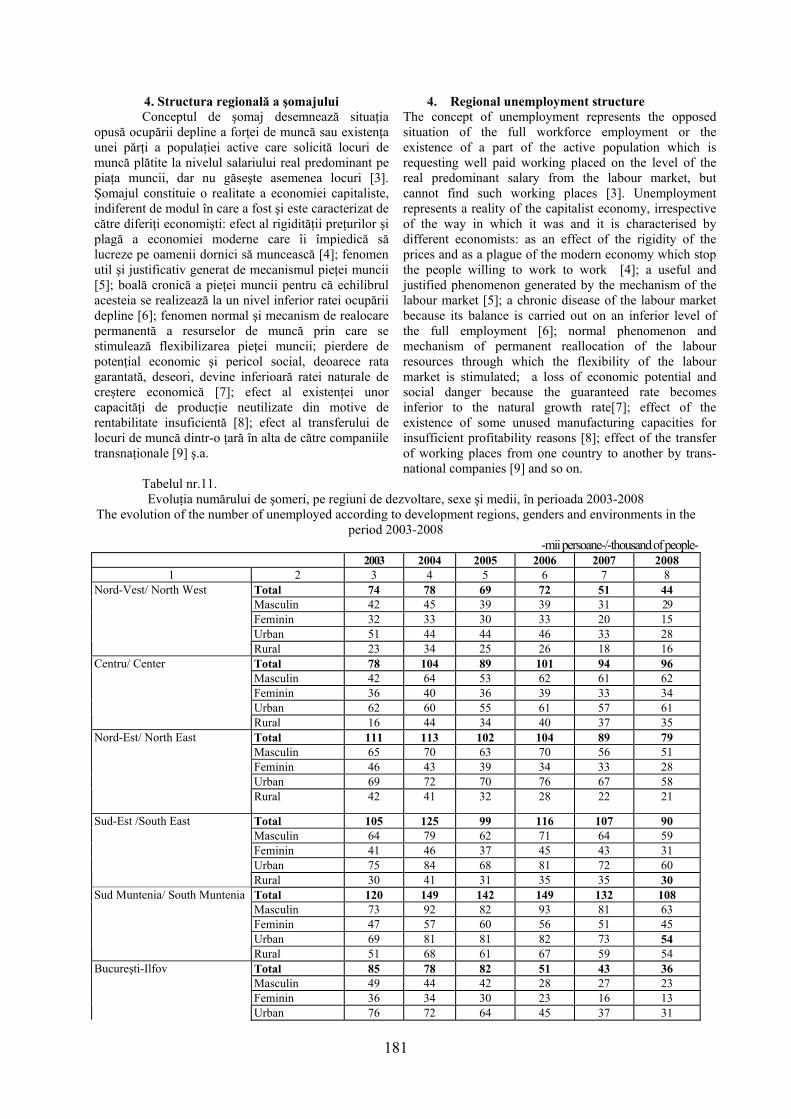
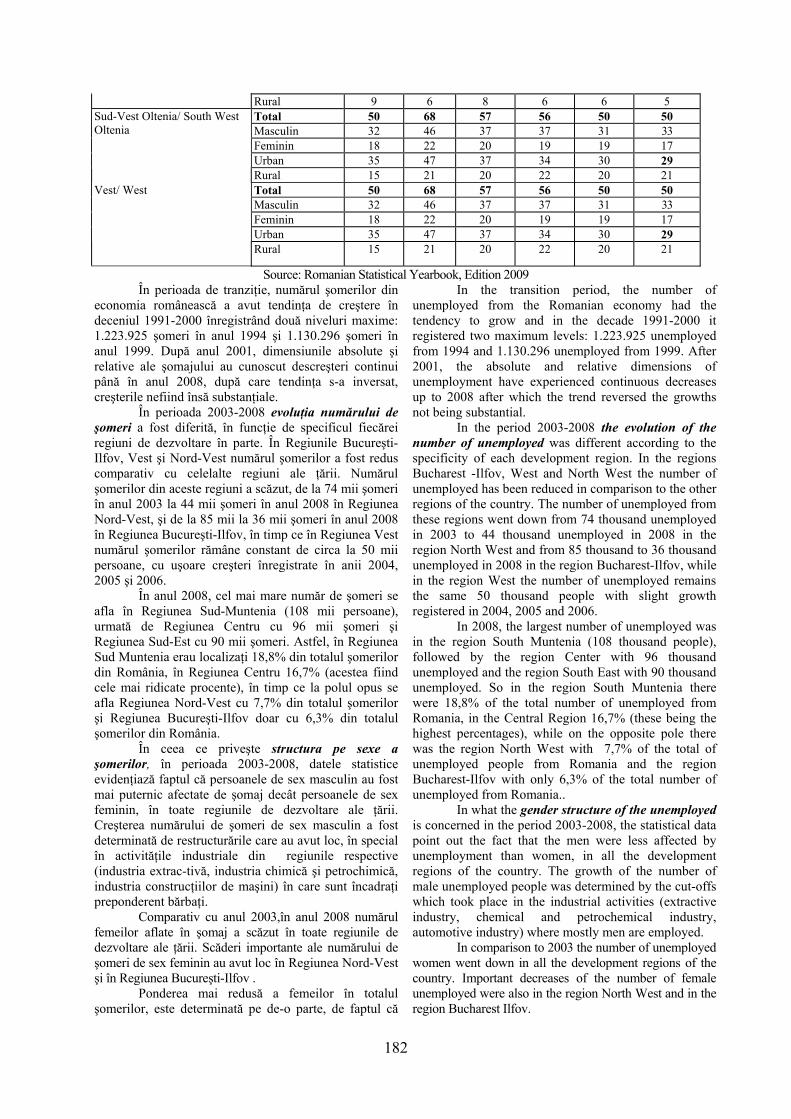
Tabelul nr.11. Evoluţia numărului de şomeri, pe regiuni de dezvoltare, sexe şi medii, în perioada 2003-2008
The evolution of the number of unemployed according to development regions, genders and environments in the period 2003-2008
-mii persoane-/-thousand of people- 2003 2004 2005 2006 2007 2008
1 2 3 4 5 6 7 8 Total 74 78 69 72 51 44 Masculin 42 45 39 39 31 29 Feminin 32 33 30 33 20 15 Urban 51 44 44 46 33 28
Nord-Vest/ North West
Rural 23 34 25 26 18 16 Total 78 104 89 101 94 96 Masculin 42 64 53 62 61 62 Feminin 36 40 36 39 33 34 Urban 62 60 55 61 57 61
Centru/ Center
Rural 16 44 34 40 37 35 Total 111 113 102 104 89 79 Masculin 65 70 63 70 56 51 Feminin 46 43 39 34 33 28 Urban 69 72 70 76 67 58
Nord-Est/ North East
Rural 42 41 32 28 22 21
Total 105 125 99 116 107 90 Masculin 64 79 62 71 64 59 Feminin 41 46 37 45 43 31 Urban 75 84 68 81 72 60
Sud-Est /South East Rural 30 41 31 35 35 30
Total 120 149 142 149 132 108 Masculin 73 92 82 93 81 63 Feminin 47 57 60 56 51 45 Urban 69 81 81 82 73 54
Sud Muntenia/ South Muntenia
Rural 51 68 61 67 59 54 Total 85 78 82 51 43 36 Masculin 49 44 42 28 27 23 Feminin 36 34 30 23 16 13
Bucureşti-Ilfov Urban 76 72 64 45 37 31
182
Rural 9 6 8 6 6 5 Total 50 68 57 56 50 50 Masculin 32 46 37 37 31 33 Feminin 18 22 20 19 19 17 Urban 35 47 37 34 30 29
Sud-Vest Oltenia/ South West Oltenia
Rural 15 21 20 22 20 21 Total 50 68 57 56 50 50 Masculin 32 46 37 37 31 33 Feminin 18 22 20 19 19 17 Urban 35 47 37 34 30 29
Vest/ West
Rural 15 21 20 22 20 21
Source: Romanian Statistical Yearbook, Edition 2009 În perioada de tranziţie, numărul şomerilor din
economia românească a avut tendinţa de creştere în deceniul 1991-2000 înregistrând două niveluri maxime: 1.223.925 şomeri în anul 1994 şi 1.130.296 şomeri în anul 1999. După anul 2001, dimensiunile absolute şi relative ale şomajului au cunoscut descreşteri continui până în anul 2008, după care tendinţa s-a inversat, creşterile nefiind însă substanţiale.
În perioada 2003-2008 evoluţia numărului de şomeri a fost diferită, în funcţie de specificul fiecărei regiuni de dezvoltare în parte. În Regiunile Bucureşti-Ilfov, Vest şi Nord-Vest numărul şomerilor a fost redus comparativ cu celelalte regiuni ale ţării. Numărul şomerilor din aceste regiuni a scăzut, de la 74 mii şomeri în anul 2003 la 44 mii şomeri în anul 2008 în Regiunea Nord-Vest, şi de la 85 mii la 36 mii şomeri în anul 2008 în Regiunea Bucureşti-Ilfov, în timp ce în Regiunea Vest numărul şomerilor rămâne constant de circa la 50 mii persoane, cu uşoare creşteri înregistrate în anii 2004, 2005 şi 2006.
În anul 2008, cel mai mare număr de şomeri se afla în Regiunea Sud-Muntenia (108 mii persoane), urmată de Regiunea Centru cu 96 mii şomeri şi Regiunea Sud-Est cu 90 mii şomeri. Astfel, în Regiunea Sud Muntenia erau localizaţi 18,8% din totalul şomerilor din România, în Regiunea Centru 16,7% (acestea fiind cele mai ridicate procente), în timp ce la polul opus se afla Regiunea Nord-Vest cu 7,7% din totalul şomerilor şi Regiunea Bucureşti-Ilfov doar cu 6,3% din totalul şomerilor din România.
În ceea ce priveşte structura pe sexe a şomerilor, în perioada 2003-2008, datele statistice evidenţiază faptul că persoanele de sex masculin au fost mai puternic afectate de şomaj decât persoanele de sex feminin, în toate regiunile de dezvoltare ale ţării. Creşterea numărului de şomeri de sex masculin a fost determinată de restructurările care au avut loc, în special în activităţile industriale din regiunile respective (industria extrac-tivă, industria chimică şi petrochimică, industria construcţiilor de maşini) în care sunt încadraţi preponderent bărbaţi.
Comparativ cu anul 2003,în anul 2008 numărul femeilor aflate în şomaj a scăzut în toate regiunile de dezvoltare ale ţării. Scăderi importante ale numărului de şomeri de sex feminin au avut loc în Regiunea Nord-Vest şi în Regiunea Bucureşti-Ilfov .
Ponderea mai redusă a femeilor în totalul şomerilor, este determinată pe de-o parte, de faptul că
In the transition period, the number of unemployed from the Romanian economy had the tendency to grow and in the decade 1991-2000 it registered two maximum levels: 1.223.925 unemployed from 1994 and 1.130.296 unemployed from 1999. After 2001, the absolute and relative dimensions of unemployment have experienced continuous decreases up to 2008 after which the trend reversed the growths not being substantial.
In the period 2003-2008 the evolution of the number of unemployed was different according to the specificity of each development region. In the regions Bucharest -Ilfov, West and North West the number of unemployed has been reduced in comparison to the other regions of the country. The number of unemployed from these regions went down from 74 thousand unemployed in 2003 to 44 thousand unemployed in 2008 in the region North West and from 85 thousand to 36 thousand unemployed in 2008 in the region Bucharest-Ilfov, while in the region West the number of unemployed remains the same 50 thousand people with slight growth registered in 2004, 2005 and 2006.
In 2008, the largest number of unemployed was in the region South Muntenia (108 thousand people), followed by the region Center with 96 thousand unemployed and the region South East with 90 thousand unemployed. So in the region South Muntenia there were 18,8% of the total number of unemployed from Romania, in the Central Region 16,7% (these being the highest percentages), while on the opposite pole there was the region North West with 7,7% of the total of unemployed people from Romania and the region Bucharest-Ilfov with only 6,3% of the total number of unemployed from Romania..
In what the gender structure of the unemployed is concerned in the period 2003-2008, the statistical data point out the fact that the men were less affected by unemployment than women, in all the development regions of the country. The growth of the number of male unemployed people was determined by the cut-offs which took place in the industrial activities (extractive industry, chemical and petrochemical industry, automotive industry) where mostly men are employed.
In comparison to 2003 the number of unemployed women went down in all the development regions of the country. Important decreases of the number of female unemployed were also in the region North West and in the region Bucharest Ilfov.
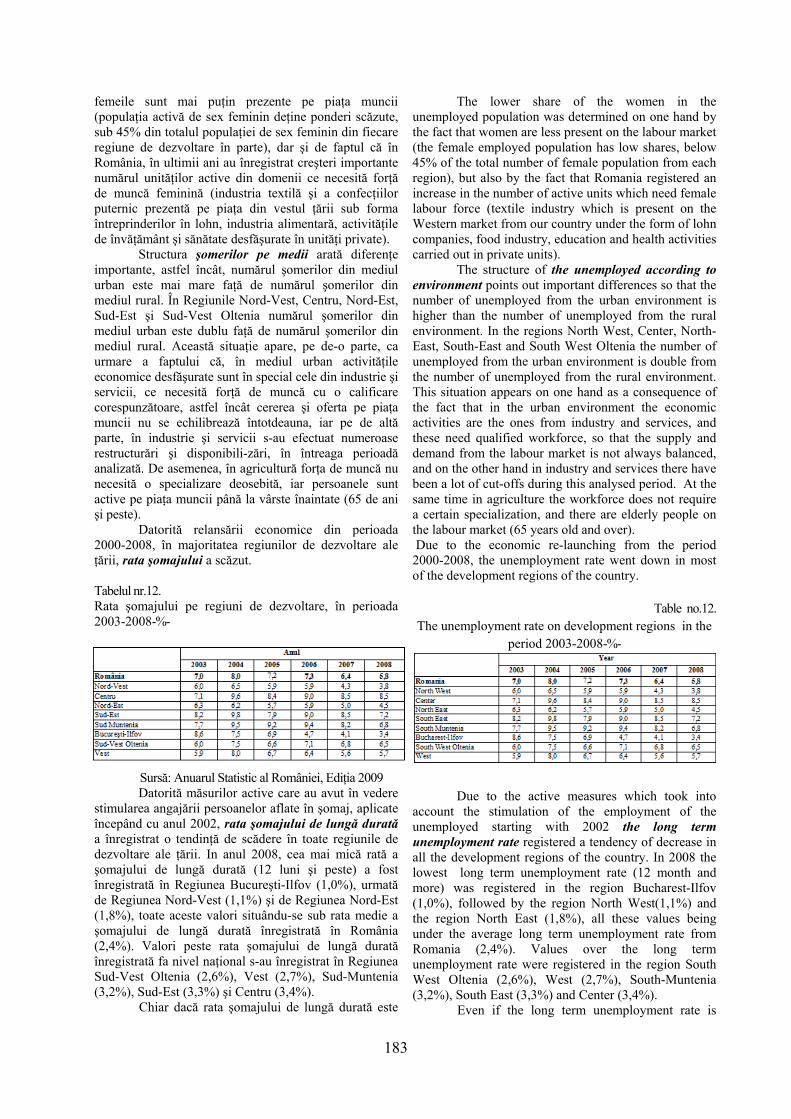
183
femeile sunt mai puţin prezente pe piaţa muncii (populaţia activă de sex feminin deţine ponderi scăzute, sub 45% din totalul populaţiei de sex feminin din fiecare regiune de dezvoltare în parte), dar şi de faptul că în România, în ultimii ani au înregistrat creşteri importante numărul unităţilor active din domenii ce necesită forţă de muncă feminină (industria textilă şi a confecţiilor puternic prezentă pe piaţa din vestul ţării sub forma întreprinderilor în lohn, industria alimentară, activităţile de învăţământ şi sănătate desfăşurate în unităţi private).
Structura şomerilor pe medii arată diferenţe importante, astfel încât, numărul şomerilor din mediul urban este mai mare faţă de numărul şomerilor din mediul rural. În Regiunile Nord-Vest, Centru, Nord-Est, Sud-Est şi Sud-Vest Oltenia numărul şomerilor din mediul urban este dublu faţă de numărul şomerilor din mediul rural. Această situaţie apare, pe de-o parte, ca urmare a faptului că, în mediul urban activităţile economice desfăşurate sunt în special cele din industrie şi servicii, ce necesită forţă de muncă cu o calificare corespunzătoare, astfel încât cererea şi oferta pe piaţa muncii nu se echilibrează întotdeauna, iar pe de altă parte, în industrie şi servicii s-au efectuat numeroase restructurări şi disponibili-zări, în întreaga perioadă analizată. De asemenea, în agricultură forţa de muncă nu necesită o specializare deosebită, iar persoanele sunt active pe piaţa muncii până la vârste înaintate (65 de ani şi peste).
Datorită relansării economice din perioada 2000-2008, în majoritatea regiunilor de dezvoltare ale ţării, rata şomajului a scăzut.
Tabelul nr.12. Rata şomajului pe regiuni de dezvoltare, în perioada 2003-2008-%-
Sursă: Anuarul Statistic al României, Ediţia 2009 Datorită măsurilor active care au avut în vedere
stimularea angajării persoanelor aflate în şomaj, aplicate începând cu anul 2002, rata şomajului de lungă durată a înregistrat o tendinţă de scădere în toate regiunile de dezvoltare ale ţării. In anul 2008, cea mai mică rată a şomajului de lungă durată (12 luni şi peste) a fost înregistrată în Regiunea Bucureşti-Ilfov (1,0%), urmată de Regiunea Nord-Vest (1,1%) şi de Regiunea Nord-Est (1,8%), toate aceste valori situându-se sub rata medie a şomajului de lungă durată înregistrată în România (2,4%). Valori peste rata şomajului de lungă durată înregistrată fa nivel naţional s-au înregistrat în Regiunea Sud-Vest Oltenia (2,6%), Vest (2,7%), Sud-Muntenia (3,2%), Sud-Est (3,3%) şi Centru (3,4%).
Chiar dacă rata şomajului de lungă durată este
The lower share of the women in the unemployed population was determined on one hand by the fact that women are less present on the labour market (the female employed population has low shares, below 45% of the total number of female population from each region), but also by the fact that Romania registered an increase in the number of active units which need female labour force (textile industry which is present on the Western market from our country under the form of lohn companies, food industry, education and health activities carried out in private units).
The structure of the unemployed according to environment points out important differences so that the number of unemployed from the urban environment is higher than the number of unemployed from the rural environment. In the regions North West, Center, North-East, South-East and South West Oltenia the number of unemployed from the urban environment is double from the number of unemployed from the rural environment. This situation appears on one hand as a consequence of the fact that in the urban environment the economic activities are the ones from industry and services, and these need qualified workforce, so that the supply and demand from the labour market is not always balanced, and on the other hand in industry and services there have been a lot of cut-offs during this analysed period. At the same time in agriculture the workforce does not require a certain specialization, and there are elderly people on the labour market (65 years old and over). Due to the economic re-launching from the period 2000-2008, the unemployment rate went down in most of the development regions of the country.
Table no.12. The unemployment rate on development regions in the
period 2003-2008-%-
Due to the active measures which took into account the stimulation of the employment of the unemployed starting with 2002 the long term unemployment rate registered a tendency of decrease in all the development regions of the country. In 2008 the lowest long term unemployment rate (12 month and more) was registered in the region Bucharest-Ilfov (1,0%), followed by the region North West(1,1%) and the region North East (1,8%), all these values being under the average long term unemployment rate from Romania (2,4%). Values over the long term unemployment rate were registered in the region South West Oltenia (2,6%), West (2,7%), South-Muntenia (3,2%), South East (3,3%) and Center (3,4%).
Even if the long term unemployment rate is
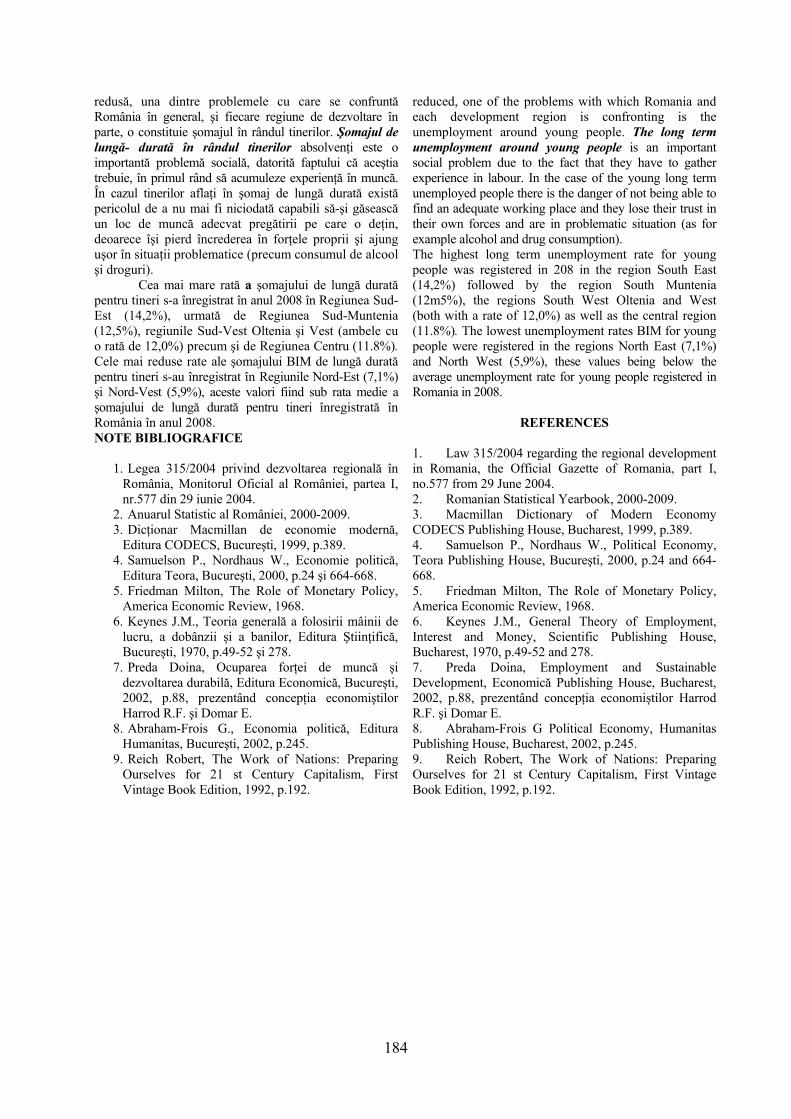
184
redusă, una dintre problemele cu care se confruntă România în general, şi fiecare regiune de dezvoltare în parte, o constituie şomajul în rândul tinerilor. Şomajul de lungă- durată în rândul tinerilor absolvenţi este o importantă problemă socială, datorită faptului că aceştia trebuie, în primul rând să acumuleze experienţă în muncă. În cazul tinerilor aflaţi în şomaj de lungă durată există pericolul de a nu mai fi niciodată capabili să-şi găsească un loc de muncă adecvat pregătirii pe care o deţin, deoarece îşi pierd încrederea în forţele proprii şi ajung uşor în situaţii problematice (precum consumul de alcool şi droguri).
Cea mai mare rată a şomajului de lungă durată pentru tineri s-a înregistrat în anul 2008 în Regiunea Sud-Est (14,2%), urmată de Regiunea Sud-Muntenia (12,5%), regiunile Sud-Vest Oltenia şi Vest (ambele cu o rată de 12,0%) precum şi de Regiunea Centru (11.8%). Cele mai reduse rate ale şomajului BIM de lungă durată pentru tineri s-au înregistrat în Regiunile Nord-Est (7,1%) şi Nord-Vest (5,9%), aceste valori fiind sub rata medie a şomajului de lungă durată pentru tineri înregistrată în România în anul 2008. NOTE BIBLIOGRAFICE
1. Legea 315/2004 privind dezvoltarea regională în România, Monitorul Oficial al României, partea I, nr.577 din 29 iunie 2004.
2. Anuarul Statistic al României, 2000-2009. 3. Dicţionar Macmillan de economie modernă,
Editura CODECS, Bucureşti, 1999, p.389. 4. Samuelson P., Nordhaus W., Economie politică,
Editura Teora, Bucureşti, 2000, p.24 şi 664-668. 5. Friedman Milton, The Role of Monetary Policy,
America Economic Review, 1968. 6. Keynes J.M., Teoria generală a folosirii mâinii de
lucru, a dobânzii şi a banilor, Editura Ştiinţifică, Bucureşti, 1970, p.49-52 şi 278.
7. Preda Doina, Ocuparea forţei de muncă şi dezvoltarea durabilă, Editura Economică, Bucureşti, 2002, p.88, prezentând concepţia economiştilor Harrod R.F. şi Domar E.
8. Abraham-Frois G., Economia politică, Editura Humanitas, Bucureşti, 2002, p.245.
9. Reich Robert, The Work of Nations: Preparing Ourselves for 21 st Century Capitalism, First Vintage Book Edition, 1992, p.192.
reduced, one of the problems with which Romania and each development region is confronting is the unemployment around young people. The long term unemployment around young people is an important social problem due to the fact that they have to gather experience in labour. In the case of the young long term unemployed people there is the danger of not being able to find an adequate working place and they lose their trust in their own forces and are in problematic situation (as for example alcohol and drug consumption). The highest long term unemployment rate for young people was registered in 208 in the region South East (14,2%) followed by the region South Muntenia (12m5%), the regions South West Oltenia and West (both with a rate of 12,0%) as well as the central region (11.8%). The lowest unemployment rates BIM for young people were registered in the regions North East (7,1%) and North West (5,9%), these values being below the average unemployment rate for young people registered in Romania in 2008.
REFERENCES
1. Law 315/2004 regarding the regional development in Romania, the Official Gazette of Romania, part I, no.577 from 29 June 2004. 2. Romanian Statistical Yearbook, 2000-2009. 3. Macmillan Dictionary of Modern Economy CODECS Publishing House, Bucharest, 1999, p.389. 4. Samuelson P., Nordhaus W., Political Economy, Teora Publishing House, Bucureşti, 2000, p.24 and 664-668. 5. Friedman Milton, The Role of Monetary Policy, America Economic Review, 1968. 6. Keynes J.M., General Theory of Employment, Interest and Money, Scientific Publishing House, Bucharest, 1970, p.49-52 and 278. 7. Preda Doina, Employment and Sustainable Development, Economică Publishing House, Bucharest, 2002, p.88, prezentând concepţia economiştilor Harrod R.F. şi Domar E. 8. Abraham-Frois G Political Economy, Humanitas Publishing House, Bucharest, 2002, p.245. 9. Reich Robert, The Work of Nations: Preparing Ourselves for 21 st Century Capitalism, First Vintage Book Edition, 1992, p.192.