revista industria textila 2 2018 · nr. 1/2007/ isi ratedmagazine, included in the isi master...
TRANSCRIPT
IndustriaTextila
ISSN 1222–5347
2/2018
COLEGIULDE REDACTIE:
Dr. ing. CARMEN GHIŢULEASACS I – DIRECTOR GENERAL
Institutul Naţional de Cercetare-Dezvoltare pentru Textile şi Pielărie – Bucureşti
Dr. ing. EMILIA VISILEANUCS I – EDITOR ŞEF
Institutul Naţional de Cercetare-Dezvoltare pentru Textile şi Pielărie – Bucureşti
Conf. univ. dr. ing. MARIANA URSACHEDECAN
Facultatea de Textile-Pielărieşi Management Industrial, Universitatea
Tehnică „Ghe. Asachi“ – IaşiProf. dr. GELU ONOSE
CS IUniversitatea de Medicină şi Farmacie
„Carol Davila“ – BucureştiProf. dr. ing. ERHAN ÖNERMarmara University – Turcia
Prof. dr. S. MUGE YUKSELOGLUMarmara University – Turcia
Prof. univ. dr. DOINA I. POPESCUAcademia de Studii Economice – Bucureşti
Prof. univ. dr. ing. CARMEN LOGHINFacultatea de Textile-Pielărie
şi Management Industrial, UniversitateaTehnică „Ghe. Asachi“ – Iaşi
Prof. univ. dr. MARGARETA STELEA FLORESCUAcademia de Studii Economice – Bucureşti
Prof. ing. ARISTIDE DODUMembru de onoare al Academiei de Ştiinţe
Tehnice din RomâniaProf. dr. ing. LUIS ALMEIDA
University of Minho – PortugalProf. dr. LUCIAN CONSTANTIN HANGANUUniversitatea Tehnică „Ghe. Asachi“ – Iaşi
Dr. AMINODDIN HAJI PhD, MSc, BSc, Textile Chemistry
and Fiber ScienceAssistant Professor
Textile and Art DepartmentIslamic Azad University, Birjand Branch
Birjand, IranDr. ADNAN MAZARIAssistant Professor
Department of Textile Clothing Faculty of Textile Engineering
Technical University of LiberecCzech Republic
81–86
87–95
96–103
104–110
111–117
118–127
128–132
133–139
140–145
146–151
HAKAN ÖZDEMIREfectul încleierii și proprietăților structurale ale firelor asupra proprietăților fizice ale firelor din bumbac cardate și pieptănate filate cu inele
ŠAJN GORJANC DUNJA, GLAŽAR DOMINIKAInfluenţa firelor filate cu jet de aer şi vortex asupra funcţionalităţii ţesăturii
VIERA GLOMBIKOVA, PETRA KOMARKOVA, ANTONIN HAVELKA, MARCELA KOLINOVAEvaluarea performanţei ţesăturilor pentru scaunele auto
AMINODDIN HAJI, S. SADRODDIN QAVAMNIA, MAJID NASIRIBOROUMANDUtilizarea modelului D-optimal în optimizarea vopsirii lânii cu coaja de Juglansregia
MIN DONG, YAN HONG, JUNJIE ZHANG, KAIXUAN LIU, MELISSA WAGNER, HUIYU JIANGClasificarea măsurătorilor corpului şi evaluarea senzorială a formelor părţii inferioare a corpului pentru dezvoltarea modelelor personalizate de pantaloni
SIDDIQUE HAFIZ FAISAL, MAZARI ADNAN, HAVELKA ANTONIN, HUSSAIN TANVEEREfectul densităţii liniare a elastanului asupra presiunii de compresie a şosetelor de compresie cu fire de vanisare
JUN LI, HAN CHENG, JING YANGStudiu asupra mecanismului de suprimare a ancorei apex ataşate asupra fenomenului de umflare nedorită
DANA VASILESCU, SABINA IONITA, VICTOR GRAMA, ADRIAN PELINARU, ALEXANDRU CHIOTOROIUComplicații ale chirurgiei parietale aloplastice în reconstrucția peretelui abdominal – experienţă clinică
GORAN DEMBOSKI, MAJA JANKOSKAAnaliza timpului de producție în fabricarea confecțiilor
CARMEN MIHAI, ALEXANDRA ENE, CRISTIAN JIPA, CARMEN DENIS GHIMUSStructura cu permeabilitate controlabilă pentru stabilizatoare-deceleratoare aerodinamice verticale
J. P. BERNARDES, A. MARQUES, F. FERREIRA, M. NOGUEIRAUn nou serviciu sustenabil pentru încetinirea producției brandurilor de modă 152–157
MILAN M. GAŠOVIĆ, DJURDJICA DJ. VUKAJLOVIĆ, NIKOLA V. ĆURČIĆConceptul de marketing de modă ca instrument de reducere a tensiunilordintre designeri şi experții în marketing din companiile de modă 158–165
Editatã în 6 nr./an, indexatã ºi recenzatã în:Edited in 6 issues per year, indexed and abstracted in:
Science Citation Index Expanded (SciSearch®), Materials ScienceCitation Index®, Journal Citation Reports/Science Edition, World Textile
Abstracts, Chemical Abstracts, VINITI, Scopus, Toga FIZ technikProQuest Central
Editatã cu sprijinul Ministerului Cercetãrii ºi Inovãrii
Revistã cotatã ISI ºi inclusã în Master Journal List a Institutului pentruªtiinþa Informãrii din Philadelphia – S.U.A., începând cu vol. 58, nr. 1/2007/ISI rated magazine, included in the ISI Master Journal List of the Instituteof Science Information, Philadelphia, USA, starting with vol. 58, no. 1/2007
¸
˘
79industria textila 2018, vol. 69, nr. 2˘
Recunoscutã în România, în domeniul ªtiinþelor inginereºti, de cãtre
Consiliul Naþional al Cercetãrii ªtiinþifice din Învãþãmântul Superior(C.N.C.S.I.S.), în grupa A /
Aknowledged in Romania, in the engineering sciences domain,
by the National Council of the Scientific Research from the Higher Education
(CNCSIS), in group A

80industria textila 2018, vol. 69, nr. 2˘
81
87
96
104
111
118
128
133
140
146
152
158
Effects of sizing and yarn structural properties on the physical propertiesof combed and carded cotton ring yarns
The influence of air-jet and vortex yarn on functionality of woven fabric
Approach to evaluation of car seats fabrics performance
The use of D-optimal design in optimization of wool dyeing with Juglansregia bark
A body measurements and sensory evaluation-based classification of lower bodyshapes for developing customized pants design
Effect of elastane linear density on compression pressure of V-shapedcompression socks
Suppression mechanism study of attached apex drogue on undesirable inflation phenomena
Alloplastic parieto-synthesis complications in abdominal wall reconstructivesurgery – our clinical experience
Throughput time analysis in apparel manufacturing
Structure with controllable permeability for vertical aerodynamic stabilizers-decelerators
A new and sustainable service to slow fashion brands
The concept of fashion marketing as an instrument of reducing tensions betweendesigners and marketing experts in fashion companies
EDITORIAL STAFF
Editor-in-chief: Dr. eng. Emilia Visileanu
Graphic designer: Florin Prisecaru
e-mail: [email protected]
Scientific reviewers for the papers published in this number :
Contents
Journal edited in colaboration with Editura AGIR , 118 Calea Victoriei, sector 1, Bucharest, tel./fax: 021-316.89.92; 021-316.89.93;
e-mail: [email protected], www.edituraagir.ro
Prof. Chenhong Long, Institute for Frontier Materials, GTP Research Deakin University, Turky
Prof. Pascal Bruniaux, Human-centered Design Group, ENSAIT School of Engineering, France
Prof. dr. Ljubomir Trifunović, Faculty of Economics in Brčko, Bosnia and Hercegovina
Prof. Yordanka Angelova, Technical University of Gabrovo, Bulgaria
Prof. Dragana Grujić, Univerzitet u Banjoj Luci, Serbia
Prof. Elena Codau, Gheorghe Asachi Technical University of Iasi, Romania
Prof. dr. DušanTrajković, Faculty of Technology, Leskovac, Serbia
Dr. Hafsa Jamshaid, Department of Knitting, National Textile University, Pakistan
Dr. Muhammad Tauseef Khawar, University of Manchester, UK
HAKAN ÖZDEMIR
ŠAJN GORJANC DUNJA, GLAŽAR DOMINIKA
VIERA GLOMBIKOVA,PETRA KOMARKOVA,ANTONIN HAVELKA,MARCELA KOLINOVA
AMINODDIN HAJI, S. SADRODDIN QAVAMNIA,MAJID NASIRIBOROUMAND
MIN DONG, YAN HONG, JUNJIE ZHANG, KAIXUAN LIU, MELISSA WAGNER, HUIYU JIANG
SIDDIQUE HAFIZ FAISAL, MAZARI ADNAN, HAVELKA ANTONIN, HUSSAIN TANVEER
JUN LI, HAN CHENG, JING YANG
DANA VASILESCU, SABINA IONITA, VICTOR GRAMA, ADRIAN PELINARU, ALEXANDRU CHIOTOROIU
GORAN DEMBOSKI, MAJA JANKOSKA
CARMEN MIHAI, ALEXANDRA ENE, CRISTIAN JIPA, CARMEN DENIS GHIMUS
J. P. BERNARDES, A. MARQUES,F. FERREIRA, M. NOGUEIRA
MILAN M. GAŠOVIĆ, DJURDJICA DJ. VUKAJLOVIĆ, NIKOLA V. ĆURČIĆ
INTRODUCTION
The weaving process is based on various factors andon interaction of these factors, including yarn struc-tural parameters, the sizing operation and the sizingagents. Yarn has a complex structure and is definedby many physical properties. It has been consideredthat the tensile properties of the yarn, which arestrength and elongation, are always the prime factorswhich affect the performance of warp yarns duringweaving and weaving preparation. Nevertheless, inrecent years it has been realized that the hairinessand friction properties of yarns have equal influenceon the performance of the loom and warpingmachine. The warp yarns may break during the pro-cess of weaving and warping due to the complicatedmechanical actions consisting of cyclic or noncyclicalextension, friction and bending. In order to prevent
warp yarns from excessive breakage during weavingand warping, the threads should be sized to begained better friction properties and to be improvedtheir strength. Sizing is the important weaving prepa-ration operation in terms of decreasing the number ofbreaks both in weaving and warping processes ofcotton yarns. So it increases efficiency of loom andwarping machine and also woven fabric quality. Therefore researchers investigated the effects of siz-ing on yarn physical properties: Schwarz, Kovacevicand Dimitrovski analysed areas of elastic, viscoelas-tic and plastic deformations of ring and rotor-spunyarns before and after sizing with a PVA sizing agent,using the same recipe, but with two different sizeconcentrations, 7.5% and 5.0% [1]. By sizing, theyachieved major improvements in mechanical prop-erties of ring-spun yarns, contrary to the minor
Effects of sizing and yarn structural properties on the physical propertiesof combed and carded cotton ring yarns
HAKAN ÖZDEMIR
REZUMAT – ABSTRACT
Efectul încleierii și proprietăților structurale ale firelor asupra proprietăților fizice ale firelor din bumbaccardate și pieptănate filate cu inele
Firele de urzeală, pregătite sub formă de suluri de urzeală, sunt expuse diferitelor forțe ale mașinii de țesut. Firele deurzeală sunt curbate pe traversa de tensionare, supuse frecării în lamele și cocleți. Acestea sunt, de asemenea, expusela frecarea și impactul spatei și, prin urmare, abraziunii. Firele sunt încleiate pentru a crește rezistența lor la acesteefecte. Agenții de încleiere, prin procesul de încleiere, permit firelor de urzeală să fie țesute. Pe de altă parte, finețeafirelor și tipul de fir (pieptănat sau cardat) sunt proprietățile structurale semnificative care determină proprietățile fiziceale firelor.Principalul obiectiv al acestui studiu este de a investiga efectele parametrilor structurali (finețea firului și tipul de fir) și aîncleierii asupra proprietăților fizice (rezistența la rupere, alungirea la rupere, pilozitatea, coeficientul de frecare) alefirelor de bumbac 100% cardate și pieptănate filate cu inele, încleiate cu patru agenți de încleiere diferiți, care nu au foststudiaţi în referințe. Se observă că procesul de încleiere determină o scădere a pilozității cu până la 99% și a coefi -cienților de frecare ai firelor cardate și pieptănate, în timp ce crește rezistența la rupere a firelor cardate și pieptănate.De asemenea, firele pieptănate au avut proprietăți mai bune de rezistență la rupere și la frecare decât firele cardate.
Cuvinte-cheie: fir cardat, fir pieptănat, fir filat cu inele, încleiere, rezistență la rupere, alungire la rupere, pilozitate,coeficient de frecare
Effects of sizing and yarn structural properties on the physical properties of combed and cardedcotton ring yarns
Warp yarns, prepared as warp beam, are exposed to various forces at weaving loom. Warp yarns are bended on theback rest, subjected to friction from drop wires and healds. They are also exposed to friction and impact at reed andthereby abraded. Yarns are sized in order to increase their resistance to these effects. Sizing agents ensure that warpyarns can be weaved with sizing process. On the other hand, yarn count and yarn type (combed or carded yarn) are thesignificant yarn structural properties that determine and so affect the physical properties of yarn. The main reason andobjective this study is to investigate the effects of yarn structural parameters (yarn count and yarn type) and sizing onthe physical properties (breaking strength, elongation at break, hairiness, friction coefficient) of 100% cotton carded andcombed ring yarns, sized with four different sizing agents, which were not studied in the references. It is observed thatsizing process cause to decrease in the hairiness up to 99% and in friction coefficients of combed and carded yarnswhereas to increase in the breaking strengths of combed and carded yarns. And also, the combed yarns had bettertensile and frictional properties than carded yarns.
Keywords: carded yarn, combed yarn, ring yarn, sizing, breaking strength, elongation at break, hairiness, coefficient offriction
81industria textila 2018, vol. 69, nr. 2˘
DOI: 10.35530/IT.069.02.1329
improvements in mechanical properties of rotor-spunyarns, due to their structures.Behera, B.K., Pakhira, A. applied various size mate-rials (polyvinyl alcohol, polyester resin, polyacry-lamide) to both flat (with linear density per filament of1.04, 2.08 and 4.41 den, respectively) and textured(0.50, 1.41 and 2.22 den per filament, respectively)zero-twisted PET multifilament yams [2]. Theyobserved that breaking strength of yarns increasedwith sizing whereas breaking extension (%) of yarnsdecreased with sizing. While difference betweenyarns sized with polyester resin and unseized yamswere significant (at 1% level) for all yarns, differencebetween yarns sized with polyvinyl alcohol andunseized yams were significant for 4.41 den flat, 1.41and 2.22 den textured yarns.Maatoug, S., Ladhari, N. and Sakli, F. investigatedthe physical properties of Nm 12.2 cotton warp yarnssized at high pressure squeezing with maize starch,polyvinyl alcohol and carboxymethyl cellulose [3].They observed that the breaking strengths of allsized yarns increased when compared with unsizedyarns, while their breaking extensions were reduced.And also, hairiness decreased with sizing.Behera, B.K. and Joshi, V.K. evaluated relative weav-ing potential of Dref yarns, with core of polyester fila-ment and cotton sheath and with core of cotton yarnand cotton sheath, which were sized modified maizestarch and with acrylic size [4]. They observed thatincreasing size add-on increased the weaving perfor-mance of Dref yarns and the optimum size add-onwas approximately 15%.Jaouachi, B., Ben Hassen, M. and Saklı, F. sized thewet pneumatic-spliced denim yarns according to twodifferent recipes [5]. They found that sizing encour-aged the breaking strength of spliced yarns. In otherstudy, Jaouachi, B., Ben Hassen, M. and Saklı, F.compared the mechanical behaviours (breakingstrength, elongation at break) of both parent and wetpneumatic spliced cotton denim yarns before andafter sizing by natural and synthetic sizes [6]. Theyfound that the synthetic size gave better performanceto wet spliced cotton yarns.Carded cotton yarn, that is carded but not combed,contains a wider range of fibre lengths as a result ofthis, it is not as uniform and as strong as combedyarns. And also, combed cotton yarn in which thefibres are straightened and parallel to each other,have smooth surfaces [7]. Furthermore, no studies have been found so far onthe effect of different sizing recipes on the mechani-cal properties (breaking strength, elongation atbreak, hairiness, friction coefficient) of carded andcombed cotton ring yarns with various thicknesses.This study is an attempt to fill this gap and endeav-ours to add a little more knowledge to what is alreadyknown in this domain.
EXPERIMENTAL WORK
Materials and Method
Materials
• Yarns
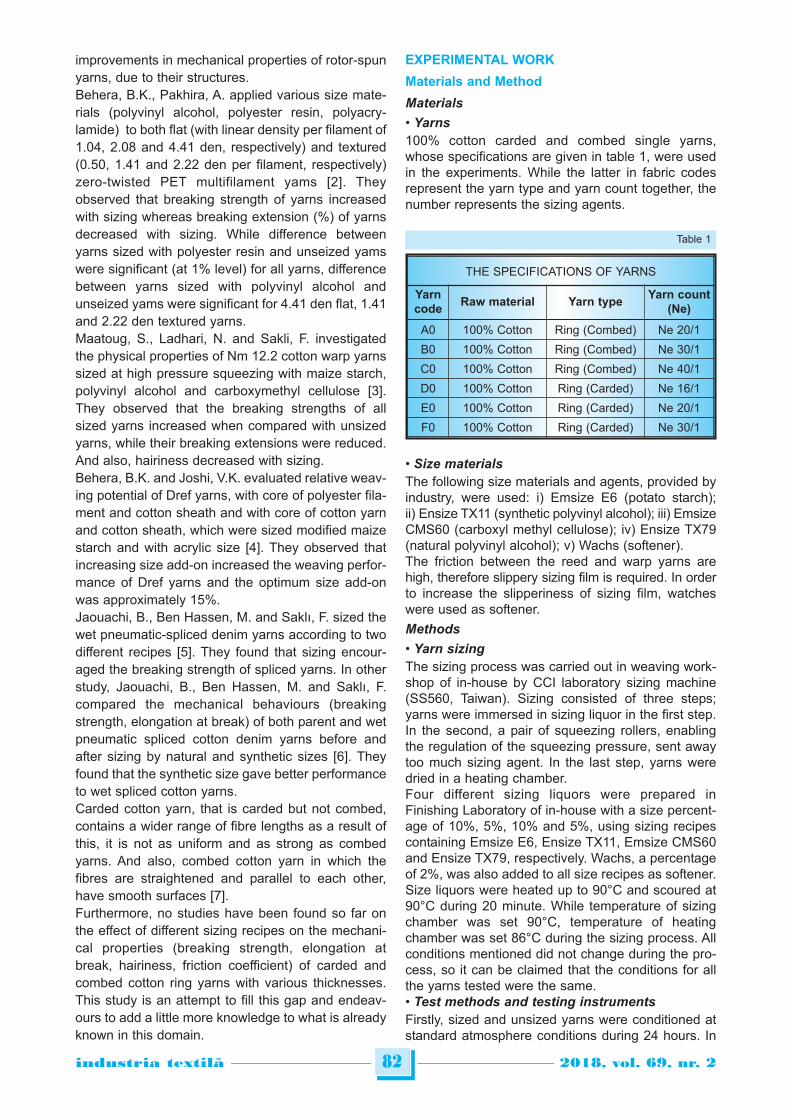
100% cotton carded and combed single yarns,whose specifications are given in table 1, were usedin the experiments. While the latter in fabric codesrepresent the yarn type and yarn count together, thenumber represents the sizing agents.
• Size materials
The following size materials and agents, provided byindustry, were used: i) Emsize E6 (potato starch);ii) Ensize TX11 (synthetic polyvinyl alcohol); iii) EmsizeCMS60 (carboxyl methyl cellulose); iv) Ensize TX79(natural polyvinyl alcohol); v) Wachs (softener).The friction between the reed and warp yarns arehigh, therefore slippery sizing film is required. In orderto increase the slipperiness of sizing film, watcheswere used as softener.
Methods
• Yarn sizing
The sizing process was carried out in weaving work-shop of in-house by CCI laboratory sizing machine(SS560, Taiwan). Sizing consisted of three steps;yarns were immersed in sizing liquor in the first step.In the second, a pair of squeezing rollers, enablingthe regulation of the squeezing pressure, sent awaytoo much sizing agent. In the last step, yarns weredried in a heating chamber.Four different sizing liquors were prepared inFinishing Laboratory of in-house with a size percent-age of 10%, 5%, 10% and 5%, using sizing recipescontaining Emsize E6, Ensize TX11, Emsize CMS60and Ensize TX79, respectively. Wachs, a percentageof 2%, was also added to all size recipes as softener.Size liquors were heated up to 90°C and scoured at90°C during 20 minute. While temperature of sizingchamber was set 90°C, temperature of heatingchamber was set 86°C during the sizing process. Allconditions mentioned did not change during the pro-cess, so it can be claimed that the conditions for allthe yarns tested were the same.• Test methods and testing instruments
Firstly, sized and unsized yarns were conditioned atstandard atmosphere conditions during 24 hours. In
82industria textila 2018, vol. 69, nr. 2˘
THE SPECIFICATIONS OF YARNS
Yarncode
Raw material Yarn typeYarn count
(Ne)
A0 100% Cotton Ring (Combed) Ne 20/1
B0 100% Cotton Ring (Combed) Ne 30/1
C0 100% Cotton Ring (Combed) Ne 40/1
D0 100% Cotton Ring (Carded) Ne 16/1
E0 100% Cotton Ring (Carded) Ne 20/1
F0 100% Cotton Ring (Carded) Ne 30/1
Table 1
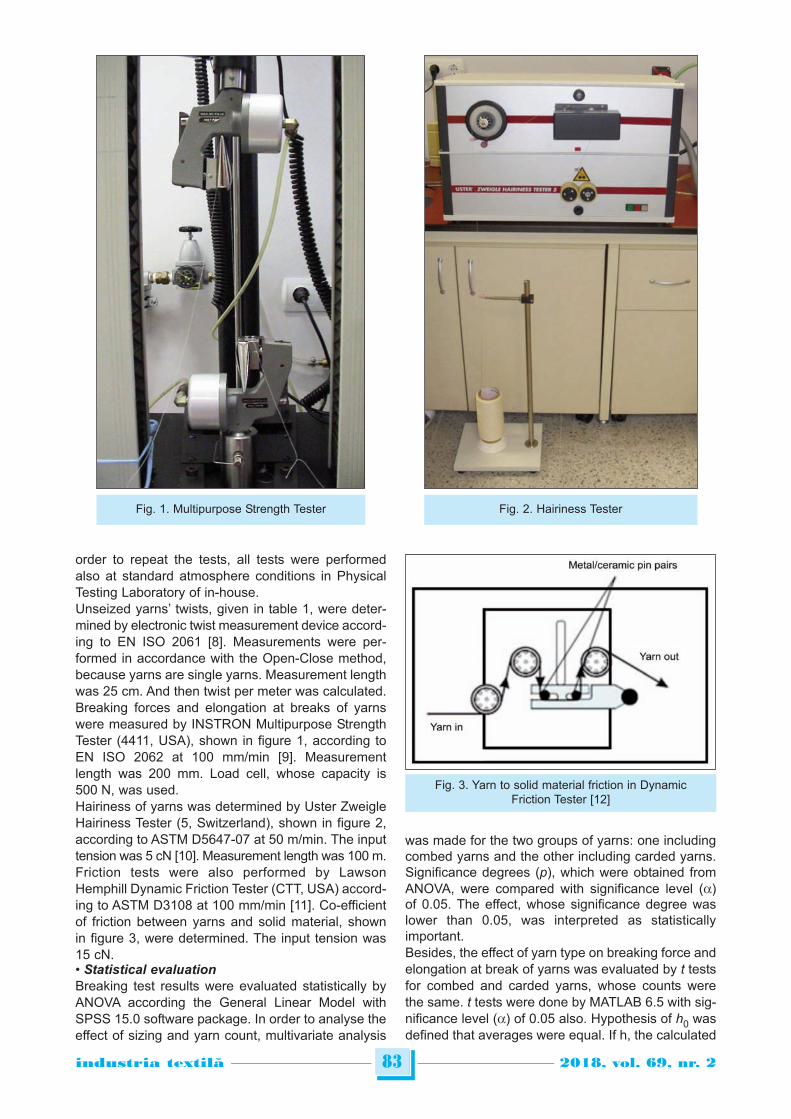
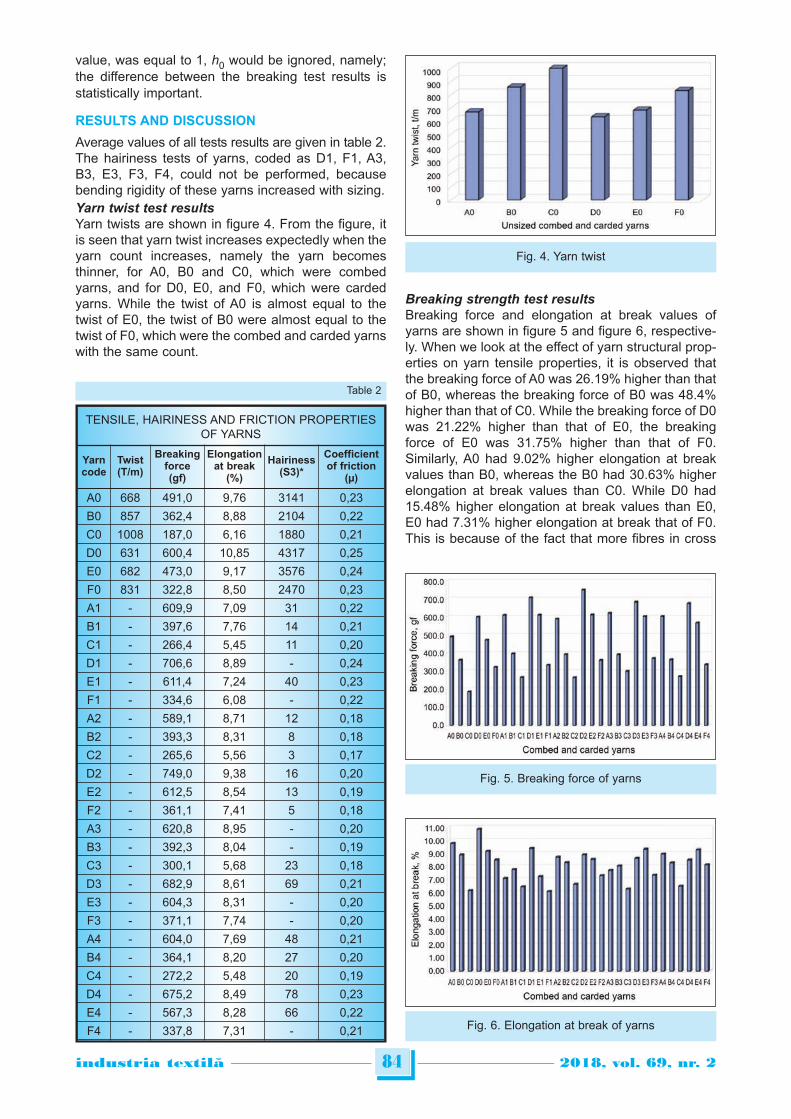
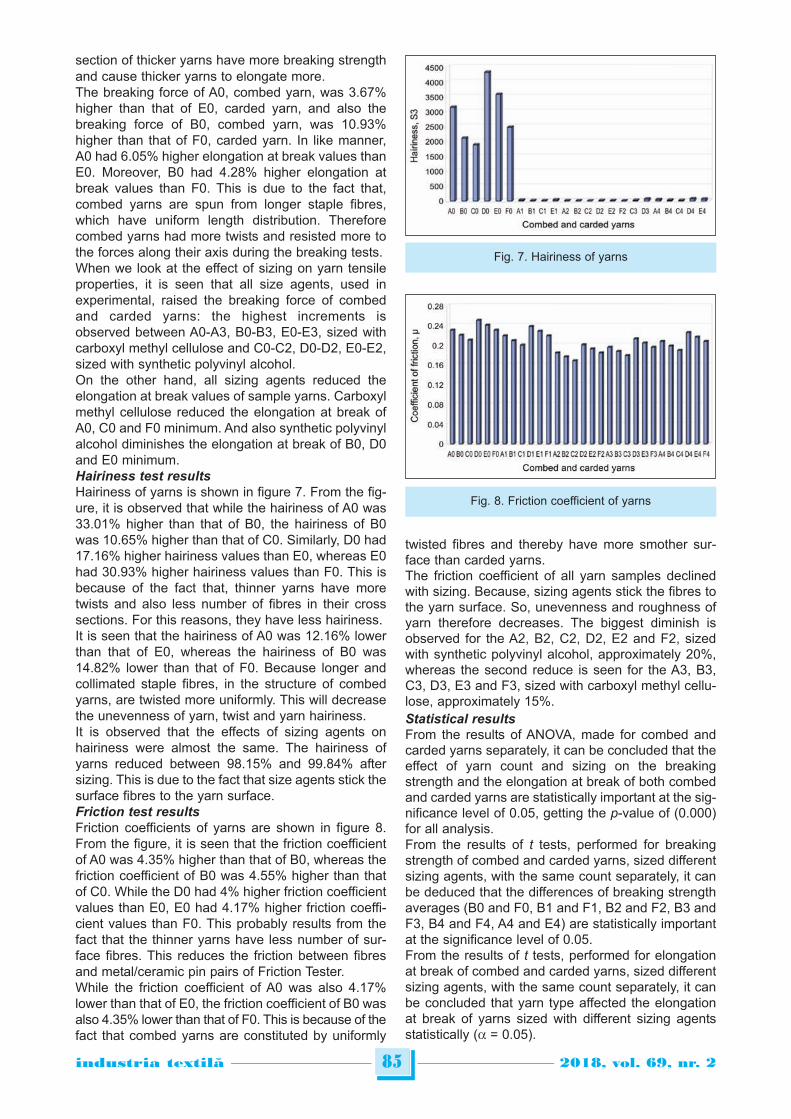
order to repeat the tests, all tests were performedalso at standard atmosphere conditions in PhysicalTesting Laboratory of in-house.Unseized yarns’ twists, given in table 1, were deter-mined by electronic twist measurement device accord-ing to EN ISO 2061 [8]. Measurements were per-formed in accordance with the Open-Close method,because yarns are single yarns. Measurement lengthwas 25 cm. And then twist per meter was calculated.Breaking forces and elongation at breaks of yarnswere measured by INSTRON Multipurpose StrengthTester (4411, USA), shown in figure 1, according toEN ISO 2062 at 100 mm/min [9]. Measurementlength was 200 mm. Load cell, whose capacity is500 N, was used. Hairiness of yarns was determined by Uster ZweigleHairiness Tester (5, Switzerland), shown in figure 2,according to ASTM D5647-07 at 50 m/min. The inputtension was 5 cN [10]. Measurement length was 100 m.Friction tests were also performed by LawsonHemphill Dynamic Friction Tester (CTT, USA) accord-ing to ASTM D3108 at 100 mm/min [11]. Co-efficientof friction between yarns and solid material, shownin figure 3, were determined. The input tension was15 cN.• Statistical evaluation
Breaking test results were evaluated statistically byANOVA according the General Linear Model withSPSS 15.0 software package. In order to analyse theeffect of sizing and yarn count, multivariate analysis
was made for the two groups of yarns: one includingcombed yarns and the other including carded yarns.Significance degrees (p), which were obtained fromANOVA, were compared with significance level (a)of 0.05. The effect, whose significance degree waslower than 0.05, was interpreted as statisticallyimportant.Besides, the effect of yarn type on breaking force andelongation at break of yarns was evaluated by t testsfor combed and carded yarns, whose counts werethe same. t tests were done by MATLAB 6.5 with sig-nificance level (a) of 0.05 also. Hypothesis of h0 wasdefined that averages were equal. If h, the calculated
83industria textila 2018, vol. 69, nr. 2˘
Fig. 1. Multipurpose Strength Tester Fig. 2. Hairiness Tester
Fig. 3. Yarn to solid material friction in DynamicFriction Tester [12]
value, was equal to 1, h0 would be ignored, namely;the difference between the breaking test results isstatistically important.
RESULTS AND DISCUSSION
Average values of all tests results are given in table 2.The hairiness tests of yarns, coded as D1, F1, A3,B3, E3, F3, F4, could not be performed, becausebending rigidity of these yarns increased with sizing.Yarn twist test results
Yarn twists are shown in figure 4. From the figure, itis seen that yarn twist increases expectedly when theyarn count increases, namely the yarn becomesthinner, for A0, B0 and C0, which were combedyarns, and for D0, E0, and F0, which were cardedyarns. While the twist of A0 is almost equal to thetwist of E0, the twist of B0 were almost equal to thetwist of F0, which were the combed and carded yarnswith the same count.
Breaking strength test results
Breaking force and elongation at break values ofyarns are shown in figure 5 and figure 6, respective-ly. When we look at the effect of yarn structural prop-erties on yarn tensile properties, it is observed thatthe breaking force of A0 was 26.19% higher than thatof B0, whereas the breaking force of B0 was 48.4%higher than that of C0. While the breaking force of D0was 21.22% higher than that of E0, the breakingforce of E0 was 31.75% higher than that of F0.Similarly, A0 had 9.02% higher elongation at breakvalues than B0, whereas the B0 had 30.63% higherelongation at break values than C0. While D0 had15.48% higher elongation at break values than E0,E0 had 7.31% higher elongation at break that of F0.This is because of the fact that more fibres in cross
84industria textila 2018, vol. 69, nr. 2˘
Fig. 4. Yarn twist
Fig. 5. Breaking force of yarns
Fig. 6. Elongation at break of yarns
TENSILE, HAIRINESS AND FRICTION PROPERTIESOF YARNS
Yarncode
Twist(T/m)
Breakingforce(gf)
Elongationat break
(%)
Hairiness(S3)*
Coefficientof friction
(µ)
A0 668 491,0 9,76 3141 0,23
B0 857 362,4 8,88 2104 0,22
C0 1008 187,0 6,16 1880 0,21
D0 631 600,4 10,85 4317 0,25
E0 682 473,0 9,17 3576 0,24
F0 831 322,8 8,50 2470 0,23
A1 - 609,9 7,09 31 0,22
B1 - 397,6 7,76 14 0,21
C1 - 266,4 5,45 11 0,20
D1 - 706,6 8,89 - 0,24
E1 - 611,4 7,24 40 0,23
F1 - 334,6 6,08 - 0,22
A2 - 589,1 8,71 12 0,18
B2 - 393,3 8,31 8 0,18
C2 - 265,6 5,56 3 0,17
D2 - 749,0 9,38 16 0,20
E2 - 612,5 8,54 13 0,19
F2 - 361,1 7,41 5 0,18
A3 - 620,8 8,95 - 0,20
B3 - 392,3 8,04 - 0,19
C3 - 300,1 5,68 23 0,18
D3 - 682,9 8,61 69 0,21
E3 - 604,3 8,31 - 0,20
F3 - 371,1 7,74 - 0,20
A4 - 604,0 7,69 48 0,21
B4 - 364,1 8,20 27 0,20
C4 - 272,2 5,48 20 0,19
D4 - 675,2 8,49 78 0,23
E4 - 567,3 8,28 66 0,22
F4 - 337,8 7,31 - 0,21
Table 2
section of thicker yarns have more breaking strengthand cause thicker yarns to elongate more. The breaking force of A0, combed yarn, was 3.67%higher than that of E0, carded yarn, and also thebreaking force of B0, combed yarn, was 10.93%higher than that of F0, carded yarn. In like manner,A0 had 6.05% higher elongation at break values thanE0. Moreover, B0 had 4.28% higher elongation atbreak values than F0. This is due to the fact that,combed yarns are spun from longer staple fibres,which have uniform length distribution. Thereforecombed yarns had more twists and resisted more tothe forces along their axis during the breaking tests.When we look at the effect of sizing on yarn tensileproperties, it is seen that all size agents, used inexperimental, raised the breaking force of combedand carded yarns: the highest increments isobserved between A0-A3, B0-B3, E0-E3, sized withcarboxyl methyl cellulose and C0-C2, D0-D2, E0-E2,sized with synthetic polyvinyl alcohol.On the other hand, all sizing agents reduced theelongation at break values of sample yarns. Carboxylmethyl cellulose reduced the elongation at break ofA0, C0 and F0 minimum. And also synthetic polyvinylalcohol diminishes the elongation at break of B0, D0and E0 minimum.Hairiness test results
Hairiness of yarns is shown in figure 7. From the fig-ure, it is observed that while the hairiness of A0 was33.01% higher than that of B0, the hairiness of B0was 10.65% higher than that of C0. Similarly, D0 had17.16% higher hairiness values than E0, whereas E0had 30.93% higher hairiness values than F0. This isbecause of the fact that, thinner yarns have moretwists and also less number of fibres in their crosssections. For this reasons, they have less hairiness.It is seen that the hairiness of A0 was 12.16% lowerthan that of E0, whereas the hairiness of B0 was14.82% lower than that of F0. Because longer andcollimated staple fibres, in the structure of combedyarns, are twisted more uniformly. This will decreasethe unevenness of yarn, twist and yarn hairiness. It is observed that the effects of sizing agents onhairiness were almost the same. The hairiness ofyarns reduced between 98.15% and 99.84% aftersizing. This is due to the fact that size agents stick thesurface fibres to the yarn surface.Friction test results
Friction coefficients of yarns are shown in figure 8.From the figure, it is seen that the friction coefficientof A0 was 4.35% higher than that of B0, whereas thefriction coefficient of B0 was 4.55% higher than thatof C0. While the D0 had 4% higher friction coefficientvalues than E0, E0 had 4.17% higher friction coeffi-cient values than F0. This probably results from thefact that the thinner yarns have less number of sur-face fibres. This reduces the friction between fibresand metal/ceramic pin pairs of Friction Tester.While the friction coefficient of A0 was also 4.17%lower than that of E0, the friction coefficient of B0 wasalso 4.35% lower than that of F0. This is because of thefact that combed yarns are constituted by uniformly
twisted fibres and thereby have more smother sur-face than carded yarns.The friction coefficient of all yarn samples declinedwith sizing. Because, sizing agents stick the fibres tothe yarn surface. So, unevenness and roughness ofyarn therefore decreases. The biggest diminish isobserved for the A2, B2, C2, D2, E2 and F2, sizedwith synthetic polyvinyl alcohol, approximately 20%,whereas the second reduce is seen for the A3, B3,C3, D3, E3 and F3, sized with carboxyl methyl cellu-lose, approximately 15%. Statistical results
From the results of ANOVA, made for combed andcarded yarns separately, it can be concluded that theeffect of yarn count and sizing on the breakingstrength and the elongation at break of both combedand carded yarns are statistically important at the sig-nificance level of 0.05, getting the p-value of (0.000)for all analysis. From the results of t tests, performed for breakingstrength of combed and carded yarns, sized differentsizing agents, with the same count separately, it canbe deduced that the differences of breaking strengthaverages (B0 and F0, B1 and F1, B2 and F2, B3 andF3, B4 and F4, A4 and E4) are statistically importantat the significance level of 0.05.From the results of t tests, performed for elongationat break of combed and carded yarns, sized differentsizing agents, with the same count separately, it canbe concluded that yarn type affected the elongationat break of yarns sized with different sizing agentsstatistically (a = 0.05).
85industria textila 2018, vol. 69, nr. 2˘
Fig. 8. Friction coefficient of yarns
Fig. 7. Hairiness of yarns
CONCLUSIONS
Statistical and experimental studies were conductedwithin the scope of this study to determine the effectsof sizing and yarn count, yarn type, which are yarnimportant structural parameters, on the breakingstrength, elongation at break, hairiness and coeffi-cient of friction. It was found that the mentionedparameters affected the physical properties of 100%cotton carded and combed single ring yarns:It is observed for both combed and carded yarns thatthinner yarns were twisted more with the decreasingnumber of fibres in cross sections of thinner yarns.The combed and carded yarns, with the same count,had almost the same twist.The breaking force and the elongation at break ofcombed and carded yarns increased with thedecrease in yarn count expectedly, because of themore fibres in cross section of thicker yarns. Combed yarns, which were spun from longer staplefibres, whose lengths were uniformly distributed,showed better performance during tensile tests. Sothey had better breaking strength and elongation atbreak values than carded yarns.It is observed that hairiness of thinner yarns, whichhad less number of fibres in their cross sections andmore twists, were lower than those of thicker yarns.Hairiness of combed yarns, which were constitutedfrom longer staple fibres and also parallel to eachother, was better than those of carded yarns with thesame count.
It is seen that friction coefficients of thinner yarns,that had more twist and less number of fibres in theirsurfaces and thereby had more smother surfaces,were lower than those of thicker yarns.Furthermore, friction coefficients of combed yarns,which were comprised of uniformly twisted fibres andthereby had smother surfaces, were lower than thoseof carded yarns with the same count.While the braking forces of all yarns increased withall sizing agents used in this study, elongation atbreak of yarns decreased with sizing agents.It is observed that the hairiness of yarns sized with allsizing agents used in this research decreased,because of the fact that sizing agents fix fibres to theyarn surfaces. The hairiness tests of some yarnscould not be performed, because of increment inbending rigidity of these yarns with sizing.The friction coefficients of yarns, determined bymeans of friction tester, decreased with sizing.Synthetic polyvinyl alcohol and carboxyl methyl cellu-lose, sizing agents, have the best effects on the fric-tional and tensile properties of 100% cotton ring yarns.Consequently, the 100% cotton combed ring yarnsshow better performance than in tensile tests beforeand after sizing. It can be concluded from the resultsthat sizing treatment improves the tensile as well asthe frictional properties of 100% cotton carded andcombed ring yarns. As a result, weaving performanceof sized cotton ring yarns were enhanced. The incre-ments in the performance of sized yarns results fromnot onlyincrease in the breaking strength but alsodiminish in friction coefficients of sized yarns.
86industria textila 2018, vol. 69, nr. 2˘
BIBLIOGRAPHY
[1] Schwarz, I.G., Kovacevic, S., Dimitrovski, K. Analysis of changes in mechanical and deformation properties of yarnby sizing. In: Textile Research Journal, 2011, vol. 81, issue 5, p. 545.
[2] Behera, B.K., Pakhira, A. Evaluation of the weavability of polyester-fibre multifilament sized yarn. In: Journal of theTextile Institute, 1998, vol. 89, issue 3, p. 522.
[3] Maatoug, S., Ladhari, N., Sakli, F. Evaluation of the weavability of sized cotton warps. In: AUTEX Research Journal,2007, vol. 8, issue 4, p. 239.
[4] Behera, B.K., Joshi, V.K. Effect of sizing on weavability of Dref yarns. In: AUTEX Research Journal, 2006, vol. 6,issue 3, p. 142.
[5] Jaouachi, B., Ben Hassen, M., Saklı, F. Strength of wet spliced denim yarns after sizing using a central compositedesign. In: AUTEX Research Journal, 2009, vol. 7, issue 3, p. 159.
[6] Jaouachi, B., Ben Hassen, M., Saklı, F. Optimisation of the behaviour of sized wet spliced yarns. In: AUTEXResearch Journal, 2009, vol. 9, issue 1, p. 1.
[7] Mahadevan, M. G. Textile spinning, weaving and designing. In: Abhishek Publications, 2009, pp. 16–17.[8] ISO EN 2061. Textiles – Determination of twist in yarns – Direct counting method, 2010.[9] EN ISO 2062. Textiles – Yarns Form Packages – Determination of Single-End Breaking Force and Elongation at
Break, 1995.[10] ASTM D5647-07. Standard Guide for Measuring Hairiness of Yarns by the Photo-Electric Apparatus, 2012.[11] ASTM D 3108. Standard Test Method for Coefficient of Friction, Yarn to Solid Material, 2013.[12] Kilic, G.B., Sülar, V. Frictional properties of cotton-tencel yarns spun in different spinning systems. In: Textile
Research Journal, 2012, vol. 82, issue 8, p. 755.
Authors:
HAKAN ÖZDEMİR
DokuzEylül University, Faculty of Engineering, Department of Textile EngineeringBuca-35397, İzmir-TURKEY
e-mail: [email protected]
INTRODUCTION
The conventional ring-spinning technology based onthe ring-traveller-spindle mechanism, which influ-ences on the true twist insertion of the ring-spunyarn. Mentioned mechanism is almost the same formore than 150 years [1]. The main reason of that iseven structure of the ring-spun yarn, wide range offineness, good mechanical properties that are in theclose connection with the number of turns per meterthat is the highest for ring-spun yarn in comparisonwith new spinning techniques [1–3].In the last few years, many researches were consid-ered with the ring-spun yarn structure in comparisonwith new spinning techniques such are rotor spinningand air-jet spinning technique [1, 4].Rotor spinning allows much higher levels of produc-tivity than ring-spinning [1]. On the other hand, the
second objective has not yet been achieved becauseof the structure of rotor yarn, which also limits thefineness of count that can be spun. Perhaps thebiggest current obstacle facing rotor spinning is thefact that it is limited to coarse and medium yarncounts (16 tex to 120 tex) while ring-spinning excelsin the medium to fine counts (finer than > 16 tex).Yarn manufacture using the air-jet primarily producesfascinated yarns using the false twist principle.Hence, we discuss about the principle of false twist-ing before going into actual air jet spinning.The idealized structure of the fascinated yarn con-sists of parallel fibres held together by wrapper fibres.The wrapper and core fibres are composed of samestaple fibre material. Since there is no real twist in thecore, this type of yarn structures facilitates high pro-duction rates.
87industria textila 2018, vol. 69, nr. 2˘
The influence of air-jet and vortex yarn on functionality of woven fabric
ŠAJN GORJANC DUNJA GLAŽAR DOMINIKA
REZUMAT – ABSTRACT
Influenţa firelor filate cu jet de aer şi vortex asupra funcţionalităţii ţesăturii
Obiectivul acestui studiu este de a analiza influenţa structurii firelor filate cu jet de aer şi vortex asupra funcţionalităţiiţesăturii. În cadrul studiului, au fost analizate firele cu jet de aer şi vortex comparativ cu firele convenţionale filate pemaşina de filat cu inele, din amestecul de 65% PES / 35% fibre CO şi fineţe 20 tex. Țesătura cu legătură diagonal T1/3Z a fost realizată din firul filat cu jet de aer, vortex şi filat cu inele în direcţia bătăturii,cu două desimi diferite de bătătură (20 şi 30 fire pe cm).În prima parte a studiului, au fost analizate structura, proprietăţile fizice şi mecanice ale firelor filate cu jet de aer, vortexşi filate cu inele, în timp ce în a doua parte a studiului a fost analizată influenţa firelor utilizate în direcţia bătăturii asuprafuncţionalităţii ţesăturii.Studiul s-a concentrat în principal pe proprietăţile fizice, mecanice, precum şi pe proprietăţile de permeabilitate aleţesăturii filate cu jet de aer şi vortex în direcţia bătăturii, în comparaţie cu ţesăturile cu fire convenţionale filate cu ineleîn direcţia bătăturii, cu compoziţie chimică şi fineţe a firelor similare.Rezultatele studiului au evidenţiat structura ideală a firului în direcţia bătăturii (filate cu jet de aer sau vortex) careaproximează cel mai bine caracteristicile firelor filate cu inele, datorită mecanismului cursor-fus şi a celei mai uniformestructuri, în principal datorită inserării torsiunii reale.
Cuvinte-cheie: fir filat cu jet de aer, fir vortex, fir filat cu inele, ţesătură, proprietăţi mecanice şi de permeabilitate
The influence of air-jet and vortex yarn on functionality of woven fabric
The basic intention of the research is to analyse the influence of air-jet and vortex yarn structure on woven fabricfunctionality. With the research, the air-jet and vortex yarn from the mixture of 65 % PES / 35 % CO fibres and fineness20 tex were analysed. For comparison, the conventional ring-spun yarn was chosen from the mixture of 65 % PES/35 %CO fibres and fineness 20 tex. The woven fabric in the twill weave T1/3Z was produced from the air-jet, vortex and ring-spun yarn in the weft directionwith two different weft densities (20 and 30 yarns per cm).In the first part of the study, the structure, physical and mechanical properties of the air-jet, vortex and ring-spun yarnwere analysed, while in the second part of the research, the influence of used yarn in the weft direction on thefunctionality of woven fabric was studied. The research was focused mainly on physical, mechanical properties as well as permeability properties of woven fabricwith air-jet and vortex yarn in the weft direction in comparison with woven fabric with conventional ring-spun yarn in theweft direction, with equal chemical composition and fineness of yarn.The research results was shown which yarn structure in the weft direction of woven fabric (air-jet or vortex) the mostclosely approximates the characteristics of the ring-spun yarn, which has because of ring-traveller-spindle mechanismideal and the most even structure, mainly because of the insertion of the true twist.
Keywords: air-jet yarn, vortex yarn, ring-spun yarn, woven fabric, mechanical and permeability properties
DOI: 10.35530/IT.069.02.1412
88industria textila 2018, vol. 69, nr. 2˘
The tenacity of the fascinated yarns spun with air jetdepend on the yarn count. The coarser yarns areweaker than the finer yarns for the same fibre type.Contrary to the expectation, yarns produced withfiner fibres show lower tenacity compared to theyarns produced with coarser fibres.The reason for the above observations is that thestrength of the fascinated yarns is derived from theamount of wrapper fibres and the intensity of wrap-ping. The edge fibres are the ones that ultimately areconverted into wrapper fibres. The number of edgefibres is limited to the surface of the yarn and areindependent of the number of fibres in the core [1–3].Finally, the vortex spinning is hailed as a revolution-ary new technology it can also be viewed as a natu-ral development in the technology of fasciated yarnproduction. From the earliest inception of fasciatedyarns, it was evident that there were limitations,which precluded its wide acceptance [5].Murata Vortex spinning technology is a modified formof jet spinning which has attracted a lot of attentionbecause of its advantages over ring-spinning, openend and air-jet spinning. It has a high productivityrate, its yarn structure is similar to ring yarn, low hairi-ness and most important; it is possible to use a widerfibre length range to spin a wider yarn size productionrage for 100% cotton [5–10].Above-mentioned facts about the ring-spun yarn andespecially air-jet and vortex yarn were the basic rea-son to deal with the influence of air-jet and vortexyarn structure on woven fabric functionality in com-parison with conventional ring-spun yarn in the weftdirection.
Ring-spinning
The American Thorp invented the ring-spinningmachine in the year 1828. In 1830, another AmericanJenk, contributed the traveller rotating on the ring. Inmore than 150 years that have passed since thattime, the machine has experienced considerablemodification in detail, but the basic concept hasremained unchanged.The ring-spinning machine has been the most widelyused form of spinning and it will continue for somemore time, because it has unique advantage overnew spinning technologies. It is universally applica-ble, most of the textile fibres can be spun to requiredfineness. The yarn spun from this machine demon-strates excellent quality features like uniform struc-ture and good strength. It is easy to operate as com-pared to other spinning machines. It is flexible asregard to quantities in terms of blend and lot sizes.For these reasons, new spinning processes (with theexception of rotor spinning) have difficulty in gainingwide spread acceptance.Disadvantages of ring-spinning system are low pro-duction and that machine generates more heat.In ring-spinning, the fibre mass of the rove is reducedby a drafting unit. The twist inserted moves upwardsand reaches the fibres leaving the drafting unit. Thefibres lay around one another in concentric helicalpath. The normal force encountered by the fibres
enhances the adhesive forces between the fibresand prevent fibres from flying or slipping past eachother under the tensile strain.It is the process of attenuating the roving strand untilrequired final yarn count achieved and inserting twistto the fibres by means of a rotating spindle and wind-ing the yarn on a bobbin. These three stages takeplace simultaneously and continuously. The ring yarnis characterized by high flexibility in the use of theraw material, the yarn count and the yarn character.It possesses a high degree of strength and yarn hairi-ness [1–3].
Air-jet spinning
With air-jet spinning a draw frame sliver fed from acan is passed to a drafting arrangement, where it isattenuated by a draft in the range of 100–200. Thefibre strand delivered then proceeds to two air jetsarranged directly after the drafting arrangement. Thesecond jet is the actual false-twist element.In air-jet spinning, a sliver is fed to the drafting sys-tem; the drafted sliver enters a spinning nozzle. Theleading end of the fibres forms the parallel yarn core;the free fibre ends are wound around the yarn coreby the air in the spinning nozzle. The air-jet yarn isthen wound onto a package.The air-jet-spun yarn structure consists of core fibreswithout significant twist and covering fibres with agenuine twist, which ultimately produces the corre-sponding yarn tenacity. The specific yarn structureresults in yarn tenacity between that of a ring-spunyarn and that of a rotor-spun yarn.The air vortex generated in this jet, with an angularvelocity of more than 2 million routes per minutetwists the strand as it passes through so that thestrand rotates along a screw-thread path in the jet,achieving rotation speeds of about 250,000 routesper minute. The compressed air reaches the speed ofsound when entering the central canal of the false-twist element. Since the axial forces are very low dur-ing this rotation, only low tensions arise in the yarn[9–15].
Vortex spinning
Vortex spinning technology was introduced byMurata Machinery Ltd. Japan in 1997. This technolo-gy is best explained as a development of air-jet spin-ning, making use of air jets for yarn twisting. Themain features of Murata vortex spinning (MVS) areability to produce yarn at 400 m/min, which is almost20 times greater than ring-spinning frame productionand low maintenance costs, a fully automated piecingsystem and elimination of roving frame. The yarn andthe fabric properties of MVS yarn are claimed by themanufacturer to be comparable to those of ring-spunyarn.Vortex yarn has a two-part structure: a core sur-rounded by wrapper fibres. The number of wrapperfibres compared to the fibre core is higher comparedto the air jet spinning. During yarn formation, theleading ends of the fibres are directed towards theyarn core and the trailing ends wrap around the core
89industria textila 2018, vol. 69, nr. 2˘
fibres. Such a structure provides the necessary fibreorientation and, at the same time, the required yarnstrength.One problem with the vortex system is significantfibre loss during the yarn formation. This is related tothe problem of variations in yarn quality, which arenot detectable by conventional evenness testers andsometimes only identified by weak points in the fin-ished fabric. The path followed by the fibre in the cur-rents created by the air jets play a crucial role in yarnquality. Most structural defects are caused by thedeflection of fibres in the air jet from their ideal path[4–9].
EXPERIMENTAL
Materials
The basic intention of the research is to analyse theinfluence of air-jet and vortex yarn on woven fabricfunctionality. With the research, the air-jet and vortexyarn from the mixture of 65 % PES/35 % CO fibresand fineness 20 tex were analysed. The air-jet yarn
had the false twist while the vortex yarn had 695twists/m. For comparison, the conventional ring-spunyarn was chosen from the mixture of 65 % PES/35 %CO fibres and fineness 20 tex and 789 twists/m. For the intention of our research, six woven fabricswere designed and produced on the weavingmachine Minifaber (Italy) with Jacquard mechanismTIS (France). The woven fabrics were produced inthe twill weave T 1/3 Z from the air-jet (A20, A30),vortex (V20, V30) and ring-spun yarns (R20, R30) inthe weft direction with two different weft densities (20and 30 yarns per cm). Table 1 presents the SEM images of air-jet, vortexand ring-spun yarn in the weft direction of fabric.Ring-spun yarn is produced using true twist insertionfrom the outer to inner layer and has the most evenstructure (table 1: Ring-spun yarn – longitudinal andcross-sectional view). On the other side the air-jetyarn is produced using false twist insertions causedby air vortex generated in two jets, with an angularvelocity of more than 2 million routes per minute.
Magnif.Samples (longitudinal view)
Air-jet yarn Vortex yarn Ring-spun yarn
50
250Samples (cross-sectional view)
Air-jet yarn Vortex yarn Ring-spun yarn
Table 1
Because of that the air-jet-spun yarn structure con-sists of core fibres without significant twist and cover-ing fibres with a genuine twist (table 1: Air-jet yarn –longitudinal view and cross-sectional view). On thecontrary, the vortex yarn is produced using true twistinsertion. Vortex yarn has a two-part structure: a core
surrounded by wrapper fibres (table 1). The numberof wrapper fibres compared to the fibre core is high-er compared to the air-jet spinning.Table 2 presents the microscope images of wovenfabrics analysed with the magnifications 10 x, 20 xand 30 x.
90industria textila 2018, vol. 69, nr. 2˘
FabricMagnification
10 x 20 x 30 x
A20
A30
V20
V30
R20
R30
Table 2
The fabric mark A20 and A30 presented woven fabricwith air-jet yarn in the weft direction with the weft den-sity 20 yarns per cm (A20) and 30 yarns per cm(A30), while fabrics with vortex yarn in the weft direc-tion was signed as V20 and V30 with two differentweft densities (20 and 30 yarns per cm). The fabricwith ring-spun yarn in the weft was signed as R20and R30 with two different weft densities (table 2).The ring-spun yarn from 100 % CO was used in thewarp direction. The density in warp direction was thesame for all fabrics, 20 yarns per cm. Linear densityof ring-spun yarn in warp direction was 16 tex, with537 twists/m. All yarns in the warp and weft directionshad Z twist direction.Table 3 presents the structural properties of fabricsanalysed
METHODS
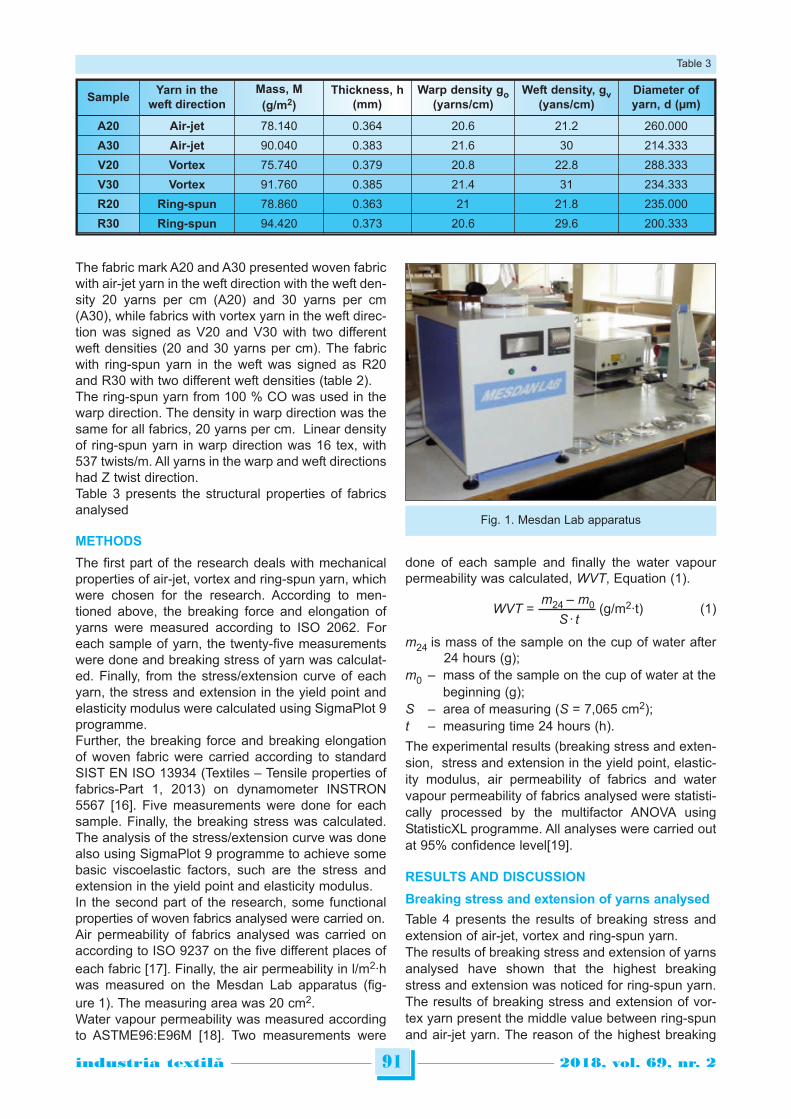
The first part of the research deals with mechanicalproperties of air-jet, vortex and ring-spun yarn, whichwere chosen for the research. According to men-tioned above, the breaking force and elongation ofyarns were measured according to ISO 2062. Foreach sample of yarn, the twenty-five measurementswere done and breaking stress of yarn was calculat-ed. Finally, from the stress/extension curve of eachyarn, the stress and extension in the yield point andelasticity modulus were calculated using SigmaPlot 9programme.Further, the breaking force and breaking elongationof woven fabric were carried according to standardSIST EN ISO 13934 (Textiles – Tensile properties offabrics-Part 1, 2013) on dynamometer INSTRON5567 [16]. Five measurements were done for eachsample. Finally, the breaking stress was calculated.The analysis of the stress/extension curve was donealso using SigmaPlot 9 programme to achieve somebasic viscoelastic factors, such are the stress andextension in the yield point and elasticity modulus.In the second part of the research, some functionalproperties of woven fabrics analysed were carried on.Air permeability of fabrics analysed was carried onaccording to ISO 9237 on the five different places ofeach fabric [17]. Finally, the air permeability in l/m2·hwas measured on the Mesdan Lab apparatus (fig-ure 1). The measuring area was 20 cm2.Water vapour permeability was measured accordingto ASTME96:E96M [18]. Two measurements were
done of each sample and finally the water vapourpermeability was calculated, WVT, Equation (1).
m24 – m0WVT = (g/m2·t) (1)S · t
m24 is mass of the sample on the cup of water after24 hours (g);
m0 – mass of the sample on the cup of water at thebeginning (g);
S – area of measuring (S = 7,065 cm2);t – measuring time 24 hours (h).
The experimental results (breaking stress and exten-sion, stress and extension in the yield point, elastic-ity modulus, air permeability of fabrics and watervapour permeability of fabrics analysed were statisti-cally processed by the multifactor ANOVA usingStatisticXL programme. All analyses were carried outat 95% confidence level[19].
RESULTS AND DISCUSSION
Breaking stress and extension of yarns analysed
Table 4 presents the results of breaking stress andextension of air-jet, vortex and ring-spun yarn.The results of breaking stress and extension of yarnsanalysed have shown that the highest breakingstress and extension was noticed for ring-spun yarn.The results of breaking stress and extension of vor-tex yarn present the middle value between ring-spunand air-jet yarn. The reason of the highest breaking
91industria textila 2018, vol. 69, nr. 2˘
SampleYarn in the
weft directionMass, M
(g/m2)Thickness, h
(mm)Warp density go
(yarns/cm)Weft density, gv
(yans/cm)Diameter ofyarn, d (µm)
A20 Air-jet 78.140 0.364 20.6 21.2 260.000
A30 Air-jet 90.040 0.383 21.6 30 214.333
V20 Vortex 75.740 0.379 20.8 22.8 288.333
V30 Vortex 91.760 0.385 21.4 31 234.333
R20 Ring-spun 78.860 0.363 21 21.8 235.000
R30 Ring-spun 94.420 0.373 20.6 29.6 200.333
Table 3
Fig. 1. Mesdan Lab apparatus
stress and extension of ring-spun yarn lies in thestructure of ring-spun yarn, which has the highestnumber of twist (789 twists/m). The number of twistshas an important impact on mechanical propertiessuch are breaking stress and breaking extension.The lowest breaking stress and extension expressedair-jet yarn, which is produced with the false twistingthe sheath fibres around the core fibres. Only 5 % ofthe sheath fibres are wound around the core. That isthe main reason for the lowest breaking stress andextension.
Stress and extension in the yield point andelasticity modulus of yarns analysed
Table 5 presents the results of the stress and exten-sion in the yield point and elasticity modulus of yarnsanalysed.The results of the stress and extension in the yieldpoint are shown that the highest yield point (thestress and extension in the yield point) has ring-spunyarn, which means the wider region of elastic defor-mation. The reason lies in the structure of the ring-spun yarn, which expresses the highest twist. The results of the elasticity modulus, which presentthe resistance of fabric under loading in the elasticregion to the limit of elastic deformation (the yieldpoint), show that ring-spun yarn expresses the high-est elasticity modulus in comparison with air-jet andvortex yarn. Ring-spun yarn has also the highestbreaking stress and extension, means that thestress/extension curve of ring-spun yarn has steeperslope in the field of elastic deformations than thecurve of air-jet or vortex yarn. The lowest elasticitymodulus has air-jet yarn, mainly because of falsetwist insertion during production of air-jet yarn, whichresults in the lower percentage (only 5-percents) ofthe sheath fibres, which are wound around the corethan with vortex yarn.The number of wrapped fibresof vortex yarn compared to the fibre core is higher incomparison to the air-jet spinning process. Duringyarn formation, the leading ends of the fibres are
directed towards the yarn core and the trailing endswrap around the core fibres. Such a structure pro-vides the necessary fibre orientation and at the sametime, the required yarn strength which influences onthe higher elasticity modulus than elasticity modulusof air-jet yarn.
Breaking stress and extension of fabricsanalysed
Table 6 presents the results of breaking stress andextension of fabrics analysed.From the results of breaking stress and extension ofwoven fabrics, it can be found that the fabrics with thering-spun yarn in the weft direction express the high-est breaking stress and breaking extension in theweft direction (36.685 N/mm2 and 21.00 %). Thebreaking stress in the weft direction is the highestwith fabrics, which incorporate ring-spun yarn (R20and R30), means for the fabrics with weft density20 yarns/cm and 30 yarns/cm. The reason lies in thestructure of the ring-spun yarn, which expresses thehighest twist and influences on the highest breakingstress and extension in the weft direction.The lowest breaking stress and breaking extension ismeasured with fabrics A20 and A30 that incorporateair-jet yarn in the weft direction (19.637 N/mm2 and14.222 %). The reason of the lowest breaking stress and exten-sion lies in the false twist insertion during productionprocess of air-jet yarn, which results in the lower per-centage (only 5-percents) of the sheath fibres whichare wound around the core than with vortex yarn.The results of breaking stress and breaking exten-sion of fabrics V20 and V30 that incorporate vortexyarn are between the values of fabrics with air-jetyarn in the weft (A20, A30) and ring-spun yarn in theweft direction (R20, R30).
92industria textila 2018, vol. 69, nr. 2˘
YarnBreaking
stress, sbr(cN/tex)
Standarddeviation, s
(cN/tex)
Coefficient ofvariation, CV
(%)
Breakingextension, e
(%)
Standarddeviation, s
(%)
Coefficient ofvariation, CV
(%)
Air-jet 11.064 35.809 16.446 5.367 1.024 19.081
Vortex 16.622 38.065 11.691 7.553 0.726 9.612
Ring-spun 24.522 35.291 7.214 10.633 0.571 5.372
Table 4
Yarn
Stress in theyield point,sy (cN/tex)
Extensionin the yieldpoint, ey (%)
Elasticitymodulus, E0
(cN/tex)
Air-jet 0.036 1.333 0.036
Vortex 0.043 1.500 0.037
Ring-spun 0.044 1.500 0.042
Table 5
Fabric
Breaking stress, sbr (N/mm2)
Breaking extension,ebr (%)
Warp Weft Warp Weft
A20 13.895 14.192 9.333 10.61110
A30 13.249 19.187 9.944 13.111
V20 12.266 19.637 8.388 14.222
V30 12.036 27.517 8.666 15.778
R20 12.779 25.881 9.722 19.388
R30 13.784 36.685 9.944 21.000
Table 6
From the results of breaking stress and extension ofwoven fabrics, it can be also found that the structureof yarn (air-jet, vortex and ring-spun yarn) has animportant impact in the weft direction. In the warpdirection, the differences among the values of break-ing stress and extension are minor and movebetween 12.036 N/mm2 and 13.895 N/mm2 and8.388 % and 9.944 %.From the results it is also seen that with the increas-ing weft density (from 20 to 30 yarns/cm), the break-ing stress and extension increase. Mentioned resultsare expected.The statistical analysis ANOVA shows a statisticallyimportant influence of the used yarn structure in theweft direction on the breaking stress and breakingextension value, especially in the weft direction.
Stress and extension in the yield point andelasticity modulus of fabrics analysed
Tables 7 and 8 present the results of stress andextension in the yield point and elasticity modulus inthe warp and weft direction.The results of the elastic limit (the stress and exten-sion in the yield point) of woven fabrics in the warpdirection show the highest value of the stress andextension in the yield point with fabric A20, whichincorporate air-jet yarn. That results shown that fab-ric with air-jet yarn in the weft has higher stress andextension in the yield point and lower elasticity mod-ulus in the warp direction in comparison with fabricswhich incorporate vortex and ring-spun yarn in theweft direction. On the other side the elasticity modu-lus of fabrics R20 and R30 is the highest. Means thatfabrics R20 and R30 with ring-spun yarn in the weft
direction are less deformable in the elastic region onthe stress/extension curve.The results of the stress and extension in the yieldpoint in the weft direction show that the highest yieldpoint have fabrics R20 and R30 with ring-spun yarnin the weft direction. From the results, it is seen thatfabrics V20 and V30 that have vortex yarn in the weftdirection also show very high values of the stress andextension in the yield point. Means that fabrics withring-spun and vortex yarn express higher yield pointand higher limit of elastic deformations than fabricswith air-jet yarn in the weft direction.The structure of vortex yarn is very similar to ring-spun yarn, which results in similar values of thestress and extension in the yield point of fabrics R20and R30 with ring-spun yarn in the weft and with V20and V30 with vortex yarn in the weft direction.The results of elasticity modulus show that the high-est value of elasticity modulus has fabrics V20 andV30 with vortex yarn in the weft. The reason of thatlies in the two-component structure of vortex yarn(core and the sheath fibres).The results also show that with increasing weft den-sity (from 20 to 30 yarns/cm), the yield point and elas-ticity modulus also increases. Mentioned results areexpected.The statistical analysis ANOVA shows a statisticallyimportant influence of the structure of yarn in the weftdirection on the stress and extension in the yieldpoint value and elasticity modulus especially in theweft direction
Air permeability of fabrics analysed
Table 9 presents the results of air permeability of fab-rics analysed.The results of air permeability of fabrics show that thehighest air permeability was measured with fabricsR20 and R30 with ring-spun yarn in the weft direc-tion. Reason lies in the so-called ideal structure ofring-spun yarn and the highest twist of ring-spunyarn, which influences on the lower number of shortprojecting fibres that ensures the highest air perme-ability for the both weft densities, 20 and 30 yarns/cmof fabrics (R20 and R30). Fabrics A20 and V20 whichincorporate air-jet and vortex yarn in the weft direc-tion have similar value of air permeability (19.94 and19.87 l/min·cm2). Fabrics A30 and V30 (weft density:30 yarns/cm) also express similar values of air
93industria textila 2018, vol. 69, nr. 2˘
Fabric
Stress in theyield point, sy (N/mm2)
Extension inthe yield
point, ey (%)
Elasticity modulus, E0
(N/mm2)
A20 0.725 3.333 0.116
A30 0.590 3.333 0.134
V20 0.276 1.833 0.126
V30 0.492 2.667 0.140
R20 0.164 2.055 0.208
R30 0.622 3.000 0.172
Table 7
Fabric
Stress in theyield point, sy (N/mm2)
Extension inthe yield
point, ey (%)
Elasticity modulus, E0
(N/mm2)
A20 0.577 2.000 0.992
A30 1.033 3.167 0.280
V20 0.805 2.33 0.345
V30 1.548 3.333 0.326
R20 0.890 2.833 0.220
R30 1.598 3.833 0.215
Table 8
FabricAir permeability,
Q (l/ min·cm2)
A20 19.94
A30 13.33
V20 19.87
V30 12.77
R20 21.58
R30 14.53
Table 9
permeability, A30 (13.33 l/min·cm2) and V30 (12.77l/min·cm2).Air-jet and vortex yarn have two-component structurefrom the core and wrapped fibres (the sheath), whichinfluence on the projecting fibres increase on theyarn surface and finally on the woven fabric surface.The projecting fibres on the fabric surface influenceon the air permeability decrease.The results of air permeability also show that withincreasing density, air permeability of fabric decreases.The statistical analysis ANOVA shows a statisticallyimportant influence of the structure of yarn in the weftdirection on air permeability of fabrics analysed.
Water vapour permeability
Table 10 presents the results of water vapour perme-ability of fabrics analysed.The highest water vapour permeability was mea-sured with fabric R20, which incorporates ring-spunyarn in the weft direction. Ring-spun yarn of fabricR20 has because of higher twist, lower number ofprojecting fibres on the fabric surface, which influ-ences on higher water vapour permeability (189.137g/m2h). Contrarily, the fabrics V30 (vortex yarn in theweft) and A30 (air-jet yarn in the weft) which have,because of two-component structure (core andsheath fibres), higher number of projecting fibres onthe fabric surface which prevent water vapour per-meability, that is in that case lower (136.53 g/m2h forfabric V30 and 121.137 g/m2h for fabric A30). The results show that with increasing density, thewater vapour permeability of fabrics analyseddecreases.The lowest water vapour permeability with fabricswith warp density 30 yarns/cm was measured withfabric R30 that incorporates ring-spun yarn in theweft direction mainly because of the structure of ring-spun yarn in the woven fabric. With the densityincrease (from 20 to 30 yarns/cm), the structure ofwoven fabric in the case of the ring-spun yarn is lessopened than in the case of fabric A30 (air-jet yarn inthe weft) and V30 (vortex yarn in the weft) with thesame weft density.The results of water vapour permeability also showthat fabrics V20 and V30 with vortex yarn in the weftshow higher values than fabrics A20 and A30 with air-jet yarn in the weft. Reason lies in the structure ofvortex yarn, which is two-component, but the per-centage of wrapped fibres around the core is higher
than in the case of air-jet yarn in the weft (fabrics A20and A30). That means less projecting fibres on thesurface of fabrics A20 and A30 which influence on thelower water vapour permeability.The statistical analysis ANOVA shows a statisticallyimportant influence of the structure of yarn in the weftdirection on water vapour permeability of fabricsanalysed.
CONCLUSIONS
Based on the presented research of the influence ofair-jet and vortex yarn structure on woven fabric func-tionality, the following conclusions could be drawn:• Vortex yarn, which has similar structure to ring-
spun yarn (the true twist insertion in the both cases)expresses the middle values of breaking stress andextension which move betwen the breaking stressand extension of air-jet yarn and ring-spun yarn.
• The limit of elastic deformation (the yield point) ofvortex yarn is very close to the ring-spun yarn yieldpoint value, while the elasticity modulus value liesbetween the elasticity modulus of air-jet yarn (falsetwisting) and ring-spun yarn (true twisting).
• Fabrics with ring-spun yarn in the weft directionhave in general the highest breaking point and theyield point level, especially in the weft direction.
• Fabrics with vortex yarn in the weft direction havein general higher breaking point and the yield pointthan fabrics with ring-spun yarn in the weft direc-tion.
• On the other hand fabrics with vortex yarn in theweft express the highest elasticity modulus, mainlybecause of two-component structure of vortex yarn(the core and sheath fibres) with higher value of thewound sheath fibres than with air-jet yarn (only 5 %of wound sheath fibres).
• Fabrics with vortex and air-jet yarn in the weftexpress similar air permeability, while fabrics withring-spun yarn express the highest air permeability,mainly because of lower number of projectingfibres on the fabric surface of that kind of fabrics.
• On the other hand the water vapour permeability offabrics with vortex yarn in the weft express highervalue than fabrics with air-jet yarn in the weft.Fabrics with ring-spun yarn in the weft express thehighest water vapour permeability.
Based on the facts presented above, it could be con-cluded that the incorporation of vortex yarn in theweft direction improves the breaking stress andextension and the yield point level (the limit of elasticdeformations) in comparison with fabric with air-jetyarn in the weft direction and consequently the regionof elastic deformations (more than 50%).The vortex yarn in the weft direction improves theelasticity modulus level. The elasticity modulus pre-sents the resistance of a fabric under loading in theelastic region under the stress/extension curve.Means, the woven fabrics which incorporate vortexyarn in the weft are less deformable and express awider region of elastic deformations. The researchshows that the highest breaking stress and extension
94industria textila 2018, vol. 69, nr. 2˘
FabricWater vapour permeability
WVT (g/m2h)
A20 138.417
A30 121.137
V20 179.406
V30 136.530
R20 189.137
R30 113.116
Table 10
and also the yield point, expresses fabric with thering-spun yarn in the weft direction. While the break-ing stress and extension and the yield point of fabricwith vortex yarn in the weft lie between the values ofring-spun yarn and air-jet yarn. That shows that thestructure of vortex yarn is close to the ring-spun yarnwith so-called ideal structure.Further the projecting fibres of air-jet and vortex yarninfluence on the air permeability and water vapourpermeability decrease in comparison with ring-spunyarn which has ideal structure and is produced usingtrue twist insertion. The structure of vortex yarn pre-
sents the combination of the structure of ring-spunyarn (wound sheath fibres) and air-jet yarn (two com-ponent structure with lower value of wound sheathfibres – only 5-percents). That is the main reason ofpermeability properties of vortex yarn with measuredpermeability values which are between the values ofring-spun and air-jet yarn.The research confirmed that woven fabrics with vor-tex yarn in weft significantly improve the mechanicaland permeability properties of fabrics in comparisonwith woven fabrics which incorporate air-jet yarn inthe weft.
95industria textila 2018, vol. 69, nr. 2˘
BIBLIOGRAPHY
[1] Lawrence, C.A. Fundamentals of spun yarn technology, In: London: CRC Press, 2003, 552 p.[2] Subhash, B.W., Barrie, F. Engineering fundamentals of ring spinning/twisting, over-end unwinding and two-for-one
twisting in textile processes, In: Lancaster: DEStech Publications, 2015, 186 p.[3] Tasnim N.S., Someshwar S.B. Engineering techniques of ring spinning, In: New Delhi: WPI Publishing, 2015, 223 p.[4] Lawrence, C.A. Advances in yarn spinning technology, In: Cambridge: The Textile Institute, 2010, 431 p.[5] Erdumlu, N., Ozipek, B., Oxenham, W. Vortex spinning technology, In: Textile Progress, vol. 44, no. 3-4, 2012.[6] Han, C., Xue, W., Cheng, L., Yao, J. Comparative analysis of traditional jet vortex spinning and self-twist jet vortex
spinning on yarn mechanism and yarn properties, In: Textile Research Journal, vol. 86, no. 16, 2016,pp. 1750–1758.
[7] Li, M., Yu, C., Shang, S. Effect of vortex tube structure on yarn quality in vortex spinning machine, In: Fibers andPolymers, vol. 15, no. 8, 2014, pp. 1786–1791.
[8] Pei, Z., Yu, S. Investigation on the dynamic behavior of the fiber in the vortex spinning nozzle and effects of somenozzle structure parameters, In: Journal of Engineered Fibers and Fabrics, vol. 6, no. 2, 2011, pp. 16–29.
[9] Zhong, Y.H., Ma, J.H., Xing, M.J. Fiber configuration of air jet vortex spinning yarns, In: Advanced MaterialsResearch, vol. 834–836, 2014, pp. 1784–1788.
[10] Basu, A. Progress in air-jet spinning, In: Textile Progress, vol. 29, no. 3, 1999, pp. 1–38.[11] Basal, G., Oxenham, W. Vortex spun yarn vs. Air-jet spun yarn, In: Autex Research Journal, vol. 3, no. 3, 2003,
pp. 96–101.[12] Ahmed, S., Syduzzaman, M., Mahmed, S., Ashique, S.M. Comparative study on ring, rotor and Air-jet spun yarn,
In: European Scientific Journal, vol.11, no.3, 2015, pp. 411–424.[13] Zeng, Y.C., Wan, Y.Q., Yu, C.W., He, J.H. Controlling the air vortex twist in air-jet spinning, In: Textile Research
Journal, vol. 75, no. 2, 2005, pp. 175–177.[14] Abdal, H.A., Hamdy, A.S., Khalil, K.A. Lim, L.H. A novel simple one-step air jet spinning approach for deposition of
poly(vinyl acetate)/hydroxyapatite composite nanofibers on Ti implants, In: Material Science Engineering, vol. 49,2015.
[15] Witczak, D., Golanski, J. Air flow in the air-jet false-twist spinning chamber, In: Fibres & Textiles In Eastern Europe,vol. 15, no. 3, 2007, pp. 45–48.
[16] Textiles – Tensile properties of fabrics – Part 1: Determination of maximum force and elongation at maximum forceusing the strip method, In: ISO 13934-1:2013, 12 p.
[17] Textiles – Determination of the permeability of fabrics to air, In: ISO 9037: 2011.[18] Standard Test Methods for Water Vapor Transmission of Materials”, In: ASTM E96/E96M: 2016, 14 p.[19] Vik, P. Regression, ANOVA, and the General Linear Model: A statistics primer, In: Sage Publication, 2014, 344 p.
Authors:
ŠAJN GORJANC DUNJA
GLAŽAR DOMINIKA
University of Ljubljana, Faculty of Natural Sciences and Engineering, Department of Textiles,
Graphic Arts and Design, Ljubljana, Slovenia, Snezniska 5, SI-1000 Ljubljana
Corresponding author:
ŠAJN GORJANC DUNJA
e-mail: [email protected]
INTRODUCTION
Till date, a lot of research work has been devoted tocomfort in automotive seating [1–2]. A seat is built inthree parts: a metal armature, foam injected in amatrix (cushion), and textile structures (fabric) whichcover the foam and armature. There are approxi-mately 3–5 kg car seat cover fabrics used in each car[3]. Car seat covers are often composed of severallayers of different materials, usually polyester fabric(or leather or synthetic leather) laminated topolyurethane foam (or 3D knitted spacer or nonwo-ven) backing by an adhesive. Each part of car seatcover brings different properties which affect boththeir durability and comfort in automotive seating.More recently, car producers increasingly put empha-sis on transport properties (heat, moisture, air) of carseat covers to ensure good physiological comfort ofdrivers. Therefore, the effect of heated seat on ther-mal comfort during the initial warm-up period, anergonomic evaluation of thermal comfort inside a car,measurement of sweating bottom and others wereinvestigated [2, 4–5]. Moisture management behaviour,thermal properties and air transport of 3D warp knit-ted spacer fabric (3D spacer) and polyurethane foam(PU foam), which are commonly used as padding incar seat cover, have been examined [6–9]. Thermalproperty of porous nonwoven materials was analysed
too [10]. Further, the effect of filament cross sectionon the performance of automotive upholstery fabricswas evaluated from air permeability point of view [11].Majority of researchers have reached the conclusionthat appropriate choice of middle layer of car seatcover can improve physiological comfort even incomplex car seats including PU cushion. But theycannot agree on whether PU foam or 3D spacer isbetter to be used as middle parts of car seat cover.One group of researchers prefer polyethylene tereph-thalate (PET) fibres for automotive application (bothfor top and middle layers) due to their superior prop-erties, like a high tenacity, abrasion, light, heat andchemical aging, UV resistance, dimensional stability,recyclability etc. [8, 11–12]. The others are in favourof modified PU foam (in middle layer) because oftheir excellent elasticity and very good recovery tocompression [12]. Study on comparison of quality fordifferent types of seat cover padding was carried outfrom aspects of physiological properties and relax-ation behaviour after static and dynamic loading [13].The result of this study showed that warp knittedspacer fabrics demonstrate better recovery to com-pression, better thermal properties and betterbreathability as compared to PU foam. The otherresearch found out that fabrics using monofilamentas spacer yarn generally have higher compression
Approach to evaluation of car seats fabrics performance
VIERA GLOMBIKOVA ANTONIN HAVELKAPETRA KOMARKOVA MARCELA KOLINOVA
REZUMAT – ABSTRACT
Evaluarea performanţei ţesăturilor pentru scaunele auto
Acest studiu investigează performanţa ţesăturilor pentru scaunele auto privind compresia, proprietăţile de recuperare şiconfortul fiziologic al statului pe scaun. Spuma poliuretanică, neţesutele şi ţesăturile tricotate 3D Spacer sunt utilizate înmod obişnuit pentru căptuşeala (în stratul intermediar) huselor pentru scaunele auto. Studiul prezintă o abordarealternativă pentru evaluarea eficienţei ţesăturilor pentru scaunele auto, şi anume comportamentul lor de compresie,variaţia în grosime la încărcarea dinamică, proprietăţile termice, rezistenţa la vapori de apă şi permeabilitatea la aer.Proprietăţile menţionate aparţin cerinţelor de bază în fabricarea scaunelor auto. Sistemul de micro-tomografie a fostutilizat pentru a obţine informaţii detaliate despre schimbarea structurii interne a probelor de ţesătură, înainte şi dupătestul de compresie.
Cuvinte-cheie: scaune auto, compresie, recuperare, rezistenţă termică, micro-tomografie
Approach to evaluation of car seats fabrics performance
This paper deals with investigating performance of car seat fabrics in terms of their compression and recovery proper-ties and physiological comfort of sitting. Polyurethane foam, nonwoven and 3D knitted spacer fabrics are commonlyused as padding (in middle layer) in car seats cover. The current work presents an alternative approach to evaluateeffectivity of car seat fabrics, namely their compression behaviour, variation in thickness under dynamic loading,thermal properties, water vapour resistance and air permeability. The above mentioned properties belong to basicrequirements in car seat manufacturing. Micro tomography system was used to obtain detailed information about changein internal structure of fabric samples, before and after compression test.
Keywords: car seats, compression, recovery, thermal resistance, micro tomography
96industria textila 2018, vol. 69, nr. 2˘
DOI: 10.35530/IT.069.02.1334
resistance than multifilament yarns [8, 14]. It is impor-tant to follow changing of inner structure of cover fab-ric under compression (caused by driver) to under-stand effect on transport properties. Nowadays microtomography analysis is an appropriate tool for it [15,16]. To evaluate the comprehensive effectivity of carseat cover, a combination of comfort and durabilitybehaviour must be investigated not only by tenacityand abrasion but also by studying mechanical stress-es which the seats are subjected to, during the life-time of the car. Major car manufacturers evaluatedegree of car seat durability, including relaxationbehaviour after cyclic loading by special equipment,which uses the robot – Occubot VI. Robot allowsrealistic simulation, of someone getting into and outof the seat (ingress/egress test), or of strong pulsa-tion or vibration during driving [17]. Occubot is notoften used for research in general because of highprice and narrow specialization of mentioned equip-ment. The current study is focused on complex evaluationof car seat fabrics in terms of their compressionbehaviour, thickness variation under dynamic load-ing, thermal properties, water vapour resistance,moisture management and air permeability. Further,the micro tomography system was used in order toobtain detailed information about change in innerstructure of seat fabrics before and after compressiontest.
EXPERIMENTAL DETAILS
Materials
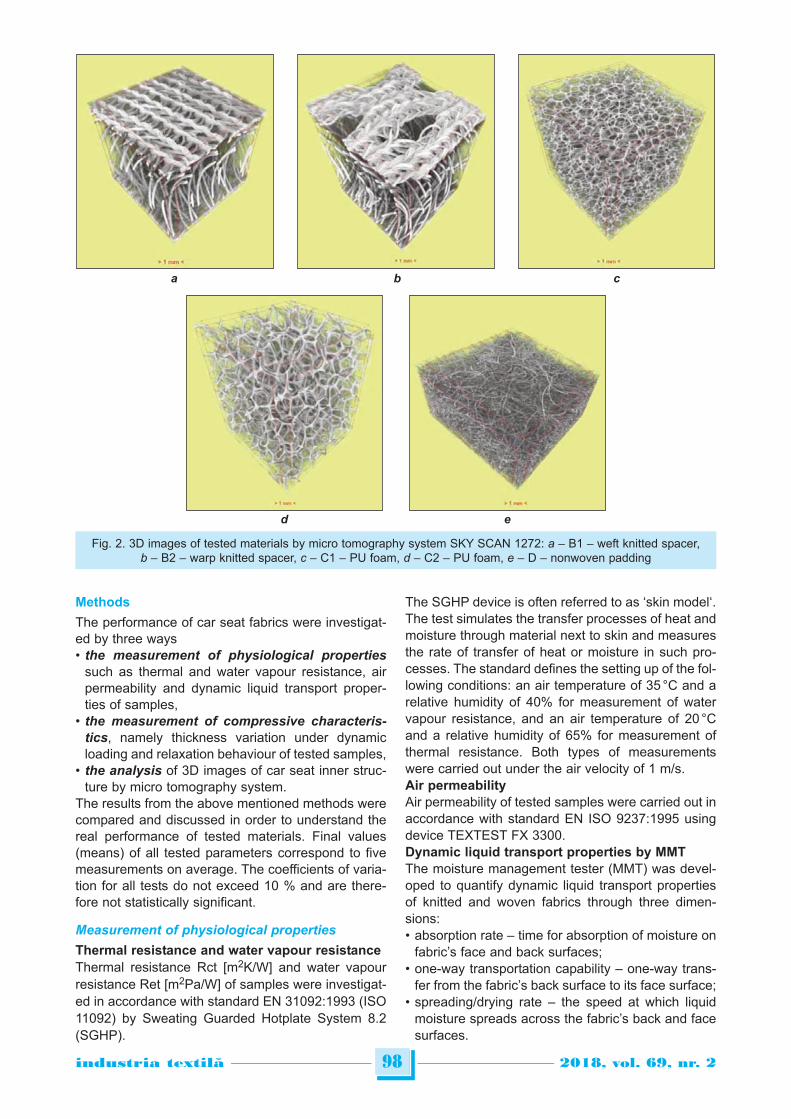
The experiment was divided into three steps. In thefirst step, six fabrics for car seats (group of the threedifferent types of functional PES fibres in top layer oftested car seats in combination with different middlelayers – polyurethane foam, nonwoven and 3D spac-er), were analysed and compared in terms of theirphysiological behaviour. Second part was focused toinvestigation of thickness variation of tested fabricsunder dynamic loading and their ability to recover com-pression. The third part of study was about change ininternal structure of fabrics before and after dynamiccompressive test by micro tomography system. Thelast two tests mentioned, were done with middle layerof car seat cover only. Tested materials were designedin order to understand the role of middle layer of tex-tile sandwich car seats in their durability and physio-logical behaviour. Basic characteristics of all testedcar seat fabrics are shown in table 1. SEM images offibres used in weft and warp yarns from top layer oftested car seats (PES woven fabric) are shown infigure 1 and 3D images of tested materials by microtomography system SKY SCAN 1272, are shown infigure 2. Before being tested, the samples had beenwashed and conditioned for 24 hours. The measure-ment was carried out in an air-conditioned roomunder constant relative humidity of 65 % and the tem-perature of 21°C.
97industria textila 2018, vol. 69, nr. 2˘
BASIC CHARACTERISTICS OF TESTED MATERIALS
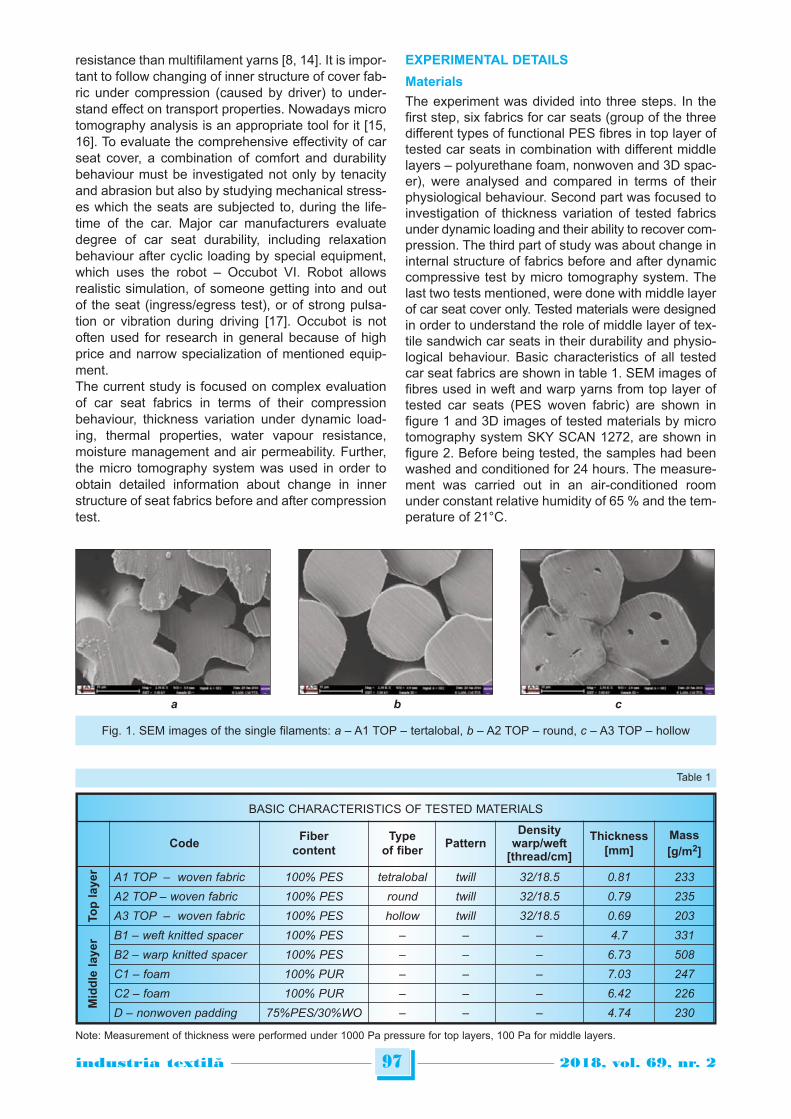
CodeFiber
contentType
of fiberPattern
Densitywarp/weft
[thread/cm]
Thickness[mm]
Mass
[g/m2]
To
p l
ayer A1 TOP – woven fabric 100% PES tetralobal twill 32/18.5 0.81 233
A2 TOP – woven fabric 100% PES round twill 32/18.5 0.79 235
A3 TOP – woven fabric 100% PES hollow twill 32/18.5 0.69 203
Mid
dle
laye
r B1 – weft knitted spacer 100% PES – – – 4.7 331
B2 – warp knitted spacer 100% PES – – – 6.73 508
C1 – foam 100% PUR – – – 7.03 247
C2 – foam 100% PUR – – – 6.42 226
D – nonwoven padding 75%PES/30%WO – – – 4.74 230
Table 1
Note: Measurement of thickness were performed under 1000 Pa pressure for top layers, 100 Pa for middle layers.
Fig. 1. SEM images of the single filaments: a – A1 TOP – tertalobal, b – A2 TOP – round, c – A3 TOP – hollow
a b c
Methods
The performance of car seat fabrics were investigat-ed by three ways• the measurement of physiological properties
such as thermal and water vapour resistance, airpermeability and dynamic liquid transport proper-ties of samples,
• the measurement of compressive characteris-
tics, namely thickness variation under dynamicloading and relaxation behaviour of tested samples,
• the analysis of 3D images of car seat inner struc-ture by micro tomography system.
The results from the above mentioned methods werecompared and discussed in order to understand thereal performance of tested materials. Final values(means) of all tested parameters correspond to fivemeasurements on average. The coefficients of varia-tion for all tests do not exceed 10 % and are there-fore not statistically significant.
Measurement of physiological properties
Thermal resistance and water vapour resistanceThermal resistance Rct [m2K/W] and water vapourresistance Ret [m2Pa/W] of samples were investigat-ed in accordance with standard EN 31092:1993 (ISO11092) by Sweating Guarded Hotplate System 8.2(SGHP).
The SGHP device is often referred to as ‘skin model‘.The test simulates the transfer processes of heat andmoisture through material next to skin and measuresthe rate of transfer of heat or moisture in such pro-cesses. The standard defines the setting up of the fol-lowing conditions: an air temperature of 35 °C and arelative humidity of 40% for measurement of watervapour resistance, and an air temperature of 20 °Cand a relative humidity of 65% for measurement ofthermal resistance. Both types of measurementswere carried out under the air velocity of 1 m/s.Air permeabilityAir permeability of tested samples were carried out inaccordance with standard EN ISO 9237:1995 usingdevice TEXTEST FX 3300.Dynamic liquid transport properties by MMT The moisture management tester (MMT) was devel-oped to quantify dynamic liquid transport propertiesof knitted and woven fabrics through three dimen-sions:• absorption rate – time for absorption of moisture on
fabric’s face and back surfaces;• one-way transportation capability – one-way trans-
fer from the fabric’s back surface to its face surface;• spreading/drying rate – the speed at which liquid
moisture spreads across the fabric’s back and facesurfaces.
98industria textila 2018, vol. 69, nr. 2˘
Fig. 2. 3D images of tested materials by micro tomography system SKY SCAN 1272: a – B1 – weft knitted spacer,b – B2 – warp knitted spacer, c – C1 – PU foam, d – C2 – PU foam, e – D – nonwoven padding
d e
a b c
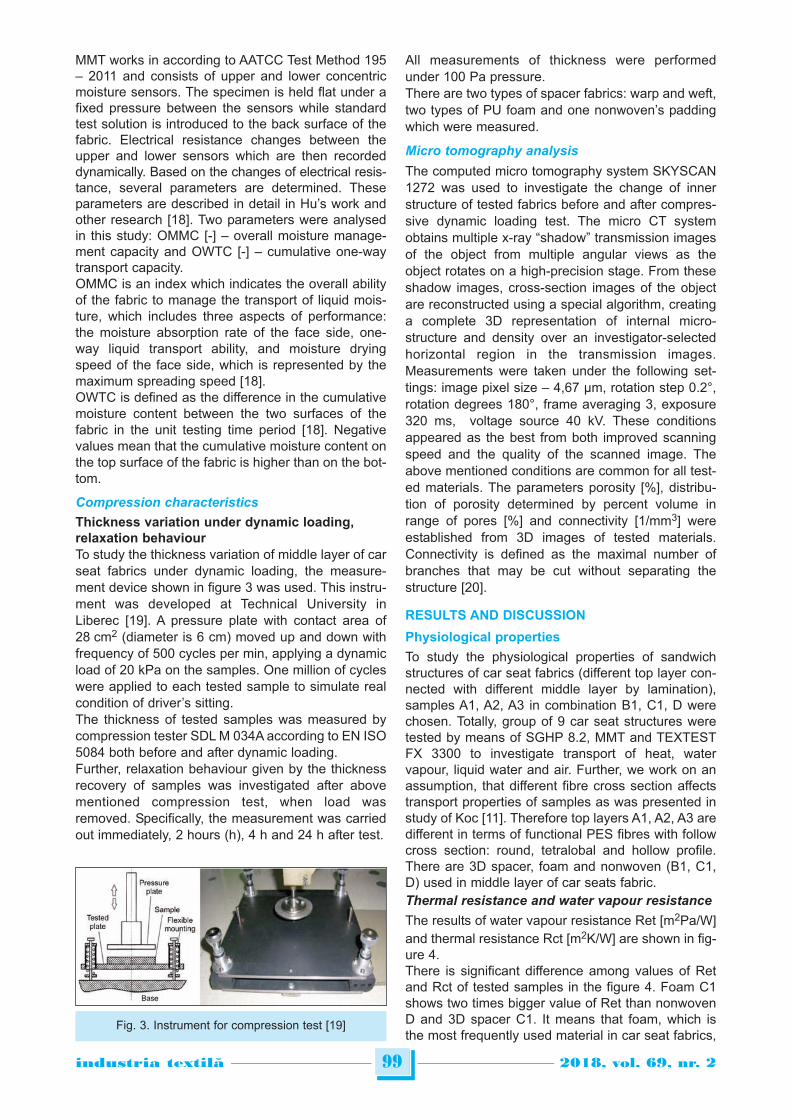
MMT works in according to AATCC Test Method 195– 2011 and consists of upper and lower concentricmoisture sensors. The specimen is held flat under afixed pressure between the sensors while standardtest solution is introduced to the back surface of thefabric. Electrical resistance changes between theupper and lower sensors which are then recordeddynamically. Based on the changes of electrical resis-tance, several parameters are determined. Theseparameters are described in detail in Hu’s work andother research [18]. Two parameters were analysedin this study: OMMC [-] – overall moisture manage-ment capacity and OWTC [-] – cumulative one-waytransport capacity.OMMC is an index which indicates the overall abilityof the fabric to manage the transport of liquid mois-ture, which includes three aspects of performance:the moisture absorption rate of the face side, one-way liquid transport ability, and moisture dryingspeed of the face side, which is represented by themaximum spreading speed [18]. OWTC is defined as the difference in the cumulativemoisture content between the two surfaces of thefabric in the unit testing time period [18]. Negativevalues mean that the cumulative moisture content onthe top surface of the fabric is higher than on the bot-tom.
Compression characteristics
Thickness variation under dynamic loading,relaxation behaviourTo study the thickness variation of middle layer of carseat fabrics under dynamic loading, the measure-ment device shown in figure 3 was used. This instru-ment was developed at Technical University inLiberec [19]. A pressure plate with contact area of28 cm2 (diameter is 6 cm) moved up and down withfrequency of 500 cycles per min, applying a dynamicload of 20 kPa on the samples. One million of cycleswere applied to each tested sample to simulate realcondition of driver’s sitting. The thickness of tested samples was measured bycompression tester SDL M 034A according to EN ISO5084 both before and after dynamic loading. Further, relaxation behaviour given by the thicknessrecovery of samples was investigated after abovementioned compression test, when load wasremoved. Specifically, the measurement was carriedout immediately, 2 hours (h), 4 h and 24 h after test.
All measurements of thickness were performedunder 100 Pa pressure.There are two types of spacer fabrics: warp and weft,two types of PU foam and one nonwoven’s paddingwhich were measured.
Micro tomography analysis
The computed micro tomography system SKYSCAN1272 was used to investigate the change of innerstructure of tested fabrics before and after compres-sive dynamic loading test. The micro CT systemobtains multiple x-ray “shadow” transmission imagesof the object from multiple angular views as theobject rotates on a high-precision stage. From theseshadow images, cross-section images of the objectare reconstructed using a special algorithm, creatinga complete 3D representation of internal micro-structure and density over an investigator-selectedhorizontal region in the transmission images.Measurements were taken under the following set-tings: image pixel size – 4,67 µm, rotation step 0.2°,rotation degrees 180°, frame averaging 3, exposure320 ms, voltage source 40 kV. These conditionsappeared as the best from both improved scanningspeed and the quality of the scanned image. Theabove mentioned conditions are common for all test-ed materials. The parameters porosity [%], distribu-tion of porosity determined by percent volume inrange of pores [%] and connectivity [1/mm3] wereestablished from 3D images of tested materials.Connectivity is defined as the maximal number ofbranches that may be cut without separating thestructure [20].
RESULTS AND DISCUSSION
Physiological properties
To study the physiological properties of sandwichstructures of car seat fabrics (different top layer con-nected with different middle layer by lamination),samples A1, A2, A3 in combination B1, C1, D werechosen. Totally, group of 9 car seat structures weretested by means of SGHP 8.2, MMT and TEXTESTFX 3300 to investigate transport of heat, watervapour, liquid water and air. Further, we work on anassumption, that different fibre cross section affectstransport properties of samples as was presented instudy of Koc [11]. Therefore top layers A1, A2, A3 aredifferent in terms of functional PES fibres with followcross section: round, tetralobal and hollow profile.There are 3D spacer, foam and nonwoven (B1, C1,D) used in middle layer of car seats fabric.Thermal resistance and water vapour resistance
The results of water vapour resistance Ret [m2Pa/W]and thermal resistance Rct [m2K/W] are shown in fig-ure 4. There is significant difference among values of Retand Rct of tested samples in the figure 4. Foam C1shows two times bigger value of Ret than nonwovenD and 3D spacer C1. It means that foam, which isthe most frequently used material in car seat fabrics,
99industria textila 2018, vol. 69, nr. 2˘
Fig. 3. Instrument for compression test [19]
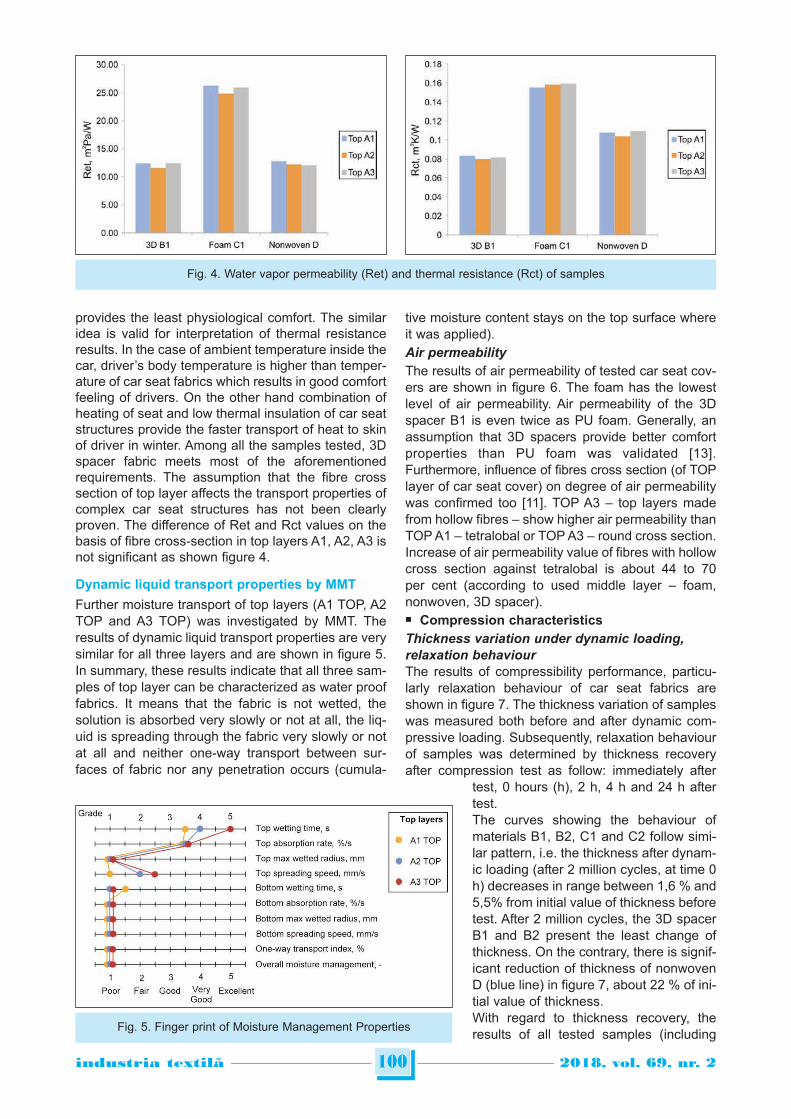
provides the least physiological comfort. The similaridea is valid for interpretation of thermal resistanceresults. In the case of ambient temperature inside thecar, driver’s body temperature is higher than temper-ature of car seat fabrics which results in good comfortfeeling of drivers. On the other hand combination ofheating of seat and low thermal insulation of car seatstructures provide the faster transport of heat to skinof driver in winter. Among all the samples tested, 3Dspacer fabric meets most of the aforementionedrequirements. The assumption that the fibre crosssection of top layer affects the transport properties ofcomplex car seat structures has not been clearlyproven. The difference of Ret and Rct values on thebasis of fibre cross-section in top layers A1, A2, A3 isnot significant as shown figure 4.
Dynamic liquid transport properties by MMT
Further moisture transport of top layers (A1 TOP, A2TOP and A3 TOP) was investigated by MMT. Theresults of dynamic liquid transport properties are verysimilar for all three layers and are shown in figure 5.In summary, these results indicate that all three sam-ples of top layer can be characterized as water prooffabrics. It means that the fabric is not wetted, thesolution is absorbed very slowly or not at all, the liq-uid is spreading through the fabric very slowly or notat all and neither one-way transport between sur-faces of fabric nor any penetration occurs (cumula-
tive moisture content stays on the top surface whereit was applied). Air permeability
The results of air permeability of tested car seat cov-ers are shown in figure 6. The foam has the lowestlevel of air permeability. Air permeability of the 3Dspacer B1 is even twice as PU foam. Generally, anassumption that 3D spacers provide better comfortproperties than PU foam was validated [13].Furthermore, influence of fibres cross section (of TOPlayer of car seat cover) on degree of air permeabilitywas confirmed too [11]. TOP A3 – top layers madefrom hollow fibres – show higher air permeability thanTOP A1 – tetralobal or TOP A3 – round cross section.Increase of air permeability value of fibres with hollowcross section against tetralobal is about 44 to 70per cent (according to used middle layer – foam,nonwoven, 3D spacer). ■ Compression characteristics
Thickness variation under dynamic loading,
relaxation behaviour
The results of compressibility performance, particu-larly relaxation behaviour of car seat fabrics areshown in figure 7. The thickness variation of sampleswas measured both before and after dynamic com-pressive loading. Subsequently, relaxation behaviourof samples was determined by thickness recoveryafter compression test as follow: immediately after
test, 0 hours (h), 2 h, 4 h and 24 h aftertest. The curves showing the behaviour ofmaterials B1, B2, C1 and C2 follow simi-lar pattern, i.e. the thickness after dynam-ic loading (after 2 million cycles, at time 0h) decreases in range between 1,6 % and5,5% from initial value of thickness beforetest. After 2 million cycles, the 3D spacerB1 and B2 present the least change ofthickness. On the contrary, there is signif-icant reduction of thickness of nonwovenD (blue line) in figure 7, about 22 % of ini-tial value of thickness. With regard to thickness recovery, theresults of all tested samples (including
100industria textila 2018, vol. 69, nr. 2˘
Fig. 4. Water vapor permeability (Ret) and thermal resistance (Rct) of samples
Fig. 5. Finger print of Moisture Management Properties
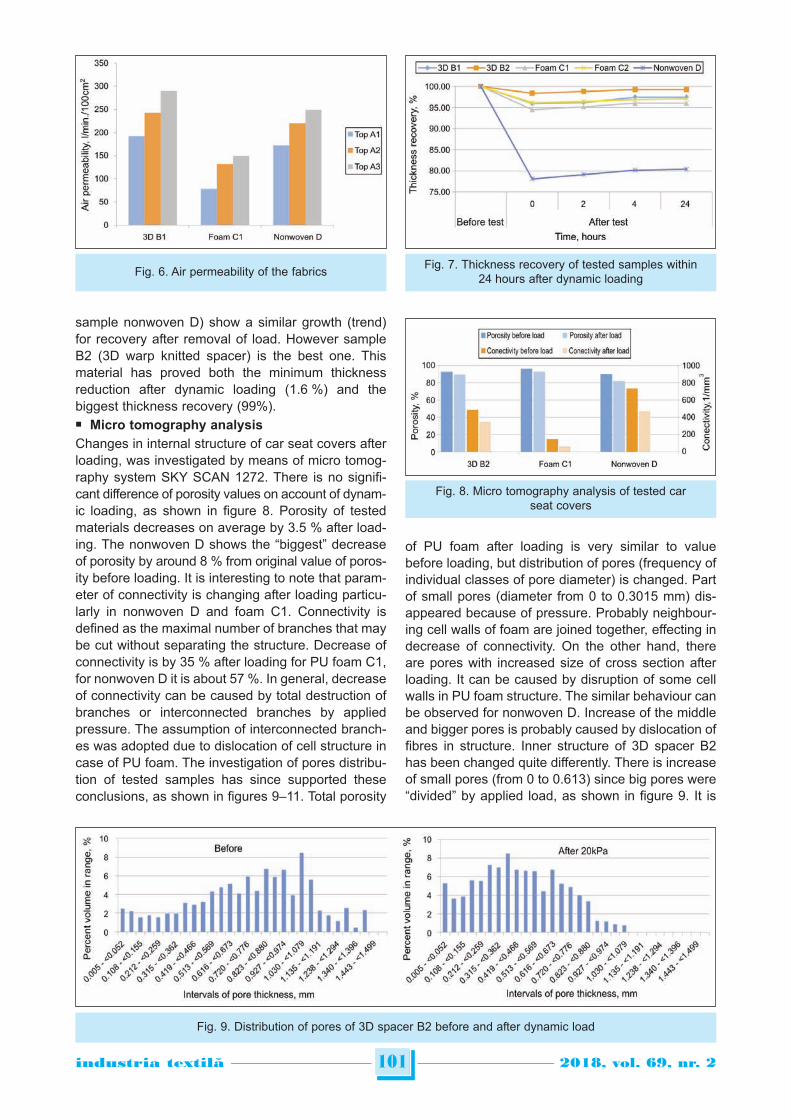
sample nonwoven D) show a similar growth (trend)for recovery after removal of load. However sampleB2 (3D warp knitted spacer) is the best one. Thismaterial has proved both the minimum thicknessreduction after dynamic loading (1.6 %) and thebiggest thickness recovery (99%). ■ Micro tomography analysis
Changes in internal structure of car seat covers afterloading, was investigated by means of micro tomog-raphy system SKY SCAN 1272. There is no signifi-cant difference of porosity values on account of dynam-ic loading, as shown in figure 8. Porosity of testedmaterials decreases on average by 3.5 % after load-ing. The nonwoven D shows the “biggest” decreaseof porosity by around 8 % from original value of poros-ity before loading. It is interesting to note that param-eter of connectivity is changing after loading particu-larly in nonwoven D and foam C1. Connectivity isdefined as the maximal number of branches that maybe cut without separating the structure. Decrease ofconnectivity is by 35 % after loading for PU foam C1,for nonwoven D it is about 57 %. In general, decreaseof connectivity can be caused by total destruction ofbranches or interconnected branches by appliedpressure. The assumption of interconnected branch-es was adopted due to dislocation of cell structure incase of PU foam. The investigation of pores distribu-tion of tested samples has since supported theseconclusions, as shown in figures 9–11. Total porosity
of PU foam after loading is very similar to valuebefore loading, but distribution of pores (frequency ofindividual classes of pore diameter) is changed. Partof small pores (diameter from 0 to 0.3015 mm) dis-appeared because of pressure. Probably neighbour-ing cell walls of foam are joined together, effecting indecrease of connectivity. On the other hand, thereare pores with increased size of cross section afterloading. It can be caused by disruption of some cellwalls in PU foam structure. The similar behaviour canbe observed for nonwoven D. Increase of the middleand bigger pores is probably caused by dislocation offibres in structure. Inner structure of 3D spacer B2has been changed quite differently. There is increaseof small pores (from 0 to 0.613) since big pores were“divided” by applied load, as shown in figure 9. It is
101industria textila 2018, vol. 69, nr. 2˘
Fig. 6. Air permeability of the fabricsFig. 7. Thickness recovery of tested samples within
24 hours after dynamic loading
Fig. 8. Micro tomography analysis of tested carseat covers
Fig. 9. Distribution of pores of 3D spacer B2 before and after dynamic load
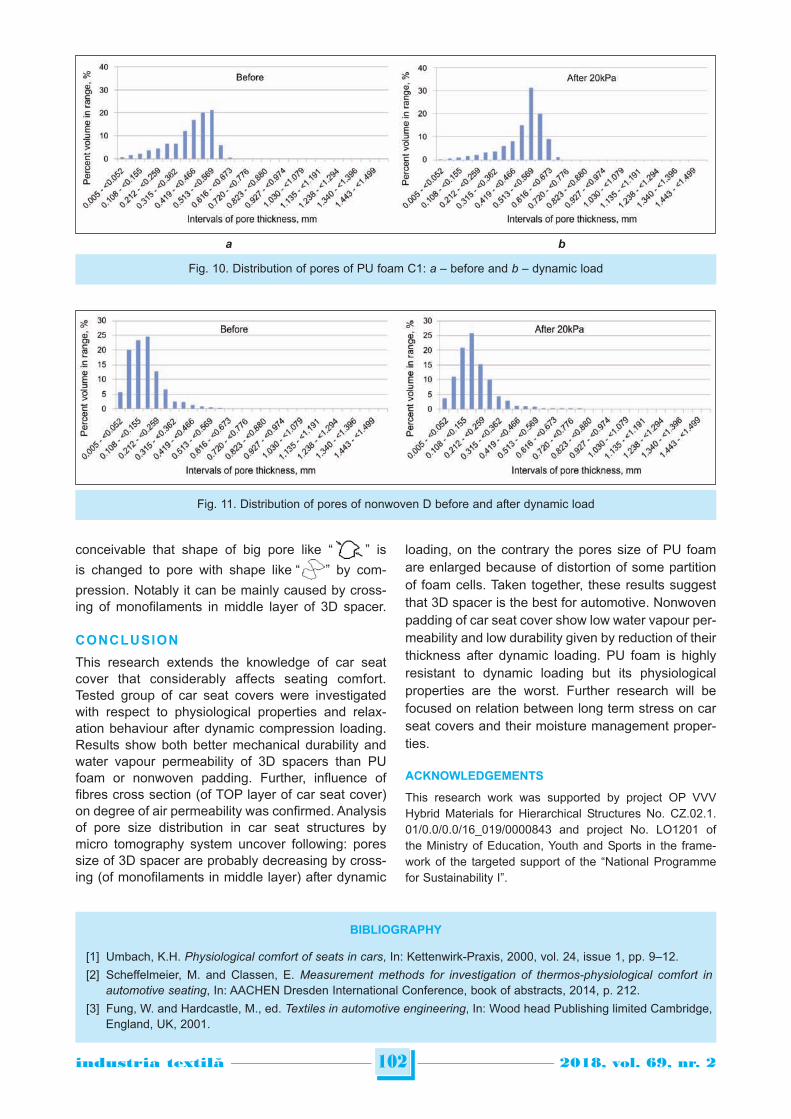
conceivable that shape of big pore like “ ” is
is changed to pore with shape like “ ” by com-
pression. Notably it can be mainly caused by cross-ing of monofilaments in middle layer of 3D spacer.
CONCLUSION
This research extends the knowledge of car seatcover that considerably affects seating comfort.Tested group of car seat covers were investigatedwith respect to physiological properties and relax-ation behaviour after dynamic compression loading.Results show both better mechanical durability andwater vapour permeability of 3D spacers than PUfoam or nonwoven padding. Further, influence offibres cross section (of TOP layer of car seat cover)on degree of air permeability was confirmed. Analysisof pore size distribution in car seat structures bymicro tomography system uncover following: poressize of 3D spacer are probably decreasing by cross-ing (of monofilaments in middle layer) after dynamic
loading, on the contrary the pores size of PU foamare enlarged because of distortion of some partitionof foam cells. Taken together, these results suggestthat 3D spacer is the best for automotive. Nonwovenpadding of car seat cover show low water vapour per-meability and low durability given by reduction of theirthickness after dynamic loading. PU foam is highlyresistant to dynamic loading but its physiologicalproperties are the worst. Further research will befocused on relation between long term stress on carseat covers and their moisture management proper-ties.
ACKNOWLEDGEMENTS
This research work was supported by project OP VVVHybrid Materials for Hierarchical Structures No. CZ.02.1.01/0.0/0.0/16_019/0000843 and project No. LO1201 ofthe Ministry of Education, Youth and Sports in the frame-work of the targeted support of the “National Programmefor Sustainability I”.
102industria textila 2018, vol. 69, nr. 2˘
Fig. 11. Distribution of pores of nonwoven D before and after dynamic load
Fig. 10. Distribution of pores of PU foam C1: a – before and b – dynamic load
a b
BIBLIOGRAPHY
[1] Umbach, K.H. Physiological comfort of seats in cars, In: Kettenwirk-Praxis, 2000, vol. 24, issue 1, pp. 9–12.
[2] Scheffelmeier, M. and Classen, E. Measurement methods for investigation of thermos-physiological comfort inautomotive seating, In: AACHEN Dresden International Conference, book of abstracts, 2014, p. 212.
[3] Fung, W. and Hardcastle, M., ed. Textiles in automotive engineering, In: Wood head Publishing limited Cambridge,England, UK, 2001.
103industria textila 2018, vol. 69, nr. 2˘
[4] Oi, H., Tabata, K., Naka, Y., Takeda, A. and Tochihara, Y. Effect of heated seats in vehicles on thermal comfort duringthe initila warm-up period, In: Applied Ergonomic, 2012, vol. 43, issue 2, pp. 360–367.
[5] Cengiz, T.G. and Babalik, F.C. An on the road experiment into the thermal comfort of car seats, In: AppliedErgonomics. 2007, vol. 38, issue 3, pp. 337–347.
[6] Rothe, D., Warp knitted spacer fabric – design and application fields, In: Knitting Technology. 2001, vol. 4,pp. 14–16.
[7] Bagherzadeh, R., Gorji, M., Latifi, M., Payvandy, P. and Kong, L.X., Evaluation of moisture management behaviourof high-wicking 3D warp knitted spacer fabric, In: Fibers and Polymers. 2012, vol. 13, issue 4, pp. 529–534.
[8] Yip, J. and Ng., S.P. Study of three-dimensional spacer fabrics: Physical and mechanical properties, In: Journal ofmaterials processing technology, 2008, vol. 206, pp. 359–364.
[9] Havelka, A., Glombikova V. and Mazari, F.B. Monitoring thermophysiological comfort in the interlayer between driverand the carseat, In: Vlákna a textile. 2015, vol. 22, issue 3/4, pp. 40–45.
[10] Zhu, G., Kremenakova, D., Wang, Y., Militky, J. and Mishra, R., Study on the thermal property of highly porousnovwoven fabrics, In: Industria Textila. 2015, vol. 66, issue 2, pp. 74–79.
[11] Koc, K. S., Mecit, D., Bozaci B., Ornek, M. and Hockenberger, A., Effect of filament cross section on theperformance of automotive upholstery fabric, In: Journal of Industrial Textiles. 2015, DOI: 10.1177/1528083715598652, pp. 1–15.
[12] Jerkovic, I., Pallares, J.M. and Capdevila, X. Study of the abrasion resistance in the upholstery of automobile seats,In: Autex Research Journal, 2010, vol. 10, issue 1, pp. 14–20.
[13] Ye, X., Fangueiro, R., Hu, H. and Araujo, M. Application of warp – knitted spacer fabrics in car seats, In: Journal ofthe Textile Institute, 2007, vol. 98, issue 4, pp. 337–343.
[14] Chen, S. and Long, H.R. Investigation on compression properties of polyurethane –based warp-knited spacer fabriccomposites for cushioning applications, Part II. Theoretical and experimental verification, In: Industria Textila, 2014,vol. 65, issue 6, pp. 340–344.
[15] Stämpfli, R. Brühwiler P.A., Rechsteiner, I., Meyer, V.R. and Rossi, R.M. Xray tomographic investigation of waterdistribution in textiles under compression – possibilities for data presentation, In: Measurement. 2013, vol. 46, issue3, pp. 1212–1229
[16] Doczyova, K., Glombikova, V. and Komarkova, P. Application of microtomography in textile metrology, In: Tekstilec.2014, vol. 57, issue 1, pp. 4–11.
[17] Stewart, R., O’Bannon, T., Müller, M. and Beeh, F. Creating the next generation ingress/egress robot, In: SAETechnical Paper 1999-01-0628, 1999, doi:10.4271/1999-01-0628.
[18] Hu, J., Li, Y., Wong, A. S. W. and Xu, W. Moisture management tester: A method to characterize fabric liquidmoisture management, In: Textile Research Journal, 2005, vol. 75, issue 1, pp. 57–62.
[19] Havelka, A. and Kus, Z. Device for fatigue testing of textiles and multilayer textile composites, national utility modelapplication: 2014, Application number: 2014-30445, Registration number: 28065 http://spisy.upv.cz/UtilityModels/FullDocuments/FDUM0028/uv028065.pdf
[20] Odgaard, A. Three-dimensional methods for quantification of cancellous bone architecture, In: Bone, 1997, vol. 20,issue 4, pp. 315–328.
Authors:
VIERA GLOMBIKOVA1
PETRA KOMARKOVA1
ANTONIN HAVELKA1
MARCELA KOLINOVA2
1Technical University of Liberec, Faculty of Textile Engineering, Department of Clothing Technology,
Studentska 1402/2, Liberec, Czech Republic, phone: +4204853543201, fax: +420485353204
2Technical University of Liberec, Institute for Nanomaterials, Advanced Technology and Innovation,
Bendlova 1409/7,Liberec, Czech Republic, phone: +420 485 353 865, fax: +420485353204
Corresponding author:
VIERA [email protected]
INTRODUCTION
Natural dyes are known as sustainable and environ-mentally friendly materials for dyeing and functionalfinishing of textiles [1]. They can be obtained fromvegetable, animal or mineral origin [2]. Several stud-ies have been reported on application of different nat-ural dyes on textile fibers. Barberry tree root, cuminseeds, grape leaves and pomace, red cabbage, milk-weed leave, Achilleapachycephala flowers, almondshell, pomegranate rinds and wastewater of olive oilproduction are examples of new sources of naturaldyes which have been studied in recent years [3–17].Despite several advantages associated with the useof natural dyes in dyeing textile goods, there is agreat need for optimization of natural dyeing pro-cesses to fulfill the equipments of today’s industry. Metal mordants are commonly used in order toincrease the uptake and fastness of natural dyes ontextile fibers and obtain different shades using a sin-gle dye [18]. However, most of metal mordants causeenvironmental problems as well as health concernsfor the consumers [19]. Natural dyeing plants usuallyposses low color yield and require prolonged time todye textiles satisfactorily. Several pretreatments likecationization, plasma treatment, enzyme treatment,gamma treatment, and microwave treatment are
examples of techniques which have been studied toovercome this drawback [7, 10, 20–24]. To minimizethe consumption of energy, dye, mordant, and auxil-iaries besides decreasing the required time, whilegaining the highest dyebath exhaustion, optimizationof the dyeing process is really important [25].In the traditional method for optimization of process-es, experiments are first performed and the mea-sured data is analyzed afterwards. This approachexamines one variable at a time and is time and workdemanding and the effect of interactions between dif-ferent factors is not taken into account [26]. In con-trast to this, in statistical methods, the experimentaldesign is planned and sets of well selected experi-ments are performed to get the most informativecombination out of the assumed factors with the min-imum number of experiments. Response surfacemethodology (RSM) offers design of experiment (DOE)tools that lead to refined optimization approachesand process performance at minimal cost [27].D-optimal designs create the optimal set of experi-ments on the basisof a computer-aided exchangeprocedure. This method selects the best combinationof experimental trials within the limitations providedand provides maximum accuracy in estimating regres-sion coefficients. The optimality criterion results in
The use of D-optimal design in optimization of wool dyeing withJuglansregia bark
AMINODDIN HAJI MAJID NASIRIBOROUMANDS. SADRODDIN QAVAMNIA
REZUMAT – ABSTRACT
Utilizarea modelului D-optimal în optimizarea vopsirii lânii cu coaja de Juglansregia
În acest studiu, fibrele de lână au fost vopsite folosind coaja de Juglansregia ca o nouă sursă de colorant natural.Alaunul a fost utilizat ca mordant. Metodologia de suprafaţă a răspunsului şi modelul D-optimal au fost utilizate pentrustudierea şi optimizarea procedeului de vopsire, cu scopul de a obţine intensitatea maximă a culorii după vopsirea cuextractul apos de coajă de Juglansregia. Rezultatele au arătat că intensitatea culorii fibrelor vopsite a crescut princreşterea timpului de vopsire şi a temperaturii şi a scăzut prin creşterea valorii pH-ului băii de vopsire. A existat o valoareoptimă de aproximativ 6% owf pentru concentraţia de mordant. Condiţia optimă pentru obţinerea intensităţii maxime aculorii a fost următoarea: pH-ul băii de vopsire: 6, concentraţia de alaun: 6,24% owf, temperatura de vopsire: 90 °C şitimpul de vopsire: 90 min.
Cuvinte-cheie: mordant, colorant natural, lână, optimizare, RSM
The use of D-optimal design in optimization of wool dyeing with Juglansregia bark
In this study, wool fibers were dyed using the Juglansregiabark as a new source of natural dye. Alum was used asmordant. Response surface methodology and D-optimal design were employed to study and optimize the dyeingprocedure with the aim of obtaining the maximum color value after dyeing with aqueous extract of Juglansregiabark. Theresults showed that the color value of the dyed fibers was increased by increasing the dyeing time and temperature anddecreased by increasing the dyebath pH value. There was an optimum value of around 6 % owf for mordantconcentration. The optimal condition for obtaining the highest color value was as follows: dyebath pH: 6, alumconcentration: 6.24 % owf, dyeing temperature: 90 ºC, and dyeing time: 90 min.
Keywords: mordant, natural dye, wool, optimization, RSM
104industria textila 2018, vol. 69, nr. 2˘
DOI: 10.35530/IT.069.02.1509
minimizing the generalized variance of the parameterestimates for a pre-specified model [28–29].Juglansregia is a tree native to central Asia and canbe found in several countries all over the world. Manyparts of this tree including green walnuts, shells,seed, bark, and leaves are used in the pharmaceuti-cal and cosmetic industry. The bark of this tree isused as a toothbrush and a dye for coloring the lipsfor makeup purpose is some parts of south of Iran. Itcontains several phenolic compounds namely, b-sitos-terol, juglone, folic acid, gallic acid, regiolone, andquercetin-3-a-L-arabinoside [30–31]. In this study, the bark of Juglansregiatree was cho-sen as a new source of natural dye for coloration ofwool fibers. Four independent factors including mor-dant concentration, dyebath pH, and temperaturebesides the dyeing time were selected as the mostinfluencing factors according to preliminary experi-ments. To find out the optimum conditions for dyeingprocedure, D-optimal design was used and the effectof dyeing process factors on the color value of thedyed samples was determined.
EXPERIMENTAL WORK
Materials and methods
Pure wool fabric (plain weave, 250 g/m2) was pur-chased from Iran Merinos Textile Company, Iran, andused for the experiments after scouring and drying(1% non-ionic detergent (Triton X-100, Sigma-Aldrich, USA), 50 °C, for 30 min). All other chemicalsused in this study were analytical grade reagentsobtained from Merck, Germany.Juglansregia bark was washed with tap water, driedand then powdered. 100 g of powder was used forpreparation of 1 liter of the original dye solution.Distilled water was used for this purpose and boilingwas continued for 2 h and then the solution was fil-tered. The concentration of the prepared solution is10 % W/V.Experimental Design: The formulation of experimentsand statistical analysis of responses were performedusing Design Expert software (version 7.0). In thisstudy, the most influencing operating factors of thenatural dyeing process were optimized usingresponse surface methodology (RSM) and D-optimaldesign. The practically feasible ranges for each fac-tor were determined by preliminary studies beforedesigning the experiments. Table 1 presents the cor-responding codes besides lower and higher valuesfor each variable.
A total number of 25 experiments were proposed bythe software. P-value with 95% confidence level wasconsidered for the selection or rejection of the modelterms. To analyze the results, ANOVA was employed.Response surfaces were drawn to determine theindividual and interactive effects of the process vari-ables on the color value of dyed samples.Mordanting: The mordanting bath was prepared usingthe required amount of alum (aluminum potassiumsulfate) according to the experimental design andacetic acid was used for adjustment of pH at 5. Theliquor to goods ratio (L:G) was 50:1 and the mor-danting was done at boil for 1 h.Dyeing: Dyeing of the samples was performed using50% owf of the natural dye(L:G= 40:1, pH=4–8). Thedyeing was started at 40 °C and the temperature wasraised to the final temperature at the rate of 2 °C perminute. Then the samples remained in that conditionfor the predefined time according to the experimentaldesign, and then rinsed and air dried.Color value measurements: the reflectance of dyedsamples were measured on a Color-eye 7000A spec-trophotometer using illuminant D65 and 10° standardobserver. Color strength (K/S) of each dyed samplewas calculated using kubelka-munk equation foreach wavelength ranging between 360–740 nm:
K/S = (1 – R)2 / 2R (1)
Where R is the observed reflectance, K – the absorp-tion coefficient and S – the light scattering coefficient.For better comparison of the samples in the full rangeof the visible spectrum, the sum of color strengthsmeasured at all wavelengths (color value sum orCVsum) was calculated and considered for further
analysis.
740CVsum = (K/S) (2)360
RESULTS AND DISCUSSION
Model fitting and statistical analysis
The experimental conditions and color values(CVsum) of the woolen fabric samples dyed with 50 %owf of natural dye are shown in table 2. The dataobtained from the colorimetric analysis of the dyedsamples were fitted to various models. ANOVAresults of fitting different models to the obtained dataare shown in table 3. The quadratic model was themost suitable model for describing this process. Theanalysis of variance was used for measuring up thesignificance of the effect of the dyeing process vari-ables and their interactions on the CVsum as theresponse. A P-value less than 0.05 was consideredas a sign which confirms that the model and theterms are statistically significant. In case that manyinsignificant model terms are found, model reductionwhich means the elimination of the insignificant fac-tors from the model can improve the final model. Inthis study, model reduction was performed by thesoftware and some insignificant interactions of thevariables having P-values higher than 0.05 wereeliminated.
105industria textila 2018, vol. 69, nr. 2˘
EXPERIMENTAL RANGES OF FACTORS
Factor Name Unit Low level High level
A Dyeing pH - 4 8
BMordant concentration % owf 0 10
CDyeing temperature ºC 50 90
D Dyeing time min 30 90
Table 1
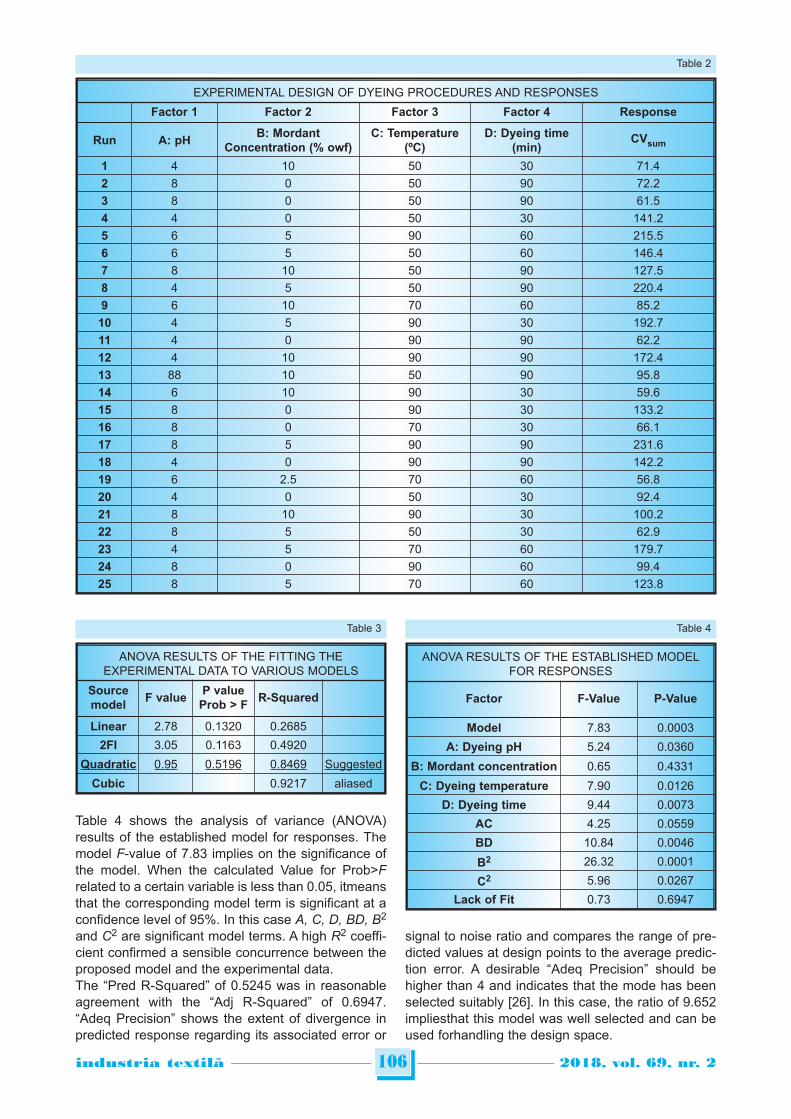
Table 4 shows the analysis of variance (ANOVA)results of the established model for responses. Themodel F-value of 7.83 implies on the significance ofthe model. When the calculated Value for Prob>Frelated to a certain variable is less than 0.05, itmeansthat the corresponding model term is significant at aconfidence level of 95%. In this case A, C, D, BD, B2
and C2 are significant model terms. A high R2 coeffi-cient confirmed a sensible concurrence between theproposed model and the experimental data.The “Pred R-Squared” of 0.5245 was in reasonableagreement with the “Adj R-Squared” of 0.6947.“Adeq Precision” shows the extent of divergence inpredicted response regarding its associated error or
signal to noise ratio and compares the range of pre-dicted values at design points to the average predic-tion error. A desirable “Adeq Precision” should behigher than 4 and indicates that the mode has beenselected suitably [26]. In this case, the ratio of 9.652impliesthat this model was well selected and can beused forhandling the design space.
106industria textila 2018, vol. 69, nr. 2˘
EXPERIMENTAL DESIGN OF DYEING PROCEDURES AND RESPONSES
Factor 1 Factor 2 Factor 3 Factor 4 Response
Run A: pHB: Mordant
Concentration (% owf)C: Temperature
(ºC)D: Dyeing time
(min)CVsum
1 4 10 50 30 71.4
2 8 0 50 90 72.2
3 8 0 50 90 61.5
4 4 0 50 30 141.2
5 6 5 90 60 215.5
6 6 5 50 60 146.4
7 8 10 50 90 127.5
8 4 5 50 90 220.4
9 6 10 70 60 85.2
10 4 5 90 30 192.7
11 4 0 90 90 62.2
12 4 10 90 90 172.4
13 88 10 50 90 95.8
14 6 10 90 30 59.6
15 8 0 90 30 133.2
16 8 0 70 30 66.1
17 8 5 90 90 231.6
18 4 0 90 90 142.2
19 6 2.5 70 60 56.8
20 4 0 50 30 92.4
21 8 10 90 30 100.2
22 8 5 50 30 62.9
23 4 5 70 60 179.7
24 8 0 90 60 99.4
25 8 5 70 60 123.8
Table 2
ANOVA RESULTS OF THE FITTING THE EXPERIMENTAL DATA TO VARIOUS MODELS
Sourcemodel
F valueP value
Prob > FR-Squared
Linear 2.78 0.1320 0.2685
2FI 3.05 0.1163 0.4920
Quadratic 0.95 0.5196 0.8469 Suggested
Cubic 0.9217 aliased
Table 3
ANOVA RESULTS OF THE ESTABLISHED MODELFOR RESPONSES
Factor F-Value P-Value
Model 7.83 0.0003
A: Dyeing pH 5.24 0.0360
B: Mordant concentration 0.65 0.4331
C: Dyeing temperature 7.90 0.0126
D: Dyeing time 9.44 0.0073
AC 4.25 0.0559
BD 10.84 0.0046
B2 26.32 0.0001
C2 5.96 0.0267
Lack of Fit 0.73 0.6947
Table 4
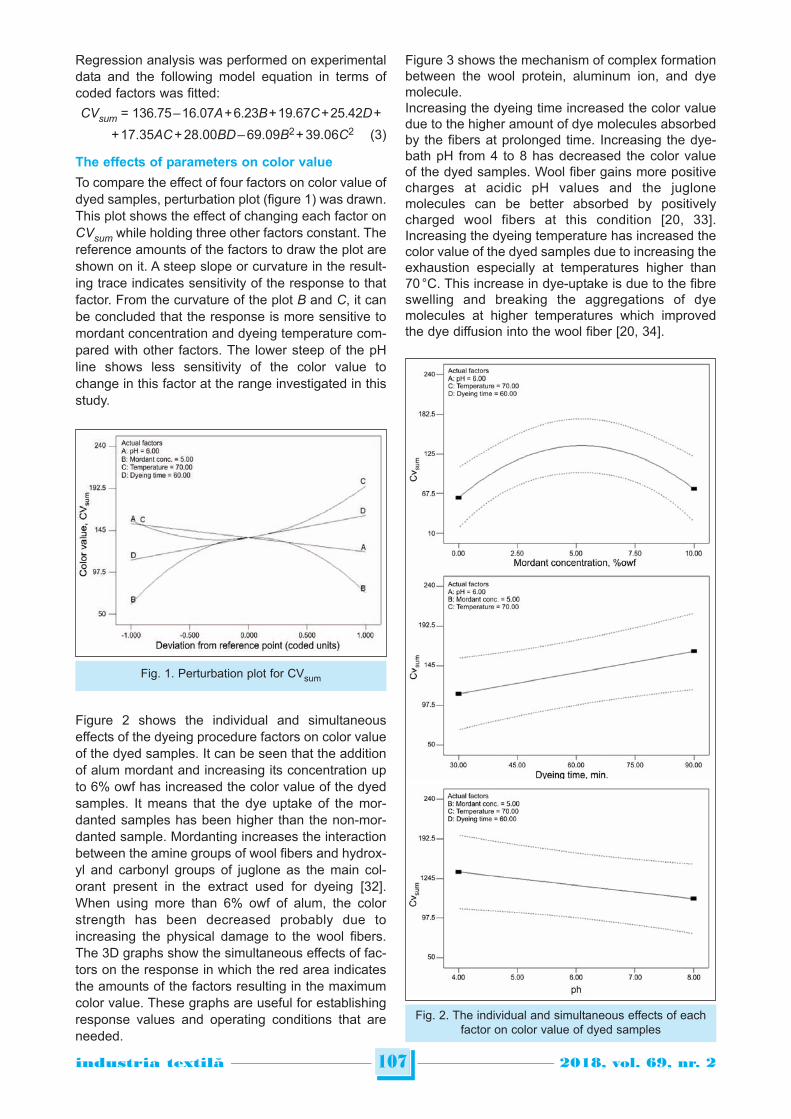
Regression analysis was performed on experimentaldata and the following model equation in terms ofcoded factors was fitted:
CVsum = 136.75 – 16.07A + 6.23B + 19.67C + 25.42D +
+17.35AC + 28.00BD – 69.09B2 + 39.06C2 (3)
The effects of parameters on color value
To compare the effect of four factors on color value ofdyed samples, perturbation plot (figure 1) was drawn.This plot shows the effect of changing each factor onCVsum while holding three other factors constant. Thereference amounts of the factors to draw the plot areshown on it. A steep slope or curvature in the result-ing trace indicates sensitivity of the response to thatfactor. From the curvature of the plot B and C, it canbe concluded that the response is more sensitive tomordant concentration and dyeing temperature com-pared with other factors. The lower steep of the pHline shows less sensitivity of the color value tochange in this factor at the range investigated in thisstudy.
Figure 2 shows the individual and simultaneouseffects of the dyeing procedure factors on color valueof the dyed samples. It can be seen that the additionof alum mordant and increasing its concentration upto 6% owf has increased the color value of the dyedsamples. It means that the dye uptake of the mor-danted samples has been higher than the non-mor-danted sample. Mordanting increases the interactionbetween the amine groups of wool fibers and hydrox-yl and carbonyl groups of juglone as the main col-orant present in the extract used for dyeing [32].When using more than 6% owf of alum, the colorstrength has been decreased probably due toincreasing the physical damage to the wool fibers.The 3D graphs show the simultaneous effects of fac-tors on the response in which the red area indicatesthe amounts of the factors resulting in the maximumcolor value. These graphs are useful for establishingresponse values and operating conditions that areneeded.
Figure 3 shows the mechanism of complex formationbetween the wool protein, aluminum ion, and dyemolecule.Increasing the dyeing time increased the color valuedue to the higher amount of dye molecules absorbedby the fibers at prolonged time. Increasing the dye-bath pH from 4 to 8 has decreased the color valueof the dyed samples. Wool fiber gains more positivecharges at acidic pH values and the juglonemolecules can be better absorbed by positivelycharged wool fibers at this condition [20, 33].Increasing the dyeing temperature has increased thecolor value of the dyed samples due to increasing theexhaustion especially at temperatures higher than70 °C. This increase in dye-uptake is due to the fibreswelling and breaking the aggregations of dyemolecules at higher temperatures which improvedthe dye diffusion into the wool fiber [20, 34].
107industria textila 2018, vol. 69, nr. 2˘
Fig. 1. Perturbation plot for CVsum
Fig. 2. The individual and simultaneous effects of eachfactor on color value of dyed samples
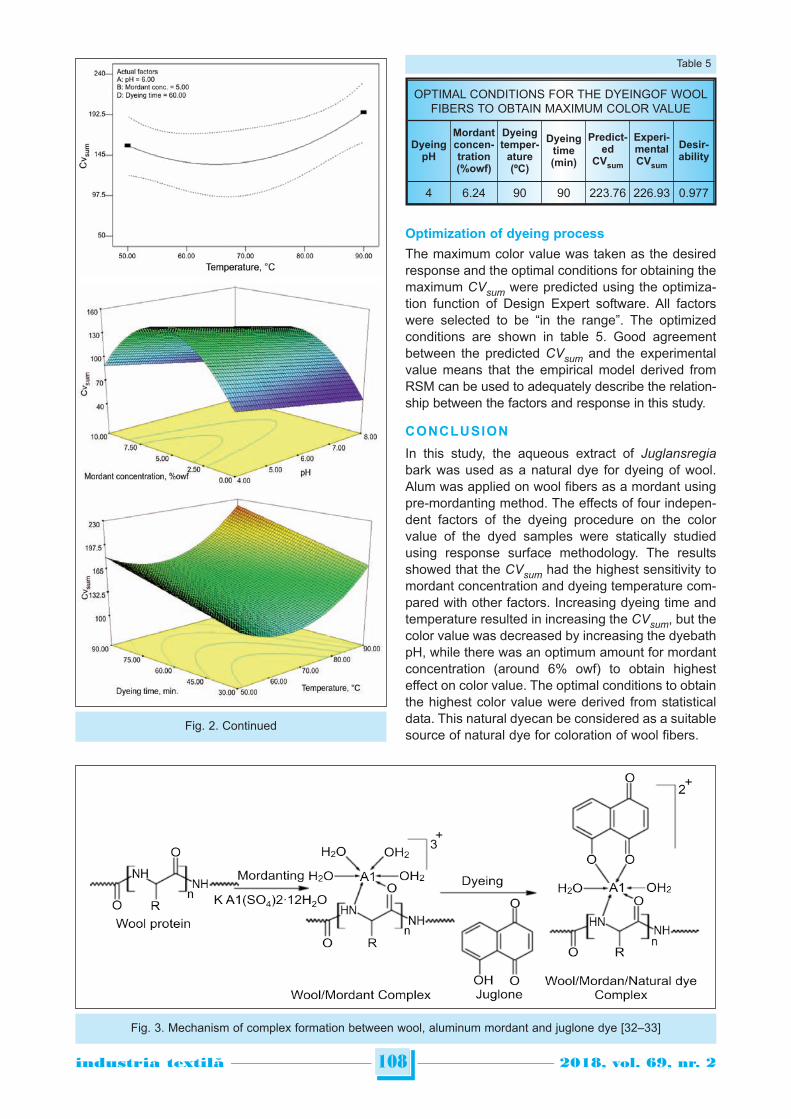
Optimization of dyeing process
The maximum color value was taken as the desiredresponse and the optimal conditions for obtaining themaximum CVsum were predicted using the optimiza-tion function of Design Expert software. All factorswere selected to be “in the range”. The optimizedconditions are shown in table 5. Good agreementbetween the predicted CVsum and the experimentalvalue means that the empirical model derived fromRSM can be used to adequately describe the relation-ship between the factors and response in this study.
CONCLUSION
In this study, the aqueous extract of Juglansregiabark was used as a natural dye for dyeing of wool.Alum was applied on wool fibers as a mordant usingpre-mordanting method. The effects of four indepen-dent factors of the dyeing procedure on the colorvalue of the dyed samples were statically studiedusing response surface methodology. The resultsshowed that the CVsum had the highest sensitivity tomordant concentration and dyeing temperature com-pared with other factors. Increasing dyeing time andtemperature resulted in increasing the CVsum, but thecolor value was decreased by increasing the dyebathpH, while there was an optimum amount for mordantconcentration (around 6% owf) to obtain highesteffect on color value. The optimal conditions to obtainthe highest color value were derived from statisticaldata. This natural dyecan be considered as a suitablesource of natural dye for coloration of wool fibers.
108industria textila 2018, vol. 69, nr. 2˘
Fig. 2. Continued
Fig. 3. Mechanism of complex formation between wool, aluminum mordant and juglone dye [32–33]
OPTIMAL CONDITIONS FOR THE DYEINGOF WOOLFIBERS TO OBTAIN MAXIMUM COLOR VALUE
DyeingpH
Mordantconcen-tration(%owf)
Dyeing temper-
ature(ºC)
Dyeingtime(min)
Predict-ed
CVsum
Experi-mentalCVsum
Desir-ability
4 6.24 90 90 223.76 226.93 0.977
Table 5
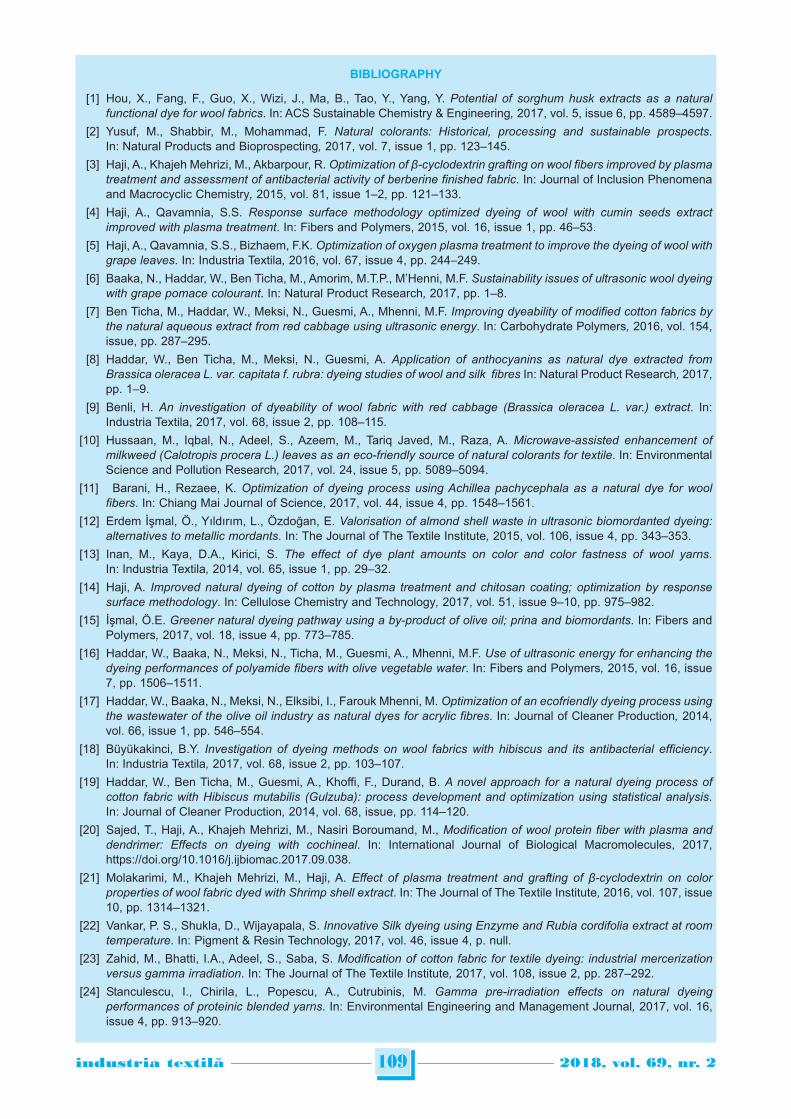
109industria textila 2018, vol. 69, nr. 2˘
BIBLIOGRAPHY
[1] Hou, X., Fang, F., Guo, X., Wizi, J., Ma, B., Tao, Y., Yang, Y. Potential of sorghum husk extracts as a naturalfunctional dye for wool fabrics. In: ACS Sustainable Chemistry & Engineering, 2017, vol. 5, issue 6, pp. 4589–4597.
[2] Yusuf, M., Shabbir, M., Mohammad, F. Natural colorants: Historical, processing and sustainable prospects.In: Natural Products and Bioprospecting, 2017, vol. 7, issue 1, pp. 123–145.
[3] Haji, A., Khajeh Mehrizi, M., Akbarpour, R. Optimization of β-cyclodextrin grafting on wool fibers improved by plasmatreatment and assessment of antibacterial activity of berberine finished fabric. In: Journal of Inclusion Phenomenaand Macrocyclic Chemistry, 2015, vol. 81, issue 1–2, pp. 121–133.
[4] Haji, A., Qavamnia, S.S. Response surface methodology optimized dyeing of wool with cumin seeds extractimproved with plasma treatment. In: Fibers and Polymers, 2015, vol. 16, issue 1, pp. 46–53.
[5] Haji, A., Qavamnia, S.S., Bizhaem, F.K. Optimization of oxygen plasma treatment to improve the dyeing of wool withgrape leaves. In: Industria Textila, 2016, vol. 67, issue 4, pp. 244–249.
[6] Baaka, N., Haddar, W., Ben Ticha, M., Amorim, M.T.P., M’Henni, M.F. Sustainability issues of ultrasonic wool dyeingwith grape pomace colourant. In: Natural Product Research, 2017, pp. 1–8.
[7] Ben Ticha, M., Haddar, W., Meksi, N., Guesmi, A., Mhenni, M.F. Improving dyeability of modified cotton fabrics bythe natural aqueous extract from red cabbage using ultrasonic energy. In: Carbohydrate Polymers, 2016, vol. 154,issue, pp. 287–295.
[8] Haddar, W., Ben Ticha, M., Meksi, N., Guesmi, A. Application of anthocyanins as natural dye extracted fromBrassica oleracea L. var. capitata f. rubra: dyeing studies of wool and silk fibres In: Natural Product Research, 2017,pp. 1–9.
[9] Benli, H. An investigation of dyeability of wool fabric with red cabbage (Brassica oleracea L. var.) extract. In:Industria Textila, 2017, vol. 68, issue 2, pp. 108–115.
[10] Hussaan, M., Iqbal, N., Adeel, S., Azeem, M., Tariq Javed, M., Raza, A. Microwave-assisted enhancement ofmilkweed (Calotropis procera L.) leaves as an eco-friendly source of natural colorants for textile. In: EnvironmentalScience and Pollution Research, 2017, vol. 24, issue 5, pp. 5089–5094.
[11] Barani, H., Rezaee, K. Optimization of dyeing process using Achillea pachycephala as a natural dye for woolfibers. In: Chiang Mai Journal of Science, 2017, vol. 44, issue 4, pp. 1548–1561.
[12] Erdem İşmal, Ö., Yıldırım, L., Özdoğan, E. Valorisation of almond shell waste in ultrasonic biomordanted dyeing:alternatives to metallic mordants. In: The Journal of The Textile Institute, 2015, vol. 106, issue 4, pp. 343–353.
[13] Inan, M., Kaya, D.A., Kirici, S. The effect of dye plant amounts on color and color fastness of wool yarns.In: Industria Textila, 2014, vol. 65, issue 1, pp. 29–32.
[14] Haji, A. Improved natural dyeing of cotton by plasma treatment and chitosan coating; optimization by responsesurface methodology. In: Cellulose Chemistry and Technology, 2017, vol. 51, issue 9–10, pp. 975–982.
[15] İşmal, Ö.E. Greener natural dyeing pathway using a by-product of olive oil; prina and biomordants. In: Fibers andPolymers, 2017, vol. 18, issue 4, pp. 773–785.
[16] Haddar, W., Baaka, N., Meksi, N., Ticha, M., Guesmi, A., Mhenni, M.F. Use of ultrasonic energy for enhancing thedyeing performances of polyamide fibers with olive vegetable water. In: Fibers and Polymers, 2015, vol. 16, issue7, pp. 1506–1511.
[17] Haddar, W., Baaka, N., Meksi, N., Elksibi, I., Farouk Mhenni, M. Optimization of an ecofriendly dyeing process usingthe wastewater of the olive oil industry as natural dyes for acrylic fibres. In: Journal of Cleaner Production, 2014,vol. 66, issue 1, pp. 546–554.
[18] Büyükakinci, B.Y. Investigation of dyeing methods on wool fabrics with hibiscus and its antibacterial efficiency.In: Industria Textila, 2017, vol. 68, issue 2, pp. 103–107.
[19] Haddar, W., Ben Ticha, M., Guesmi, A., Khoffi, F., Durand, B. A novel approach for a natural dyeing process ofcotton fabric with Hibiscus mutabilis (Gulzuba): process development and optimization using statistical analysis.In: Journal of Cleaner Production, 2014, vol. 68, issue, pp. 114–120.
[20] Sajed, T., Haji, A., Khajeh Mehrizi, M., Nasiri Boroumand, M., Modification of wool protein fiber with plasma anddendrimer: Effects on dyeing with cochineal. In: International Journal of Biological Macromolecules, 2017,https://doi.org/10.1016/j.ijbiomac.2017.09.038.
[21] Molakarimi, M., Khajeh Mehrizi, M., Haji, A. Effect of plasma treatment and grafting of β-cyclodextrin on colorproperties of wool fabric dyed with Shrimp shell extract. In: The Journal of The Textile Institute, 2016, vol. 107, issue10, pp. 1314–1321.
[22] Vankar, P. S., Shukla, D., Wijayapala, S. Innovative Silk dyeing using Enzyme and Rubia cordifolia extract at roomtemperature. In: Pigment & Resin Technology, 2017, vol. 46, issue 4, p. null.
[23] Zahid, M., Bhatti, I.A., Adeel, S., Saba, S. Modification of cotton fabric for textile dyeing: industrial mercerizationversus gamma irradiation. In: The Journal of The Textile Institute, 2017, vol. 108, issue 2, pp. 287–292.
[24] Stanculescu, I., Chirila, L., Popescu, A., Cutrubinis, M. Gamma pre-irradiation effects on natural dyeingperformances of proteinic blended yarns. In: Environmental Engineering and Management Journal, 2017, vol. 16,issue 4, pp. 913–920.
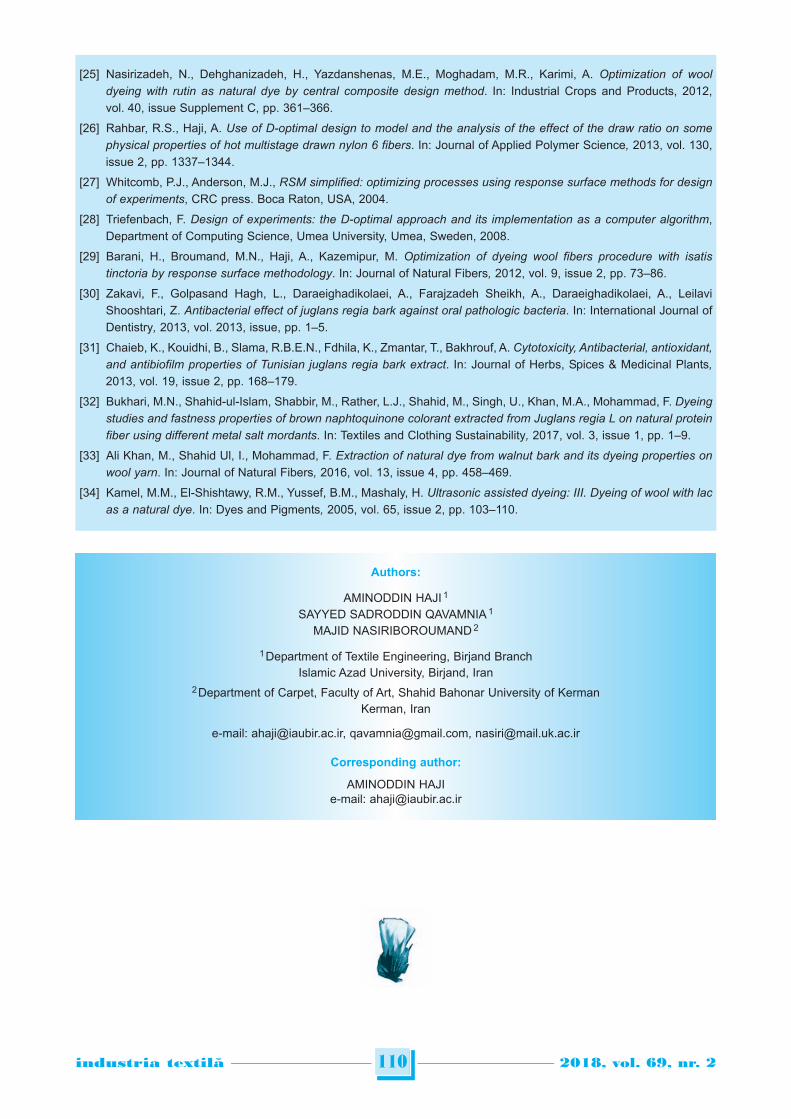
110industria textila 2018, vol. 69, nr. 2˘
[25] Nasirizadeh, N., Dehghanizadeh, H., Yazdanshenas, M.E., Moghadam, M.R., Karimi, A. Optimization of wooldyeing with rutin as natural dye by central composite design method. In: Industrial Crops and Products, 2012,
vol. 40, issue Supplement C, pp. 361–366.
[26] Rahbar, R.S., Haji, A. Use of D-optimal design to model and the analysis of the effect of the draw ratio on somephysical properties of hot multistage drawn nylon 6 fibers. In: Journal of Applied Polymer Science, 2013, vol. 130,
issue 2, pp. 1337–1344.
[27] Whitcomb, P.J., Anderson, M.J., RSM simplified: optimizing processes using response surface methods for designof experiments, CRC press. Boca Raton, USA, 2004.
[28] Triefenbach, F. Design of experiments: the D-optimal approach and its implementation as a computer algorithm,
Department of Computing Science, Umea University, Umea, Sweden, 2008.
[29] Barani, H., Broumand, M.N., Haji, A., Kazemipur, M. Optimization of dyeing wool fibers procedure with isatistinctoria by response surface methodology. In: Journal of Natural Fibers, 2012, vol. 9, issue 2, pp. 73–86.
[30] Zakavi, F., Golpasand Hagh, L., Daraeighadikolaei, A., Farajzadeh Sheikh, A., Daraeighadikolaei, A., Leilavi
Shooshtari, Z. Antibacterial effect of juglans regia bark against oral pathologic bacteria. In: International Journal of
Dentistry, 2013, vol. 2013, issue, pp. 1–5.
[31] Chaieb, K., Kouidhi, B., Slama, R.B.E.N., Fdhila, K., Zmantar, T., Bakhrouf, A. Cytotoxicity, Antibacterial, antioxidant,and antibiofilm properties of Tunisian juglans regia bark extract. In: Journal of Herbs, Spices & Medicinal Plants,2013, vol. 19, issue 2, pp. 168–179.
[32] Bukhari, M.N., Shahid-ul-Islam, Shabbir, M., Rather, L.J., Shahid, M., Singh, U., Khan, M.A., Mohammad, F. Dyeingstudies and fastness properties of brown naphtoquinone colorant extracted from Juglans regia L on natural proteinfiber using different metal salt mordants. In: Textiles and Clothing Sustainability, 2017, vol. 3, issue 1, pp. 1–9.
[33] Ali Khan, M., Shahid Ul, I., Mohammad, F. Extraction of natural dye from walnut bark and its dyeing properties onwool yarn. In: Journal of Natural Fibers, 2016, vol. 13, issue 4, pp. 458–469.
[34] Kamel, M.M., El-Shishtawy, R.M., Yussef, B.M., Mashaly, H. Ultrasonic assisted dyeing: III. Dyeing of wool with lacas a natural dye. In: Dyes and Pigments, 2005, vol. 65, issue 2, pp. 103–110.
Authors:
AMINODDIN HAJI 1
SAYYED SADRODDIN QAVAMNIA 1
MAJID NASIRIBOROUMAND 2
1 Department of Textile Engineering, Birjand BranchIslamic Azad University, Birjand, Iran
2 Department of Carpet, Faculty of Art, Shahid Bahonar University of KermanKerman, Iran
e-mail: [email protected], [email protected], [email protected]
Corresponding author:
AMINODDIN HAJIe-mail: [email protected]
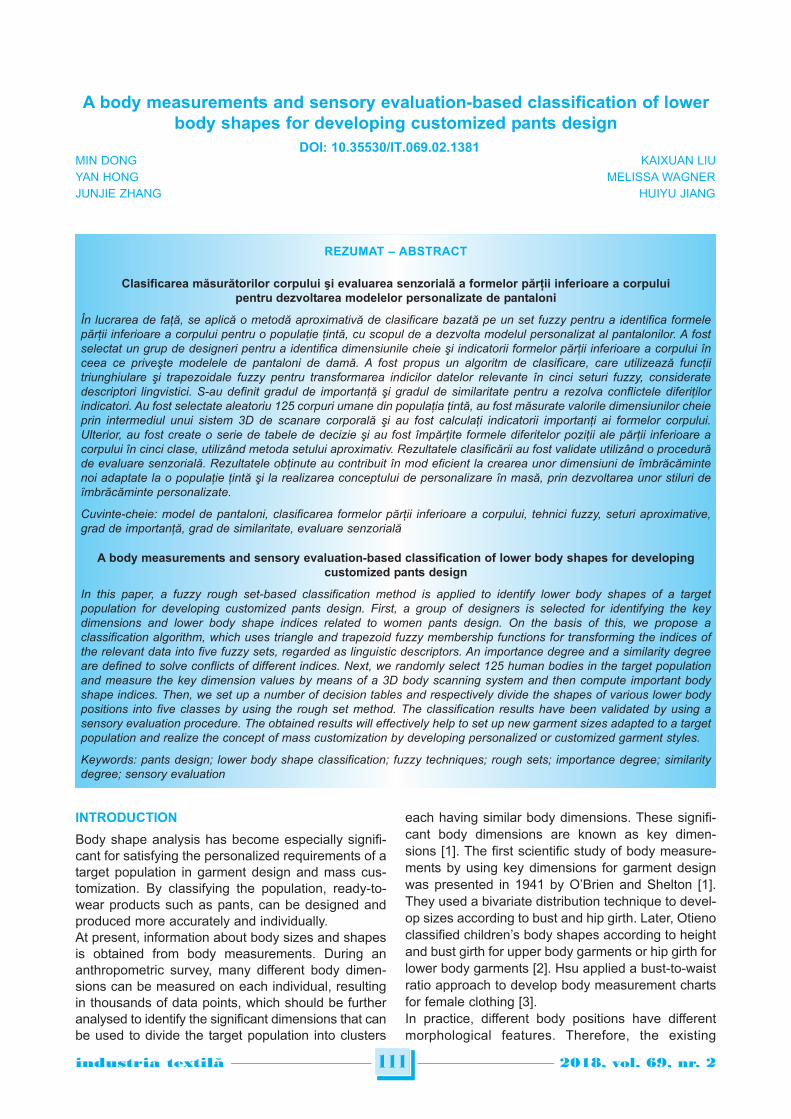
INTRODUCTION
Body shape analysis has become especially signifi-cant for satisfying the personalized requirements of atarget population in garment design and mass cus-tomization. By classifying the population, ready-to-wear products such as pants, can be designed andproduced more accurately and individually.At present, information about body sizes and shapesis obtained from body measurements. During ananthropometric survey, many different body dimen-sions can be measured on each individual, resultingin thousands of data points, which should be furtheranalysed to identify the significant dimensions that canbe used to divide the target population into clusters
each having similar body dimensions. These signifi-cant body dimensions are known as key dimen-sions [1]. The first scientific study of body measure-ments by using key dimensions for garment designwas presented in 1941 by O’Brien and Shelton [1].They used a bivariate distribution technique to devel-op sizes according to bust and hip girth. Later, Otienoclassified children’s body shapes according to heightand bust girth for upper body garments or hip girth forlower body garments [2]. Hsu applied a bust-to-waistratio approach to develop body measurement chartsfor female clothing [3].In practice, different body positions have differentmorphological features. Therefore, the existing
111industria textila 2018, vol. 69, nr. 2˘
A body measurements and sensory evaluation-based classification of lowerbody shapes for developing customized pants design
MIN DONG KAIXUAN LIUYAN HONG MELISSA WAGNERJUNJIE ZHANG HUIYU JIANG
REZUMAT – ABSTRACT
Clasificarea măsurătorilor corpului şi evaluarea senzorială a formelor părţii inferioare a corpuluipentru dezvoltarea modelelor personalizate de pantaloni
În lucrarea de faţă, se aplică o metodă aproximativă de clasificare bazată pe un set fuzzy pentru a identifica formelepărţii inferioare a corpului pentru o populaţie ţintă, cu scopul de a dezvolta modelul personalizat al pantalonilor. A fostselectat un grup de designeri pentru a identifica dimensiunile cheie şi indicatorii formelor părţii inferioare a corpului înceea ce priveşte modelele de pantaloni de damă. A fost propus un algoritm de clasificare, care utilizează funcţiitriunghiulare şi trapezoidale fuzzy pentru transformarea indicilor datelor relevante în cinci seturi fuzzy, consideratedescriptori lingvistici. S-au definit gradul de importanţă şi gradul de similaritate pentru a rezolva conflictele diferiţilorindicatori. Au fost selectate aleatoriu 125 corpuri umane din populaţia ţintă, au fost măsurate valorile dimensiunilor cheieprin intermediul unui sistem 3D de scanare corporală şi au fost calculaţi indicatorii importanţi ai formelor corpului.Ulterior, au fost create o serie de tabele de decizie şi au fost împărţite formele diferitelor poziţii ale părţii inferioare acorpului în cinci clase, utilizând metoda setului aproximativ. Rezultatele clasificării au fost validate utilizând o procedurăde evaluare senzorială. Rezultatele obţinute au contribuit în mod eficient la crearea unor dimensiuni de îmbrăcămintenoi adaptate la o populaţie ţintă şi la realizarea conceptului de personalizare în masă, prin dezvoltarea unor stiluri deîmbrăcăminte personalizate.
Cuvinte-cheie: model de pantaloni, clasificarea formelor părţii inferioare a corpului, tehnici fuzzy, seturi aproximative,grad de importanţă, grad de similaritate, evaluare senzorială
A body measurements and sensory evaluation-based classification of lower body shapes for developingcustomized pants design
In this paper, a fuzzy rough set-based classification method is applied to identify lower body shapes of a targetpopulation for developing customized pants design. First, a group of designers is selected for identifying the keydimensions and lower body shape indices related to women pants design. On the basis of this, we propose aclassification algorithm, which uses triangle and trapezoid fuzzy membership functions for transforming the indices ofthe relevant data into five fuzzy sets, regarded as linguistic descriptors. An importance degree and a similarity degreeare defined to solve conflicts of different indices. Next, we randomly select 125 human bodies in the target populationand measure the key dimension values by means of a 3D body scanning system and then compute important bodyshape indices. Then, we set up a number of decision tables and respectively divide the shapes of various lower bodypositions into five classes by using the rough set method. The classification results have been validated by using asensory evaluation procedure. The obtained results will effectively help to set up new garment sizes adapted to a targetpopulation and realize the concept of mass customization by developing personalized or customized garment styles.
Keywords: pants design; lower body shape classification; fuzzy techniques; rough sets; importance degree; similaritydegree; sensory evaluation
DOI: 10.35530/IT.069.02.1381
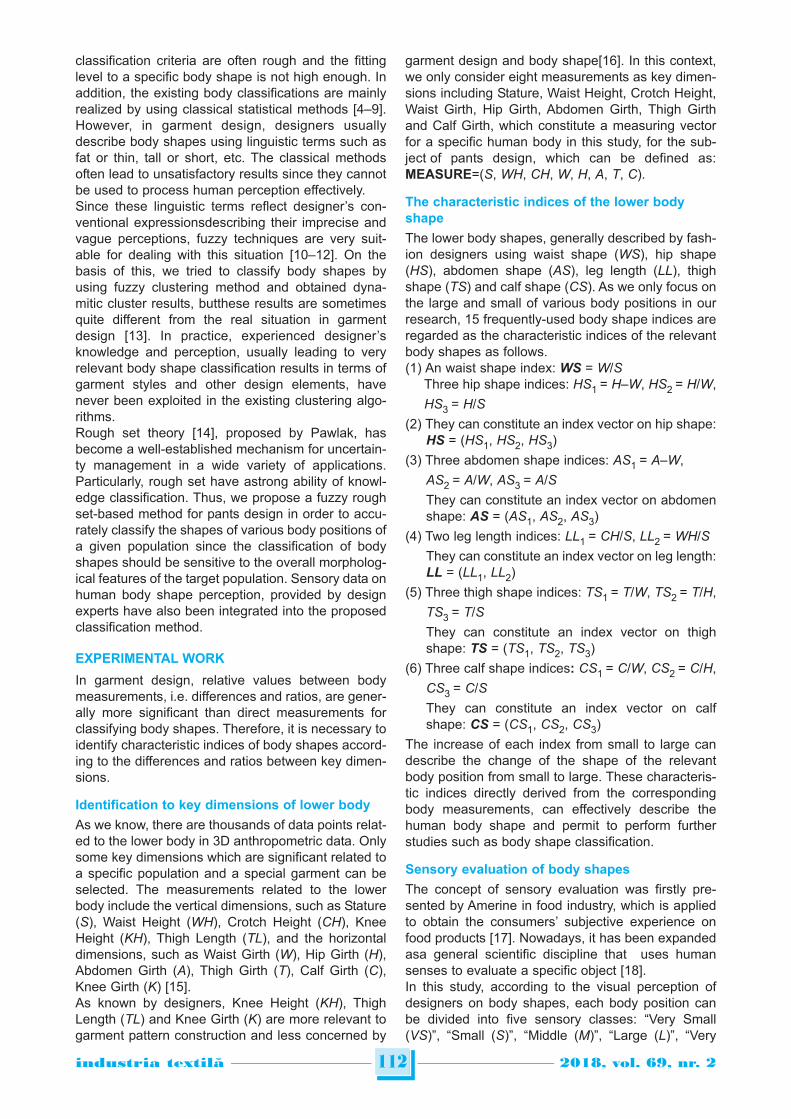
classification criteria are often rough and the fittinglevel to a specific body shape is not high enough. Inaddition, the existing body classifications are mainlyrealized by using classical statistical methods [4–9].However, in garment design, designers usuallydescribe body shapes using linguistic terms such asfat or thin, tall or short, etc. The classical methodsoften lead to unsatisfactory results since they cannotbe used to process human perception effectively.Since these linguistic terms reflect designer’s con-ventional expressionsdescribing their imprecise andvague perceptions, fuzzy techniques are very suit-able for dealing with this situation [10–12]. On thebasis of this, we tried to classify body shapes byusing fuzzy clustering method and obtained dyna-mitic cluster results, butthese results are sometimesquite different from the real situation in garmentdesign [13]. In practice, experienced designer’sknowledge and perception, usually leading to veryrelevant body shape classification results in terms ofgarment styles and other design elements, havenever been exploited in the existing clustering algo-rithms.Rough set theory [14], proposed by Pawlak, hasbecome a well-established mechanism for uncertain-ty management in a wide variety of applications.Particularly, rough set have astrong ability of knowl-edge classification. Thus, we propose a fuzzy roughset-based method for pants design in order to accu-rately classify the shapes of various body positions ofa given population since the classification of bodyshapes should be sensitive to the overall morpholog-ical features of the target population. Sensory data onhuman body shape perception, provided by designexperts have also been integrated into the proposedclassification method.
EXPERIMENTAL WORK
In garment design, relative values between bodymeasurements, i.e. differences and ratios, are gener-ally more significant than direct measurements forclassifying body shapes. Therefore, it is necessary toidentify characteristic indices of body shapes accord-ing to the differences and ratios between key dimen-sions.
Identification to key dimensions of lower body
As we know, there are thousands of data points relat-ed to the lower body in 3D anthropometric data. Onlysome key dimensions which are significant related toa specific population and a special garment can beselected. The measurements related to the lowerbody include the vertical dimensions, such as Stature(S), Waist Height (WH), Crotch Height (CH), KneeHeight (KH), Thigh Length (TL), and the horizontaldimensions, such as Waist Girth (W), Hip Girth (H),Abdomen Girth (A), Thigh Girth (T), Calf Girth (C),Knee Girth (K) [15].As known by designers, Knee Height (KH), ThighLength (TL) and Knee Girth (K) are more relevant togarment pattern construction and less concerned by
garment design and body shape[16]. In this context,we only consider eight measurements as key dimen-sions including Stature, Waist Height, Crotch Height,Waist Girth, Hip Girth, Abdomen Girth, Thigh Girthand Calf Girth, which constitute a measuring vectorfor a specific human body in this study, for the sub-ject of pants design, which can be defined as:MEASURE=(S, WH, CH, W, H, A, T, C).
The characteristic indices of the lower bodyshape
The lower body shapes, generally described by fash-ion designers using waist shape (WS), hip shape(HS), abdomen shape (AS), leg length (LL), thighshape (TS) and calf shape (CS). As we only focus onthe large and small of various body positions in ourresearch, 15 frequently-used body shape indices areregarded as the characteristic indices of the relevantbody shapes as follows.(1) An waist shape index: WS = W/S
Three hip shape indices: HS1 = H–W, HS2 = H/W,
HS3 = H/S
(2) They can constitute an index vector on hip shape: HS = (HS1, HS2, HS3)
(3) Three abdomen shape indices: AS1 = A–W,
AS2 = A/W, AS3 = A/S
They can constitute an index vector on abdomenshape: AS = (AS1, AS2, AS3)
(4) Two leg length indices: LL1 = CH/S, LL2 = WH/S
They can constitute an index vector on leg length:LL = (LL1, LL2)
(5) Three thigh shape indices: TS1 = T/W, TS2 = T/H,
TS3 = T/S
They can constitute an index vector on thighshape: TS = (TS1, TS2, TS3)
(6) Three calf shape indices: CS1 = C/W, CS2 = C/H,
CS3 = C/S
They can constitute an index vector on calfshape: CS = (CS1, CS2, CS3)
The increase of each index from small to large candescribe the change of the shape of the relevantbody position from small to large. These characteris-tic indices directly derived from the correspondingbody measurements, can effectively describe thehuman body shape and permit to perform furtherstudies such as body shape classification.
Sensory evaluation of body shapes
The concept of sensory evaluation was firstly pre-sented by Amerine in food industry, which is appliedto obtain the consumers’ subjective experience onfood products [17]. Nowadays, it has been expandedasa general scientific discipline that uses humansenses to evaluate a specific object [18]. In this study, according to the visual perception ofdesigners on body shapes, each body position canbe divided into five sensory classes: “Very Small(VS)”, “Small (S)”, “Middle (M)”, “Large (L)”, “Very
112industria textila 2018, vol. 69, nr. 2˘
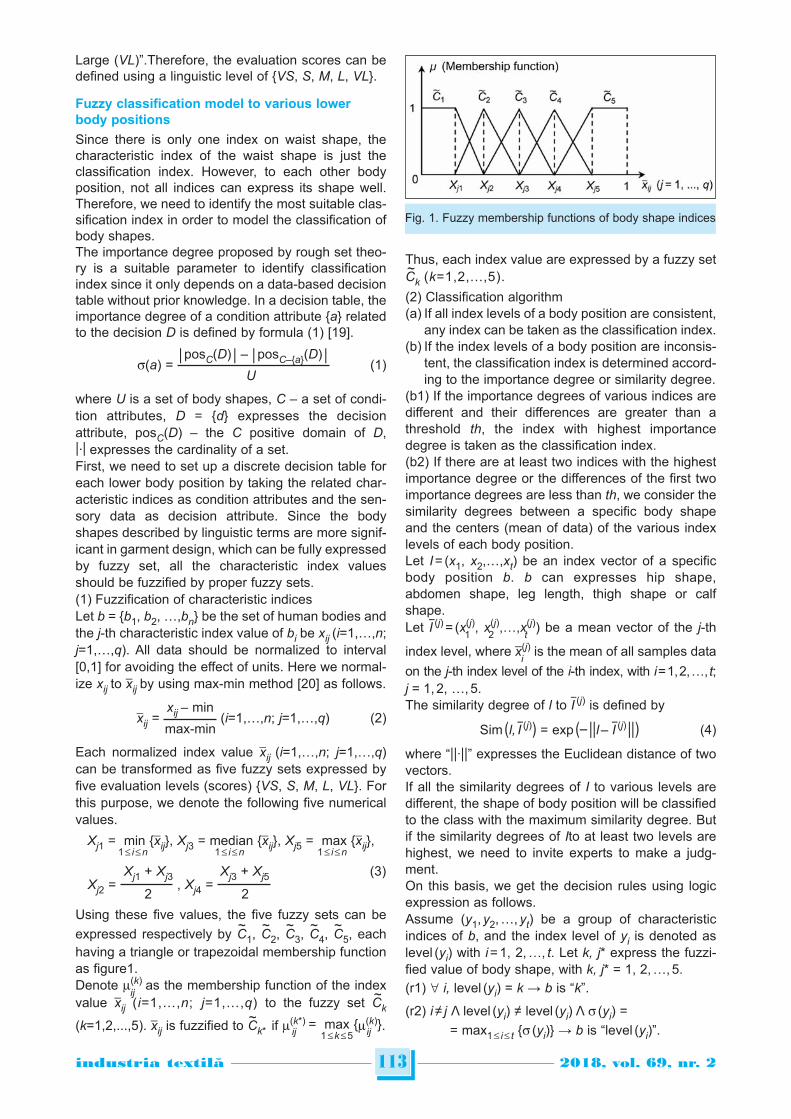
Large (VL)”.Therefore, the evaluation scores can bedefined using a linguistic level of {VS, S, M, L, VL}.
Fuzzy classification model to various lowerbody positions
Since there is only one index on waist shape, thecharacteristic index of the waist shape is just theclassification index. However, to each other bodyposition, not all indices can express its shape well.Therefore, we need to identify the most suitable clas-sification index in order to model the classification ofbody shapes.The importance degree proposed by rough set theo-ry is a suitable parameter to identify classificationindex since it only depends on a data-based decisiontable without prior knowledge. In a decision table, theimportance degree of a condition attribute {a} relatedto the decision D is defined by formula (1) [19].
| posC(D) | – | posC–{a}(D) |s(a) = (1)
U
where U is a set of body shapes, C – a set of condi-tion attributes, D = {d} expresses the decisionattribute, posC(D) – the C positive domain of D,|·| expresses the cardinality of a set.First, we need to set up a discrete decision table foreach lower body position by taking the related char-acteristic indices as condition attributes and the sen-sory data as decision attribute. Since the bodyshapes described by linguistic terms are more signif-icant in garment design, which can be fully expressedby fuzzy set, all the characteristic index valuesshould be fuzzified by proper fuzzy sets.(1) Fuzzification of characteristic indicesLet b = {b1, b2, …,bn} be the set of human bodies andthe j-th characteristic index value of bi be xij (i=1,…,n;j=1,…,q). All data should be normalized to interval[0,1] for avoiding the effect of units. Here we normal-ize xij to xij by using max-min method [20] as follows.
xij – minxij = (i=1,…,n; j=1,…,q) (2)
max-min
Each normalized index value xij (i=1,…,n; j=1,…,q)can be transformed as five fuzzy sets expressed byfive evaluation levels (scores) {VS, S, M, L, VL}. Forthis purpose, we denote the following five numericalvalues.
Xj1 = min {xij}, Xj3 = median {xij}, Xj5 = max {xij},1 i n 1 i n 1 i n
Xj1 + Xj3 Xj3 + Xj5 (3)Xj2 = , Xj4 =
2 2
Using these five values, the five fuzzy sets can be~ ~ ~ ~ ~
expressed respectively by C1, C2, C3, C4, C5, eachhaving a triangle or trapezoidal membership functionas figure1.Denote m(k) as the membership function of the index
ij ~value xij (i=1,…,n; j=1,…,q) to the fuzzy set Ck
~(k=1,2,...,5). xij is fuzzified to Ck* if m(k*) = max {m(k)}.ij 1 k 5 ij
Thus, each index value are expressed by a fuzzy set~Ck (k=1,2,...,5).
(2) Classification algorithm (a) If all index levels of a body position are consistent,
any index can be taken as the classification index. (b) If the index levels of a body position are inconsis-
tent, the classification index is determined accord-ing to the importance degree or similarity degree.
(b1) If the importance degrees of various indices aredifferent and their differences are greater than athreshold th, the index with highest importancedegree is taken as the classification index. (b2) If there are at least two indices with the highestimportance degree or the differences of the first twoimportance degrees are less than th, we consider thesimilarity degrees between a specific body shapeand the centers (mean of data) of the various indexlevels of each body position.Let I = (x1, x2,…,xt) be an index vector of a specificbody position b. b can expresses hip shape,abdomen shape, leg length, thigh shape or calfshape.Let I (j) = (x(j), x(j),…,x(j)) be a mean vector of the j-th
1 2 t
index level, where x(j) is the mean of all samples datai
on the j-th index level of the i-th index, with i = 1, 2, …, t;j = 1, 2, …, 5.The similarity degree of l to I (j) is defined by
Sim (l, I (j)) = exp (– ||l – I (j) ||) (4)
where “||·||” expresses the Euclidean distance of twovectors.If all the similarity degrees of I to various levels aredifferent, the shape of body position will be classifiedto the class with the maximum similarity degree. Butif the similarity degrees of Ito at least two levels arehighest, we need to invite experts to make a judg-ment.On this basis, we get the decision rules using logicexpression as follows.Assume (y1, y2, …, yt) be a group of characteristicindices of b, and the index level of yi is denoted aslevel (yi) with i = 1, 2, …, t. Let k, j* express the fuzzi-fied value of body shape, with k, j* = 1, 2, …, 5.(r1) i, level (yi) = k → b is “k”.
(r2) i≠ j Λ level (yi) ≠ level (yi) Λ s (yi) =
= max1 i t {s (yi)} → b is “level (yi)”.
113industria textila 2018, vol. 69, nr. 2˘
Fig. 1. Fuzzy membership functions of body shape indices
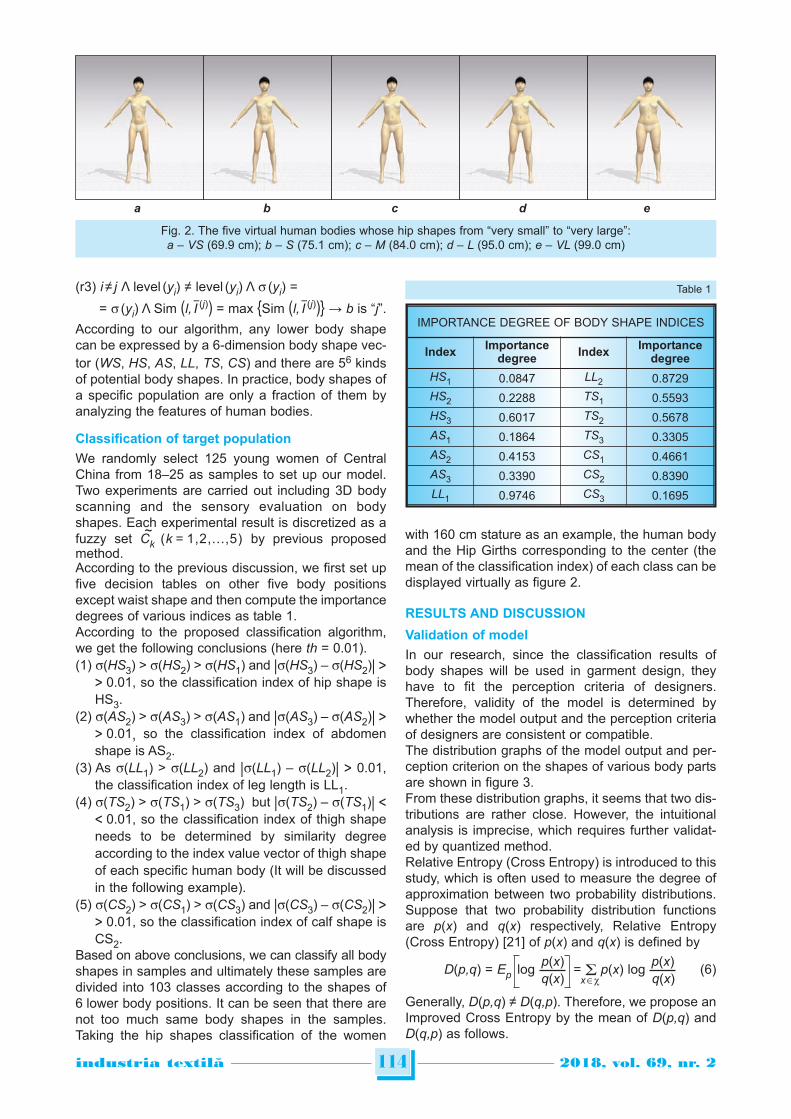
(r3) i≠ j Λ level (yi) ≠ level (yi) Λ s (yi) =
= s (yi) Λ Sim (l, I (j)) = max {Sim (l, I (j))} → b is “j”.
According to our algorithm, any lower body shapecan be expressed by a 6-dimension body shape vec-tor (WS, HS, AS, LL, TS, CS) and there are 56 kindsof potential body shapes. In practice, body shapes ofa specific population are only a fraction of them byanalyzing the features of human bodies.
Classification of target population
We randomly select 125 young women of CentralChina from 18–25 as samples to set up our model.Two experiments are carried out including 3D bodyscanning and the sensory evaluation on bodyshapes. Each experimental result is discretized as a
~fuzzy set Ck (k = 1,2,...,5) by previous proposedmethod.According to the previous discussion, we first set upfive decision tables on other five body positionsexcept waist shape and then compute the importancedegrees of various indices as table 1.According to the proposed classification algorithm,we get the following conclusions (here th = 0.01).(1) s(HS3) > s(HS2) > s(HS1) and |s(HS3) – s(HS2)| >
> 0.01, so the classification index of hip shape isHS3.
(2) s(AS2) > s(AS3) > s(AS1) and |s(AS3) – s(AS2)| >> 0.01, so the classification index of abdomenshape is AS2.
(3) As s(LL1) > s(LL2) and |s(LL1) – s(LL2)| > 0.01,the classification index of leg length is LL1.
(4) s(TS2) > s(TS1) > s(TS3) but |s(TS2) – s(TS1)| << 0.01, so the classification index of thigh shapeneeds to be determined by similarity degreeaccording to the index value vector of thigh shapeof each specific human body (It will be discussedin the following example).
(5) s(CS2) > s(CS1) > s(CS3) and |s(CS3) – s(CS2)| >> 0.01, so the classification index of calf shape isCS2.
Based on above conclusions, we can classify all bodyshapes in samples and ultimately these samples aredivided into 103 classes according to the shapes of6 lower body positions. It can be seen that there arenot too much same body shapes in the samples.Taking the hip shapes classification of the women
with 160 cm stature as an example, the human bodyand the Hip Girths corresponding to the center (themean of the classification index) of each class can bedisplayed virtually as figure 2.
RESULTS AND DISCUSSION
Validation of model
In our research, since the classification results ofbody shapes will be used in garment design, theyhave to fit the perception criteria of designers.Therefore, validity of the model is determined bywhether the model output and the perception criteriaof designers are consistent or compatible.The distribution graphs of the model output and per-ception criterion on the shapes of various body partsare shown in figure 3.From these distribution graphs, it seems that two dis-tributions are rather close. However, the intuitionalanalysis is imprecise, which requires further validat-ed by quantized method.Relative Entropy (Cross Entropy) is introduced to thisstudy, which is often used to measure the degree ofapproximation between two probability distributions.Suppose that two probability distribution functionsare p(x) and q(x) respectively, Relative Entropy(Cross Entropy) [21] of p(x) and q(x) is defined by
p(x) p(x)D(p,q) = Ep log = p(x) log (6)
q(x) x q(x)
Generally, D(p,q) ≠ D(q,p). Therefore, we propose anImproved Cross Entropy by the mean of D(p,q) andD(q,p) as follows.
114industria textila 2018, vol. 69, nr. 2˘
IMPORTANCE DEGREE OF BODY SHAPE INDICES
IndexImportance
degreeIndex
Importancedegree
HS1 0.0847 LL2 0.8729
HS2 0.2288 TS1 0.5593
HS3 0.6017 TS2 0.5678
AS1 0.1864 TS3 0.3305
AS2 0.4153 CS1 0.4661
AS3 0.3390 CS2 0.8390
LL1 0.9746 CS3 0.1695
Table 1
Fig. 2. The five virtual human bodies whose hip shapes from “very small” to “very large”:a – VS (69.9 cm); b – S (75.1 cm); c – M (84.0 cm); d – L (95.0 cm); e – VL (99.0 cm)
a b c d e
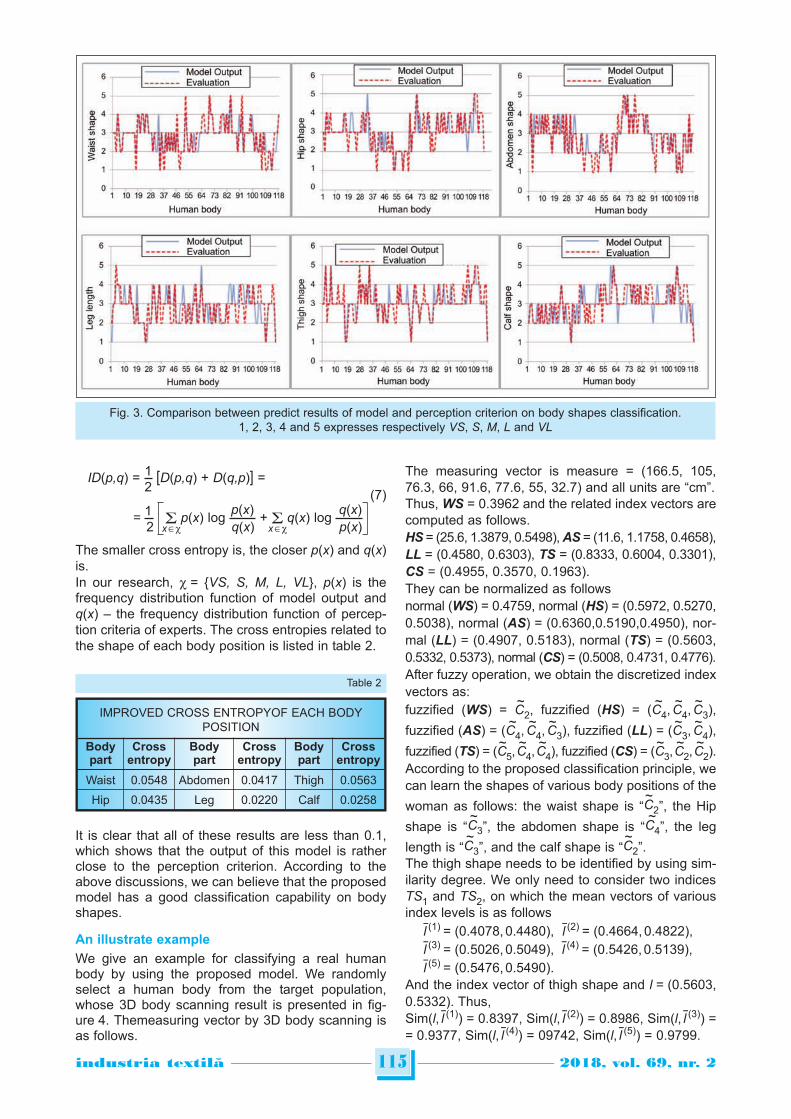
1ID(p,q) = [D(p,q) + D(q,p)] =2
1 p(x) q(x)= p(x) log + q(x) log
(7)
2 x q(x) x p(x)
The smaller cross entropy is, the closer p(x) and q(x)is.In our research, = {VS, S, M, L, VL}, p(x) is thefrequency distribution function of model output andq(x) – the frequency distribution function of percep-tion criteria of experts. The cross entropies related tothe shape of each body position is listed in table 2.
It is clear that all of these results are less than 0.1,which shows that the output of this model is ratherclose to the perception criterion. According to theabove discussions, we can believe that the proposedmodel has a good classification capability on bodyshapes.
An illustrate example
We give an example for classifying a real humanbody by using the proposed model. We randomlyselect a human body from the target population,whose 3D body scanning result is presented in fig-ure 4. Themeasuring vector by 3D body scanning isas follows.
The measuring vector is measure = (166.5, 105,76.3, 66, 91.6, 77.6, 55, 32.7) and all units are “cm”.Thus, WS = 0.3962 and the related index vectors arecomputed as follows.HS = (25.6, 1.3879, 0.5498), AS = (11.6, 1.1758, 0.4658),LL = (0.4580, 0.6303), TS = (0.8333, 0.6004, 0.3301),CS = (0.4955, 0.3570, 0.1963).They can be normalized as followsnormal (WS) = 0.4759, normal (HS) = (0.5972, 0.5270,0.5038), normal (AS) = (0.6360,0.5190,0.4950), nor-mal (LL) = (0.4907, 0.5183), normal (TS) = (0.5603,0.5332, 0.5373), normal (CS) = (0.5008, 0.4731, 0.4776).After fuzzy operation, we obtain the discretized indexvectors as:
~ ~ ~ ~fuzzified (WS) = C2, fuzzified (HS) = (C4, C4, C3),
~ ~ ~ ~ ~fuzzified (AS) = (C4, C4, C3), fuzzified (LL) = (C3, C4),
~ ~ ~ ~ ~ ~fuzzified (TS) = (C5, C4, C4), fuzzified (CS) = (C3, C2, C2).According to the proposed classification principle, wecan learn the shapes of various body positions of the
~woman as follows: the waist shape is “C2”, the Hip
~ ~shape is “C3”, the abdomen shape is “C4”, the leg
~ ~length is “C3”, and the calf shape is “C2”.The thigh shape needs to be identified by using sim-ilarity degree. We only need to consider two indicesTS1 and TS2, on which the mean vectors of variousindex levels is as follows
l (1) = (0.4078, 0.4480), l (2) = (0.4664, 0.4822),l (3) = (0.5026, 0.5049), l (4) = (0.5426, 0.5139),l (5) = (0.5476, 0.5490).
And the index vector of thigh shape and l = (0.5603,0.5332). Thus,Sim(l, l (1)) = 0.8397, Sim(l, l (2)) = 0.8986, Sim(l, l (3)) == 0.9377, Sim(l, l (4)) = 09742, Sim(l, l (5)) = 0.9799.
115industria textila 2018, vol. 69, nr. 2˘
Fig. 3. Comparison between predict results of model and perception criterion on body shapes classification.1, 2, 3, 4 and 5 expresses respectively VS, S, M, L and VL
IMPROVED CROSS ENTROPYOF EACH BODYPOSITION
Bodypart
Crossentropy
Bodypart
Crossentropy
Bodypart
Crossentropy
Waist 0.0548 Abdomen 0.0417 Thigh 0.0563
Hip 0.0435 Leg 0.0220 Calf 0.0258
Table 2
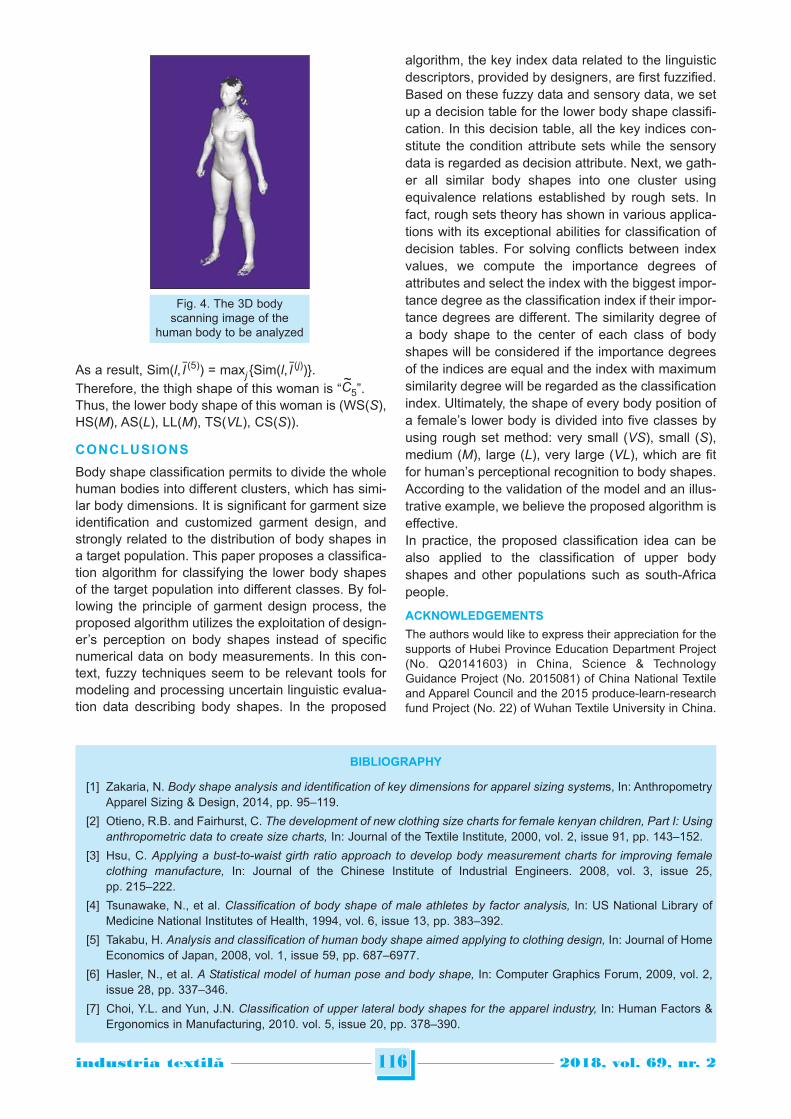
As a result, Sim(l, l (5)) = maxj {Sim(l, l (j))}.~
Therefore, the thigh shape of this woman is “C5”.Thus, the lower body shape of this woman is (WS(S),HS(M), AS(L), LL(M), TS(VL), CS(S)).
CONCLUSIONS
Body shape classification permits to divide the wholehuman bodies into different clusters, which has simi-lar body dimensions. It is significant for garment sizeidentification and customized garment design, andstrongly related to the distribution of body shapes ina target population. This paper proposes a classifica-tion algorithm for classifying the lower body shapesof the target population into different classes. By fol-lowing the principle of garment design process, theproposed algorithm utilizes the exploitation of design-er’s perception on body shapes instead of specificnumerical data on body measurements. In this con-text, fuzzy techniques seem to be relevant tools formodeling and processing uncertain linguistic evalua-tion data describing body shapes. In the proposed
algorithm, the key index data related to the linguisticdescriptors, provided by designers, are first fuzzified.Based on these fuzzy data and sensory data, we setup a decision table for the lower body shape classifi-cation. In this decision table, all the key indices con-stitute the condition attribute sets while the sensorydata is regarded as decision attribute. Next, we gath-er all similar body shapes into one cluster usingequivalence relations established by rough sets. Infact, rough sets theory has shown in various applica-tions with its exceptional abilities for classification ofdecision tables. For solving conflicts between indexvalues, we compute the importance degrees ofattributes and select the index with the biggest impor-tance degree as the classification index if their impor-tance degrees are different. The similarity degree ofa body shape to the center of each class of bodyshapes will be considered if the importance degreesof the indices are equal and the index with maximumsimilarity degree will be regarded as the classificationindex. Ultimately, the shape of every body position ofa female’s lower body is divided into five classes byusing rough set method: very small (VS), small (S),medium (M), large (L), very large (VL), which are fitfor human’s perceptional recognition to body shapes.According to the validation of the model and an illus-trative example, we believe the proposed algorithm iseffective.In practice, the proposed classification idea can bealso applied to the classification of upper bodyshapes and other populations such as south-Africapeople.
ACKNOWLEDGEMENTS
The authors would like to express their appreciation for thesupports of Hubei Province Education Department Project(No. Q20141603) in China, Science & TechnologyGuidance Project (No. 2015081) of China National Textileand Apparel Council and the 2015 produce-learn-researchfund Project (No. 22) of Wuhan Textile University in China.
116industria textila 2018, vol. 69, nr. 2˘
Fig. 4. The 3D bodyscanning image of the
human body to be analyzed
BIBLIOGRAPHY
[1] Zakaria, N. Body shape analysis and identification of key dimensions for apparel sizing systems, In: AnthropometryApparel Sizing & Design, 2014, pp. 95–119.
[2] Otieno, R.B. and Fairhurst, C. The development of new clothing size charts for female kenyan children, Part I: Usinganthropometric data to create size charts, In: Journal of the Textile Institute, 2000, vol. 2, issue 91, pp. 143–152.
[3] Hsu, C. Applying a bust-to-waist girth ratio approach to develop body measurement charts for improving femaleclothing manufacture, In: Journal of the Chinese Institute of Industrial Engineers. 2008, vol. 3, issue 25,pp. 215–222.
[4] Tsunawake, N., et al. Classification of body shape of male athletes by factor analysis, In: US National Library ofMedicine National Institutes of Health, 1994, vol. 6, issue 13, pp. 383–392.
[5] Takabu, H. Analysis and classification of human body shape aimed applying to clothing design, In: Journal of HomeEconomics of Japan, 2008, vol. 1, issue 59, pp. 687–6977.
[6] Hasler, N., et al. A Statistical model of human pose and body shape, In: Computer Graphics Forum, 2009, vol. 2,issue 28, pp. 337–346.
[7] Choi, Y.L. and Yun, J.N. Classification of upper lateral body shapes for the apparel industry, In: Human Factors &Ergonomics in Manufacturing, 2010. vol. 5, issue 20, pp. 378–390.
117industria textila 2018, vol. 69, nr. 2˘
Authors:
MIN DONG 1
YAN HONG 2,3
JUNJIE ZHANG 1
KAIXUAN LIU 4
MELISSA WAGNER 3
HUIYU JIANG 1
1 Wuhan Textile University, Wuhan 430020, China2 College of Textile and Clothing Engineering, Soochow University, Suzhou 215021, China
3 Technical University of Iasi, DimitrieMangeron Bd., 53, Iasi – 700050, Romania4 Clothing and art college, Donghua University, Shanghai 200051, China
Corresponding author:
HUİYU JİANG
e-mail: [email protected]
[8] Huang, C.Y. Study on classification of body shape and size grading on young women of Quanzhou District, In:Advanced Materials Research. 2014, vol. 1, issue 989–994, pp. 5319–5322.
[9] Olaru, S., Filipescu, E. and Niculescu, C. Morphological indicators for characterization of women thorax and basinshape, for garment design in customised system, In: Industria Textila, 2011. 62, 6, pp. 289–295.
[10] Zadeh, L.A. Fuzzy sets, In: Information & Control, 1965, vol. 3, issue 8, pp. 338–353.
[11] Chen, Y. From body measurements to human perception of body shapes: Modeling using intelligent techniques, In:Computational Intelligence, 2010, vol. 4, issue 1, pp. 1084–1089.
[12] Wang, L.C., et al. Intelligent fashion recommender system: Fuzzy logic in personalized garment design, In: Human-Machine Systems (IEEE Transactions), 2015, vol. 1, issue 45, pp. 95–109.
[13] Dong, M., Zeng, X, and Koehl, L. Dynamic fuzzy clustering of lower body shapes for developing personalized pantsdesign, In: Conference on Uncertainty Modelling in Knowledge Engineering and Decision Making, 2016, vol. 10,issue 1, pp. 898–904.
[14] Pawlak, Z. Rough Sets: Theoretical aspects of reasoning about data, Kluwer Academic Publishers, 2010.
[15] Ben Azouz, Z., et al. Characterizing human shape variation using 3D anthropometric data,In: The Visual Computer,2006, vol. 5, issue 22, pp. 302–314.
[16] Olaru, S., et al. Morphological assessment of human body for clothing patterns design, In: Industria Textila, 2013.vol. 5, issue 64, pp. 254–259.
[17] Amerine, M.A., Pangborn, R.M., and Roessler, E.B. Principles of sensory evaluation of food, In: Principles ofSensory Evaluation of Food, 1965, vol. 1, issue 1, pp. 159–176.
[18] Wikipedia contributors, Sensory analysis. In: Wikipedia, 2016.
[19] Pawlak, Z. Rough set theory and its applications to data analysis. In: Cybernetics & Systems, 1998, vol. 29, issue29, pp. 661–688.
[20] Uragun, B. and Rajan, R. Developing an appropriate data normalization method, In: IEEE/ACM Transactions onComputational Biology & Bioinformatics, 2011, vol. 2, issue 2, pp. 195–199.
[21] Zhang, M. Information theory and statistics, In: Wiley, 1959, vol. 288, issue 54, pp. 301.
INTRODUCTION
Compression socks are highly recommended textile
garment for pressure exertion on the lower part of leg
[1]. Mechanism of action is a varying degree of com-
pression to different segments of the leg, with the
highest pressure at the ankle, must gradually
decrease in upward direction. These types of socks
are highly recommended for treatment of chronic
venous diseased patients [2]. Physical and construc-
tional properties of compression socks are of most
importance because its properties directly relate to
the type of patient and intensity of the disease. The
extent of compression that a patient can easily man-
age depends on stage (limb size and shape) of
venous disease and his activities (mobility, age).
Apart from above considerations, compression socks
must exert maximum pressure at the ankle, which
should decrease to the upper part of the limb. These
compression socks must acquire both comfortable
and appropriate level of compression. Medical com-
pression devices (MCD) are considered being more
effective in preventing and reducing edema if it is
capable to exert interface pressure on the gaiter area
up to 40 mmHg [3].
As per international classification of pressure exertion
intensity, it is classified as CCL1 (light) up to 20 mm Hg;
CCLII (moderate) 20–30 mmHg and CCLIII firm
compression (30–40 mmHg). These levels of pres-
sure exertion are recommended medically to treat cir-
culatory and vascular medical conditions as well for
tired, sore, swollen, or aching legs [3–6].
Theoretically, the amount of pressure in the circum-
ferential direction of leg depends on the radius (R) of
leg and reversal force T (N).
According to Laplace’s Law [5]
T (N)P (Pa) = (1)
R (cm)
118industria textila 2018, vol. 69, nr. 2˘
Effect of elastane linear density on compression pressure of V-shaped
compression socks
SIDDIQUE HAFIZ FAISAL HAVELKA ANTONIN
MAZARI ADNAN HUSSAIN TANVEER
REZUMAT – ABSTRACT
Efectul densităţii liniare a elastanului asupra presiunii de compresie a şosetelor de compresie cu fire
de vanisare
Scopul acestui studiu a fost de a evalua efectul densităţii liniare a materialelor din elastan asupra valorilor de compresielaterale (gleznă şi gambă) a unor noi variante de şosete de compresie (cu fire de vanisare). În acest scop, au fostutilizate trei tipuri de fire: fire de bază (MY), fire de vanisare (PY) şi fire de căpuşeală (IY). Fiecare fir conţine materialelastan drept miez cu densităţi liniare variabile. Reglajele maşinii au fost optimizate pentru a se obţine şosete decompresie speciale cu fire de vanisare, în funcţie de dimensiunea fixă a piciorului. Toate firele au fost instalate simultanşi evaluate pentru impactul lor asupra valorii presiunii de compresie la diferite segmente de picior. În total, au fostdezvoltate şi cuantificate 18 probe de şosete pentru exercitarea presiunii utilizând dispozitivul MST MKIV, un dispozitivde monitorizare a presiunii Salzmann. Toate probele au fost analizate utilizând software-ul ANOVA în MINTAB 16.În final, numai două probe de şosete au fost finalizate, obţinându-se valori de exercitare a presiunii de 21 mmHg şi23 mmHg, cu un nivel de compresie graduală de 76% şi 74%, simultan.
Cuvinte-cheie: compresie, densitate lineară, elastan, şosete cu fire de vanisare, fir filat cu miez, fir acoperit, fir dubluacoperit
Effect of elastane linear density on compression pressure of V-shaped compression socks
The aim of this study was to evaluate the effect of elastane material linear densities on lateral compression values (ankleand calf) in newly designed shape (V-shape) compression socks. For this purpose, three types of yarns: main yarn (MY),plating yarn (PY) and inlaid yarn (IY) were used. Each yarn contains elastane material as core with varying lineardensities. Firstly, Machine adjustments were optimized to achieve special V-shaped compression socks according to fixleg size. All the yarns were installed simultaneously and evaluated for their impact on compression pressure value atdifferent segments of leg. Total eighteen socks samples were developed and quantified for pressure exertion using MSTMKIV, Salzmann pressure monitoring device. All samples were analyzed using ANOVA in MINTAB 16 software.Consequently, only two socks samples finalized acquiring pressure exertion values of 21 mmHg and 23 mmHg withgraduation percentage of 76% and 74% simultaneously.
Keywords: compression, linear density, elastane, V-shaped socks, core spun yarn, air covered yarn, double coveredyarn
DOI: 10.35530/IT.069.02.1433
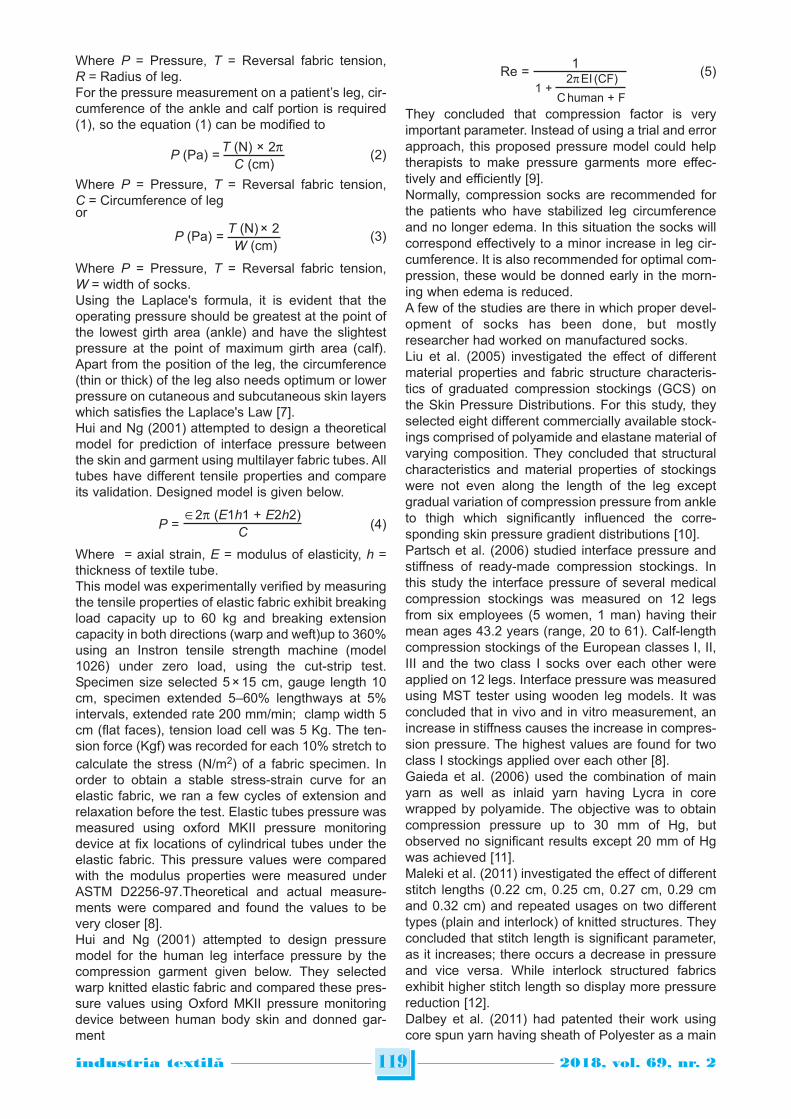
Where P = Pressure, T = Reversal fabric tension,
R = Radius of leg.
For the pressure measurement on a patient’s leg, cir-
cumference of the ankle and calf portion is required
(1), so the equation (1) can be modified to
T (N) × 2pP (Pa) = (2)
C (cm)
Where P = Pressure, T = Reversal fabric tension,
C = Circumference of leg or
T (N) × 2P (Pa) = (3)
W (cm)
Where P = Pressure, T = Reversal fabric tension,
W = width of socks.
Using the Laplace's formula, it is evident that the
operating pressure should be greatest at the point of
the lowest girth area (ankle) and have the slightest
pressure at the point of maximum girth area (calf).
Apart from the position of the leg, the circumference
(thin or thick) of the leg also needs optimum or lower
pressure on cutaneous and subcutaneous skin layers
which satisfies the Laplace's Law [7].
Hui and Ng (2001) attempted to design a theoretical
model for prediction of interface pressure between
the skin and garment using multilayer fabric tubes. All
tubes have different tensile properties and compare
its validation. Designed model is given below.
2p (E1h1 + E2h2)P = (4)
C
Where = axial strain, E = modulus of elasticity, h =
thickness of textile tube.
This model was experimentally verified by measuring
the tensile properties of elastic fabric exhibit breaking
load capacity up to 60 kg and breaking extension
capacity in both directions (warp and weft)up to 360%
using an Instron tensile strength machine (model
1026) under zero load, using the cut-strip test.
Specimen size selected 5 × 15 cm, gauge length 10
cm, specimen extended 5–60% lengthways at 5%
intervals, extended rate 200 mm/min; clamp width 5
cm (flat faces), tension load cell was 5 Kg. The ten-
sion force (Kgf) was recorded for each 10% stretch to
calculate the stress (N/m2) of a fabric specimen. In
order to obtain a stable stress-strain curve for an
elastic fabric, we ran a few cycles of extension and
relaxation before the test. Elastic tubes pressure was
measured using oxford MKII pressure monitoring
device at fix locations of cylindrical tubes under the
elastic fabric. This pressure values were compared
with the modulus properties were measured under
ASTM D2256-97.Theoretical and actual measure-
ments were compared and found the values to be
very closer [8].
Hui and Ng (2001) attempted to design pressure
model for the human leg interface pressure by the
compression garment given below. They selected
warp knitted elastic fabric and compared these pres-
sure values using Oxford MKII pressure monitoring
device between human body skin and donned gar-
ment
1Re = (5)
2p EI (CF)1 +
C human + F
They concluded that compression factor is very
important parameter. Instead of using a trial and error
approach, this proposed pressure model could help
therapists to make pressure garments more effec-
tively and efficiently [9].
Normally, compression socks are recommended for
the patients who have stabilized leg circumference
and no longer edema. In this situation the socks will
correspond effectively to a minor increase in leg cir-
cumference. It is also recommended for optimal com-
pression, these would be donned early in the morn-
ing when edema is reduced.
A few of the studies are there in which proper devel-
opment of socks has been done, but mostly
researcher had worked on manufactured socks.
Liu et al. (2005) investigated the effect of different
material properties and fabric structure characteris-
tics of graduated compression stockings (GCS) on
the Skin Pressure Distributions. For this study, they
selected eight different commercially available stock-
ings comprised of polyamide and elastane material of
varying composition. They concluded that structural
characteristics and material properties of stockings
were not even along the length of the leg except
gradual variation of compression pressure from ankle
to thigh which significantly influenced the corre-
sponding skin pressure gradient distributions [10].
Partsch et al. (2006) studied interface pressure and
stiffness of ready-made compression stockings. In
this study the interface pressure of several medical
compression stockings was measured on 12 legs
from six employees (5 women, 1 man) having their
mean ages 43.2 years (range, 20 to 61). Calf-length
compression stockings of the European classes I, II,
III and the two class I socks over each other were
applied on 12 legs. Interface pressure was measured
using MST tester using wooden leg models. It was
concluded that in vivo and in vitro measurement, an
increase in stiffness causes the increase in compres-
sion pressure. The highest values are found for two
class I stockings applied over each other [8].
Gaieda et al. (2006) used the combination of main
yarn as well as inlaid yarn having Lycra in core
wrapped by polyamide. The objective was to obtain
compression pressure up to 30 mm of Hg, but
observed no significant results except 20 mm of Hg
was achieved [11].
Maleki et al. (2011) investigated the effect of different
stitch lengths (0.22 cm, 0.25 cm, 0.27 cm, 0.29 cm
and 0.32 cm) and repeated usages on two different
types (plain and interlock) of knitted structures. They
concluded that stitch length is significant parameter,
as it increases; there occurs a decrease in pressure
and vice versa. While interlock structured fabrics
exhibit higher stitch length so display more pressure
reduction [12].
Dalbey et al. (2011) had patented their work using
core spun yarn having sheath of Polyester as a main
119industria textila 2018, vol. 69, nr. 2˘
yarn and double covered Nylon yarn on Lycra core as
inlaid yarn achieved maximum compression up to
40 mm of Hg [13].
Troynikova O et al. (2013) studied the influence of
material properties and garment composition on the
pressure generated by sport compression garments
using two differently structured knitted fabrics with
different physical properties and elastic performance.
These samples were tested using compression pres-
sure measuring device MST MK IV. The researchers
concluded that different material composition of fab-
ric assemblies influenced the pressure delivery of
garment [14].
Normally, socks (weft knitted) are composed of three
yarns types defined body yarn, plated yarn and inlaid
yarn. Body yarns as in direct contact with skin pro-
vide different feels to wearer. Inlaid yarns used are
single covered or double covered yarns that run
through the heads of loop form by body yarn. It con-
trols stretch, optimum pressure, intimate contact and
grip over the leg portion and avoids the sliding of the
socks. The loop-forming yarns like body yarn (spun/
filament) and plated yarn (air covered) form the loops
together. Inlaid yarn (double covered yarn) is inte-
grated into each loop of every course [13–16].
Various studies exits in which different fiber/yarn
types (varying elastane linear densities and composi-
tions) different types of spun/core spun yarns of dif-
ferent linear densities, different kind of inlaid yarn,
varying tension by increasing or decreasing ultra
feeder yarn tensions into knitting machine and differ-
ent fabric structures (manufactured and ready-made),
different sizes and shapes of the substrate (cylindri-
cal tube or wooden leg) had been used to exert max-
imum pressure at the ankle and optimum graduation
[2, 4, 14, 16–18]. But there is no study in which the
effect elastane material linear densities used in all the
three socks components body yarn, plated yarn and
inlaid yarn is studied in specially
designed V-shaped socks.In normal compression socksgraduation percentage variesfrom 60% to 80% of the totalcompression pressure at theankle. The most important prop-erty required in graduated com-pression socks is to attain thehighest sub-garment compres-sion pressure at ankle accordingto European classification of com-pression pressure. The gradua-tion compression pressure means
gradually lowering of pressure along the length of theleg towards the calf. If does not reduces while mov-ing upward may cause blood clotting and swelling ofinner walls of the veins. The intensity of compressionpressure suggested for the patients depends on thetype, history and intensity of the disease. The severeis the disease, the higher compression pressure sug-gested for the patient to prevent the recurrence oflymph edema. The objective of this study is to investigate the influ-ence main yarn (MY), plating yarn (PY), and inlaidyarn (IY) on compression pressure at ankle, calf andgraduation percentage between 70 to 80%.
MATERIALS AND METHOD
Materials (yarns)
Compression socks are comprised of three yarns
types i.e. main, plated and inlaid abbreviated as main
yarn (MY), plating yarn (PY) and Inlaid yarn (IY).
Main/Body yarn: Three types of main yarns (core
Spun) were selected abbreviated as (MY1*, MY2* &
MY3*) as shown figure 1. All have same Overall lin-
ear density i.e. 29.52 tex but different elastane mate-
rial linear densities i.e. 4.4 tex, 7.77 tex, 11.7 tex
respectively. Here *MY1: 4.4 tex Lycra-29.52/1 tex
core spun cotton 96%, *MY2: 7.8 tex Lycra-29.52/
1 tex core spun cotton 93% and *MY3: 11.7 tex
Lycra-29.52/1 tex core spun cotton 90%. Testing
results of main yarn are given below in table 1.
Inlaid yarn: Three types of double covered Nylon fil-
ament yarn were selected as shown in figure 2 can
be abbreviated as (IY1*, IY2*& IY3*). Each type con-
tains elastane yarn of different linear densities i.e.
13.3 tex, 15.5 tex and 33 tex but fixed sheath yarn
linear density i.e. 15.55 tex/24f/1. Here *IY1: 13.3 tex-
15.55/ 24f/1 tex Raw White Nylon DCV 17%, *IY2:
15.50 tex-15.55/24f/1 tex Raw White Nylon DCV
19% and *IY3: 33.0 tex-15.55/24f/1 tex Raw White
120industria textila 2018, vol. 69, nr. 2˘
Sr. no Main yarn codesYarn linear density (tex)
Draw ratio Elastane composition (%)Resultant Elastane
1 MYELD1 29.52 4.4 3.48 4.32
2 MYELD2 29.52 7.8 3.64 7.22
3 MYELD3 29.52 11.7 3.65 10.83
Table 1
MY: Main Yarn, E: Elastane, LD: Linear Density
Fig. 1. Front view of
Core Spun yarn [12]Fig. 2. Double covered Nylon Filament yarn [19]
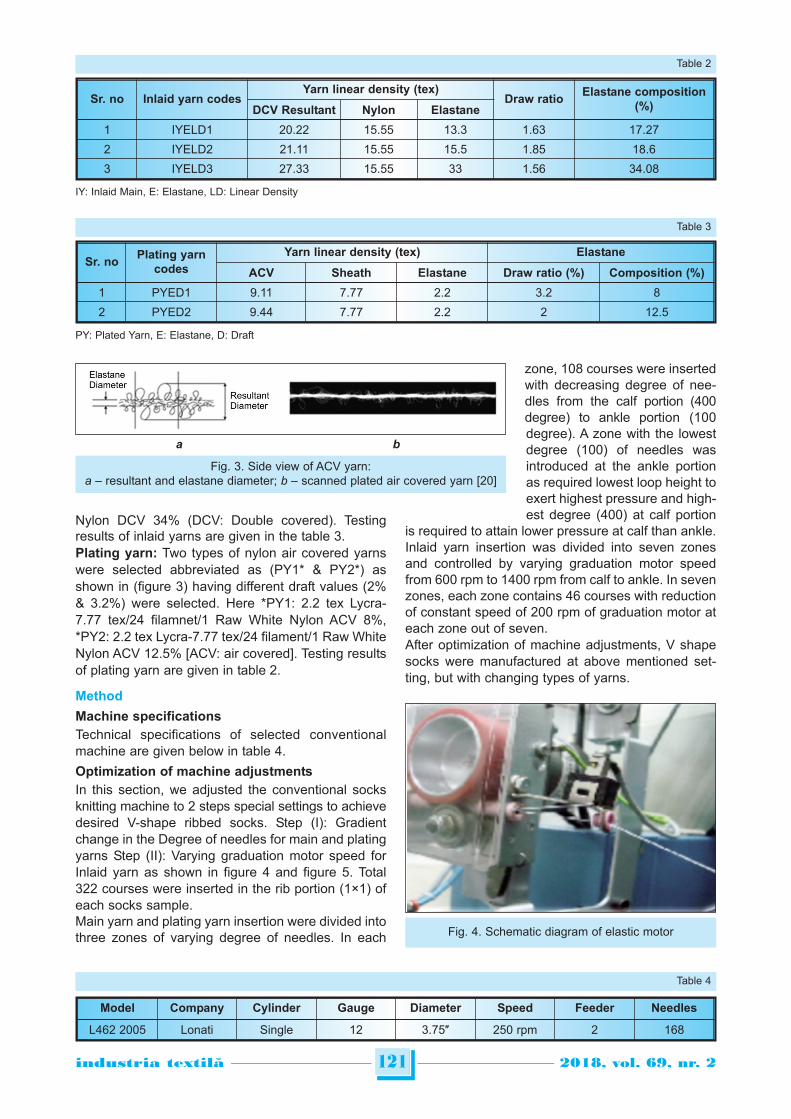
Nylon DCV 34% (DCV: Double covered). Testing
results of inlaid yarns are given in the table 3.
Plating yarn: Two types of nylon air covered yarns
were selected abbreviated as (PY1* & PY2*) as
shown in (figure 3) having different draft values (2%
& 3.2%) were selected. Here *PY1: 2.2 tex Lycra-
7.77 tex/24 filamnet/1 Raw White Nylon ACV 8%,
*PY2: 2.2 tex Lycra-7.77 tex/24 filament/1 Raw White
Nylon ACV 12.5% [ACV: air covered]. Testing results
of plating yarn are given in table 2.
Method
Machine specifications
Technical specifications of selected conventional
machine are given below in table 4.
Optimization of machine adjustments
In this section, we adjusted the conventional socks
knitting machine to 2 steps special settings to achieve
desired V-shape ribbed socks. Step (I): Gradient
change in the Degree of needles for main and plating
yarns Step (II): Varying graduation motor speed for
Inlaid yarn as shown in figure 4 and figure 5. Total
322 courses were inserted in the rib portion (1×1) of
each socks sample.
Main yarn and plating yarn insertion were divided into
three zones of varying degree of needles. In each
zone, 108 courses were inserted
with decreasing degree of nee-
dles from the calf portion (400
degree) to ankle portion (100
degree). A zone with the lowest
degree (100) of needles was
introduced at the ankle portion
as required lowest loop height to
exert highest pressure and high-
est degree (400) at calf portion
is required to attain lower pressure at calf than ankle.
Inlaid yarn insertion was divided into seven zones
and controlled by varying graduation motor speed
from 600 rpm to 1400 rpm from calf to ankle. In seven
zones, each zone contains 46 courses with reduction
of constant speed of 200 rpm of graduation motor at
each zone out of seven.
After optimization of machine adjustments, V shape
socks were manufactured at above mentioned set-
ting, but with changing types of yarns.
121industria textila 2018, vol. 69, nr. 2˘
a b
Sr. noPlating yarn
codes
Yarn linear density (tex) Elastane
ACV Sheath Elastane Draw ratio (%) Composition (%)
1 PYED1 9.11 7.77 2.2 3.2 8
2 PYED2 9.44 7.77 2.2 2 12.5
Table 3
Model Company Cylinder Gauge Diameter Speed Feeder Needles
L462 2005 Lonati Single 12 3.75″ 250 rpm 2 168
Table 4
Fig. 3. Side view of ACV yarn:
a – resultant and elastane diameter; b – scanned plated air covered yarn [20]
PY: Plated Yarn, E: Elastane, D: Draft
Fig. 4. Schematic diagram of elastic motor
Sr. no Inlaid yarn codesYarn linear density (tex)
Draw ratioElastane composition
(%)DCV Resultant Nylon Elastane
1 IYELD1 20.22 15.55 13.3 1.63 17.27
2 IYELD2 21.11 15.55 15.5 1.85 18.6
3 IYELD3 27.33 15.55 33 1.56 34.08
Table 2
IY: Inlaid Main, E: Elastane, LD: Linear Density
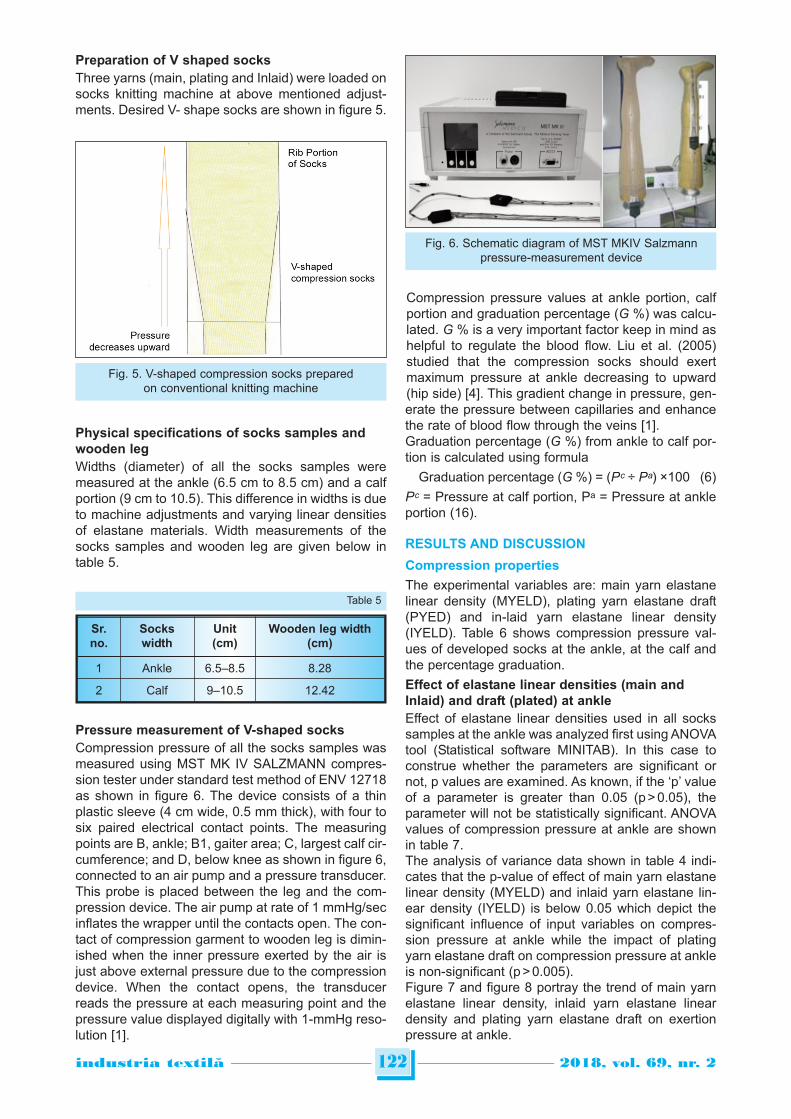
Preparation of V shaped socks
Three yarns (main, plating and Inlaid) were loaded on
socks knitting machine at above mentioned adjust-
ments. Desired V- shape socks are shown in figure 5.
Physical specifications of socks samples and
wooden leg
Widths (diameter) of all the socks samples were
measured at the ankle (6.5 cm to 8.5 cm) and a calf
portion (9 cm to 10.5). This difference in widths is due
to machine adjustments and varying linear densities
of elastane materials. Width measurements of the
socks samples and wooden leg are given below in
table 5.
Pressure measurement of V-shaped socks
Compression pressure of all the socks samples was
measured using MST MK IV SALZMANN compres-
sion tester under standard test method of ENV 12718
as shown in figure 6. The device consists of a thin
plastic sleeve (4 cm wide, 0.5 mm thick), with four to
six paired electrical contact points. The measuring
points are B, ankle; B1, gaiter area; C, largest calf cir-
cumference; and D, below knee as shown in figure 6,
connected to an air pump and a pressure transducer.
This probe is placed between the leg and the com-
pression device. The air pump at rate of 1 mmHg/sec
inflates the wrapper until the contacts open. The con-
tact of compression garment to wooden leg is dimin-
ished when the inner pressure exerted by the air is
just above external pressure due to the compression
device. When the contact opens, the transducer
reads the pressure at each measuring point and the
pressure value displayed digitally with 1-mmHg reso-
lution [1].
Compression pressure values at ankle portion, calf
portion and graduation percentage (G %) was calcu-
lated. G % is a very important factor keep in mind as
helpful to regulate the blood flow. Liu et al. (2005)
studied that the compression socks should exert
maximum pressure at ankle decreasing to upward
(hip side) [4]. This gradient change in pressure, gen-
erate the pressure between capillaries and enhance
the rate of blood flow through the veins [1].
Graduation percentage (G %) from ankle to calf por-
tion is calculated using formula
Graduation percentage (G %) = (Pᶜ ÷ Pᵃ) ×100 (6)
Pᶜ = Pressure at calf portion, Pᵃ = Pressure at ankle
portion (16).
RESULTS AND DISCUSSION
Compression properties
The experimental variables are: main yarn elastane
linear density (MYELD), plating yarn elastane draft
(PYED) and in-laid yarn elastane linear density
(IYELD). Table 6 shows compression pressure val-
ues of developed socks at the ankle, at the calf and
the percentage graduation.
Effect of elastane linear densities (main and
Inlaid) and draft (plated) at ankle
Effect of elastane linear densities used in all socks
samples at the ankle was analyzed first using ANOVA
tool (Statistical software MINITAB). In this case to
construe whether the parameters are significant or
not, p values are examined. As known, if the ‘p’ value
of a parameter is greater than 0.05 (p > 0.05), the
parameter will not be statistically significant. ANOVA
values of compression pressure at ankle are shown
in table 7.
The analysis of variance data shown in table 4 indi-
cates that the p-value of effect of main yarn elastane
linear density (MYELD) and inlaid yarn elastane lin-
ear density (IYELD) is below 0.05 which depict the
significant influence of input variables on compres-
sion pressure at ankle while the impact of plating
yarn elastane draft on compression pressure at ankle
is non-significant (p > 0.005).
Figure 7 and figure 8 portray the trend of main yarn
elastane linear density, inlaid yarn elastane linear
density and plating yarn elastane draft on exertion
pressure at ankle.
122industria textila 2018, vol. 69, nr. 2˘
Fig. 6. Schematic diagram of MST MKIV Salzmann
pressure-measurement device
Sr.
no.
Socks
width
Unit
(cm)
Wooden leg width
(cm)
1 Ankle 6.5–8.5 8.28
2 Calf 9–10.5 12.42
Table 5
Fig. 5. V-shaped compression socks prepared
on conventional knitting machine
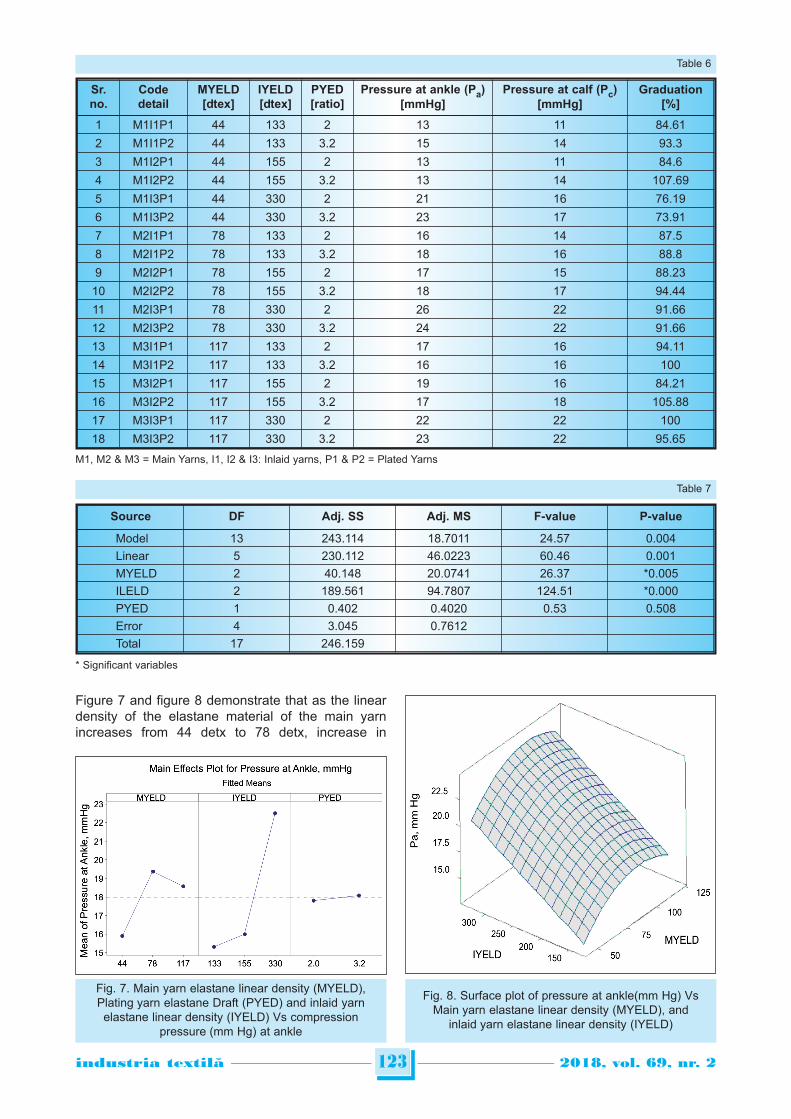
Figure 7 and figure 8 demonstrate that as the linear
density of the elastane material of the main yarn
increases from 44 detx to 78 detx, increase in
123industria textila 2018, vol. 69, nr. 2˘
Sr.
no.
Code
detail
MYELD
[dtex]
IYELD
[dtex]
PYED
[ratio]
Pressure at ankle (Pa)
[mmHg]
Pressure at calf (Pc)
[mmHg]
Graduation
[%]
1 M1I1P1 44 133 2 13 11 84.61
2 M1I1P2 44 133 3.2 15 14 93.3
3 M1I2P1 44 155 2 13 11 84.6
4 M1I2P2 44 155 3.2 13 14 107.69
5 M1I3P1 44 330 2 21 16 76.19
6 M1I3P2 44 330 3.2 23 17 73.91
7 M2I1P1 78 133 2 16 14 87.5
8 M2I1P2 78 133 3.2 18 16 88.8
9 M2I2P1 78 155 2 17 15 88.23
10 M2I2P2 78 155 3.2 18 17 94.44
11 M2I3P1 78 330 2 26 22 91.66
12 M2I3P2 78 330 3.2 24 22 91.66
13 M3I1P1 117 133 2 17 16 94.11
14 M3I1P2 117 133 3.2 16 16 100
15 M3I2P1 117 155 2 19 16 84.21
16 M3I2P2 117 155 3.2 17 18 105.88
17 M3I3P1 117 330 2 22 22 100
18 M3I3P2 117 330 3.2 23 22 95.65
Table 6
Source DF Adj. SS Adj. MS F-value P-value
Model 13 243.114 18.7011 24.57 0.004
Linear 5 230.112 46.0223 60.46 0.001
MYELD 2 40.148 20.0741 26.37 *0.005
ILELD 2 189.561 94.7807 124.51 *0.000
PYED 1 0.402 0.4020 0.53 0.508
Error 4 3.045 0.7612
Total 17 246.159
Table 7
* Significant variables
Fig. 7. Main yarn elastane linear density (MYELD),
Plating yarn elastane Draft (PYED) and inlaid yarn
elastane linear density (IYELD) Vs compression
pressure (mm Hg) at ankle
Fig. 8. Surface plot of pressure at ankle(mm Hg) Vs
Main yarn elastane linear density (MYELD), and
inlaid yarn elastane linear density (IYELD)
M1, M2 & M3 = Main Yarns, I1, I2 & I3: Inlaid yarns, P1 & P2 = Plated Yarns
compression pressure from 16 mm Hg to 19 mm Hg
at ankle takes place. But as the linear density of elas-
tane material increases more from 78 detx to 117
dtex, a non-significant decrease in compression
pressure at ankle from 19 mm Hg to 18 mm Hg takes
place. Increase in compression pressure from 16 mm
Hg to 19 mm Hg by increasing the linear density of
the elastane material is due to increase in the con-
traction of the socks. The fabric density at ankle
increases as the linear density of the elastane mate-
rial increases, which gradually reduces loop length
and air spaces while increasing the stiffness and
compactness of the fabric. As the linear density of the
main yarn elastane material increases more 78 dtex
to 177 dtex, there observed a slight decrease in com-
pression pressure. The reason of decrease in com-
pression pressure is due to additional compact-
ness/least air spaces in knitted fabric which do not
allow the fabric to contract more than the size of the
wooden leg minimum girth area (ankle) ultimately
reducing the compression pressure at ankle. The
wooden dummy used in this study has width/circum-
ference (cm) 8.28/26 cm while the prepared socks
has the width range from 6 cm ~7.5 cm that when
worn to leg size it is stretched to extent according to
circumference of the leg.
Inlaid yarn is the yarn which moves transversely
along each course of main yarn loops while missing
the one loop of the wale (rib construction 1×1). It is
evident from the figure 7 and figure 8 that as the lin-
ear density of the elastane material increases from
133 dtex to 155 dtex, a slight increase in compression
pressure from 15 mm Hg to 16 mm Hg takes place
but as the linear density of the inlaid yarn increases
from 155 dtex to 330 dtex, incredible increase in
compression pressure from 16 mm Hg to 23 mm Hg
takes place.
Diana et al. (2013) reported that the linear pressure
depends on the linear density of the PU core materi-
al and insertion density of the inlaid yarn. She also
reported that extensibility of the socks can be con-
trolled (transversely and longitudinally) by the
increasing or decreasing insertion density of the
inlaid yarn according to requirement [23].
Pressure at Ankle (mm Hg) = 2.03 + 0.3094 MYELD +
+ 0.03681 IYELD – 0.001693 MYELD * MYELD (7)
R-Sq. for the regression equation (1) is 93% which
signifies that 93 % change in compression pressure
at ankle can be explained by the terms included in
the equation.
Effect of elastane linear densities (main and
inlaid) and draft (plated) at calf
Analysis of developed compression socks at calf was
made using statistical software called as MINITAB.
For the statistical importance of the experimental fac-
tors, analysis of variance (ANOVA) tool was applied.
In order to construe whether the parameters were
significant or not, p values were examined. As
known, if the ‘p’ value of a parameter is greater than
0.05 (p > 0.05), the parameter will not be statistically
significant.
The analysis of variance data shown in table 8 indi-
cates that the p-value of main yarn elastane linear
density (MYELD) and inlaid yarn elastane linear den-
sity (IYELD) and plating yarn elastane draft is below
0.05 which depict the significant influence of input
variables on the compression pressure at calf.
Figure 9, 10 and 11 represents the impact of main
yarn elastane linear density, inlaid yarn elastane lin-
ear density and plating yarn elastane draft on the
exertion pressure at the calf.
Main yarn is usually in contact with the skin and
forms the wales and courses in the socks, which
transversely and longitudinally affect the socks size
and compactness of loops in knitted fabric. Figures 9,
124industria textila 2018, vol. 69, nr. 2˘
Source DF Adj. SS Adj. MS F-value P-value
Model 13 224.590 17.2762 25.32 0.003
Linear 5 211.697 42.3394 62.05 0.001
MYELD 2 65.091 32.5453 47.69 *0.002
ILELD 2 141.006 70.5032 103.32 *0.000
PYED 1 5.600 5.6001 8.21 *0.046
Error 4 0.6824 0.6824
Total 17 227.320
Table 8
*Significant variables
Fig. 9. Main effect plot of main yarn elastane linear
density (MYELD), Plating yarn elastane draft (PYED)
and inlaid yarn elastane linear density (IYELD) Vs
compression pressure (mm Hg) at calf
10 and 11 show that as the linear density of the elas-
tane material of main yarn increases from 44 dtex to
78 dtex, the incredible increase in compression pres-
sure from 13 mm Hg to 17 mm Hg takes place. As the
linear density of elastane material increases more
from 78 dtex to 117 dtex, a slight increase in com-
pression pressure at the calf is observed.
Increase in compression pressure from 13 mm Hg to
17 mm Hg is due to increase in fabric contraction.
The fabric density at calf increases as the linear den-
sity of the elastane material increases which gradual-
ly reduces loop length while increasing the stiffness
and compactness of the fabric. As the linear density
of the main yarn elastane material increases, there
occurs a slight decrease in compression pressure.
The reason of increase in compression pressure at
thr calf is an increase in contraction that occurs in
transverse and longitudinal directions.
In this study, we have changed the degree of needles
which decreases from the calf portion (600) of the
socks to ankle portion (300). The higher degree of
needle causes the loose construction of the knitted
fabric. This loose construction of the fabric allows it to
stretch more as compared to the width of the calf.
The socks prepared have the width ranged at calf
from 24.13 mm to 26.67 mm (circumference 76.2 mm
~ 83.82 mm while the wooden dummy used in this
study has a circumference of 37 cm (93.98 mm). This
gradual increase in wooden dummy calf circumfer-
ence shows less compatibility of the socks with the
wooden leg. Consequently, due to the higher circum-
ference of the wooden leg, extensibility of the socks
and compression pressure at calf increases while
increasing the size of pores.
Inlaid yarn has also a significant impact on the com-
pression pressure at the calf. It is depicted from the
figures 9, 10 and 11 that as the linear density of the
inlaid yarn increases from 133 dtex to 155 dtex as a
significant increase in compression pressure from
13 mm Hg to 14 mm Hg take place. It drastically con-
tinues to increase when the linear density of the inlaid
elastane yarn increases from 155 dtex to 330 dtex.
Hence, the intensity of the pressure can be increased
or decreased by increasing or decreasing the degree
of needles and speed of the elastic motor according
to requisite graduation level and to achieve the
desired class of compression level.
Pressure at Calf, mm Hg = –4.77 + 0.2734 MYELD +
+ 0.03171 IYELD + 0.930 PYED –
– 0.001336 MYELD * MYELD (8)
R-Sq. for the regression equation (2) is 92% which
indicates that 92 % change in compression pressure
at calf can be explained by the terms included in the
equation.
CONCLUSIONS
In this study it was concluded that,
• Main yarn elastane linear density (MYELD) has sig-
nificant impact on the compression pressure at the
ankle. As the linear density of the main yarn elastane
material increases from 44 dtex to 78 dtex an
incredible increase in compression pressure from
16 mm Hg to 19 mm Hg takes place at ankle. The
same effect of compression pressure at calf was
observed which was increased from 13 mm Hg to
17 mm Hg and then to 18 mm Hg with consecu-
tively increase of linear density of the main yarn 44
dtex to 78 dtex and then to 117 detx.
• Inlaid yarn elastane linear density (IYELD) has sig-
nificant impact on the compression pressure at the
ankle. As the linear density of inlaid yarn elastane
material linear density increases from 133 dtex to
155 dtex and then to 330 dtex, a significant
increase in compression pressure from 15 mm Hg
to 16 mm Hg and incredible increase to 23 mmHg
at the ankle was observed. The same significant
influence of increase of linear densities of the inlaid
elastane linear density from 133 dtex to 155 dtex
and then to 330 dtex on compression pressure
value at calf portion was observed ranging from
15 mm Hg to 16 mm Hg and then to 21 mm Hg.
125industria textila 2018, vol. 69, nr. 2˘
Fig. 11. Surface plot of main yarn elastane linear density
(MYELD) and plating yarn elastane (PYED) draft
Vs compression pressure (mm Hg) at calf
Fig. 10. Surface plot of main yarn elastane linear density
(MYELD), and Inlaid yarn elastane linear density (IYELD)
Vs compression pressure (mm Hg) at calf
• Plated yarn elastane draft (PYED) has non-signifi-
cant influence on the compression pressure at the
ankle and calf as well. As the draft value of plating
yarn elastane draft increases from 2 to 3.2, a non-
significant change in compression pressure at
ankle from 18 mm Hg to 18.5 mm Hg and at calf
from 16 mm Hg to 17 mm Hg was observed.
• Out of all newly developed V-Shape compression
socks, we segregate them on the basis of gradua-
tion% values which must lies between 60% and
80%. So, on the basis of this abnormality, we reject-
ed all the socks samples that possess graduation
percentage above 80% i.e. 85% to 105% which
cannot be recommended for compression therapy.
For this, we found only the two samples socks,
M1I3P1 and M1I3P2 acquiring excellent graduation
percentages i.e. 76.19 % and 73.91%.
• Finally, we concludedthat only two socks samples
(M1I3P1 and M1I3P2) that acquire maximum com-
pression pressure at the ankle of about 21 mm Hg
and 23 mm Hg along with excellent graduation per-
centages i.e. 76.19% and 73.91%.These socks
samples (M1I3P1 and M1I3P2) can fulfill the com-
pression pressure of class II as per UK, USA, and
EU standards and of compression class III as per
French standards.
ACKNOWLEDGEMENT
This work was supported by the Ministry of Industry and
Trade of the Czech Republic, Programme Trio – project
"Senior Tex – Smart Modular Clothing and Textile Products
with Integrated Electronic Microsystems for Improving the
Health Care of the Aging Population and Handicap
People", reg. no. FV10111 as well as under the project of
Student Grant Scheme SGS-18. Project reference number
is 21246.
126industria textila 2018, vol. 69, nr. 2˘
BIBLIOGRAPHY
[1] Patrice, F., Sophie, B., Jean-Louis, C. Comparative in vitro study of three interface pressure sensors used toevaluate medical compression hosiery. In: Dermatologic Surgery, 2010, vol. 36, issue 12, pp. 1930–40.
[2] Rodica, H., Cristina, P., Cezar Doru, R. A new approach for testing medical stockings. In: Textile Research Journal,
2009, vol. 80, issue 8, pp. 683–695.
[3] Hugo, P. The use of pressure change on standing as a surrogate measure of the stiffness of a compressionbandage. In: European Journal of Vascular and Endovascular Surgery, 2005, vol. pp. 415–421.
[4] Rong, L., Yi Lin, K., Yi. L., Terence T H L., Xin, Z., Xiao Qun, D. Objective evaluation of skin pressure distributionof graduated elastic compression stockings. In: Dermatologic Surgery, 2005, vol. 31, pp. 615–624.
[5] Hugo, P., Bernhard, P., Walter, B. Interface pressure and stiffness of readymade compression stockings:Comparison of in vivo and in vitro measurements. In: Journal of Vascular Surgery, 2006, vol. 44, pp. 809–814.
[6] Bera M., Chattopadhay R., and Gupta D. The effect of fibre blends on comfort characteristics of elastic knittedfabrics used for pressure garments. In: Journal of the Institution of Engineers, 2014, vol. 95, pp. 41–47.
[7] Hugo, P. Do we still need compression bandages haemo-dynamic effects of compression stockings and bandages?Sage, 2006, pp. 21:132–138.
[8] Hui, C.L., Ng, S.F. Model to predict interfacial pressures in multilayer elastic fabric tubes. In: Textile Research
Journal, 2001, vol. 71, issue 8, pp. 683–687.
[9] Hui, C.L., Ng S.F. Pressure model of elastic fabric for producing pressure garments. In: Textile Research Journal,
2001, vol. 71 issue 3, pp. 275–279.
[10] Rong, L., Yi-Lin, K., Terence-T, L., Xin, Z. Effects of material properties and fabric structure characteristics ofgraduated compression stockings (GCS) on the skin pressure distributions. In: Fibers and Polymers, 2005, vol. 6,
issue 4, pp. 322–331.
[11] Gaied, I., Drapier, S., Lun, B. Experimental assessment and analytical 2D predictions of the stocking pressuresinduced on a model leg by Medical Compressive Stockings, In: Journal of Biomechanics, 2006, vol. 39, issue 16,
pp. 3017–25.
[12] Homa, M., Marzie, A., A.H. S., Ali Asghar Asgharian, J. On the pressure behavior of tubular weft knitted fabricsconstructed from textured polyester yarns. In: Journal of Engineered Fibers and Fabrics, 2011, vol. 6, issue 2.
[13] Smith, M.W.L., Dalbey, J.C. Gradient compression hosiery knitted using core spun yarns. In: USA, 7895863 B2,
2011.
[14] Olga, T., Wiah, W., Andrey, K., Chris W., Luca, O. Influence of material properties and garment composition onpressure generated by sport compression garments, In: Procedia Engineering, 2013, vol. 60, pp. 157–162.
[15] Bera, M., Chattopadhay, R., Gupta, D. The effect of fibre blend on comfort characteristics of elastic knitted fabricsused for pressure garments, In: Journal of The Institution of Engineers, 2014, vol. 95, pp: 41–47.
[16] Oğlakcioğlu, N., Sari, B., Bedez, T., Marmarali, A. A novel medical bandage with enhanced clothing comfort, In:
Materials Science and Engineering, 2016, vol. 141, pp. 120–21.
[17] Rong, L., Yi-Lin, K., Yi, L., Terence, T.L. Fabric mechanical-surface properties of compression hosiery and theireffects on skin pressure magnitudes when worn, In: Fibres and Textiles in Eastern Europe, 2010, vol: 18, issue. 2,
pp: 91–97.

127industria textila 2018, vol. 69, nr. 2˘
[18] Yongrong, W., Peihua, Z., Yiping, Z. Experimental investigation the dynamic pressure attenuation of elastic fabric
for compression garment, In: Textile Research Journal, 2014, vol. 84, issue 6, pp. 572–582.
[19] Capurro, S. Sheathed elastic surgical thread, USA,10/543333,2004.
[20] Chimeh, M.Y., Latifi, M. Mojtahedi, M.R.M. Characterizing bulkiness and hairiness of air-jet textured yarn using
imaging techniques. In: Journal of Textile Institute, 2005, vol. 96, pp. 251–255.
Authors:
SIDDIQUE HAFIZ FAISAL1
MAZARI ADNAN1
HAVELKA ANTONIN1
HUSSAIN TANVEER 2
1 Technical University of Liberec, Faculty of Textile Engineering
Studentská 1402/2, 461 17 Liberec 1, Czech Republic
2 National Textile University, Textile Engineering
Sheikhupura Road, Manawala 37610, Faisalabad, Pakistan
e-mail: [email protected], [email protected], [email protected],
[email protected], [email protected]
Corresponding author:
SIDDIQUE HAFIZ FAISAL
e-mail: [email protected]
INTRODUCTION
With the growing of outer space exploration activitiesof human, more and more countries have developedthe extra-large parachutes with nominal area of morethan 1000 square meters. However, the extra-largeparachutes have larger sizes and longer inflation timethan ordinary life-saving parachutes. The undesirableinflation phenomena such as canopy twisting and whip-ping are more vulnerable to appear before removingthe reefing line, and these phenomena may causefailure of recovery. The most typical example is thefourth airdropping experiments of Mars probe’sparachute system in the United States in 2004, andthere were two failed recovery because of the canopywhipping.However, a large number of engineering experimentshave proved that the attached apex drogue can effec-tive suppress the undesirable inflation phenomena[1]. In fact, the attached apex drogues were general-ly used in American Appollo spacecraft, the RussianSoyuz spacecraft and the Chinese Shenzhou space-
craft. But the studies about suppression effect ofattached apex drogue were mostly based on experi-ments and the related theoretical and numerical stud-ies were less. Wang applied a multistage, multi ele-ment and multi freedom dynamic model to study thesuppression effect of attached apex drogue, but thesuppression mechanism based on FSI was not pro-posed [1]. Zhang used CFD/MSD (Computational FluidDynamics/Mass Spring Damper) coupling model tostudy the effect of attached apex drogue on inflationprocess, but this model was only suitable for two-dimensional calculation and couldn’t simulate canopytwisting and whipping. In addition to the CFD/MSDmodel, there have other FSI models such asDSD/SST (Deforming Spatial Domain/StabilizedSpace Time) model, IB (Immersed Boundary) modeland ALE (Arbitrary Eulerian Lagrangian) model canbe used to study parachute’s opening process [2–5].But most of the above models and methods used thefixed computational domain. If those models wereused to calculate the parachute’s airdropping pro-cess, the calculation amount would be larger and the
Suppression mechanism study of attached apex drogue on undesirableinflation phenomena
JUN LI JING YANGHAN CHENG
REZUMAT – ABSTRACT
Studiu asupra mecanismului de suprimare a ancorei apex ataşate asupra fenomenului de umflare nedorită
În prezent, studiile privind efectul de suprimare a ancorei apex ataşate asupra umflării nedorite au fost în mare măsurădependente de experimente. Experimentele au descoperit cu dificultate mecanismul de suprimare din cauza dificultăţiide colectare a datelor. În această lucrare, a fost propus un model FSI (Fluid Structure Interaction) bazat pe o metodăexplicită a elementelor finite pentru a studia mecanismul de suprimare. Metoda grafică de deformare a fost utilizatăpentru a realiza mişcarea domeniului computational. În acelaşi timp, condiţiile de viteză au fost aplicate la limiteledomeniului computaţional, care a fost utilizat pentru a simula câmpul eolian extern. Cuplajul dintre fluid şi structuradescrisă de polinomul de interpolare Lagrange a fost realizat prin algoritmul de contact. În cele din urmă, a fostdezvoltată o paraşută extra mare ca obiect de studiu, iar mecanismul de suprimare a ancorei apex ataşate a fost analizatîn funcţie de rezultatele numerice. Efectul diferitelor ancore apex ataşate cu diferite caracteristici de rezistenta, a fost,de asemenea, analizat de modelul FSI. Modelul şi metoda de analiză propuse în această lucrare ar putea oferi baza deproiectare a paraşutelor extra mari.
Cuvinte-cheie: ţesături fabricate, paraşută extra mare, element finit explicit, metodă numerică, aplicaţii ale textilelor
Suppression mechanism study of attached apex drogue on undesirable inflation phenomena
At present, the studies of suppression effect of attached apex drogue on undesirable inflation were seriously dependenton experiments. The experiments were difficult to reveal the suppression mechanism due to the difficulty of datacollection. In this paper, a FSI (Fluid Structure Interaction) model based on explicit finite element method was proposedto study the suppression mechanism. The graphical deformation method was used to realize the movement ofcomputational domain. At the same time, the velocity conditions were applied on the boundaries of computationaldomain, which was used to simulate the external wind field. The coupling between the fluid and structure described byLagrangian meshes was realized by contact algorithm. Finally, an extra-large parachute was taken as the researchobject, and the suppression mechanism of attached apex drogue was analyzed according to the numerical results. Theeffect of different attached apex drogues with different resistance characteristics also was analyzed by the above FSImodel. The analysis model and method proposed in this paper could provide the design basis of extra-large parachute.
Keywords: engineered fabrics; extra-large parachute; explicit finite element; numerical method; textiles application
128industria textila 2018, vol. 69, nr. 2˘
DOI: 10.35530/IT.069.02.1414
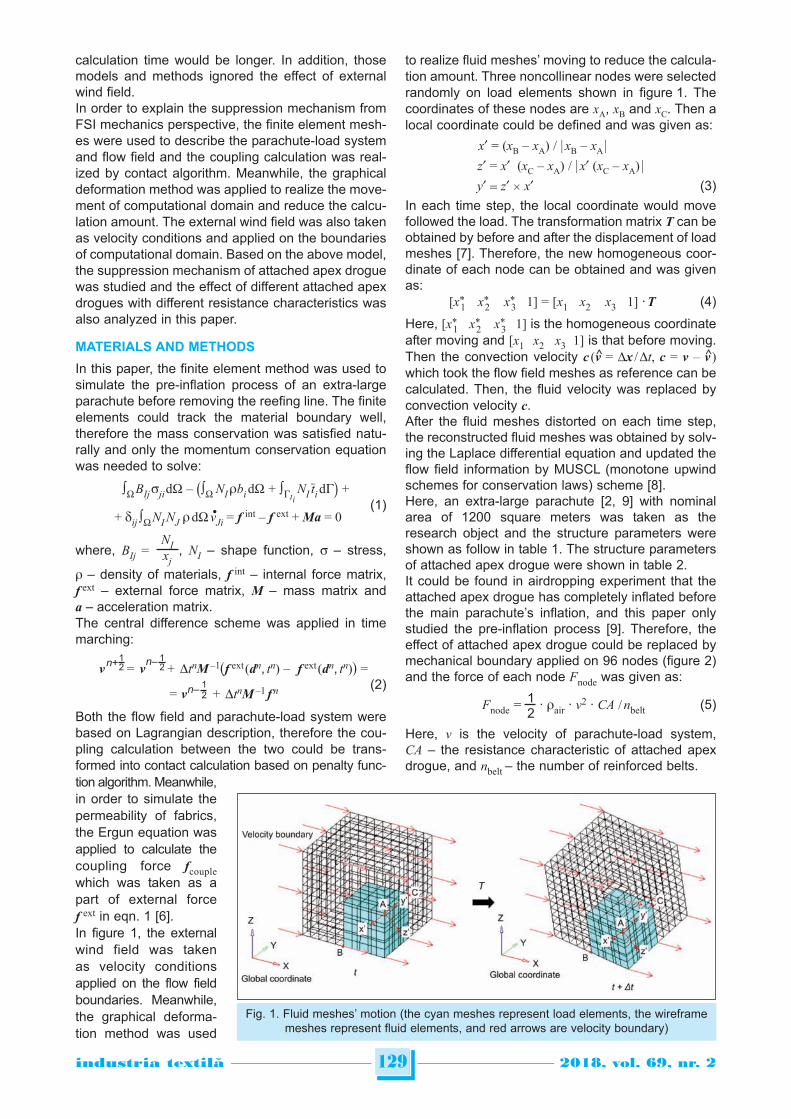
calculation time would be longer. In addition, thosemodels and methods ignored the effect of externalwind field.In order to explain the suppression mechanism fromFSI mechanics perspective, the finite element mesh-es were used to describe the parachute-load systemand flow field and the coupling calculation was real-ized by contact algorithm. Meanwhile, the graphicaldeformation method was applied to realize the move-ment of computational domain and reduce the calcu-lation amount. The external wind field was also takenas velocity conditions and applied on the boundariesof computational domain. Based on the above model,the suppression mechanism of attached apex droguewas studied and the effect of different attached apexdrogues with different resistance characteristics wasalso analyzed in this paper.
MATERIALS AND METHODS
In this paper, the finite element method was used tosimulate the pre-inflation process of an extra-largeparachute before removing the reefing line. The finiteelements could track the material boundary well,therefore the mass conservation was satisfied natu-rally and only the momentum conservation equationwas needed to solve:
∫W BIj sji dW – (∫W NIrbidW + ∫Gti NI tidG) +
+ dij ∫W NINJ r dW vJi = f int – f ext + Ma = 0(1)
NIwhere, BIj = , NI – shape function, s – stress, xjr – density of materials, f int – internal force matrix,f ext – external force matrix, M – mass matrix anda – acceleration matrix.The central difference scheme was applied in timemarching:
1 1n+ n– 2 2v = v + DtnM –1(f ext (dn, tn) – f ext (dn, tn)) =1n– 2= v + DtnM –1 f n
(2)
Both the flow field and parachute-load system werebased on Lagrangian description, therefore the cou-pling calculation between the two could be trans-formed into contact calculation based on penalty func-tion algorithm. Meanwhile,in order to simulate thepermeability of fabrics,the Ergun equation wasapplied to calculate thecoupling force fcouple
which was taken as apart of external forcef ext in eqn. 1 [6].In figure 1, the externalwind field was takenas velocity conditionsapplied on the flow fieldboundaries. Meanwhile,the graphical deforma-tion method was used
to realize fluid meshes’ moving to reduce the calcula-tion amount. Three noncollinear nodes were selectedrandomly on load elements shown in figure 1. Thecoordinates of these nodes are xA, xB and xC. Then alocal coordinate could be defined and was given as:
x = (xB – xA) / |xB – xA |
z = x (xC – xA) / |x (xC – xA) |
y = z × x (3)
In each time step, the local coordinate would movefollowed the load. The transformation matrix T can beobtained by before and after the displacement of loadmeshes [7]. Therefore, the new homogeneous coor-dinate of each node can be obtained and was givenas:
[x*1 x*
2 x*3 1] = [x1 x2 x3 1] ·T (4)
Here, [x*1 x*
2 x*3 1] is the homogeneous coordinate
after moving and [x1 x2 x3 1] is that before moving.Then the convection velocity c (v̂ = Dx / Dt, c = v – v̂ )
which took the flow field meshes as reference can becalculated. Then, the fluid velocity was replaced byconvection velocity c.After the fluid meshes distorted on each time step,the reconstructed fluid meshes was obtained by solv-ing the Laplace differential equation and updated theflow field information by MUSCL (monotone upwindschemes for conservation laws) scheme [8].Here, an extra-large parachute [2, 9] with nominalarea of 1200 square meters was taken as theresearch object and the structure parameters wereshown as follow in table 1. The structure parametersof attached apex drogue were shown in table 2.It could be found in airdropping experiment that theattached apex drogue has completely inflated beforethe main parachute’s inflation, and this paper onlystudied the pre-inflation process [9]. Therefore, theeffect of attached apex drogue could be replaced bymechanical boundary applied on 96 nodes (figure 2)and the force of each node Fnode was given as:
1Fnode = · rair · v2 · CA / nbelt (5)
2
Here, v is the velocity of parachute-load system,CA – the resistance characteristic of attached apexdrogue, and nbelt – the number of reinforced belts.
129industria textila 2018, vol. 69, nr. 2˘
•
Fig. 1. Fluid meshes’ motion (the cyan meshes represent load elements, the wireframemeshes represent fluid elements, and red arrows are velocity boundary)
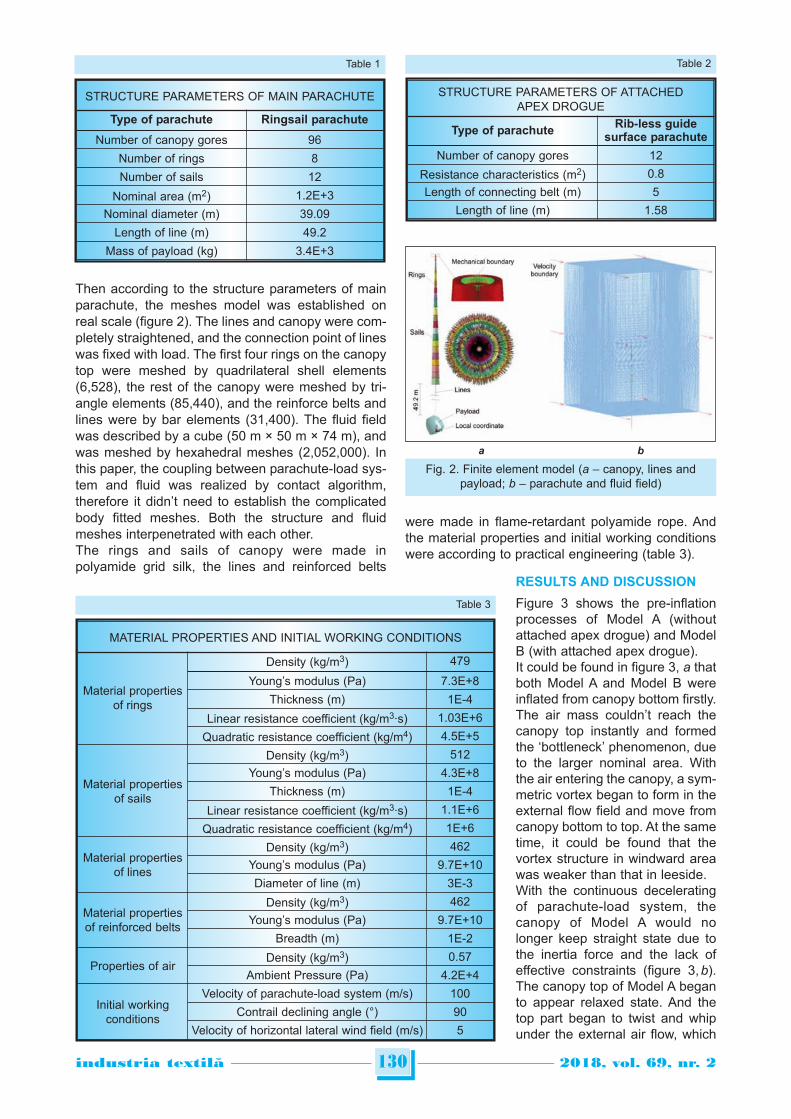
Then according to the structure parameters of mainparachute, the meshes model was established onreal scale (figure 2). The lines and canopy were com-pletely straightened, and the connection point of lineswas fixed with load. The first four rings on the canopytop were meshed by quadrilateral shell elements(6,528), the rest of the canopy were meshed by tri-angle elements (85,440), and the reinforce belts andlines were by bar elements (31,400). The fluid fieldwas described by a cube (50 m × 50 m × 74 m), andwas meshed by hexahedral meshes (2,052,000). Inthis paper, the coupling between parachute-load sys-tem and fluid was realized by contact algorithm,therefore it didn’t need to establish the complicatedbody fitted meshes. Both the structure and fluidmeshes interpenetrated with each other. The rings and sails of canopy were made inpolyamide grid silk, the lines and reinforced belts
were made in flame-retardant polyamide rope. Andthe material properties and initial working conditionswere according to practical engineering (table 3).
RESULTS AND DISCUSSION
Figure 3 shows the pre-inflationprocesses of Model A (withoutattached apex drogue) and ModelB (with attached apex drogue).It could be found in figure 3, a thatboth Model A and Model B wereinflated from canopy bottom firstly.The air mass couldn’t reach thecanopy top instantly and formedthe ‘bottleneck’ phenomenon, dueto the larger nominal area. Withthe air entering the canopy, a sym-metric vortex began to form in theexternal flow field and move fromcanopy bottom to top. At the sametime, it could be found that thevortex structure in windward areawas weaker than that in leeside.With the continuous deceleratingof parachute-load system, thecanopy of Model A would nolonger keep straight state due tothe inertia force and the lack ofeffective constraints (figure 3, b).The canopy top of Model A beganto appear relaxed state. And thetop part began to twist and whipunder the external air flow, which
130industria textila 2018, vol. 69, nr. 2˘
Fig. 2. Finite element model (a – canopy, lines and payload; b – parachute and fluid field)
STRUCTURE PARAMETERS OF MAIN PARACHUTE
Type of parachute Ringsail parachute
Number of canopy gores 96
Number of rings 8
Number of sails 12
Nominal area (m2) 1.2E+3
Nominal diameter (m) 39.09
Length of line (m) 49.2
Mass of payload (kg) 3.4E+3
Table 1
STRUCTURE PARAMETERS OF ATTACHEDAPEX DROGUE
Type of parachuteRib-less guide
surface parachute
Number of canopy gores 12
Resistance characteristics (m2) 0.8
Length of connecting belt (m) 5
Length of line (m) 1.58
Table 2
MATERIAL PROPERTIES AND INITIAL WORKING CONDITIONS
Material propertiesof rings
Density (kg/m3) 479
Young’s modulus (Pa) 7.3E+8
Thickness (m) 1E-4
Linear resistance coefficient (kg/m3·s) 1.03E+6
Quadratic resistance coefficient (kg/m4) 4.5E+5
Material properties of sails
Density (kg/m3) 512
Young’s modulus (Pa) 4.3E+8
Thickness (m) 1E-4
Linear resistance coefficient (kg/m3·s) 1.1E+6
Quadratic resistance coefficient (kg/m4) 1E+6
Material propertiesof lines
Density (kg/m3) 462
Young’s modulus (Pa) 9.7E+10
Diameter of line (m) 3E-3
Material properties of reinforced belts
Density (kg/m3) 462
Young’s modulus (Pa) 9.7E+10
Breadth (m) 1E-2
Properties of airDensity (kg/m3) 0.57
Ambient Pressure (Pa) 4.2E+4
Initial workingconditions
Velocity of parachute-load system (m/s) 100
Contrail declining angle (°) 90
Velocity of horizontal lateral wind field (m/s) 5
Table 3
a b
caused asymmetric inflating. The stress of ‘bottle-neck’ part of Model A presented an asymmetric distri-bution. The above undesirable inflation phenomenacaused the inflation process of Model A was slowerthan Model B. In contrast, the Model B remained astraight state by the effects of constraining force fromthe attached apex drogue. It could be found thatthere were no undesirable inflation phenomena dur-ing inflating, but the ‘bottleneck’ phenomenon stillexisted on Model B. The vortexes of Model A and Bbegan to develop into more complicated and smaller
and gradually separated from the canopy in anasymmetric way. From figure 3, c, it could be found that Model B inflat-ed faster than Model A by the effect of attached apexdrogue. The ‘bottleneck’ phenomenon of Model A andB disappeared after the ‘bottleneck’ moved to thecanopy top and the vent was completely opened. Thevents completely opened could signal the start of fullyinflation stage. With more and more air into thecanopy, both Model A and Model B began to expandfrom the top part the bottom. Finally, the canopieswould remain as shown in figure 3, d because of theconstraint of the reefing lines. After the formation theeffective aerodynamic deceleration area, the vortex-es shedding phenomenon was further aggravated.In this paper, the pre-inflation processes of differentmodels with different resistance characteristics (theresistance characteristic of Model C and D were 1.0 m2
and 1.15 m2 respectively) also were calculated by theabove method and the ‘bottleneck’ phenomena alsowere found in these results. The ‘bottleneck’ causedthe deceleration effect even weakened in pre-infla-tion processes, which was different from the ordinarylife-saving parachutes (figure 4). But the attachedapex drogues avoided the appearance of undesirableinflation phenomena (Model B/C/D), which made thetime of vents’ opening earlier than Model A. It alsocould be found in figure 4 that the bigger the resis-tance characteristic, the earlier the fully inflation begin-ning. In addition, the attached apex drogues werehelpful to reduce the overload, and had a good pro-tective effect on the parachute-payload system.It was worth noting that the canopy body of Model Bwould be more slender after the vent was completelyopened because of the top constraints (figure 3, cand d). And the aerodynamic deceleration area ofModel B was smaller than Model A before removingthe reefing line. Therefore the deceleration effect ofModel A was more obvious than others after the ventwas completely opened. While the other three mod-els had little difference in velocity changes shown infigure 5.
131industria textila 2018, vol. 69, nr. 2˘
Fig. 3. Numerical results of pre-inflation processes
Fig. 4. Acceleration of payload (the green points labeledlowercase letter denote the beginning of fully inflation
stage of four models) Fig. 5. Velocity of payloads
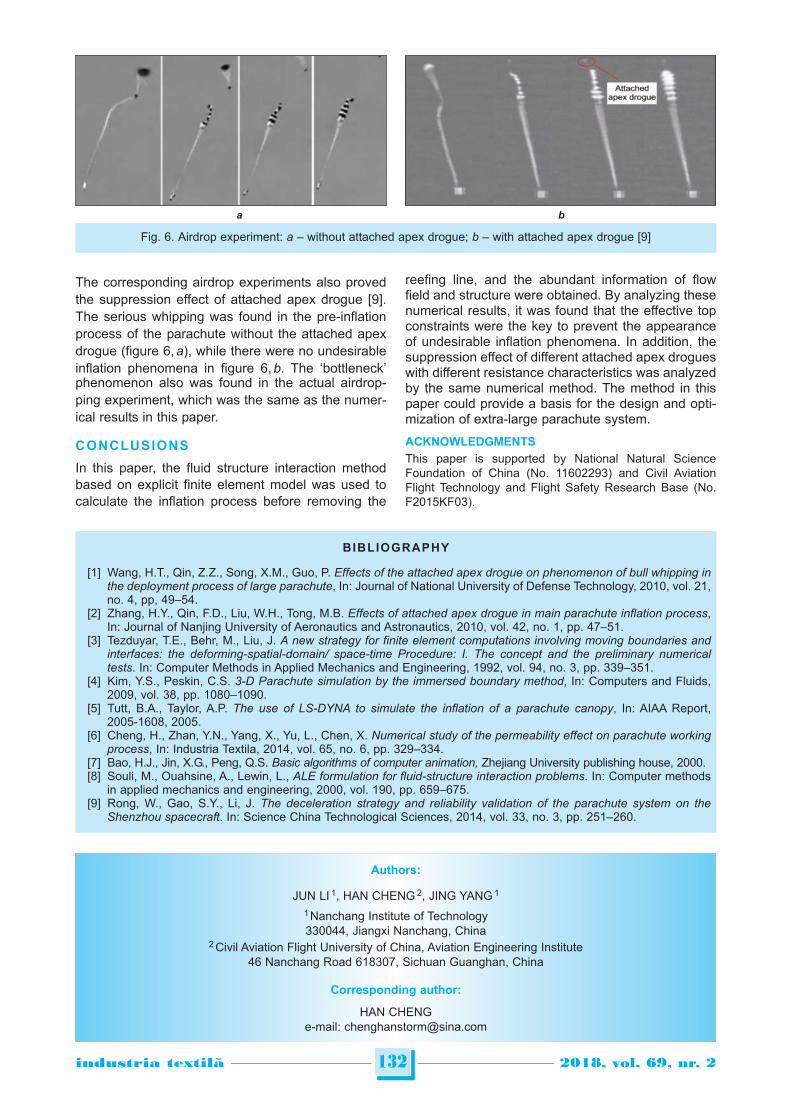
The corresponding airdrop experiments also provedthe suppression effect of attached apex drogue [9].The serious whipping was found in the pre-inflationprocess of the parachute without the attached apexdrogue (figure 6, a), while there were no undesirableinflation phenomena in figure 6, b. The ‘bottleneck’phenomenon also was found in the actual airdrop-ping experiment, which was the same as the numer-ical results in this paper.
CONCLUSIONS
In this paper, the fluid structure interaction methodbased on explicit finite element model was used tocalculate the inflation process before removing the
reefing line, and the abundant information of flowfield and structure were obtained. By analyzing thesenumerical results, it was found that the effective topconstraints were the key to prevent the appearanceof undesirable inflation phenomena. In addition, thesuppression effect of different attached apex drogueswith different resistance characteristics was analyzedby the same numerical method. The method in thispaper could provide a basis for the design and opti-mization of extra-large parachute system.
ACKNOWLEDGMENTS
This paper is supported by National Natural ScienceFoundation of China (No. 11602293) and Civil AviationFlight Technology and Flight Safety Research Base (No.F2015KF03).
132industria textila 2018, vol. 69, nr. 2˘
Fig. 6. Airdrop experiment: a – without attached apex drogue; b – with attached apex drogue [9]
a b
BIBLIOGRAPHY
[1] Wang, H.T., Qin, Z.Z., Song, X.M., Guo, P. Effects of the attached apex drogue on phenomenon of bull whipping inthe deployment process of large parachute, In: Journal of National University of Defense Technology, 2010, vol. 21,no. 4, pp, 49–54.
[2] Zhang, H.Y., Qin, F.D., Liu, W.H., Tong, M.B. Effects of attached apex drogue in main parachute inflation process,In: Journal of Nanjing University of Aeronautics and Astronautics, 2010, vol. 42, no. 1, pp. 47–51.
[3] Tezduyar, T.E., Behr, M., Liu, J. A new strategy for finite element computations involving moving boundaries andinterfaces: the deforming-spatial-domain/ space-time Procedure: I. The concept and the preliminary numericaltests. In: Computer Methods in Applied Mechanics and Engineering, 1992, vol. 94, no. 3, pp. 339–351.
[4] Kim, Y.S., Peskin, C.S. 3-D Parachute simulation by the immersed boundary method, In: Computers and Fluids,2009, vol. 38, pp. 1080–1090.
[5] Tutt, B.A., Taylor, A.P. The use of LS-DYNA to simulate the inflation of a parachute canopy, In: AIAA Report,2005-1608, 2005.
[6] Cheng, H., Zhan, Y.N., Yang, X., Yu, L., Chen, X. Numerical study of the permeability effect on parachute workingprocess, In: Industria Textila, 2014, vol. 65, no. 6, pp. 329–334.
[7] Bao, H.J., Jin, X.G., Peng, Q.S. Basic algorithms of computer animation, Zhejiang University publishing house, 2000.[8] Souli, M., Ouahsine, A., Lewin, L., ALE formulation for fluid-structure interaction problems. In: Computer methods
in applied mechanics and engineering, 2000, vol. 190, pp. 659–675.[9] Rong, W., Gao, S.Y., Li, J. The deceleration strategy and reliability validation of the parachute system on the
Shenzhou spacecraft. In: Science China Technological Sciences, 2014, vol. 33, no. 3, pp. 251–260.
Authors:
JUN LI 1, HAN CHENG 2, JING YANG 1
1 Nanchang Institute of Technology330044, Jiangxi Nanchang, China
2 Civil Aviation Flight University of China, Aviation Engineering Institute46 Nanchang Road 618307, Sichuan Guanghan, China
Corresponding author:
HAN CHENGe-mail: [email protected]
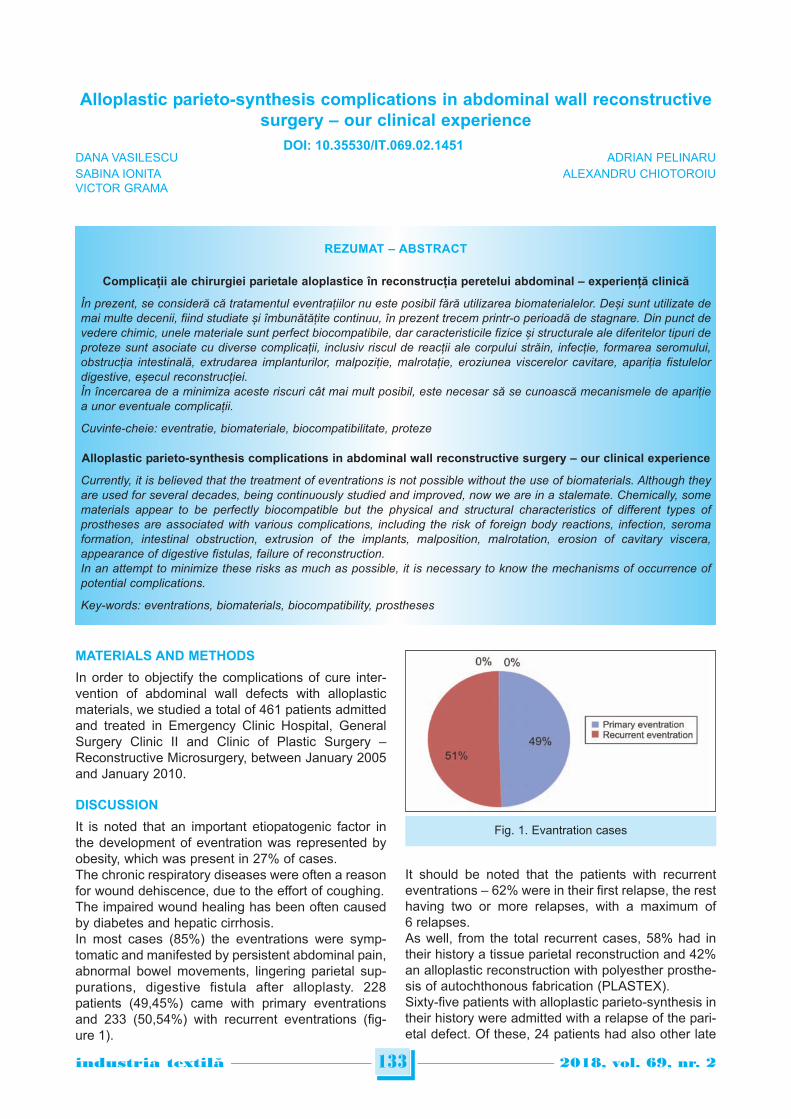
MATERIALS AND METHODS
In order to objectify the complications of cure inter-vention of abdominal wall defects with alloplasticmaterials, we studied a total of 461 patients admittedand treated in Emergency Clinic Hospital, GeneralSurgery Clinic II and Clinic of Plastic Surgery –Reconstructive Microsurgery, between January 2005and January 2010.
DISCUSSION
It is noted that an important etiopatogenic factor inthe development of eventration was represented byobesity, which was present in 27% of cases.The chronic respiratory diseases were often a reasonfor wound dehiscence, due to the effort of coughing.The impaired wound healing has been often causedby diabetes and hepatic cirrhosis.In most cases (85%) the eventrations were symp-tomatic and manifested by persistent abdominal pain,abnormal bowel movements, lingering parietal sup-purations, digestive fistula after alloplasty. 228patients (49,45%) came with primary eventrationsand 233 (50,54%) with recurrent eventrations (fig-ure 1).
It should be noted that the patients with recurrenteventrations – 62% were in their first relapse, the resthaving two or more relapses, with a maximum of6 relapses.As well, from the total recurrent cases, 58% had intheir history a tissue parietal reconstruction and 42%an alloplastic reconstruction with polyesther prosthe-sis of autochthonous fabrication (PLASTEX). Sixty-five patients with alloplastic parieto-synthesis intheir history were admitted with a relapse of the pari-etal defect. Of these, 24 patients had also other late
133industria textila 2018, vol. 69, nr. 2˘
Alloplastic parieto-synthesis complications in abdominal wall reconstructivesurgery – our clinical experience
DANA VASILESCU ADRIAN PELINARUSABINA IONITA ALEXANDRU CHIOTOROIUVICTOR GRAMA
REZUMAT – ABSTRACT
Complicații ale chirurgiei parietale aloplastice în reconstrucția peretelui abdominal – experienţă clinică
În prezent, se consideră că tratamentul eventrațiilor nu este posibil fără utilizarea biomaterialelor. Deși sunt utilizate demai multe decenii, fiind studiate și îmbunătățite continuu, în prezent trecem printr-o perioadă de stagnare. Din punct devedere chimic, unele materiale sunt perfect biocompatibile, dar caracteristicile fizice și structurale ale diferitelor tipuri deproteze sunt asociate cu diverse complicații, inclusiv riscul de reacții ale corpului străin, infecție, formarea seromului,obstrucția intestinală, extrudarea implanturilor, malpoziție, malrotație, eroziunea viscerelor cavitare, apariția fistulelordigestive, eșecul reconstrucției.În încercarea de a minimiza aceste riscuri cât mai mult posibil, este necesar să se cunoască mecanismele de aparițiea unor eventuale complicații.
Cuvinte-cheie: eventratie, biomateriale, biocompatibilitate, proteze
Alloplastic parieto-synthesis complications in abdominal wall reconstructive surgery – our clinical experience
Currently, it is believed that the treatment of eventrations is not possible without the use of biomaterials. Although theyare used for several decades, being continuously studied and improved, now we are in a stalemate. Chemically, somematerials appear to be perfectly biocompatible but the physical and structural characteristics of different types ofprostheses are associated with various complications, including the risk of foreign body reactions, infection, seromaformation, intestinal obstruction, extrusion of the implants, malposition, malrotation, erosion of cavitary viscera,appearance of digestive fistulas, failure of reconstruction.In an attempt to minimize these risks as much as possible, it is necessary to know the mechanisms of occurrence ofpotential complications.
Key-words: eventrations, biomaterials, biocompatibility, prostheses
Fig. 1. Evantration cases
DOI: 10.35530/IT.069.02.1451
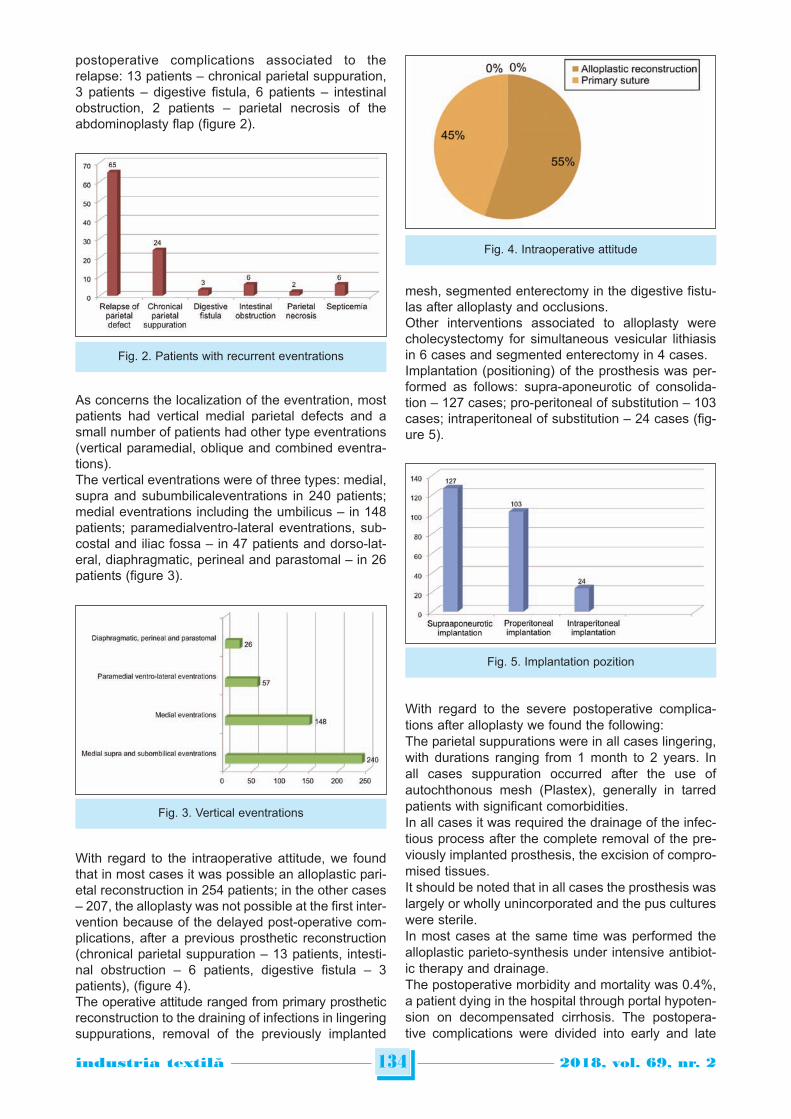
134industria textila 2018, vol. 69, nr. 2˘
postoperative complications associated to therelapse: 13 patients – chronical parietal suppuration,3 patients – digestive fistula, 6 patients – intestinalobstruction, 2 patients – parietal necrosis of theabdominoplasty flap (figure 2).
As concerns the localization of the eventration, mostpatients had vertical medial parietal defects and asmall number of patients had other type eventrations(vertical paramedial, oblique and combined eventra-tions).The vertical eventrations were of three types: medial,supra and subumbilicaleventrations in 240 patients;medial eventrations including the umbilicus – in 148patients; paramedialventro-lateral eventrations, sub-costal and iliac fossa – in 47 patients and dorso-lat-eral, diaphragmatic, perineal and parastomal – in 26patients (figure 3).
With regard to the intraoperative attitude, we foundthat in most cases it was possible an alloplastic pari-etal reconstruction in 254 patients; in the other cases– 207, the alloplasty was not possible at the first inter-vention because of the delayed post-operative com-plications, after a previous prosthetic reconstruction(chronical parietal suppuration – 13 patients, intesti-nal obstruction – 6 patients, digestive fistula – 3patients), (figure 4).The operative attitude ranged from primary prostheticreconstruction to the draining of infections in lingeringsuppurations, removal of the previously implanted
mesh, segmented enterectomy in the digestive fistu-las after alloplasty and occlusions.Other interventions associated to alloplasty werecholecystectomy for simultaneous vesicular lithiasisin 6 cases and segmented enterectomy in 4 cases.Implantation (positioning) of the prosthesis was per-formed as follows: supra-aponeurotic of consolida-tion – 127 cases; pro-peritoneal of substitution – 103cases; intraperitoneal of substitution – 24 cases (fig-ure 5).
With regard to the severe postoperative complica-tions after alloplasty we found the following:The parietal suppurations were in all cases lingering,with durations ranging from 1 month to 2 years. Inall cases suppuration occurred after the use ofautochthonous mesh (Plastex), generally in tarredpatients with significant comorbidities.In all cases it was required the drainage of the infec-tious process after the complete removal of the pre-viously implanted prosthesis, the excision of compro-mised tissues.It should be noted that in all cases the prosthesis waslargely or wholly unincorporated and the pus cultureswere sterile.In most cases at the same time was performed thealloplastic parieto-synthesis under intensive antibiot-ic therapy and drainage.The postoperative morbidity and mortality was 0.4%,a patient dying in the hospital through portal hypoten-sion on decompensated cirrhosis. The postopera-tive complications were divided into early and late
Fig. 2. Patients with recurrent eventrations
Fig. 4. Intraoperative attitude
Fig. 5. Implantation pozition
Fig. 3. Vertical eventrations
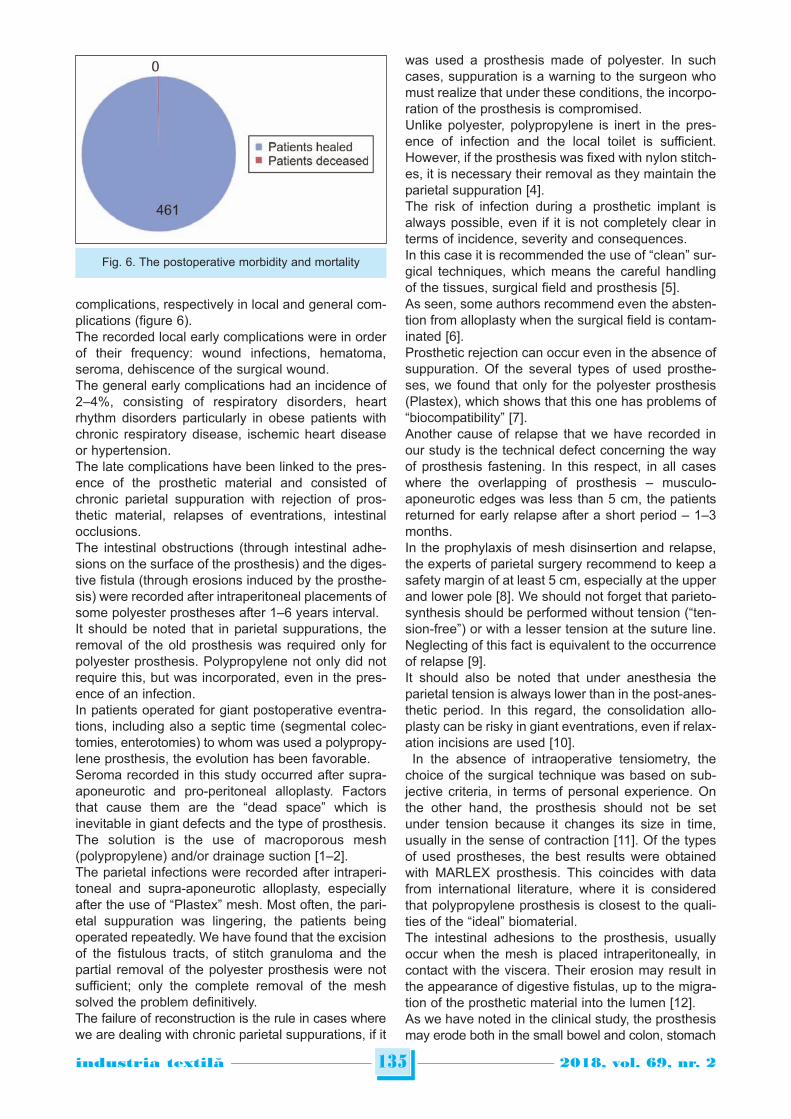
135industria textila 2018, vol. 69, nr. 2˘
complications, respectively in local and general com-plications (figure 6).The recorded local early complications were in orderof their frequency: wound infections, hematoma,seroma, dehiscence of the surgical wound.The general early complications had an incidence of2–4%, consisting of respiratory disorders, heartrhythm disorders particularly in obese patients withchronic respiratory disease, ischemic heart diseaseor hypertension.The late complications have been linked to the pres-ence of the prosthetic material and consisted ofchronic parietal suppuration with rejection of pros-thetic material, relapses of eventrations, intestinalocclusions.The intestinal obstructions (through intestinal adhe-sions on the surface of the prosthesis) and the diges-tive fistula (through erosions induced by the prosthe-sis) were recorded after intraperitoneal placements ofsome polyester prostheses after 1–6 years interval.It should be noted that in parietal suppurations, theremoval of the old prosthesis was required only forpolyester prosthesis. Polypropylene not only did notrequire this, but was incorporated, even in the pres-ence of an infection.In patients operated for giant postoperative eventra-tions, including also a septic time (segmental colec-tomies, enterotomies) to whom was used a poly propy -lene prosthesis, the evolution has been favorable.Seroma recorded in this study occurred after supra-aponeurotic and pro-peritoneal alloplasty. Factorsthat cause them are the “dead space” which isinevitable in giant defects and the type of prosthesis.The solution is the use of macroporous mesh(polypropylene) and/or drainage suction [1–2].The parietal infections were recorded after intraperi-toneal and supra-aponeurotic alloplasty, especiallyafter the use of “Plastex” mesh. Most often, the pari-etal suppuration was lingering, the patients beingoperated repeatedly. We have found that the excisionof the fistulous tracts, of stitch granuloma and thepartial removal of the polyester prosthesis were notsufficient; only the complete removal of the meshsolved the problem definitively.The failure of reconstruction is the rule in cases wherewe are dealing with chronic parietal suppurations, if it
was used a prosthesis made of polyester. In suchcases, suppuration is a warning to the surgeon whomust realize that under these conditions, the incorpo-ration of the prosthesis is compromised.Unlike polyester, polypropylene is inert in the pres-ence of infection and the local toilet is sufficient.However, if the prosthesis was fixed with nylon stitch-es, it is necessary their removal as they maintain theparietal suppuration [4].The risk of infection during a prosthetic implant isalways possible, even if it is not completely clear interms of incidence, severity and consequences.In this case it is recommended the use of “clean” sur-gical techniques, which means the careful handlingof the tissues, surgical field and prosthesis [5].As seen, some authors recommend even the absten-tion from alloplasty when the surgical field is contam-inated [6].Prosthetic rejection can occur even in the absence ofsuppuration. Of the several types of used prosthe-ses, we found that only for the polyester prosthesis(Plastex), which shows that this one has problems of“biocompatibility” [7].Another cause of relapse that we have recorded inour study is the technical defect concerning the wayof prosthesis fastening. In this respect, in all caseswhere the overlapping of prosthesis – musculo-aponeurotic edges was less than 5 cm, the patientsreturned for early relapse after a short period – 1–3months.In the prophylaxis of mesh disinsertion and relapse,the experts of parietal surgery recommend to keep asafety margin of at least 5 cm, especially at the upperand lower pole [8]. We should not forget that parieto-synthesis should be performed without tension (“ten-sion-free”) or with a lesser tension at the suture line.Neglecting of this fact is equivalent to the occurrenceof relapse [9].It should also be noted that under anesthesia theparietal tension is always lower than in the post-anes-thetic period. In this regard, the consolidation allo-plasty can be risky in giant eventrations, even if relax-ation incisions are used [10].In the absence of intraoperative tensiometry, the
choice of the surgical technique was based on sub-jective criteria, in terms of personal experience. Onthe other hand, the prosthesis should not be setunder tension because it changes its size in time,usually in the sense of contraction [11]. Of the typesof used prostheses, the best results were obtainedwith MARLEX prosthesis. This coincides with datafrom international literature, where it is consideredthat polypropylene prosthesis is closest to the quali-ties of the “ideal” biomaterial. The intestinal adhesions to the prosthesis, usuallyoccur when the mesh is placed intraperitoneally, incontact with the viscera. Their erosion may result inthe appearance of digestive fistulas, up to the migra-tion of the prosthetic material into the lumen [12].As we have noted in the clinical study, the prosthesismay erode both in the small bowel and colon, stomach
Fig. 6. The postoperative morbidity and mortality
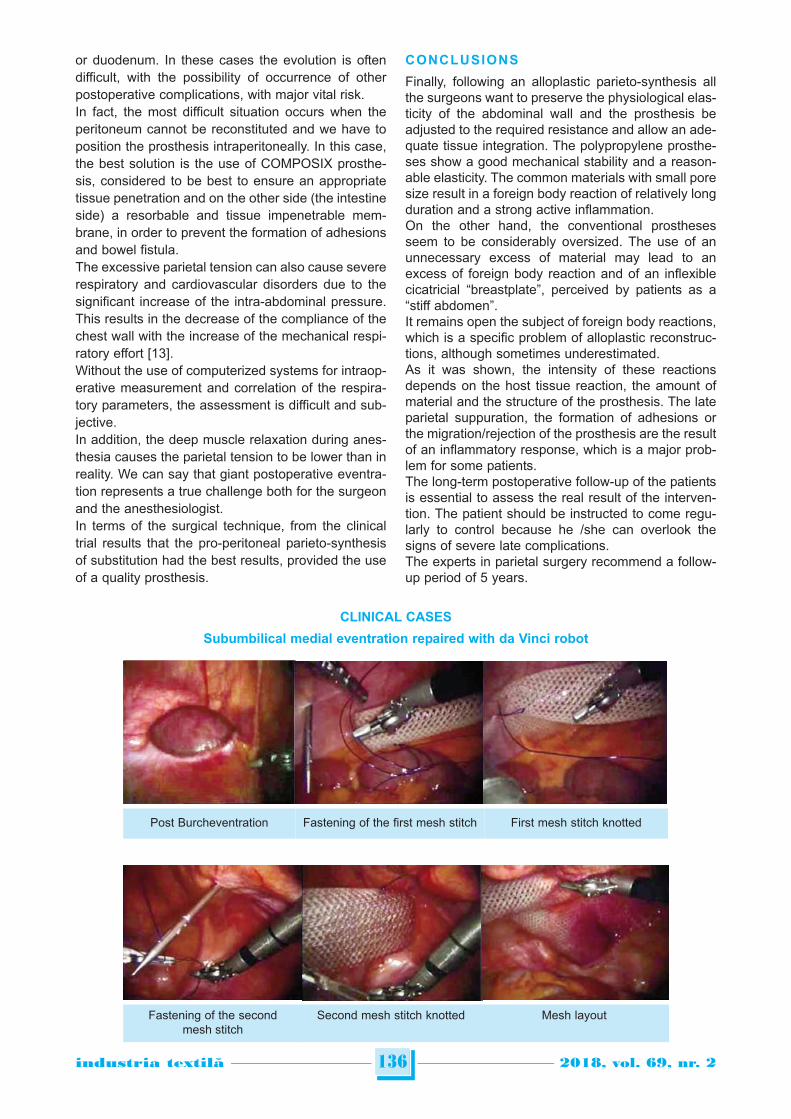
or duodenum. In these cases the evolution is oftendifficult, with the possibility of occurrence of otherpostoperative complications, with major vital risk.In fact, the most difficult situation occurs when theperitoneum cannot be reconstituted and we have toposition the prosthesis intraperitoneally. In this case,the best solution is the use of COMPOSIX prosthe-sis, considered to be best to ensure an appropriatetissue penetration and on the other side (the intestineside) a resorbable and tissue impenetrable mem-brane, in order to prevent the formation of adhesionsand bowel fistula.The excessive parietal tension can also cause severerespiratory and cardiovascular disorders due to thesignificant increase of the intra-abdominal pressure.This results in the decrease of the compliance of thechest wall with the increase of the mechanical respi-ratory effort [13].Without the use of computerized systems for intraop-erative measurement and correlation of the respira-tory parameters, the assessment is difficult and sub-jective.In addition, the deep muscle relaxation during anes-thesia causes the parietal tension to be lower than inreality. We can say that giant postoperative eventra-tion represents a true challenge both for the surgeonand the anesthesiologist.In terms of the surgical technique, from the clinicaltrial results that the pro-peritoneal parieto-synthesisof substitution had the best results, provided the useof a quality prosthesis.
CONCLUSIONS
Finally, following an alloplastic parieto-synthesis allthe surgeons want to preserve the physiological elas-ticity of the abdominal wall and the prosthesis beadjusted to the required resistance and allow an ade-quate tissue integration. The polypropylene prosthe-ses show a good mechanical stability and a reason-able elasticity. The common materials with small poresize result in a foreign body reaction of relatively longduration and a strong active inflammation.On the other hand, the conventional prosthesesseem to be considerably oversized. The use of anunnecessary excess of material may lead to anexcess of foreign body reaction and of an inflexiblecicatricial “breastplate”, perceived by patients as a“stiff abdomen”.It remains open the subject of foreign body reactions,which is a specific problem of alloplastic reconstruc-tions, although sometimes underestimated.As it was shown, the intensity of these reactionsdepends on the host tissue reaction, the amount ofmaterial and the structure of the prosthesis. The lateparietal suppuration, the formation of adhesions orthe migration/rejection of the prosthesis are the resultof an inflammatory response, which is a major prob-lem for some patients.The long-term postoperative follow-up of the patientsis essential to assess the real result of the interven-tion. The patient should be instructed to come regu-larly to control because he /she can overlook thesigns of severe late complications.The experts in parietal surgery recommend a follow-up period of 5 years.
136industria textila 2018, vol. 69, nr. 2˘
CLINICAL CASES
Subumbilical medial eventration repaired with da Vinci robot
Post Burcheventration Fastening of the first mesh stitch First mesh stitch knotted
Fastening of the secondmesh stitch
Second mesh stitch knotted Mesh layout
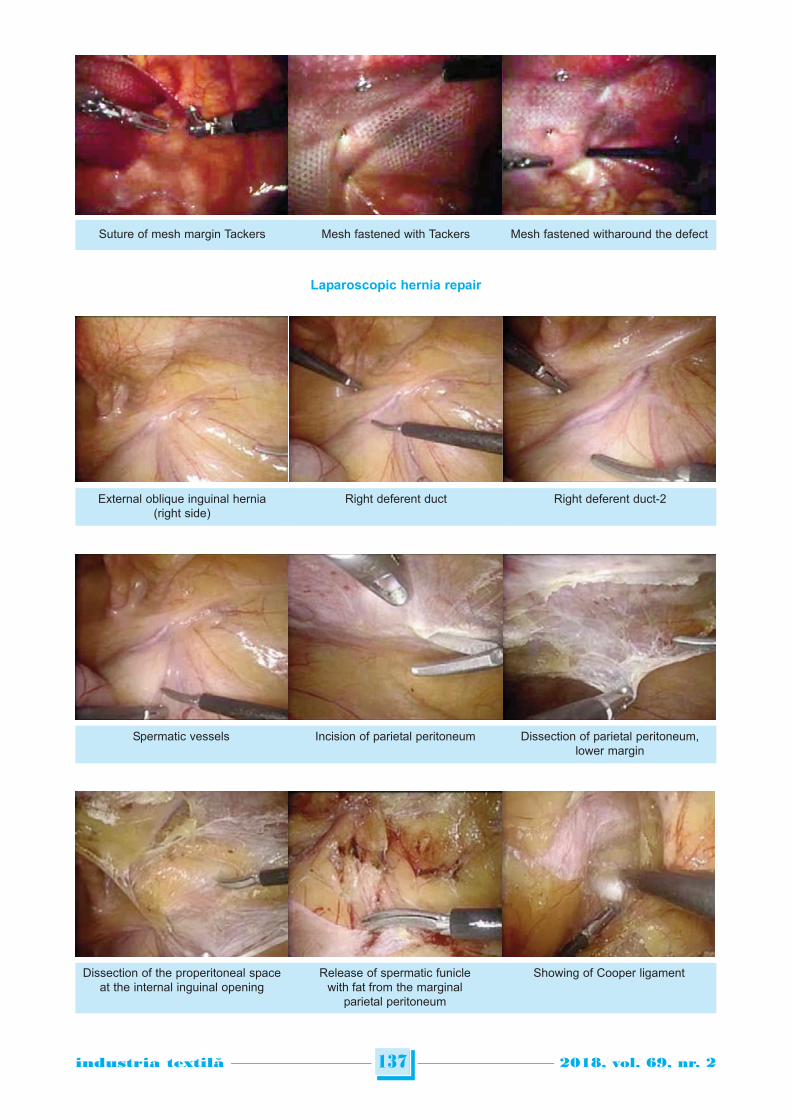
Laparoscopic hernia repair
137industria textila 2018, vol. 69, nr. 2˘
Suture of mesh margin Tackers Mesh fastened with Tackers Mesh fastened witharound the defect
External oblique inguinal hernia(right side)
Right deferent duct Right deferent duct-2
Spermatic vessels Incision of parietal peritoneum Dissection of parietal peritoneum,lower margin
Dissection of the properitoneal spaceat the internal inguinal opening
Release of spermatic funiclewith fat from the marginal
parietal peritoneum
Showing of Cooper ligament
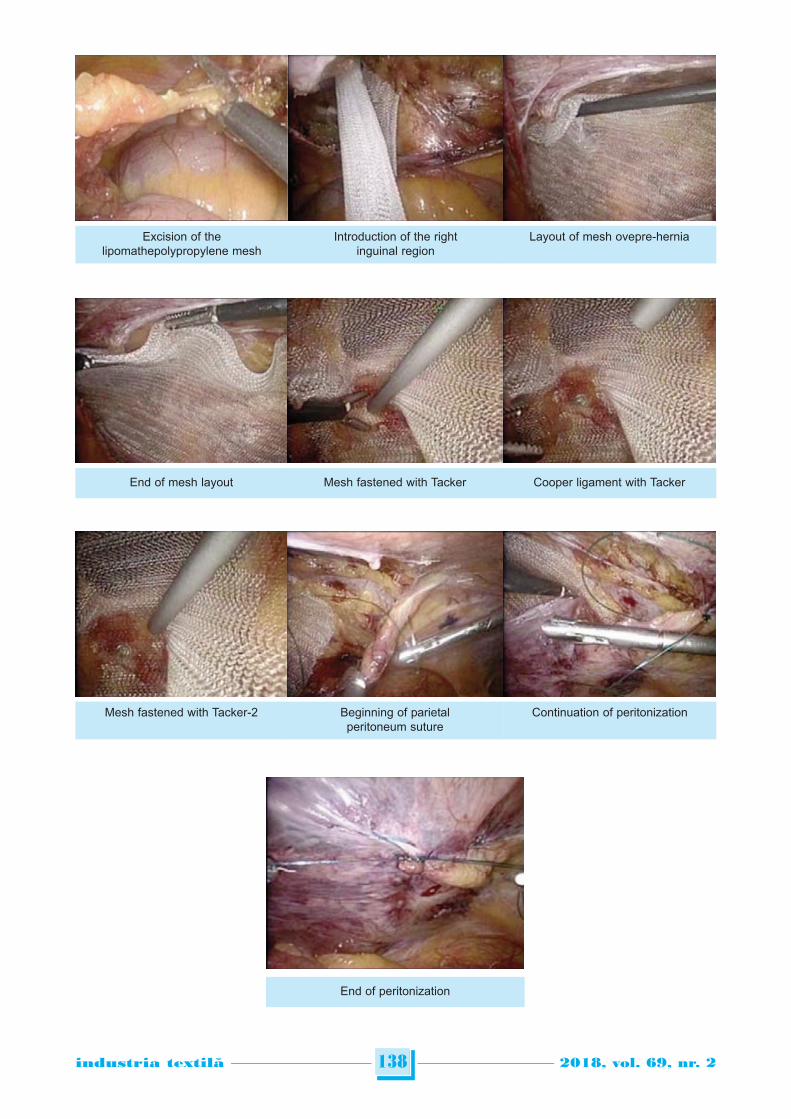
138industria textila 2018, vol. 69, nr. 2˘
Excision of thelipomathepolypropylene mesh
End of peritonization
Introduction of the rightinguinal region
Layout of mesh ovepre-hernia
End of mesh layout Mesh fastened with Tacker Cooper ligament with Tacker
Mesh fastened with Tacker-2 Beginning of parietalperitoneum suture
Continuation of peritonization
139industria textila 2018, vol. 69, nr. 2˘
Authors:
Dr. DANA VASILESCU 1,
Dr. SABINA IONITA 1,
Dr. VICTOR GRAMA 2,
Dr. ADRIAN PELINARU 1,
Dr. ALEXANDRU LAURENTIU CHIOTOROIU 2
1 Plastic and Reconstructive Surgery – Floreasca Hospital Emergency Bucharest Romania
2 General Surgery – Floreasca Hospital Emergency Bucharest RomaniaAll authors had equal contribution to this article
Corresponding author:
Dr. DANA VASILESCUe-mail: [email protected]
BIBLIOGRAPHY
[1] Feliciano, A., Bartonem G., Fei, L. Incisional hernia, Springer Verlag, 2008.
[2] Boissel, P., Proye, C. Patologie chirurgicale, Ed. Masson, 1991.
[3] Burgard, G., Marmorale, A., Cuilleret, J. Traitement des grandes éventrations abdominales par plaqueintrapéritonéale agrafée, In: J. Chir. (Paris), 1994.
[4] Ciurea, M. Texturi sintetice în chirurgia reparatorie a peretelui abdominal, In: Chirurgia, 1998.
[5] Deac, D. Utilizarea protezelor sintetice în chirurgia defectelor peretelui antero-lateral. Ed. Clusium, 1999.
[6] Delay, E., Rivoire, M., Bobin, J.Y., Frane, C. Réconstruction des vastes pertes de substance de la paroi abdominaleinférieure, In: Lyon Chir., 1993.
[7] Gould, B. Collagen biosynthesis in wound healing, USA National Research Council 1996.
[8] Slim, K., Pezet, D., Chipponi, J. Les grandes éventrations de la paroi abdominale: un technique de plastieaponevrotique associée à une prothèse. In: Presse Med., 1994.
[9] Soler, M., Verhaeghe, P., Essomba, A., Sevestre, N., Stoppa, R. Treatment of postoperative incisional hernias by acomposite prosthesis (polyester – polygalactin 910). Clinical and experimental study. In: Ann. Chir., 1993.
[10] Stoppa, R., Henry, X., Abet, D., Verhaeghe, P., Largueche, S. Que faire devant une éventration post-opératoire. In:Cah. Med., 1979.
[11] Stoppa, R., Moungar, F., Verhaeghe, P. Traitement chirurgical des éventrations medianes sus-ombilicales. In:J.Chir., 1992.
[12] Schwartz, G., Brunicardi, F., Andersen, D., Billiar, T., Dunn, D., Hunter, J., Matthews, J., Pollok, R. Principles ofSurgery, 9th Edition 2009.
[13] Voinchet, V., Aubert, J.P., Berthet, B., Mulfinger-Audiffret, C. Apport de la plastie abdominale dans le traitement deséventrations non-compliquées de la paroi abdominale. In: J.Chir. (Paris), 1994.
INTRODUCTION
Works in process and throughput time in apparelmanufacturing processes are important performanceindicators relating directly to plant productivity. Theseparameters, significant to all industrial manufacturingprocesses, are especially critical in apparel manufac-turing, an industry marked by seasonal product linesand the necessity for rapid changes in colour, styleand material. Rapid throughput time can often be thevital competitive edge in a successful manufacturingbusiness [1]. In order to respond promptly to cus-tomer demands, it is of critical importance to shortenlead times. It was shown that application of lean man-ufacturing technique shortens work in process andpositively affects manufacturing cost and lead times[2]. To shorten lead times, and increase flexibility,some apparel companies, besides converting to newmanufacturing systems also make use of IT tech-nology [3]. There are number of factors affectingthroughput time and work in process, and companiesuse various manual techniques or software for theircalculation. Garment industry often confronts a majorissue of very high lead times despites it short lifecycle and unpredictable demand [4]. Buying cycle forthe garment products starts generally a year inadvance and the garment companies place and pro-cess their manufacturing orders 6 months to one yearahead of the coming seasons when the product isactually required and should be available in the
stores for the sales [3, 5]. Higher lead time reducesthe responsiveness and increases the chances ofhigh inventory holding and therefore, problem ofoverstocking. Time-based competition focuses ontime reduction; it also accomplishes substantialimprovements in costs, quality, and productivity.Blackburn [6] and Stalk and Hout [7], describe casestudies where manufacturing firms which managed tocompress lead time by redesigning their businessprocesses, achieved higher productivity, increasedmarket share, reduced risk level, and improvedcustomer service. Time-based manufacturing is aweapon for time based competitors. Time-basedmanufacturers implement a set of work practicesdesigned to reduce throughput time. A literaturereview identified seven key practices including: shop-floor employee involvement in problem solving,reengineering setups, cellular manufacturing, qualityimprovement efforts, preventive maintenance, depend-able suppliers, and pull production approaches[8–10]. Many of these time-based practices are keyelements of just-in-time (JIT) philosophy as definedby Monden [11]. In fact, Abegglen and Stalk [12]observed that some JIT innovators became the firsttime-based competitors as their emphasis on speedboost their skills in time reduction throughout thevalue-delivery system. Case studies illustrate howsome manufacturing firms have applied these seventime-based practices to cut response time and
Throughput time analysis in apparel manufacturing
GORAN DEMBOSKI MAJA JANKOSKA
REZUMAT – ABSTRACT
Analiza timpului de producție în fabricarea confecțiilor
Timpul de producție este investigat pentru linia de asamblare a cămășilor pentru bărbați în companiile producătoare deconfecții. Comparația se face între timpul calculat teoretic și cel real. Timpul de producție teoretic se calculează printimpii de întârziere la pornire, timpii de întârziere și timpii de circulaţie a semifabricatelor între perechile succesive deoperațiuni ale traseului critic ale fluxului de productie. Se evaluează influența mărimii lotului de semifabricate asupratimpului de producție și a procesului de lucru. Comparația dintre timpul estimat și cel real, arată că timpul estimat a fostcu 10% mai mic decât cel experimental. Evaluarea efectului dimensiunii lotului de semifabricate pe parcursul întreguluitimp de producție și al procesului de lucru demonstrează că mărimea acestuia, poate avea o mare influență asupraflexibilității și competitivității companiei producătoare de confecții.
Cuvinte-cheie: inventar în timpul procesului, mărimea lotului, proces de lucru, linie de asamblare
Throughput time analysis in apparel manufacturing
Throughput time is investigated for men’s shirt assembly line in garment manufacturing company. The comparison ismade between theoretically calculated and actual throughput time. The theoretical throughput time is calculated viastarting lag times, lag times and bundle times between succeeding pairs of operations of the product flow process gridcritical path. The influence of bundle size on throughput time and work in process is evaluated. The comparison ofpredicted and actual throughput time shows that predicted time was 10% lesser than experimental one. The evaluationof bundle size effect on throughout time and work in process shows that the bundle size can have great influence oncompany flexibility and competiveness.
Keywords: inventory in process time, bundle size, work in process, assembly line
140industria textila 2018, vol. 69, nr. 2˘
DOI: 10.35530/IT.069.02.1450
enhance competitiveness [6, 13]. However, large-scale empirical studies that investigate the relation-ships between these manufacturing practices andthroughput time are unavailable. Many firms strugglein their attempts to reduce manufacturing throughputtime, while the factor changes that can reduce man-ufacturing throughput time are not always understood[14]. While manufacturing throughput time reductioncan indeed be a overwhelming task due to the manyfactors that influence it and their complex interac-tions, there are basic principles that, when appliedcorrectly, can be used to reduce manufacturingthroughput time. To apply the principles correctly, thebasic factors that determine manufacturing through-put time must be clearly understood. The existence ofa certainly determined number of steps in the textilemanufacturing process development makes ade-quate to approach the optimization of this processwith stochastic procedures theory. In that case, someauthors design a suitable Markov chain that shapesthe production and they show how it can be appliedfor estimating manufacturing times. At the same time,they describe the computer software for processingpractical numerical data from specific cases [15].The paper investigates possibilities of predictingthroughput time in shirt manufacturing company andcompares predicted and the actual throughput time,using starting lag time formula for calculation ofthroughput time. Also, the influence of bundle size onthroughput time and work in process is analysed.
EXPERIMENTAL WORK
The product analyzed is a men’s long sleeve dressshirt. The movement of the bundle in real productionis monitored through all the critical path operations ofthe men’s shirt flow process grid. Experimentalthroughput time is compared to calculated throughputtime. For the calculation of throughput time for com-plete balanced manufacturing line, the starting lagtime (further in text SLT) formula is employed [16].SLT is the time lag which is unproductive time whenthe operator of the succeeding operation waits tostart working since the operator on preceding opera-tion have started working on bundle. Along withnumerical calculation, the graphical block method forthe calculation of the starting lag time is also applied.Using starting lag time (SLT) equations, throughputtime and work in process, is calculated for variousbundle sizes. SLT concept assumes production lineto work with minimum work in process needed to pre-vent creation of bottlenecks, i.e. the situations wheresucceeding operator must wait the preceding one, tofinish the bundle before transferring job to next oper-ation. Depending on the defining operations on timelevel in flow process grid, there are 4 types of jobsequence relationship possible situations andrespective SLT calculations:1. Situation where smaller number of operators sup-
ply larger one: SLT = LTU (n1 + n2 – 1) (1)
where: n1 and n2 are the number of operators infirst and successive job respectively, LTU – lagtime unit – represents the ratio between bundletime and the number of operators.
2. Situation where larger group of operators supplysmaller one: SLT = LTU (n1 + n2 – 1).
3. Situation where the number of operators in twosuccessive jobs is equal: SLT is equal to bundletime.
4. Situation where the ratio between numbers ofoperators in two successive jobs is whole integerwhich yields a fraction composed of two wholenumbers where one of which is 1: SLT is equal tolarger bundle time.
Before starting calculation of SLT, we must define thecritical path or the longest SLT path containingsequential operations on the product flow processgrid which have largest time sum when moving thejob through all time levels of flow process grid. Thispath will determine throughput time through assem-bly line. Minimum throughput time is calculated bysumming the SLT values of all the pairs of successivejobs of the longest SLT path in flow process grid andadding the bundle time of the critical path last opera-tion. Work in process is calculated when inventory inprocess time is multiplied by line output per hour.
RESULTS AND DISCUSSION
As suggested by Solinger [16], if we want technolog-ical map in the process to be an effective tool forplanning, it must be designed with the concept ofmathematical graphics with the formation of networksin the Y-axis and X-axis, where Y-axis represents thetimeline of the production system while the length ofthe spatial line the production process and layout ofequipment. This timeline’s measured, represents thetemporal relationship that exists between the work-places and places for temporary storage during pro-duction. Y-axis also represents the longitudinal spaceconnection between different workplaces and placesfor temporary storage. X-axis also represents the lat-eral connection between workplaces and places fortemporary storage. The work flows from the bottom ofthe graph, (the first level of time i.e. initial), to theupper part of the graphics till the final level of the time(last operation). Figure 1 shows a flow network of production processof men’s shirts for a bundle size of 50 pieces. Theassembly of the men’s shirt is done through one mainand 5 subassembly lines. For this case, the longestSLT path in flow process greed is sequence of oper-ations in front subassembly line from A1 to F10. Thisis so because the time for this job sequence haslongest times sum of all the parallel paths. Total production time is equal to the sum of all time atthe level of the Y-axis on the critical path. Time ineach level is equal to the time required to produce acertain quantity of production units. Production equip-ment and workers at the workplace in the graph willbe equal to those which are necessary to produce therequired amount per unit time at a given level.
141industria textila 2018, vol. 69, nr. 2˘
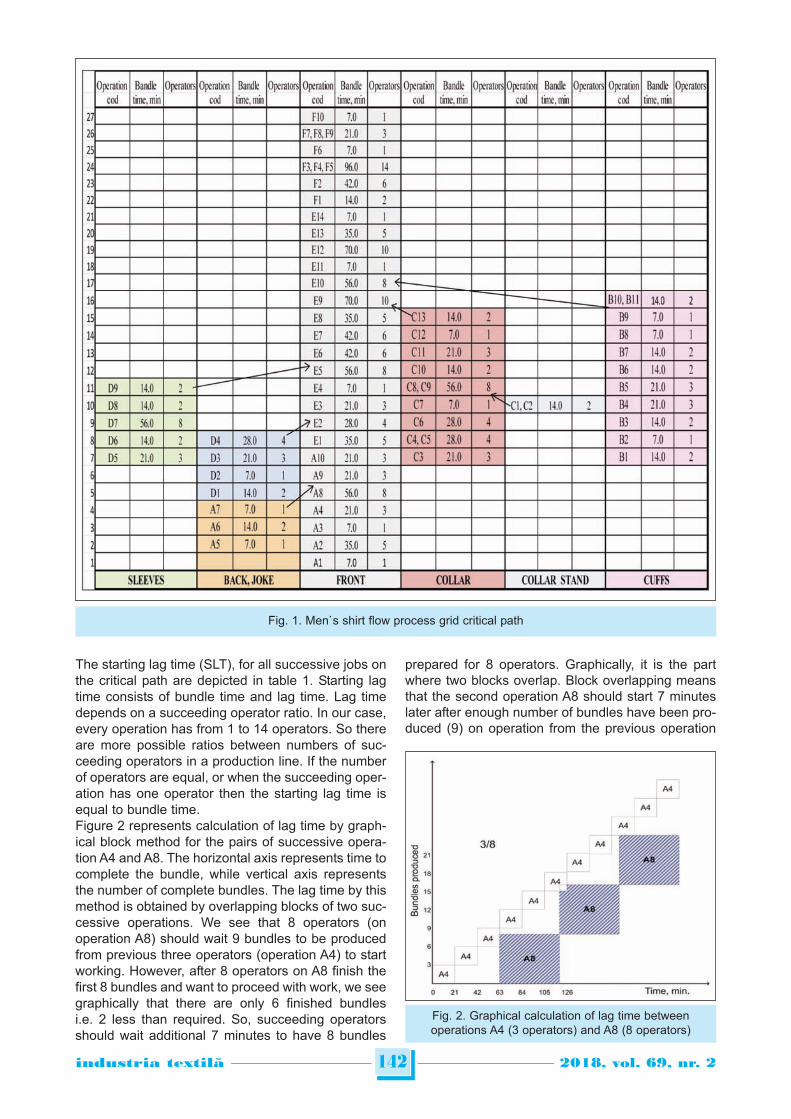
The starting lag time (SLT), for all successive jobs onthe critical path are depicted in table 1. Starting lagtime consists of bundle time and lag time. Lag timedepends on a succeeding operator ratio. In our case,every operation has from 1 to 14 operators. So thereare more possible ratios between numbers of suc-ceeding operators in a production line. If the numberof operators are equal, or when the succeeding oper-ation has one operator then the starting lag time isequal to bundle time.Figure 2 represents calculation of lag time by graph-ical block method for the pairs of successive opera-tion A4 and A8. The horizontal axis represents time tocomplete the bundle, while vertical axis representsthe number of complete bundles. The lag time by thismethod is obtained by overlapping blocks of two suc-cessive operations. We see that 8 operators (onoperation A8) should wait 9 bundles to be producedfrom previous three operators (operation A4) to startworking. However, after 8 operators on A8 finish thefirst 8 bundles and want to proceed with work, we seegraphically that there are only 6 finished bundlesi.e. 2 less than required. So, succeeding operatorsshould wait additional 7 minutes to have 8 bundles
prepared for 8 operators. Graphically, it is the partwhere two blocks overlap. Block overlapping meansthat the second operation A8 should start 7 minuteslater after enough number of bundles have been pro-duced (9) on operation from the previous operation
142industria textila 2018, vol. 69, nr. 2˘
Fig. 1. Men`s shirt flow process grid critical path
Fig. 2. Graphical calculation of lag time betweenoperations A4 (3 operators) and A8 (8 operators)
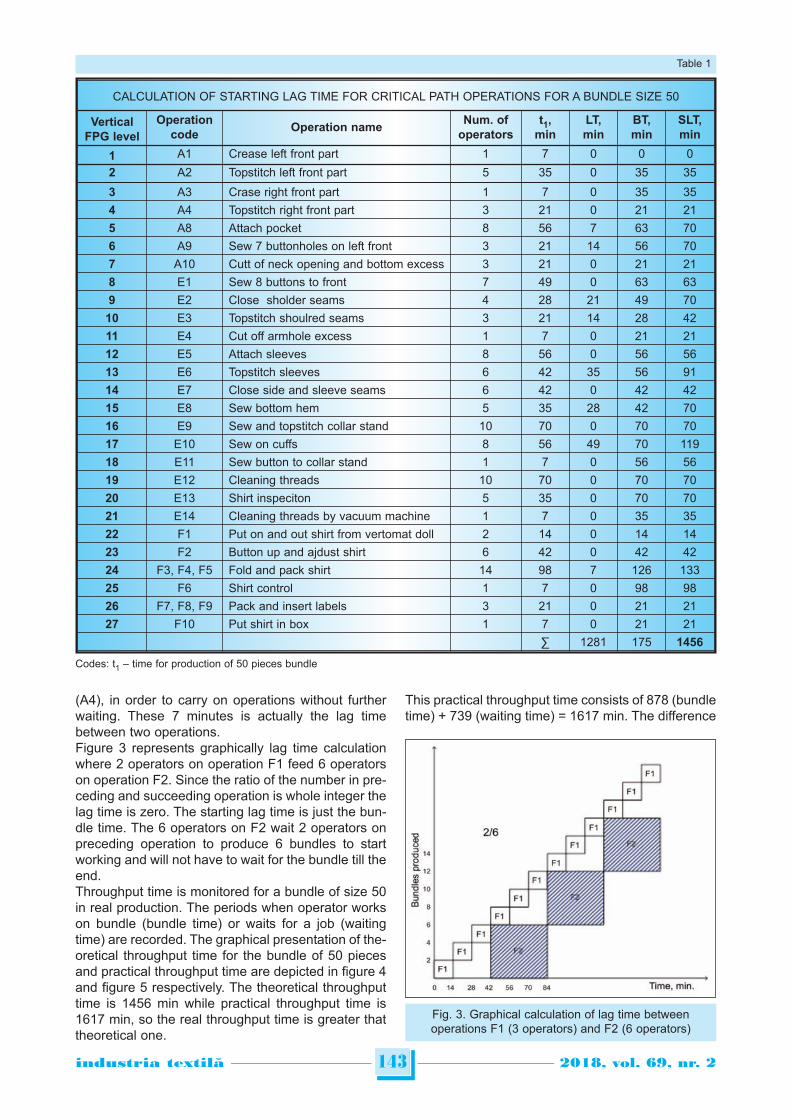
(A4), in order to carry on operations without furtherwaiting. These 7 minutes is actually the lag timebetween two operations. Figure 3 represents graphically lag time calculationwhere 2 operators on operation F1 feed 6 operatorson operation F2. Since the ratio of the number in pre-ceding and succeeding operation is whole integer thelag time is zero. The starting lag time is just the bun-dle time. The 6 operators on F2 wait 2 operators onpreceding operation to produce 6 bundles to startworking and will not have to wait for the bundle till theend.Throughput time is monitored for a bundle of size 50in real production. The periods when operator workson bundle (bundle time) or waits for a job (waitingtime) are recorded. The graphical presentation of the-oretical throughput time for the bundle of 50 piecesand practical throughput time are depicted in figure 4and figure 5 respectively. The theoretical throughputtime is 1456 min while practical throughput time is1617 min, so the real throughput time is greater thattheoretical one.
This practical throughput time consists of 878 (bundletime) + 739 (waiting time) = 1617 min. The difference
143industria textila 2018, vol. 69, nr. 2˘
CALCULATION OF STARTING LAG TIME FOR CRITICAL PATH OPERATIONS FOR A BUNDLE SIZE 50
VerticalFPG level
Operationcode
Operation nameNum. of
operatorst1,
minLT,min
BT,min
SLT,min
1 A1 Crease left front part 1 7 0 0 0
2 A2 Topstitch left front part 5 35 0 35 35
3 A3 Crase right front part 1 7 0 35 35
4 A4 Topstitch right front part 3 21 0 21 21
5 A8 Attach pocket 8 56 7 63 70
6 A9 Sew 7 buttonholes on left front 3 21 14 56 70
7 A10 Cutt of neck opening and bottom excess 3 21 0 21 21
8 E1 Sew 8 buttons to front 7 49 0 63 63
9 E2 Close sholder seams 4 28 21 49 70
10 E3 Topstitch shoulred seams 3 21 14 28 42
11 E4 Cut off armhole excess 1 7 0 21 21
12 E5 Attach sleeves 8 56 0 56 56
13 E6 Topstitch sleeves 6 42 35 56 91
14 E7 Close side and sleeve seams 6 42 0 42 42
15 E8 Sew bottom hem 5 35 28 42 70
16 E9 Sew and topstitch collar stand 10 70 0 70 70
17 E10 Sew on cuffs 8 56 49 70 119
18 E11 Sew button to collar stand 1 7 0 56 56
19 E12 Cleaning threads 10 70 0 70 70
20 E13 Shirt inspeciton 5 35 0 70 70
21 E14 Cleaning threads by vacuum machine 1 7 0 35 35
22 F1 Put on and out shirt from vertomat doll 2 14 0 14 14
23 F2 Button up and ajdust shirt 6 42 0 42 42
24 F3, F4, F5 Fold and pack shirt 14 98 7 126 133
25 F6 Shirt control 1 7 0 98 98
26 F7, F8, F9 Pack and insert labels 3 21 0 21 21
27 F10 Put shirt in box 1 7 0 21 21
∑ 1281 175 1456
Table 1
Codes: t1 – time for production of 50 pieces bundle
Fig. 3. Graphical calculation of lag time betweenoperations F1 (3 operators) and F2 (6 operators)
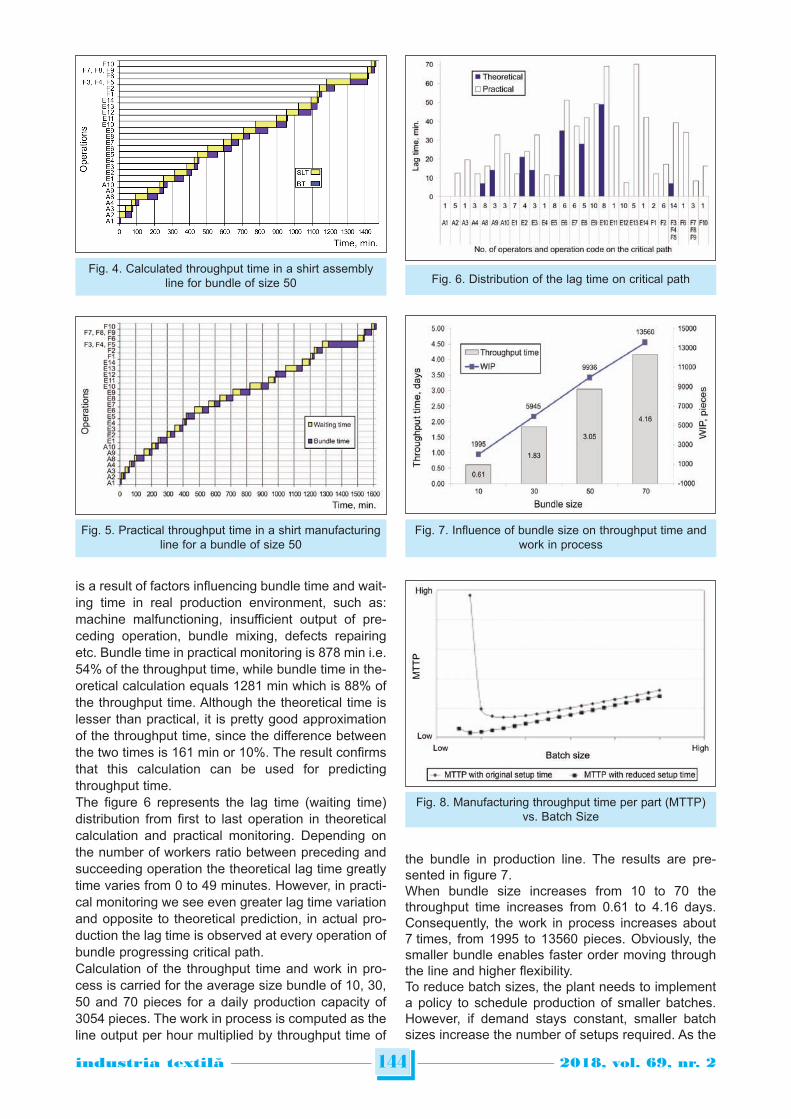
is a result of factors influencing bundle time and wait-ing time in real production environment, such as:machine malfunctioning, insufficient output of pre-ceding operation, bundle mixing, defects repairingetc. Bundle time in practical monitoring is 878 min i.e.54% of the throughput time, while bundle time in the-oretical calculation equals 1281 min which is 88% ofthe throughput time. Although the theoretical time islesser than practical, it is pretty good approximationof the throughput time, since the difference betweenthe two times is 161 min or 10%. The result confirmsthat this calculation can be used for predictingthroughput time. The figure 6 represents the lag time (waiting time)distribution from first to last operation in theoreticalcalculation and practical monitoring. Depending onthe number of workers ratio between preceding andsucceeding operation the theoretical lag time greatlytime varies from 0 to 49 minutes. However, in practi-cal monitoring we see even greater lag time variationand opposite to theoretical prediction, in actual pro-duction the lag time is observed at every operation ofbundle progressing critical path. Calculation of the throughput time and work in pro-cess is carried for the average size bundle of 10, 30,50 and 70 pieces for a daily production capacity of3054 pieces. The work in process is computed as theline output per hour multiplied by throughput time of
the bundle in production line. The results are pre-sented in figure 7. When bundle size increases from 10 to 70 thethroughput time increases from 0.61 to 4.16 days.Consequently, the work in process increases about7 times, from 1995 to 13560 pieces. Obviously, thesmaller bundle enables faster order moving throughthe line and higher flexibility. To reduce batch sizes, the plant needs to implementa policy to schedule production of smaller batches.However, if demand stays constant, smaller batchsizes increase the number of setups required. As the
144industria textila 2018, vol. 69, nr. 2˘
Fig. 4. Calculated throughput time in a shirt assemblyline for bundle of size 50
Fig. 5. Practical throughput time in a shirt manufacturingline for a bundle of size 50
Fig. 6. Distribution of the lag time on critical path
Fig. 7. Influence of bundle size on throughput time andwork in process
Fig. 8. Manufacturing throughput time per part (MTTP)vs. Batch Size
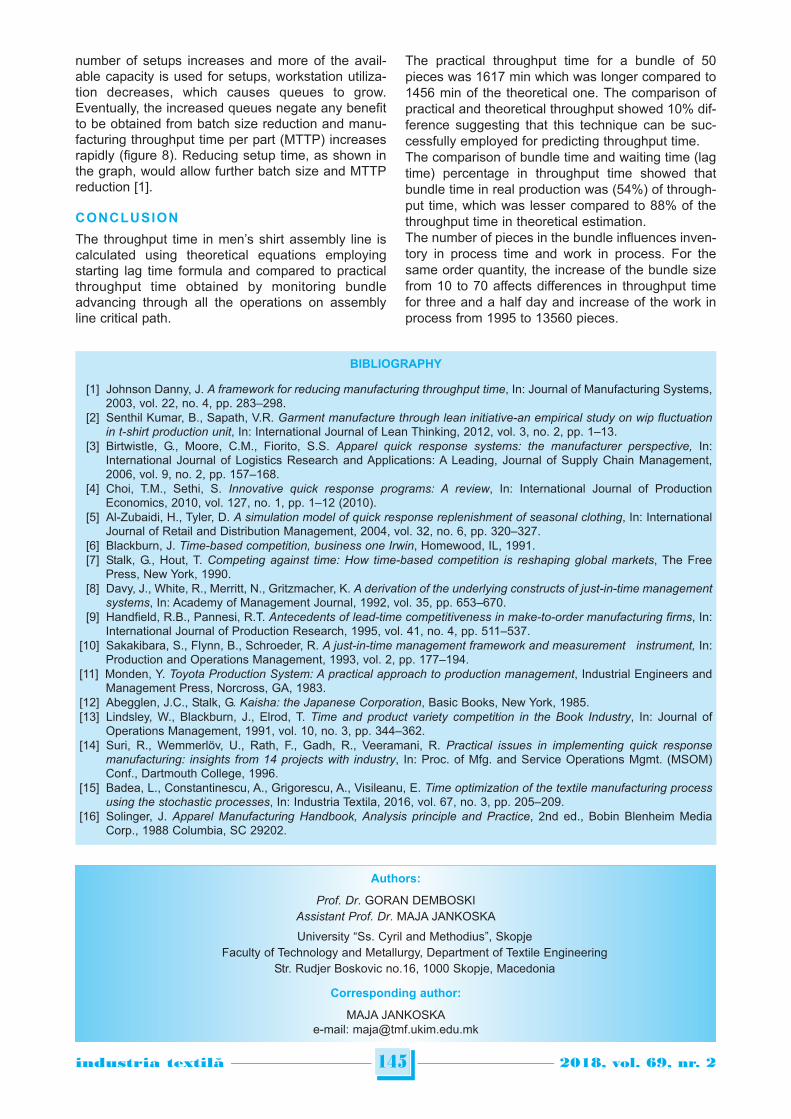
number of setups increases and more of the avail-able capacity is used for setups, workstation utiliza-tion decreases, which causes queues to grow.Eventually, the increased queues negate any benefitto be obtained from batch size reduction and manu-facturing throughput time per part (MTTP) increasesrapidly (figure 8). Reducing setup time, as shown inthe graph, would allow further batch size and MTTPreduction [1].
CONCLUSION
The throughput time in men’s shirt assembly line iscalculated using theoretical equations employingstarting lag time formula and compared to practicalthroughput time obtained by monitoring bundleadvancing through all the operations on assemblyline critical path.
The practical throughput time for a bundle of 50pieces was 1617 min which was longer compared to1456 min of the theoretical one. The comparison ofpractical and theoretical throughput showed 10% dif-ference suggesting that this technique can be suc-cessfully employed for predicting throughput time.The comparison of bundle time and waiting time (lagtime) percentage in throughput time showed thatbundle time in real production was (54%) of through-put time, which was lesser compared to 88% of thethroughput time in theoretical estimation. The number of pieces in the bundle influences inven-tory in process time and work in process. For thesame order quantity, the increase of the bundle sizefrom 10 to 70 affects differences in throughput timefor three and a half day and increase of the work inprocess from 1995 to 13560 pieces.
145industria textila 2018, vol. 69, nr. 2˘
Authors:
Prof. Dr. GORAN DEMBOSKIAssistant Prof. Dr. MAJA JANKOSKA
University “Ss. Cyril and Methodius”, SkopjeFaculty of Technology and Metallurgy, Department of Textile Engineering
Str. Rudjer Boskovic no.16, 1000 Skopje, Macedonia
Corresponding author:
MAJA JANKOSKAe-mail: [email protected]
BIBLIOGRAPHY
[1] Johnson Danny, J. A framework for reducing manufacturing throughput time, In: Journal of Manufacturing Systems,2003, vol. 22, no. 4, pp. 283–298.
[2] Senthil Kumar, B., Sapath, V.R. Garment manufacture through lean initiative-an empirical study on wip fluctuationin t-shirt production unit, In: International Journal of Lean Thinking, 2012, vol. 3, no. 2, pp. 1–13.
[3] Birtwistle, G., Moore, C.M., Fiorito, S.S. Apparel quick response systems: the manufacturer perspective, In:International Journal of Logistics Research and Applications: A Leading, Journal of Supply Chain Management,2006, vol. 9, no. 2, pp. 157–168.
[4] Choi, T.M., Sethi, S. Innovative quick response programs: A review, In: International Journal of ProductionEconomics, 2010, vol. 127, no. 1, pp. 1–12 (2010).
[5] Al-Zubaidi, H., Tyler, D. A simulation model of quick response replenishment of seasonal clothing, In: InternationalJournal of Retail and Distribution Management, 2004, vol. 32, no. 6, pp. 320–327.
[6] Blackburn, J. Time-based competition, business one Irwin, Homewood, IL, 1991.[7] Stalk, G., Hout, T. Competing against time: How time-based competition is reshaping global markets, The Free
Press, New York, 1990.[8] Davy, J., White, R., Merritt, N., Gritzmacher, K. A derivation of the underlying constructs of just-in-time management
systems, In: Academy of Management Journal, 1992, vol. 35, pp. 653–670.[9] Handfield, R.B., Pannesi, R.T. Antecedents of lead-time competitiveness in make-to-order manufacturing firms, In:
International Journal of Production Research, 1995, vol. 41, no. 4, pp. 511–537.[10] Sakakibara, S., Flynn, B., Schroeder, R. A just-in-time management framework and measurement instrument, In:
Production and Operations Management, 1993, vol. 2, pp. 177–194.[11] Monden, Y. Toyota Production System: A practical approach to production management, Industrial Engineers and
Management Press, Norcross, GA, 1983.[12] Abegglen, J.C., Stalk, G. Kaisha: the Japanese Corporation, Basic Books, New York, 1985.[13] Lindsley, W., Blackburn, J., Elrod, T. Time and product variety competition in the Book Industry, In: Journal of
Operations Management, 1991, vol. 10, no. 3, pp. 344–362.[14] Suri, R., Wemmerlöv, U., Rath, F., Gadh, R., Veeramani, R. Practical issues in implementing quick response
manufacturing: insights from 14 projects with industry, In: Proc. of Mfg. and Service Operations Mgmt. (MSOM)Conf., Dartmouth College, 1996.
[15] Badea, L., Constantinescu, A., Grigorescu, A., Visileanu, E. Time optimization of the textile manufacturing processusing the stochastic processes, In: Industria Textila, 2016, vol. 67, no. 3, pp. 205–209.
[16] Solinger, J. Apparel Manufacturing Handbook, Analysis principle and Practice, 2nd ed., Bobin Blenheim MediaCorp., 1988 Columbia, SC 29202.
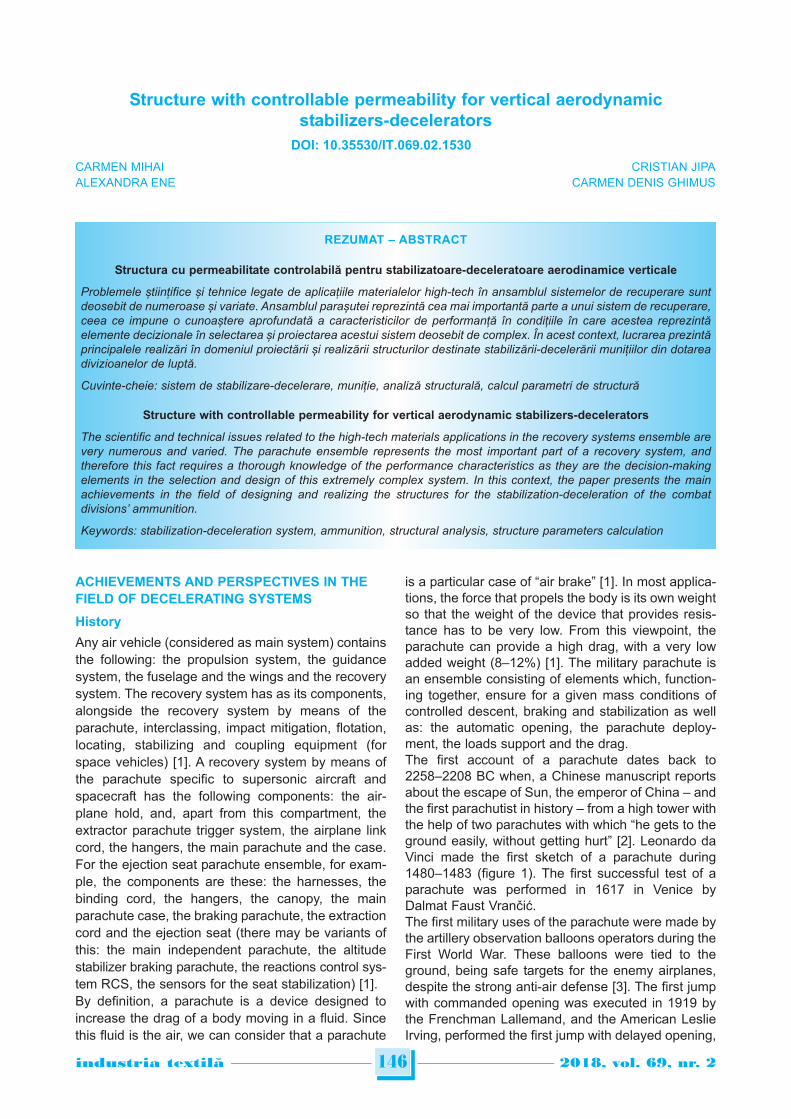
ACHIEVEMENTS AND PERSPECTIVES IN THEFIELD OF DECELERATING SYSTEMS
History
Any air vehicle (considered as main system) containsthe following: the propulsion system, the guidancesystem, the fuselage and the wings and the recoverysystem. The recovery system has as its components,alongside the recovery system by means of theparachute, interclassing, impact mitigation, flotation,locating, stabilizing and coupling equipment (forspace vehicles) [1]. A recovery system by means ofthe parachute specific to supersonic aircraft andspacecraft has the following components: the air-plane hold, and, apart from this compartment, theextractor parachute trigger system, the airplane linkcord, the hangers, the main parachute and the case.For the ejection seat parachute ensemble, for exam-ple, the components are these: the harnesses, thebinding cord, the hangers, the canopy, the mainparachute case, the braking parachute, the extractioncord and the ejection seat (there may be variants ofthis: the main independent parachute, the altitudestabilizer braking parachute, the reactions control sys-tem RCS, the sensors for the seat stabilization) [1].By definition, a parachute is a device designed toincrease the drag of a body moving in a fluid. Sincethis fluid is the air, we can consider that a parachute
is a particular case of “air brake” [1]. In most applica-tions, the force that propels the body is its own weightso that the weight of the device that provides resis-tance has to be very low. From this viewpoint, theparachute can provide a high drag, with a very lowadded weight (8–12%) [1]. The military parachute isan ensemble consisting of elements which, function-ing together, ensure for a given mass conditions ofcontrolled descent, braking and stabilization as wellas: the automatic opening, the parachute deploy-ment, the loads support and the drag. The first account of a parachute dates back to2258–2208 BC when, a Chinese manuscript reportsabout the escape of Sun, the emperor of China – andthe first parachutist in history – from a high tower withthe help of two parachutes with which “he gets to theground easily, without getting hurt” [2]. Leonardo daVinci made the first sketch of a parachute during1480–1483 (figure 1). The first successful test of aparachute was performed in 1617 in Venice byDalmat Faust Vrančić.The first military uses of the parachute were made bythe artillery observation balloons operators during theFirst World War. These balloons were tied to theground, being safe targets for the enemy airplanes,despite the strong anti-air defense [3]. The first jumpwith commanded opening was executed in 1919 bythe Frenchman Lallemand, and the American LeslieIrving, performed the first jump with delayed opening,
Structure with controllable permeability for vertical aerodynamicstabilizers-decelerators
CARMEN MIHAI CRISTIAN JIPAALEXANDRA ENE CARMEN DENIS GHIMUS
REZUMAT – ABSTRACT
Structura cu permeabilitate controlabilă pentru stabilizatoare-deceleratoare aerodinamice verticale
Problemele științifice și tehnice legate de aplicațiile materialelor high-tech în ansamblul sistemelor de recuperare suntdeosebit de numeroase și variate. Ansamblul parașutei reprezintă cea mai importantă parte a unui sistem de recuperare,ceea ce impune o cunoaștere aprofundată a caracteristicilor de performanță în condițiile în care acestea reprezintăelemente decizionale în selectarea și proiectarea acestui sistem deosebit de complex. În acest context, lucrarea prezintăprincipalele realizări în domeniul proiectării și realizării structurilor destinate stabilizării-decelerării munițiilor din dotareadivizioanelor de luptă.
Cuvinte-cheie: sistem de stabilizare-decelerare, muniție, analiză structurală, calcul parametri de structură
Structure with controllable permeability for vertical aerodynamic stabilizers-decelerators
The scientific and technical issues related to the high-tech materials applications in the recovery systems ensemble arevery numerous and varied. The parachute ensemble represents the most important part of a recovery system, andtherefore this fact requires a thorough knowledge of the performance characteristics as they are the decision-makingelements in the selection and design of this extremely complex system. In this context, the paper presents the mainachievements in the field of designing and realizing the structures for the stabilization-deceleration of the combatdivisions’ ammunition.
Keywords: stabilization-deceleration system, ammunition, structural analysis, structure parameters calculation
146industria textila 2018, vol. 69, nr. 2˘
DOI: 10.35530/IT.069.02.1530
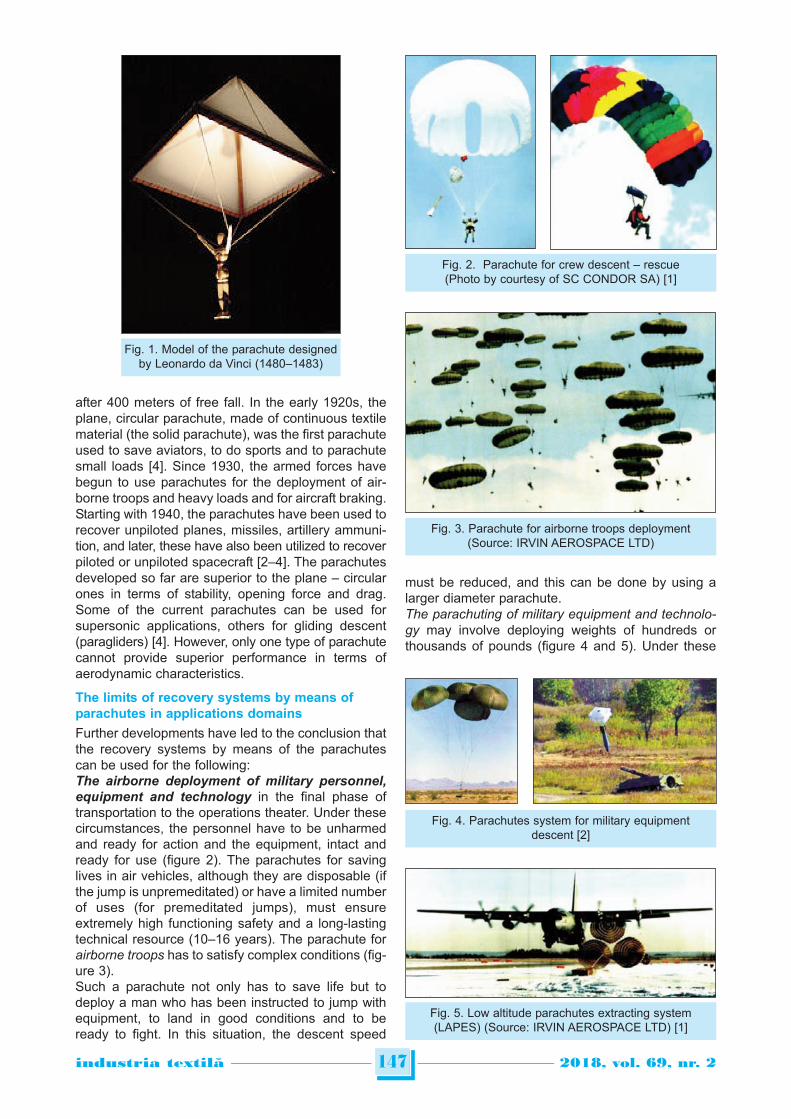
after 400 meters of free fall. In the early 1920s, theplane, circular parachute, made of continuous textilematerial (the solid parachute), was the first parachuteused to save aviators, to do sports and to parachutesmall loads [4]. Since 1930, the armed forces havebegun to use parachutes for the deployment of air-borne troops and heavy loads and for aircraft braking.Starting with 1940, the parachutes have been used torecover unpiloted planes, missiles, artillery ammuni-tion, and later, these have also been utilized to recoverpiloted or unpiloted spacecraft [2–4]. The parachutesdeveloped so far are superior to the plane – circularones in terms of stability, opening force and drag.Some of the current parachutes can be used forsupersonic applications, others for gliding descent(paragliders) [4]. However, only one type of parachutecannot provide superior performance in terms ofaerodynamic characteristics.
The limits of recovery systems by means ofparachutes in applications domains
Further developments have led to the conclusion thatthe recovery systems by means of the parachutescan be used for the following:The airborne deployment of military personnel,
equipment and technology in the final phase oftransportation to the operations theater. Under thesecircumstances, the personnel have to be unharmedand ready for action and the equipment, intact andready for use (figure 2). The parachutes for savinglives in air vehicles, although they are disposable (ifthe jump is unpremeditated) or have a limited numberof uses (for premeditated jumps), must ensureextremely high functioning safety and a long-lastingtechnical resource (10–16 years). The parachute forairborne troops has to satisfy complex conditions (fig-ure 3). Such a parachute not only has to save life but todeploy a man who has been instructed to jump withequipment, to land in good conditions and to beready to fight. In this situation, the descent speed
must be reduced, and this can be done by using alarger diameter parachute.The parachuting of military equipment and technolo-gy may involve deploying weights of hundreds orthousands of pounds (figure 4 and 5). Under these
147industria textila 2018, vol. 69, nr. 2˘
Fig. 1. Model of the parachute designedby Leonardo da Vinci (1480–1483)
Fig. 3. Parachute for airborne troops deployment(Source: IRVIN AEROSPACE LTD)
Fig. 5. Low altitude parachutes extracting system(LAPES) (Source: IRVIN AEROSPACE LTD) [1]
Fig. 2. Parachute for crew descent – rescue(Photo by courtesy of SC CONDOR SA) [1]
Fig. 4. Parachutes system for military equipmentdescent [2]
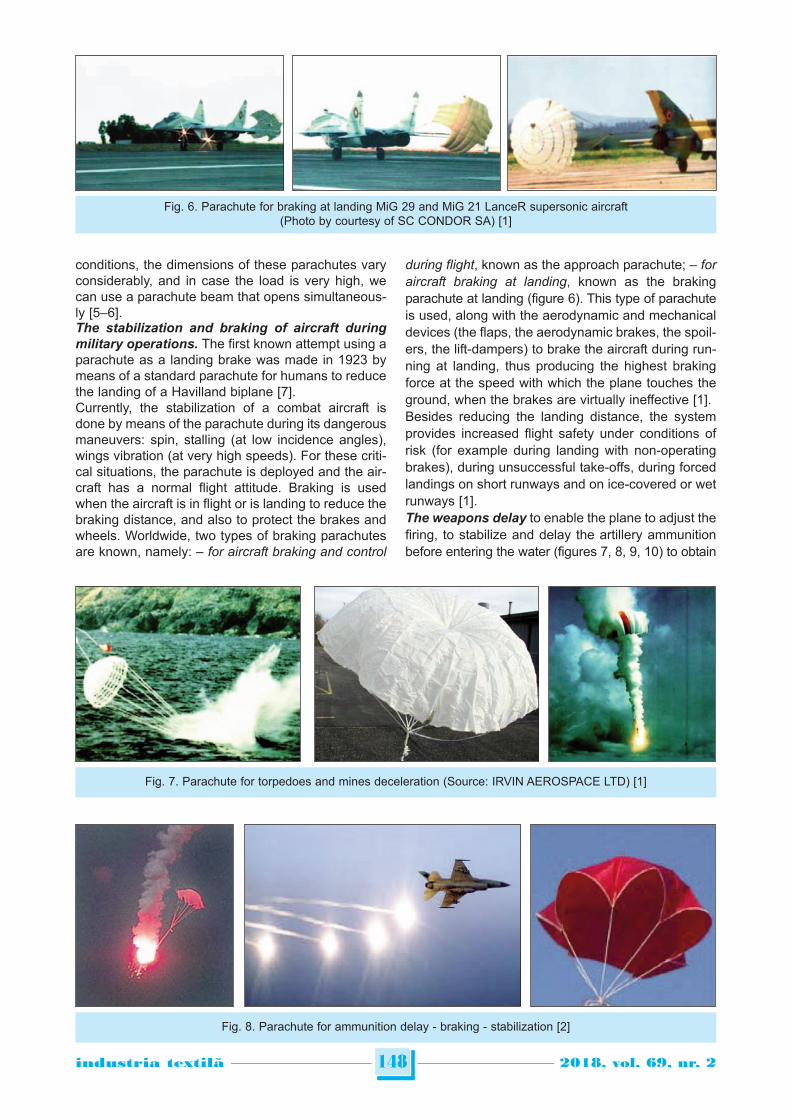
conditions, the dimensions of these parachutes varyconsiderably, and in case the load is very high, wecan use a parachute beam that opens simultaneous-ly [5–6].The stabilization and braking of aircraft during
military operations. The first known attempt using aparachute as a landing brake was made in 1923 bymeans of a standard parachute for humans to reducethe landing of a Havilland biplane [7].Currently, the stabilization of a combat aircraft isdone by means of the parachute during its dangerousmaneuvers: spin, stalling (at low incidence angles),wings vibration (at very high speeds). For these criti-cal situations, the parachute is deployed and the air-craft has a normal flight attitude. Braking is usedwhen the aircraft is in flight or is landing to reduce thebraking distance, and also to protect the brakes andwheels. Worldwide, two types of braking parachutesare known, namely: – for aircraft braking and control
during flight, known as the approach parachute; – foraircraft braking at landing, known as the brakingparachute at landing (figure 6). This type of parachuteis used, along with the aerodynamic and mechanicaldevices (the flaps, the aerodynamic brakes, the spoil-ers, the lift-dampers) to brake the aircraft during run-ning at landing, thus producing the highest brakingforce at the speed with which the plane touches theground, when the brakes are virtually ineffective [1]. Besides reducing the landing distance, the systemprovides increased flight safety under conditions ofrisk (for example during landing with non-operatingbrakes), during unsuccessful take-offs, during forcedlandings on short runways and on ice-covered or wetrunways [1].The weapons delay to enable the plane to adjust thefiring, to stabilize and delay the artillery ammunitionbefore entering the water (figures 7, 8, 9, 10) to obtain
148industria textila 2018, vol. 69, nr. 2˘
Fig. 6. Parachute for braking at landing MiG 29 and MiG 21 LanceR supersonic aircraft (Photo by courtesy of SC CONDOR SA) [1]
Fig. 7. Parachute for torpedoes and mines deceleration (Source: IRVIN AEROSPACE LTD) [1]
Fig. 8. Parachute for ammunition delay - braking - stabilization [2]
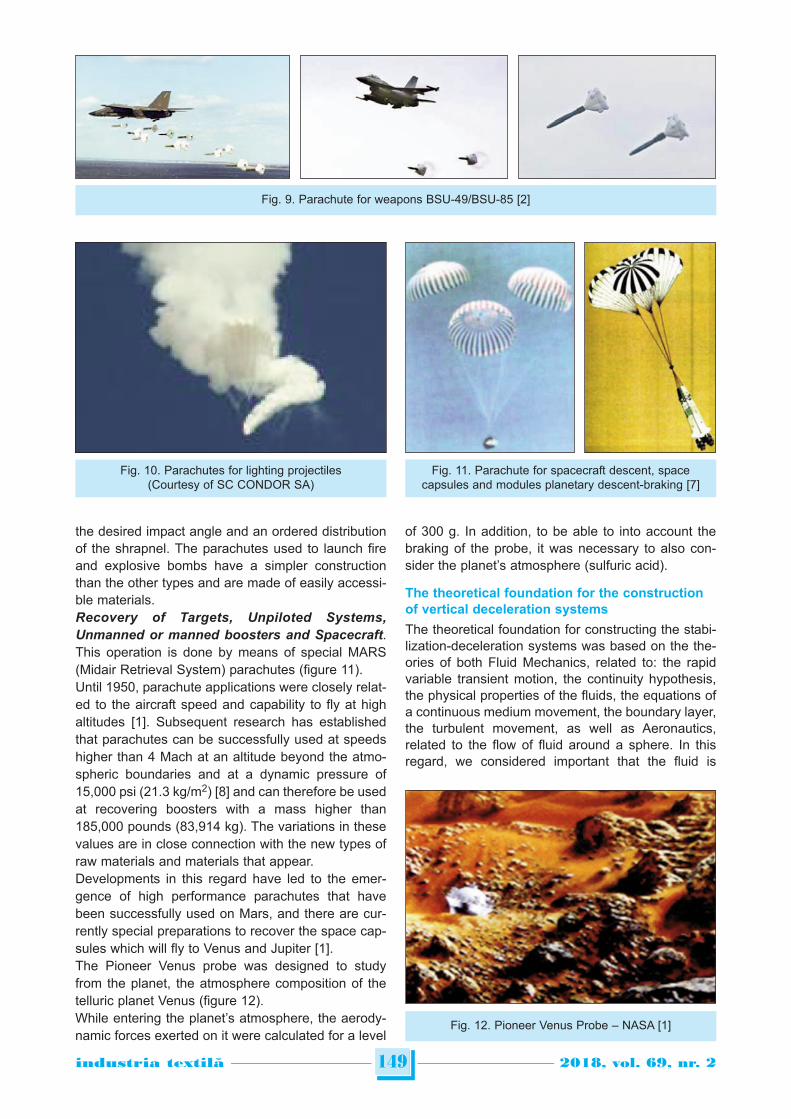
the desired impact angle and an ordered distributionof the shrapnel. The parachutes used to launch fireand explosive bombs have a simpler constructionthan the other types and are made of easily accessi-ble materials.Recovery of Targets, Unpiloted Systems,
Unmanned or manned boosters and Spacecraft.This operation is done by means of special MARS(Midair Retrieval System) parachutes (figure 11).Until 1950, parachute applications were closely relat-ed to the aircraft speed and capability to fly at highaltitudes [1]. Subsequent research has establishedthat parachutes can be successfully used at speedshigher than 4 Mach at an altitude beyond the atmo-spheric boundaries and at a dynamic pressure of15,000 psi (21.3 kg/m2) [8] and can therefore be usedat recovering boosters with a mass higher than185,000 pounds (83,914 kg). The variations in thesevalues are in close connection with the new types ofraw materials and materials that appear.Developments in this regard have led to the emer-gence of high performance parachutes that havebeen successfully used on Mars, and there are cur-rently special preparations to recover the space cap-sules which will fly to Venus and Jupiter [1].The Pioneer Venus probe was designed to studyfrom the planet, the atmosphere composition of thetelluric planet Venus (figure 12).While entering the planet’s atmosphere, the aerody-namic forces exerted on it were calculated for a level
of 300 g. In addition, to be able to into account thebraking of the probe, it was necessary to also con-sider the planet’s atmosphere (sulfuric acid).
The theoretical foundation for the constructionof vertical deceleration systems
The theoretical foundation for constructing the stabi-lization-deceleration systems was based on the the-ories of both Fluid Mechanics, related to: the rapidvariable transient motion, the continuity hypothesis,the physical properties of the fluids, the equations ofa continuous medium movement, the boundary layer,the turbulent movement, as well as Aeronautics,related to the flow of fluid around a sphere. In thisregard, we considered important that the fluid is
149industria textila 2018, vol. 69, nr. 2˘
Fig. 9. Parachute for weapons BSU-49/BSU-85 [2]
Fig. 10. Parachutes for lighting projectiles(Courtesy of SC CONDOR SA)
Fig. 12. Pioneer Venus Probe – NASA [1]
Fig. 11. Parachute for spacecraft descent, spacecapsules and modules planetary descent-braking [7]
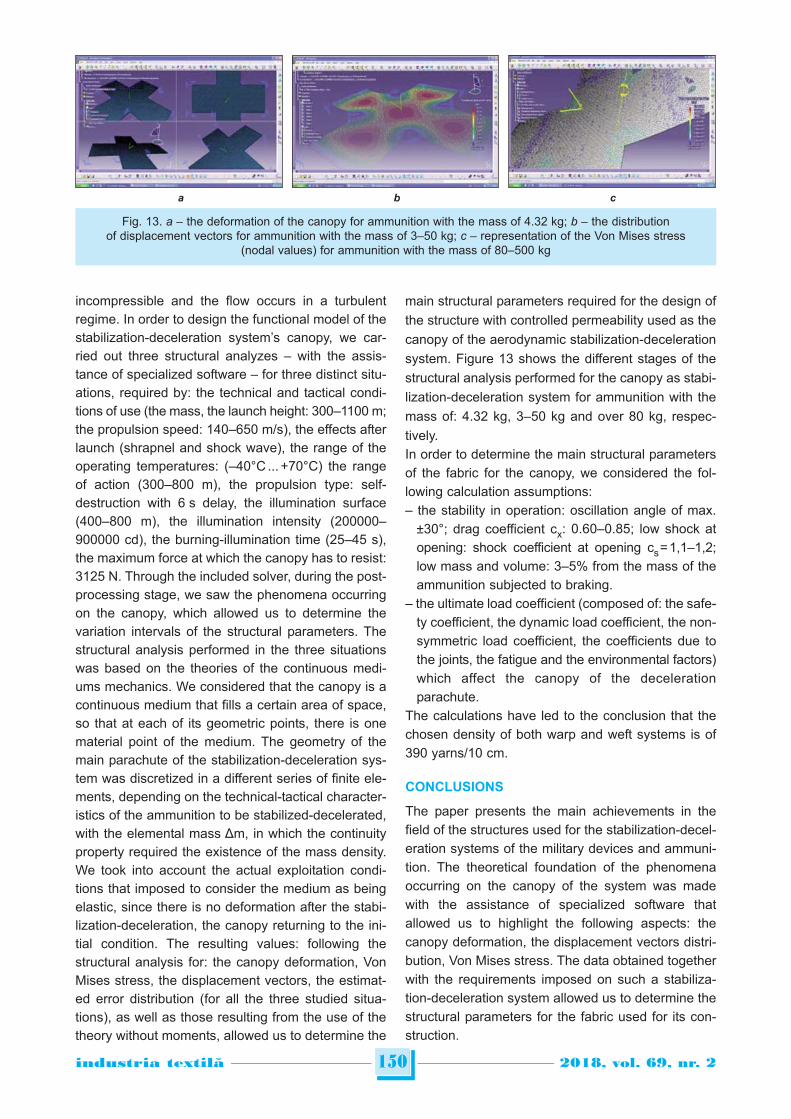
incompressible and the flow occurs in a turbulentregime. In order to design the functional model of thestabilization-deceleration system’s canopy, we car-ried out three structural analyzes – with the assis-tance of specialized software – for three distinct situ-ations, required by: the technical and tactical condi-tions of use (the mass, the launch height: 300–1100 m;the propulsion speed: 140–650 m/s), the effects afterlaunch (shrapnel and shock wave), the range of theoperating temperatures: (–40°C ... +70°C) the rangeof action (300–800 m), the propulsion type: self-destruction with 6 s delay, the illumination surface(400–800 m), the illumination intensity (200000–900000 cd), the burning-illumination time (25–45 s),the maximum force at which the canopy has to resist:3125 N. Through the included solver, during the post-processing stage, we saw the phenomena occurringon the canopy, which allowed us to determine thevariation intervals of the structural parameters. Thestructural analysis performed in the three situationswas based on the theories of the continuous medi-ums mechanics. We considered that the canopy is acontinuous medium that fills a certain area of space,so that at each of its geometric points, there is onematerial point of the medium. The geometry of themain parachute of the stabilization-deceleration sys-tem was discretized in a different series of finite ele-ments, depending on the technical-tactical character-istics of the ammunition to be stabilized-decelerated,with the elemental mass Δm, in which the continuityproperty required the existence of the mass density.We took into account the actual exploitation condi-tions that imposed to consider the medium as beingelastic, since there is no deformation after the stabi-lization-deceleration, the canopy returning to the ini-tial condition. The resulting values: following thestructural analysis for: the canopy deformation, VonMises stress, the displacement vectors, the estimat-ed error distribution (for all the three studied situa-tions), as well as those resulting from the use of thetheory without moments, allowed us to determine the
main structural parameters required for the design of
the structure with controlled permeability used as the
canopy of the aerodynamic stabilization-deceleration
system. Figure 13 shows the different stages of the
structural analysis performed for the canopy as stabi-
lization-deceleration system for ammunition with the
mass of: 4.32 kg, 3–50 kg and over 80 kg, respec-
tively.In order to determine the main structural parametersof the fabric for the canopy, we considered the fol-lowing calculation assumptions:– the stability in operation: oscillation angle of max.
±30°; drag coefficient cx: 0.60–0.85; low shock atopening: shock coefficient at opening cs = 1,1–1,2;low mass and volume: 3–5% from the mass of theammunition subjected to braking.
– the ultimate load coefficient (composed of: the safe-ty coefficient, the dynamic load coefficient, the non-symmetric load coefficient, the coefficients due tothe joints, the fatigue and the environmental factors)which affect the canopy of the decelerationparachute.
The calculations have led to the conclusion that thechosen density of both warp and weft systems is of390 yarns/10 cm.
CONCLUSIONS
The paper presents the main achievements in thefield of the structures used for the stabilization-decel-eration systems of the military devices and ammuni-tion. The theoretical foundation of the phenomenaoccurring on the canopy of the system was madewith the assistance of specialized software thatallowed us to highlight the following aspects: thecanopy deformation, the displacement vectors distri-bution, Von Mises stress. The data obtained togetherwith the requirements imposed on such a stabiliza-tion-deceleration system allowed us to determine thestructural parameters for the fabric used for its con-struction.
150industria textila 2018, vol. 69, nr. 2˘
Fig. 13. a – the deformation of the canopy for ammunition with the mass of 4.32 kg; b – the distributionof displacement vectors for ammunition with the mass of 3–50 kg; c – representation of the Von Mises stress
(nodal values) for ammunition with the mass of 80–500 kg
a b c

151industria textila 2018, vol. 69, nr. 2˘
BIBLIOGRAPHY
[1] Mihai, C. Theoretical and practical contributions to the design and production of technical articles woven foraviation, Doctoral Thesis – 2004.
[2] * * * http://www.rumaniamilitary.ro/
[3] Brown, W.D. Parachute, vol. I, II, Londra, 1949.
[4] Knacke, T.W. Parachute recovery systems, Para Publishing, Santa Barbara, California,1992.
[5] Knake, T.W. Techical-historical development of parachutes and their applications since World War I AIAA, Paper
No. 86 – 2423 9th Aerodynamic Decelerator and Balloon Technology Conference, Albuquerque, 1986.
[6] * * * Irvin Aerospace Ltd. Marea Britanie, 2000.
[7] Sanger, M.B. Jr Summary od design consideration for airplane spin-recovery parachute systems, NASA, 1972(Report NASA-TN-D-6866).
[8] Rodier, R.W., Moog, R.D., Kross, D.R. 136-Foot Main Parachute for recovery of Space Shuttle Solid RocketBoosters, American Institute of Aeronautics and Astronautics, 1984 (AIAA 84-0804).
Authors:
Eng. Mat. PhD CARMEN MIHAI1
Eng. Attorney PhD ALEXANDRA ENE1
Seng. CRISTIAN JIPA1
Stud. CARMEN DENIS GHIMUS2
1 The National Research & Development Institute for Textiles and Leather 2 City University of London, Department of Mathematics
Corresponding author:
CARMEN MIHAI
e-mail: [email protected]
INTRODUCTION
Fashion is the way in which our clothes reflect andcommunicate our individual vision within society, link-ing us to time and space, and clothing is the materialthing that gives fashion a contextual vision in society[1–2]. The fashion industry is evolving in a fast pacemanner and presently witnessing situations of con-tradictions in consumer behavior: on one hand, con-sumers are becoming more conscious of the impactof their purchasing behavior, and willing to support amore sustainable fashion industry but on the otherhand are complying with unsustainable businessmodels where production is achieved to the lowestprice in the shortest time possible. People say theywant to become more sustainable but at the sametime they cannot resist buying ‘cheap’ fashion. In fact,consumers’ attitude and behavior are in tune with fastproduction [3]. Figures from the UK show that peopleare buying more today than twelve years ago.According to Statista (2015) in 2005 consumerspending on clothing and footwear (in million GBP)was 44.4 M, and in 2015 was 66.1 M. [4].Experts blame fast fashion as the reason for the dra-matic expansion of our wardrobes [5]. Fast produc-tion and fast consumption inevitably lead to thesystematic decrease of resources and increase ofwaste, thus stressing the earth’s capacity to regener-ate at a natural pace. Guedes al (2017) state that thePortuguese clothing and textile companies have to pre-pare strategies to implement methods and processes
capable of improving the negative image of the sec-tor in the society [6]. This is why the ‘slow fashionapproach’ appears as a new model that intervenes asa revolutionary process in the contemporary world. Itis focused on its link with human needs, awarenessand responsibility. By using the concept of slow in thefashion industry not only in Portugal, but worldwide, itis possible to re-invigorate a healthy rhythm of pro-duction, meaning that the environment and peoplecould healthily co-exist and the earth would havetime to regenerate during production cycles [1]. Whilefast is the opposite of slow in language; in the contextof slow culture; fast and slow are not in opposition.They are different worldviews, with different econom-ic logics and business models, values, and process-es [7]. If we continue to need ‘fast’ or at least inex-pensive fashion, we have to ask how it can be madein an entirely environmentally acceptable way,throughout the whole life cycle [8]. The slow move-ment questions growth fashion’s emphasis on image,look, and ‘the new’ over making and maintainingactual material garments, re-finding earlier experi-ences of fashion linked to active making rather thanwatching [9–10]. McDonough and Braungart, inCradle-to-Cradle, argue that creative sustainabledesign essentially means eliminating waste com-pletely through the application of human ingenuity.Once a product has reached the end of its useful lifein one form, it serves as the raw technical material, orbiological nourishment, for another. That way, closed-loop industrial cycles will see recycling being
152industria textila 2018, vol. 69, nr. 2˘
A new and sustainable service to slow fashion brands
J. P. BERNARDES F. FERREIRAA. MARQUES M. NOGUEIRA
REZUMAT – ABSTRACT
Un nou serviciu sustenabil pentru încetinirea producției brandurilor de modă
Această lucrare explorează crearea unui serviciu inovator de închiriere a îmbrăcămintei, inspirat din “mișcarea deîncetinire a articolelor de modă”, care se concentrează asupra întrebării: “Sunt oamenii dispuși să poarte îmbrăcămintesecond-hand și/sau închiriată atunci când călătoresc?”. Acesta este un serviciu de închiriere a îmbrăcămintei de zi cuzi, dar și a îmbrăcămintei business. Crearea și dezvoltarea acestui serviciu au fost posibile prin utilizarea uneimetodologii de gândire a design-ului: cadrul de 9 etape al lui Kees Dorst. În ceea ce privește validarea sa, a fost realizatun chestionar cu 430 de răspunsuri. Lucrarea prezinta răspunsul pozitiv la această problemă.
Cuvinte-cheie: sustenabilitate, gândirea design-ului, mișcarea lentă a modei, închirierea îmbrăcămintei, călătorie
A new and sustainable service to slow fashion brands
This paper explores the creation of an innovative clothing rental service, that is inspired by the ‘slow fashion movement’,and that focuses on the question: “are people willing to use second-hand clothing and/or leased when travelling?”. Thisis a rental service for the day-to-day and also business clothing. The creation and development of this service waspossible through the use of a design thinking methodology: the 9 steps framework by Kees Dorst. Regarding itsvalidation, it was achieved with a questionnaire with 430 responses. The paper culminates with the positive response tothe problem.
Keywords: sustainability, design thinking, slow fashion movement, clothing rental, travel
DOI: 10.35530/IT.069.02.1528
replaced by downcycling [11]. Fashion and sustain-ability wise, there are very real practical strategiesthat will enable designers to specify new environ-mentally friendly life cycles and inspire new businessopportunities that attract consumers [8].Consumers are an important part of the fashion sys-tem because they can create a valuable influence inthe pursuit of sustainability in the fashion industry.Some companies start to be aware of this new frame-work and are preparing new competitive strategies togive to their new consumers innovative solutions[12]. There are several aspects to consider whenanalyzing fashion consumers and sustainability: theconsumer knowledge about sustainability, consumerbehavior and consumption habits and feelings asso-ciated with sustainable consumption. In fact, the atti-tude and the behavior of the younger generation arein line with the rapid fashion production. Encouragedby low prices and heavily influenced by marketingcampaigns and constant changes of trends, con-sumers tend to speed up their fashion consumption[13]. The generation Y (Millennials) are defined as agroup of people born more or less between 1980 and2000 and their core values include confidence, loyal-ty to civic duty, sociability, morality, intelligence anddiversity [14]. Millennials maintain a positive attitudein relation to sustainability in general. Young con-sumers are very aware of the opportunities that com-panies have to help the environment and reduce theecological footprint. Also, this is a generation thatthinks that it is the companies’ duty to invest in a bet-ter environment and society by producing or sellingproducts in a sustainable way.
STATE OF THE ART
This research focuses on one main theme that isessential to the development of the service: designthinking that supports its creation and development.
Design thinking
Design thinking is described as an interesting newparadigm regarding problem-solving solutions inmany different occupations, mainly in the fields oftechnology (IT) and also business [15]. There isn’t aconsensual definition of design thinking because thedefinitions for this concept are very confusing [17].These authors present disparity between the con-cepts of ‘thinking of’ (design), ‘thinking about’ (design),and ‘thinking through’ (design) and suggest that themost accurate definition brings together these threedifferent perspectives. The eagerness to adopt andapply these design practices in other fields created asudden demand for clear and definitive knowledgeabout the design thinking (including a clear definition).For Cooper, Junginger and Lockwood, design think-ing (think through design) involves the ability toquickly visualize problems and concepts, the devel-opment of scenarios based on people, and the con-struction of business strategies based on designers’research methods [17]. Lockwood defines designthinking as being essentially a process of human-cen-tred innovation that emphasizes the note, collaboration,
rapid learning, visualization ideas, a quick prototypeof concepts and analysis of business competitors.Brown states that design thinking is about observingan unclear phenomenon and try to look at it awayfrom conventional scenarios in order to previewfuture scenarios [16]. In this way, by using an appro-priate business strategy, it is possible to turn cus-tomers’ needs into value and create a market oppor-tunity. Kees Dorst describes a new approach, which focus-es on problem-solving innovation in organizationsthat is called the creation of frames [18]. Dorstapplies design thinking, but goes one step ahead ofthe tricks and techniques that regularly characterizeit. Creating frames focuses on the ability to createnew approaches to the analysis of the situation of theproblem itself, and not only on creating solutions toproblems. The strategies suggested by Kees Dorstare drawn through the consistent practices in severalsophisticated and unique layers from top designers,and also through ideas that emerged from 50 yearsof research in Design [18]. Dorst describes ninesteps in the process of creating frames and illustratesits application to real-world problems. It maps inno-vative solutions and provides tools and methods toimplement the creation of frames, in other words, it isa way of thinking in design that helps professionals todevelop their own approaches to problem solvingand creating innovation along with the Design. Thisway it is possible to see companies as a series offrames: frames for resiliency, Kees Dorst [18]. The9 steps are: 1 – Archaeology of the problem (why is it the prob-
lem? how did it become a problem? Why haven’tbeen solved? who has this problem?);
2 – Paradox (what makes this problem difficult tosolve?);
3 – Stakeholders (who are the stakeholders?); 4 – Problem Arena (what else is part of the prob-
lem?); 5 – Themes; 6 – Frames; 7 – Future; 8 – Transformations (what needs to change to be
implemented?); 9 – Connections (how does it connect to the rest of
the world?).
RESEARCH METHODS
The main research goal of this paper is to analyse thefeasibility of a service of this kind and realize itsacceptance, in order to respond to the problem: “Arepeople willing to use second-hand clothing and/orleased when traveling?”. The methodology adoptedin this study (table 1) is based on a quantitativeapproach, resorting to a questionnaire technique.
153industria textila 2018, vol. 69, nr. 2˘
Specific objectives Methodology
Creation of the service 9 steps framework
Validation of the service Questionnaire
Table 1
TRAVELING NEVER FELT SO LIGHT
The proposition on this paper is an exciting newclothing service that respects slow fashion and pointstowards the promotion of sustainable lifestyles. Theway it works is simple: different types of clothes andaccessories from different brands can be rented, viaonline or via store, and then delivered at the desiredlocation (e.g. hotel, resort, and company) or pickedup at the store (figure 1). After they are used theyreturn to be carefully and environmentally washed sothey can be reused. Besides everyday clothes, it is aservice that also provides suits and outfits for busi-ness trips, depending on the associated brands in thedestination of choice. The idea behind this service isfor the associated fashions brands to offer a newexperience to their customers, a luggage free trip.Free of all the packing drama and everything aroundbuying new and specific clothes for certain destina-tions. In sum, this is a service that gathers severalbrands, and works as a link between the brands andtheir customers. Besides offering a new fashion expe-rience, the brands are also promoting a slow fashionapproach, due to the constant circulation of clothes.After some research on the subject, the use of sec-ond-hand or rented clothes has not yet been givenmuch thought in the way this service intends to act,so this is a problem that ends up becoming a busi-ness opportunity. At the time being, the only type ofclothing that is possible to rent are carnival costumesand garments for specific events, usually parties andgalas. Also, the differentiation would be in offeringall kinds of clothes, with the possibility to also rentdepending on the type of country (for example: snowclothes for the Nordic countries or beach wear for thehot/exotic countries). Still, the service offers the pos-sibility of renting clothes for business trips. Promotinga new sharing economy and respecting the slowfashion movement, clients can drop off clothes inexchange for new clothes, and this way there is goodcirculation fomenting the reuse of clothes and exper-imentation. This way, looking for a collaborative econ-omy can enter as a solution to the crisis we facetoday, since this is based on economic, social, tech-nological and environmental pillars. And that is exact-ly what this new service promotes: an economy inwhich people are the focus, and the exchange ofgoods and services between themselves, in this case,clothing and accessories, contributes to a healthygrowth, not only mind-set wise but also of economies.It should be noted that, in accordance with the resultsof the questionnaire people feel awkward in acquiringsecond-hand products. To overcome this constraintthere are various complicated stages, among whichraising awareness to solutions such as the proposedservice. It is also necessary to ensure total cleanli-ness and quality of clothes, to try to minimize the stig-ma about the use of clothes already used by otherpeople. The biggest obstacle to the use of this type ofservice is the doubt in the consumers’ minds if theclothes are clean enough and ready to use withouthaving to question its cleanliness. These problems
came up during the questionnaire, and were a veryimportant insight for the development of the service.
Design thinking: 9 steps framework by KeesDorst
The section below presents the application of the9 steps framework to the new service:1. Archaeology of the problem. The research ques-tion became a problem from the time when the eco-nomic crisis in Portugal started. From that moment,there was a decrease in purchasing power, forcingpeople to direct their income for other less superflu-ous goods. It is a problem that was never solvedbecause there is not yet a rental service that enablesthe customers to rent clothes for every occasion andnot only for special events and that also promotesexchanging clothes for new clothes or store credit tobe later used in renting. This is a philosophy thatencourages a collaborative economy, by promotingsustainability values. The main holder of this problemis anyone who travels and/or that has true sustain-ability concerns, and as the questionnaire will show,the Millennials are the generation with the most wor-ries about sustainability and that show a greateracceptance for these kinds of sharing services.2. Paradox. According to the questionnaire results,this is a problem that is difficult to solve because peo-ple don’t like the idea of using second hand clothes.They have doubts concerning its quality and cleanli-ness. This resistance to leased and/or used clothingis what makes this a complicated problem to solve.3. Stakeholders. The interested parties are all theassociated brands willing to be a part of this newfashion experience, the community in general (part-nership with travel bloggers; and business partnersas advertising agencies), institutions (airports, munic-ipalities and national tourism departments) and lastly,all customers who are able to share the same vision,and thus join the service. Essentially, it is expectedthat the adhesion to this service is made mainly bypeople that are part of generation Y (also known asMillennials), that support and share a more collabo-rative vision.4. Problem arena. Not all is about clothes, but edu-cation in a way. Another concern that is inherent inthe problem is the luggage. The fact that touristshave to pack causes an inconvenience to the extentthat they need to select the clothes they want to take,and later, the psychological cost of a potential loss ofbag is quite high. With this service, the tourist’sclothes are “safe and sound” at home, and they don’tneed to worry at all with luggage. It is only necessaryto bring their essentials (hygiene). Also, by not bring-ing their clothes, they are offered the experience oftrying clothes that they don’t own, to step outsidetheir comfort zone if they feel like it. That said, this isan ultimate fashion service that exists not only tofacilitate the travelling moment but also to make it anunforgettable fashion moment, as it promotes sus-tainability and all the brands associated to it.
154industria textila 2018, vol. 69, nr. 2˘
5. Themes. In this step the themes start to emerge,and they are the bases for new frames. In this casethere are four major themes for the service to exist:clothes and accessories; Physical stores, Websiteand mobile application (figure 2).6. Frames. The main frame is its motto: “Travelingnever felt so light”. This is because tourists don’tneed to take anything with them. On the other side,they bring home a baggage filled with great experi-ences and fashion moments that are only emotionaland not physical. This is how this service wants toposition themselves, because looking at the problemfrom this perspective, shows that being a part of thisfashion experience serves to enrich and not only tofacilitate the traveling moment.7. Future. Nowadays society is more susceptible to acollaborative and sharing way of living, either in thesense of physical goods, experiences or information.This service is just one of the mechanisms of this col-laborative economy, where people can share tastes,styles, goods, but, above all, experiences.8. Transformations. This is the complicated stepbecause in order for this service to succeed, thementality of people when it comes to renting clothesthat has already been used by third parties needs tochange. For this to be possible a major campaign ofdemystification of the service needs to be in correct-ly done. With good communication, people can under -stand the advantages clearly. As will be shown by thequestionnaire results, the question of hygiene andcleaning of the clothes is in fact a barrier and a hugeresistance.
9. Connections. If this reaches the needs of the pop-ulation in general, it has the potential of becoming asocial collaboration tool. That way this model can bequickly replicated in other cities around the world,always respecting the way of dressing and the fash-ions of each culture and country.
RESULTS AND DISCUSSION
To allow an analysis of the feasibility and acceptabil-ity of a service like this, a questionnaire was con-ducted in two parts: the basic characterization of therespondents and the analysis of the feasibility andacceptability of the service. The questionnaire wascompleted by 430 individuals, and was applied viaonline. Demographically the majority of respondentsare female, with a total of 273 responses, representing
155industria textila 2018, vol. 69, nr. 2˘
Fig. 1. How the service works
Fig. 2. App mockups
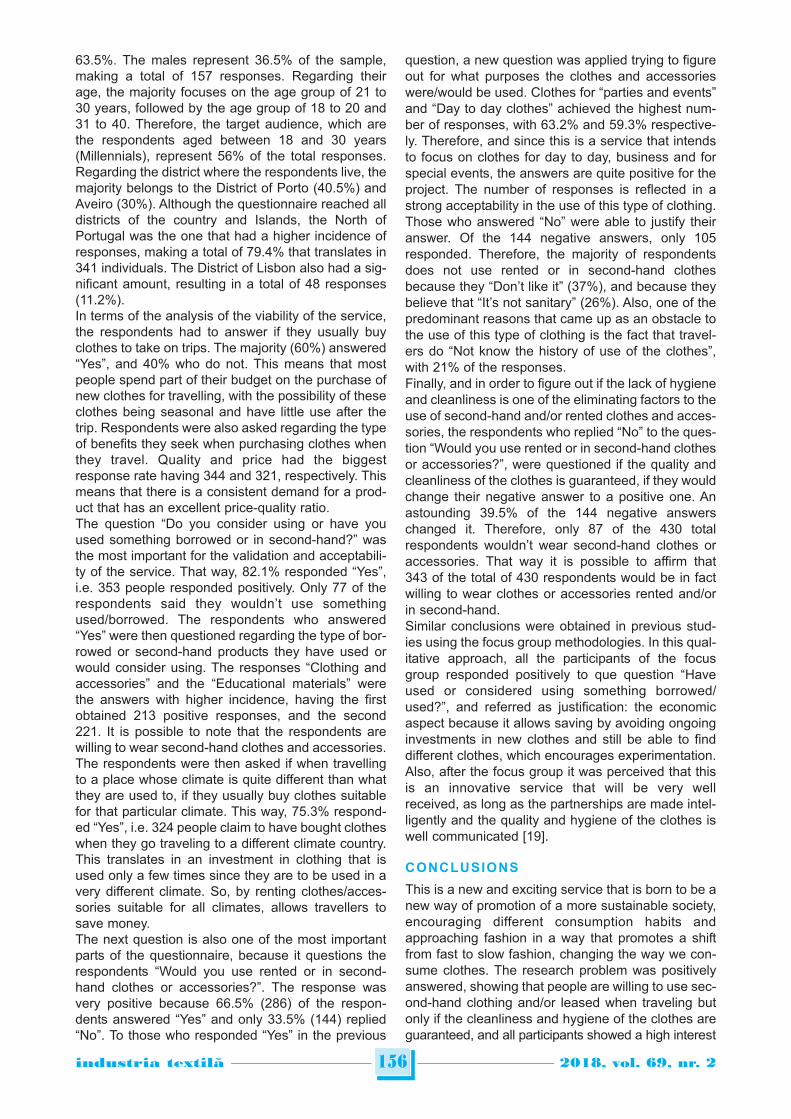
63.5%. The males represent 36.5% of the sample,making a total of 157 responses. Regarding theirage, the majority focuses on the age group of 21 to30 years, followed by the age group of 18 to 20 and31 to 40. Therefore, the target audience, which arethe respondents aged between 18 and 30 years(Millennials), represent 56% of the total responses.Regarding the district where the respondents live, themajority belongs to the District of Porto (40.5%) andAveiro (30%). Although the questionnaire reached alldistricts of the country and Islands, the North ofPortugal was the one that had a higher incidence ofresponses, making a total of 79.4% that translates in341 individuals. The District of Lisbon also had a sig-nificant amount, resulting in a total of 48 responses(11.2%).In terms of the analysis of the viability of the service,the respondents had to answer if they usually buyclothes to take on trips. The majority (60%) answered“Yes”, and 40% who do not. This means that mostpeople spend part of their budget on the purchase ofnew clothes for travelling, with the possibility of theseclothes being seasonal and have little use after thetrip. Respondents were also asked regarding the typeof benefits they seek when purchasing clothes whenthey travel. Quality and price had the biggestresponse rate having 344 and 321, respectively. Thismeans that there is a consistent demand for a prod-uct that has an excellent price-quality ratio.The question “Do you consider using or have youused something borrowed or in second-hand?” wasthe most important for the validation and acceptabili-ty of the service. That way, 82.1% responded “Yes”,i.e. 353 people responded positively. Only 77 of therespondents said they wouldn’t use somethingused/borrowed. The respondents who answered“Yes” were then questioned regarding the type of bor-rowed or second-hand products they have used orwould consider using. The responses “Clothing andaccessories” and the “Educational materials” werethe answers with higher incidence, having the firstobtained 213 positive responses, and the second221. It is possible to note that the respondents arewilling to wear second-hand clothes and accessories.The respondents were then asked if when travellingto a place whose climate is quite different than whatthey are used to, if they usually buy clothes suitablefor that particular climate. This way, 75.3% respond-ed “Yes”, i.e. 324 people claim to have bought clotheswhen they go traveling to a different climate country.This translates in an investment in clothing that isused only a few times since they are to be used in avery different climate. So, by renting clothes/acces-sories suitable for all climates, allows travellers tosave money. The next question is also one of the most importantparts of the questionnaire, because it questions therespondents “Would you use rented or in second-hand clothes or accessories?”. The response wasvery positive because 66.5% (286) of the respon-dents answered “Yes” and only 33.5% (144) replied“No”. To those who responded “Yes” in the previous
question, a new question was applied trying to figureout for what purposes the clothes and accessorieswere/would be used. Clothes for “parties and events”and “Day to day clothes” achieved the highest num-ber of responses, with 63.2% and 59.3% respective-ly. Therefore, and since this is a service that intendsto focus on clothes for day to day, business and forspecial events, the answers are quite positive for theproject. The number of responses is reflected in astrong acceptability in the use of this type of clothing.Those who answered “No” were able to justify theiranswer. Of the 144 negative answers, only 105responded. Therefore, the majority of respondentsdoes not use rented or in second-hand clothesbecause they “Don’t like it” (37%), and because theybelieve that “It’s not sanitary” (26%). Also, one of thepredominant reasons that came up as an obstacle tothe use of this type of clothing is the fact that travel-ers do “Not know the history of use of the clothes”,with 21% of the responses.Finally, and in order to figure out if the lack of hygieneand cleanliness is one of the eliminating factors to theuse of second-hand and/or rented clothes and acces-sories, the respondents who replied “No” to the ques-tion “Would you use rented or in second-hand clothesor accessories?”, were questioned if the quality andcleanliness of the clothes is guaranteed, if they wouldchange their negative answer to a positive one. Anastounding 39.5% of the 144 negative answerschanged it. Therefore, only 87 of the 430 totalrespondents wouldn’t wear second-hand clothes oraccessories. That way it is possible to affirm that343 of the total of 430 respondents would be in factwilling to wear clothes or accessories rented and/orin second-hand.Similar conclusions were obtained in previous stud-ies using the focus group methodologies. In this qual-itative approach, all the participants of the focusgroup responded positively to que question “Haveused or considered using something borrowed/used?”, and referred as justification: the economicaspect because it allows saving by avoiding ongoinginvestments in new clothes and still be able to finddifferent clothes, which encourages experimentation.Also, after the focus group it was perceived that thisis an innovative service that will be very wellreceived, as long as the partnerships are made intel-ligently and the quality and hygiene of the clothes iswell communicated [19].
CONCLUSIONS
This is a new and exciting service that is born to be anew way of promotion of a more sustainable society,encouraging different consumption habits andapproaching fashion in a way that promotes a shiftfrom fast to slow fashion, changing the way we con-sume clothes. The research problem was positivelyanswered, showing that people are willing to use sec-ond-hand clothing and/or leased when traveling butonly if the cleanliness and hygiene of the clothes areguaranteed, and all participants showed a high interest
156industria textila 2018, vol. 69, nr. 2˘
in a service like this. However, the main limitation ofthis study is that the results from the analysed sam-ple are 100% Portuguese, therefore it is not possibleto extrapolate these results to other countries wherethis service would like to be present. Different market
studies are needed to a better assessment of thebusiness, and also, different contacts with clothingbrands must be made in order to understand theirwillingness to join a sustainable and more consciousway of being in the world.
157industria textila 2018, vol. 69, nr. 2˘
BIBLIOGRAPHY
[1] Fletcher, K. Sustainable fashion and textiles: design journeys, In: London: Earth Scan, 2008.
[2] Cataldi, C., Dickinson, M. and Grover, C. Slow fashion: Tailoring a strategic approach towards sustainability, In:Masters’ thesis; Karlskrona, Sweden: School of Engineering, Blekinge Institute of Technology, 2010.
[3] Morgan, L., and Birtwistle, G. An investigation of young fashion consumers’ disposal habits. In: International Journalof Consumer Studies, 2009, vol. 33, pp. 190–198.
[4] Statista (2015) Expenditure on clothing and footwear in the UK. In: Retrieved on March 2017. Website:https://www.statista.com/statistics/289996/expenditure-on-clothing-and-footwear-in-the-united-kingdom-uk/
[5] Dirksen, K., Fashion guide I: Slow fashion, http://faircompanies.com/news/view/fashion-guide-i-slow-fashion, 2008.
[6] Guedes, G., Ferreira, F., Urbano, L. and Marques, A. Corporate social responsibility: competitiveness in the contextof textile and fashion value chain, In: Environmental Engineering and Management Journal, 2017, vol. 16, no. 5,pp. 1193–1202, ISSN: 1582-9596.
[7] Fletcher, K. Slow fashions: An invitation for Systems Change. In: Fashion Practice, 2016, vol. 2, no. 2, pp. 259–266,DOI: 10.2752/175693810X12774625387594.
[8] Blackburn, R.S. Sustainable textiles: Life cycle and environmental impact In: Cambridge: Woodhead PublishingLimited, ISBN 978-1-84569-453-1, 2009.
[9] Clark, H. Slow fashion – An oxymoron or a promise for the future? In: Fashion Theory, 2009, vol. 12, no. 4,pp. 427–46.
[10] Thorpe, A. The Designer’s Atlas of Sustainability. In: Washington, DC: Island Press, 2007.
[11] McDonough, W. and Braungart, M. Cradle to cradle: Remaking the way we make things In: New York: North PointPress, 2002, ISBN-13: 978-0-86547-587-8.
[12] Marques, A., Guedes, D., and Ferreira, F. Competitive strategies in fashion industries: Portuguese footwearindustry, In: IOP Conference Series: Material Science and Engineering, 2017, vol. 254, DOI: 10.1088/1757-899x/254/20/202006.
[13] Birtwistle, G. and Moore, C.M. Fashion adoption in the UK: A replication study. In: Paper presented at the AnzmacConference Brisbane CA, 2006.
[14] Zemke, R. Here come the millennials, In: Training Magazine, 2001, vol. 38, no. 7, pp. 44–49.
[15] Brooks, F. The design of design: essays from a computer scientist. In: NJ: Addison-Wesley Professional, 2010.
[16] Martin, B. Change by design: how design thinking transforms organizations and inspires �innovation. In: HarperCollins, New York, 2009.
[17] Cooper, R., Junginger, S. and Lockwood, T. Design thinking and design management: A research and practiceperspective. In: Design Management Review, 2006, vol. 20, no. 2, pp. 46–55, DOI: 10.1111/j.1948-7169.2009.00007.x
[18] Dorst, K. Design problems and design paradoxes, In: Design Issues, 2006, vol. 22, no. 3, pp. 4–17.
[19] Bernardes, J.P. and Nogueira, M. OKG: creating and developing an innovative clothing service, In: IOP Conf. Ser.:Mater. Sci. Eng., 2017, vol. 254, 212001, DOI:10.1088/1757-899X/254/21/212001.
Authors:
J.P. BERNARDES1
A. MARQUES1
F. FERREIRA1
M. NOGUEIRA2
1University of Minho, 2C2T, Textile Department, Campus de Azurém,
4800-058, Guimarães, Portugal2 IPAM, IPAM Lab,
Rua Manuel Pinto Azevedo, 748, 4100-320, Porto, Portugal
Corresponding author:
J.P. BERNARDESe-mail: [email protected]
INTRODUCTION
Design integrates functional, ergonomic and aesthet-ic qualities of products and is an effective instrumentof diversity in relation to competitive products. Toachieve this, designers must effectively connectthese features or aspects of art to the market, inorder to create the appropriate product for the previ-ously selected market target.Therefore, considering the business from the per-spective of customers does not exclude the simulta-neous interest in profit. Moreover, if there is no activesearch for profit, the ability of the company to meetcustomers’ needs for a longer period will be signifi-cantly reduced. The authors who have dealt with the study of tensionbetween the design and marketing as key businessfunctions in fashion companies, among others, are:M. Vasiljević [1], H. Bloch Peter [2], B.B. De Mozota[3], J. Bohdanovich, L. Clamp [4], M. Gašović [5],H. Yen [7], Ph. Kotler, L. Keller [9], K. Best [10]. The following authors have especially dealt with therelationship between designers and marketingexperts: M. Easey [6], B.M. Beverland [12], D. Zhang[13].Research results of the mentioned authors point to apronounced complexity of the fashion market. Such afact objectively imposes a lot of difficulties to design-ers and marketing experts, whose activities are veryintertwined and dependent on each other. Tensions between designers and marketing expertshave been the subject of the study of the authors ofthis paper as well. Publications of the mentioned
authors, who did research in this area, were initiallyconsidered. That activity has resulted in the synthe-sis of their views presented through the parts of thispaper with the headlines: The views of designers;the views of marketing experts. Then, during the 10th
and 11th months of 2015 it was published primaryresearch on a sample of 50 fashion companies in theWestern Balkans. It was conducted a survey ofdesigners engaged, as well as the survey of theHeads of Design Departments in larger companies.On the other hand, depth interviews were conductedwith 20 marketing experts. Due to the large scopemarketing activities covered, it has been discussedwith various persons who are directly addressed incooperation with designers. Interviewed artists arethe designers of fashion garments in the field ofknitwear, lingerie, denim and, mass market product.They expressed their opinions by answering to tenquestions related to: freedom to create, participationin decision making on assortment, perception and therole of marketing, existence of disagreements withmarketing experts, causes of the disagreement, etc.Interviewed marketing experts announced their viewson: the role of design in product differentiation, mis-understandings with the designers, the causes of thesemisunderstandings, disagreements when designingprice, making the selection of fabrics, the requirementsof key customers, validation and acceptance of theresults of marketing research, etc. They are engagedin their companies as: consultants of marketingissues, head of marketing departments, independent
158industria textila 2018, vol. 69, nr. 2˘
The concept of fashion marketing as an instrument of reducing tensionsbetween designers and marketing experts in fashion companies
MILAN M. GAŠOVIĆ NIKOLA V. ĆURČIĆDJURDJICA DJ. VUKAJLOVIĆ
REZUMAT – ABSTRACT
Conceptul de marketing de modă ca instrument de reducere a tensiunilor dintre designeri şi experțiiîn marketing din companiile de modă
Tensiunile dintre designeri și experții în marketing din companiile de modă sunt create în mare măsură deoarecevalorile de design se opun valorilor marketingului. Printre altele, o mai bună înțelegere a conceptului de marketing demodă, care se bazează pe respectul egal pentru design, clienți și profiturile companiilor de modă, contribuie la limitareaneînțelegerilor. Acest fapt a fost confirmat de cercetările efectuate în țările din Balcanii de Vest.
Cuvinte-cheie: tensiuni, designeri, experți în marketing, concept de marketing de modă
The concept of fashion marketing as an instrument of reducing tensions between designers and marketingexperts in fashion companies
Tensions between designers and marketing experts in fashion companies are created largely because the design valuesare opposing to the values of marketing. Among other things, a better understanding of the concept of fashion marketing,which is based on equal respect for design, customers and profits of fashion companies, contributes to the reduction ofmisunderstanding. It has been confirmed by research carried out in the countries of the Western Balkan.
Keywords: tensions, designers, marketing experts, fashion marketing concepts
DOI: 10.35530/IT.069.02.1409
associates for marketing issues, sales managers,agents and managers of retail stores.
SUBJECT, OBJECTIVE AND RESEARCHMETHODOLOGY
The subject or issue of this paper refers to the mis-understandings between the designers and market-ing experts in the fashion companies that producegarments. The operational definition of the subject ofresearch is focused on companies that produce fash-ion products for the mainstream market in the coun-tries of the Western Balkan. In this research the authors try to identify the causesof the tensions between the designers and marketingexperts, and discover the common ground betweentheir points of view.Starting from the object and purpose of the research,two hypotheses have been imposed. The firsthypothesis is that tensions between the designersand marketing experts are real. The second hypoth-esis is that their relation and cooperation can beimproved by better understanding and implementa-tion of the fashion marketing concept which presup-poses equal respect for both designers and market-ing experts’ views. Several methods of research were applied in thepaper. The initial method used in this research shouldshow the dominant point of view of renowned authorswho have discussed the relations between designersand marketing experts in fashion companies. The pri-mary research was done based on sources takenfrom literature mentioned in Introduction. The research method authors used is the fieldresearch (surveys with designers and interviews withmarketing experts) are made in order to collect dataand information from primary sources. Other meth-ods presented in this paper are: descriptive method,method of analysis and synthesis, method of con-cluding, etc.The method of sample selection for surveys andinterviews was conditioned on the size, success,product range. The way how managers and/or own-ers of the companies treat their designers and mar-keting experts of their companies has also been a cri-terion. The sample size of 50 fashion companies in arelatively small region as Western Balkans is trulyrepresentative. According to the method of selection,it is a deliberate sample. This sample type wasselected because the researchers were familiar withthe structure of the fashion market in the WesternBalkans. The respondents were the head designers, leadingdesigners and designers-external associates whowere engaged by contract for designing work in fash-ion companies.Interviews were realized with 20 marketing expertswho had to cooperate with designers because of theirunique work position. Most often these were: headsof the marketing departments, consultants for mar-keting jobs, independent associates for marketing
jobs, sales managers, agents and managers of larg-er retail stores.
THE VIEWS OF FASHION DESIGNERS
According to M. Vasiljević, author of numerous publi-cations in field of fashion design, fashion productsare considered to be a result of a fashion design pro-cess [1]. Likewise, designers require that design isseen as an additional attribute that is added to thevalue of products. There are four key components ofproducts that make up the design of fashion productsdifferent from competitors’. In addition to the aesthet-ic component (shape, colour, style), there is a techni-cal and functional component (functionality, reliability,performance, reversibility) and ergonomic compo-nent (comfort). The design of packaging and labels,as an integral part of the overall product design with-out which products cannot enter the market, is alsodesigners’ responsibility. The designers do not men-tion at all the role of marketing, nor the requirementsand desires of customers which can be obtained dur-ing marketing activities. P. Bloch, the author who deals with the relationshipbetween product design and marketing, says thatdesigners emphasise their design principles thathave an impact on customers’ preference and are thebasis for understanding of their aesthetic reaction [2].The principle of shape of the product is the principleof “unity” or “whole”. Many different elements formthe shape of the product, and they are all selectedand united into a whole by the designer, with the pur-pose of causing a sensory effect. Designers makedecisions, not only on the shape of the products, butalso on their size, proportion, material, colour, orna-ments, texture, etc., in order to form their optimalcombination. These design statements ignore mar-keting research in terms of customer perceptionregarding the aesthetic component of design.According to B.B. De Mozote’s research, designers’attitude regarding the brand stands out [3]. Theydemand that the relationship between design andbrand is not reduced exclusively to graphic design,logo or sign. Rather, design is present in all aspectsof brand equity: mission, promise, positioning, feeling(expression) and quality. All non-verbal elements ofthe brand (colour, logo, appearance) can be designed.Graphic design refers to the name and symbol of thebrand, while the design of a product is related to itsperformance. The design of packaging refers topackaging appearance, and interior design refers tothe layout of retail stores. L. Bohdanovich and M. Clamp, famous names in thefashion marketing, claim that top designers creategarments of haute couture [4]. This type of productsis available only to premium customers and they areoffered with other fashion items such as jewellery andcosmetics. These are unique items, mainly producedby the rules determined by the world’s fashion cen-tres such as Paris, Milan, London, etc. The originali-ty and quality of these models are guaranteed, and
159industria textila 2018, vol. 69, nr. 2˘
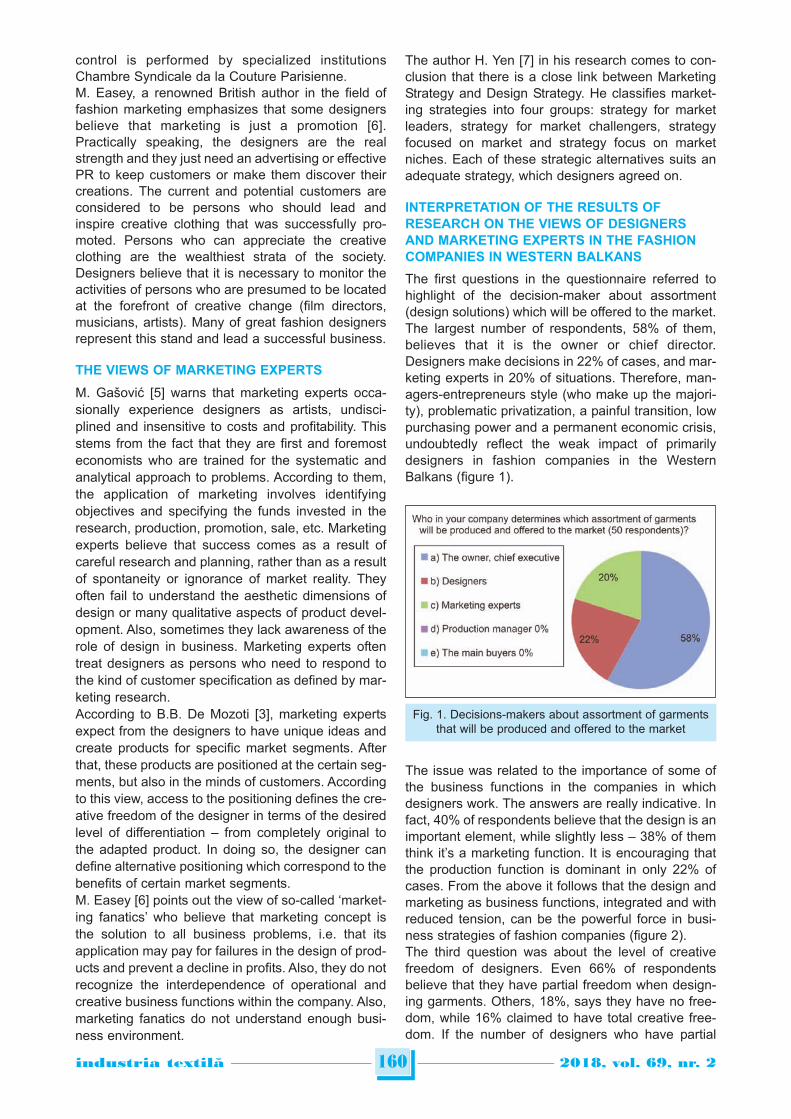
control is performed by specialized institutionsChambre Syndicale da la Couture Parisienne. M. Easey, a renowned British author in the field offashion marketing emphasizes that some designersbelieve that marketing is just a promotion [6].Practically speaking, the designers are the realstrength and they just need an advertising or effectivePR to keep customers or make them discover theircreations. The current and potential customers areconsidered to be persons who should lead andinspire creative clothing that was successfully pro-moted. Persons who can appreciate the creativeclothing are the wealthiest strata of the society.Designers believe that it is necessary to monitor theactivities of persons who are presumed to be locatedat the forefront of creative change (film directors,musicians, artists). Many of great fashion designersrepresent this stand and lead a successful business.
THE VIEWS OF MARKETING EXPERTS
M. Gašović [5] warns that marketing experts occa-sionally experience designers as artists, undisci-plined and insensitive to costs and profitability. Thisstems from the fact that they are first and foremosteconomists who are trained for the systematic andanalytical approach to problems. According to them,the application of marketing involves identifyingobjectives and specifying the funds invested in theresearch, production, promotion, sale, etc. Marketingexperts believe that success comes as a result ofcareful research and planning, rather than as a resultof spontaneity or ignorance of market reality. Theyoften fail to understand the aesthetic dimensions ofdesign or many qualitative aspects of product devel-opment. Also, sometimes they lack awareness of therole of design in business. Marketing experts oftentreat designers as persons who need to respond tothe kind of customer specification as defined by mar-keting research. According to B.B. De Mozoti [3], marketing expertsexpect from the designers to have unique ideas andcreate products for specific market segments. Afterthat, these products are positioned at the certain seg-ments, but also in the minds of customers. Accordingto this view, access to the positioning defines the cre-ative freedom of the designer in terms of the desiredlevel of differentiation – from completely original tothe adapted product. In doing so, the designer candefine alternative positioning which correspond to thebenefits of certain market segments. M. Easey [6] points out the view of so-called ‘market-ing fanatics’ who believe that marketing concept isthe solution to all business problems, i.e. that itsapplication may pay for failures in the design of prod-ucts and prevent a decline in profits. Also, they do notrecognize the interdependence of operational andcreative business functions within the company. Also,marketing fanatics do not understand enough busi-ness environment.
The author H. Yen [7] in his research comes to con-clusion that there is a close link between MarketingStrategy and Design Strategy. He classifies market-ing strategies into four groups: strategy for marketleaders, strategy for market challengers, strategyfocused on market and strategy focus on marketniches. Each of these strategic alternatives suits anadequate strategy, which designers agreed on.
INTERPRETATION OF THE RESULTS OFRESEARCH ON THE VIEWS OF DESIGNERSAND MARKETING EXPERTS IN THE FASHIONCOMPANIES IN WESTERN BALKANS
The first questions in the questionnaire referred tohighlight of the decision-maker about assortment(design solutions) which will be offered to the market.The largest number of respondents, 58% of them,believes that it is the owner or chief director.Designers make decisions in 22% of cases, and mar-keting experts in 20% of situations. Therefore, man-agers-entrepreneurs style (who make up the majori-ty), problematic privatization, a painful transition, lowpurchasing power and a permanent economic crisis,undoubtedly reflect the weak impact of primarilydesigners in fashion companies in the WesternBalkans (figure 1).
The issue was related to the importance of some ofthe business functions in the companies in whichdesigners work. The answers are really indicative. Infact, 40% of respondents believe that the design is animportant element, while slightly less – 38% of themthink it’s a marketing function. It is encouraging thatthe production function is dominant in only 22% ofcases. From the above it follows that the design andmarketing as business functions, integrated and withreduced tension, can be the powerful force in busi-ness strategies of fashion companies (figure 2).The third question was about the level of creativefreedom of designers. Even 66% of respondentsbelieve that they have partial freedom when design-ing garments. Others, 18%, says they have no free-dom, while 16% claimed to have total creative free-dom. If the number of designers who have partial
160industria textila 2018, vol. 69, nr. 2˘
Fig. 1. Decisions-makers about assortment of garmentsthat will be produced and offered to the market
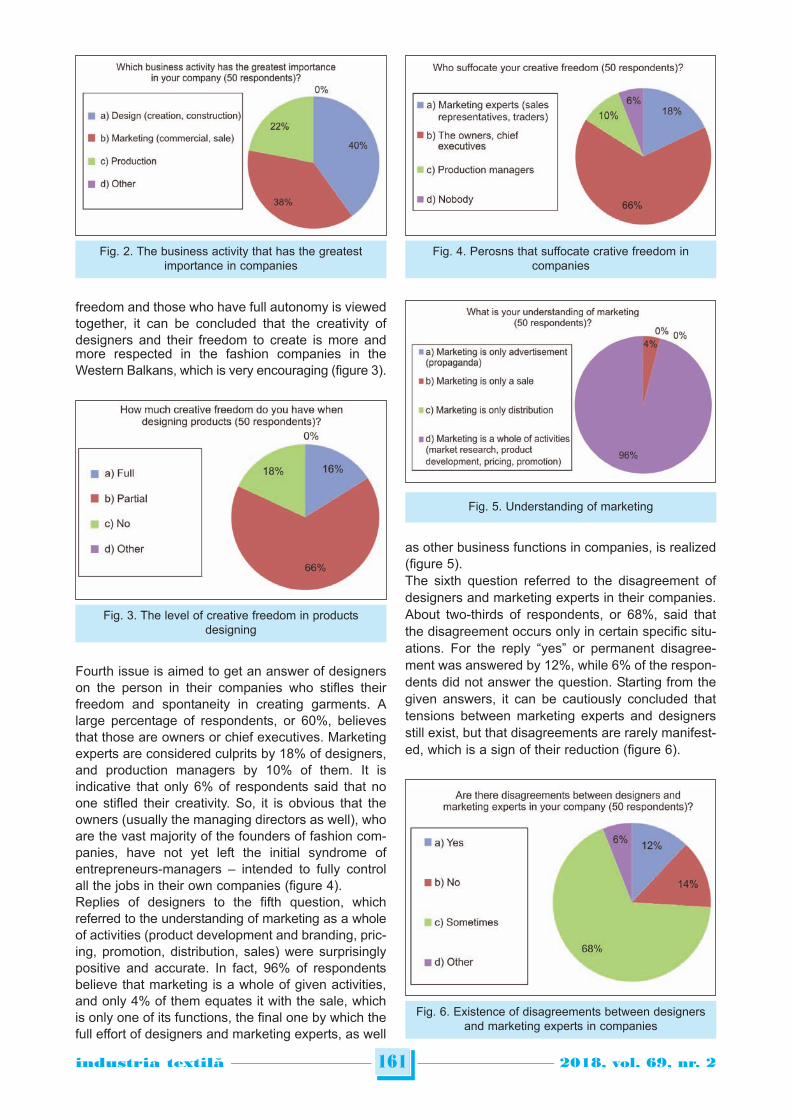
freedom and those who have full autonomy is viewedtogether, it can be concluded that the creativity ofdesigners and their freedom to create is more andmore respected in the fashion companies in theWestern Balkans, which is very encouraging (figure 3).
Fourth issue is aimed to get an answer of designerson the person in their companies who stifles theirfreedom and spontaneity in creating garments. Alarge percentage of respondents, or 60%, believesthat those are owners or chief executives. Marketingexperts are considered culprits by 18% of designers,and production managers by 10% of them. It isindicative that only 6% of respondents said that noone stifled their creativity. So, it is obvious that theowners (usually the managing directors as well), whoare the vast majority of the founders of fashion com-panies, have not yet left the initial syndrome ofentrepreneurs-managers – intended to fully controlall the jobs in their own companies (figure 4).Replies of designers to the fifth question, whichreferred to the understanding of marketing as a wholeof activities (product development and branding, pric-ing, promotion, distribution, sales) were surprisinglypositive and accurate. In fact, 96% of respondentsbelieve that marketing is a whole of given activities,and only 4% of them equates it with the sale, whichis only one of its functions, the final one by which thefull effort of designers and marketing experts, as well
as other business functions in companies, is realized(figure 5). The sixth question referred to the disagreement ofdesigners and marketing experts in their companies.About two-thirds of respondents, or 68%, said thatthe disagreement occurs only in certain specific situ-ations. For the reply “yes” or permanent disagree-ment was answered by 12%, while 6% of the respon-dents did not answer the question. Starting from thegiven answers, it can be cautiously concluded thattensions between marketing experts and designersstill exist, but that disagreements are rarely manifest-ed, which is a sign of their reduction (figure 6).
161industria textila 2018, vol. 69, nr. 2˘
Fig. 2. The business activity that has the greatestimportance in companies
Fig. 3. The level of creative freedom in productsdesigning
Fig. 4. Perosns that suffocate crative freedom incompanies
Fig. 5. Understanding of marketing
Fig. 6. Existence of disagreements between designersand marketing experts in companies
Question seven asked designers to answer on thecauses of their disagreement with marketing experts.More than half of respondents, or 56%, claim that themain reason lies in the unwillingness of marketingexperts for market risk when it comes to the adoptionof new, original design solutions. For the offeredanswer that suggests the impossibility of expressingtheir creative potential through the acceptance oftheir models, 8% of respondents opted, while 10% ofthem consider that marketing experts underestimatetheir knowledge, talent and effort. However, a signifi-cant percentage of respondents, 26%, gave a self-critical response about mutual misunderstanding asthe cause of disagreement between designers andmarketing experts (figure 7).
The question eight referred to the possible existenceof awareness of designers on the state in their com-pany and market, when they make decisions onwhich models will be produced in a series and offeredto the market. More than half of respondents, or 54%,think that traders and managers of stores may havea different opinion on their offered models. For theoffered answer, that management can warn of highcosts and problematic profitability of their creations,opted 32% of respondents. The remaining respon-dents, or 6%, consider that the cause of rejection ofthe new models can lie in scepticism of production interms of technical and technological feasibility ofthese models. For the answer “Testing of attitudes oflarge, existing customers are not optimistic” optedonly 4% of the respondents (figure 8.).
The question nine referred to the views of designersrelated to claims of marketing experts that the suc-cess on the fashion market requires: carefulresearch, planning, respect for market reality, respectfor the competitors and the level of their prices, etc.Almost two thirds of respondents, or 64%, only par-tially agree with the foregoing, the typical marketingattitude. However, a significant percentage of respon-dents, or 36%, fully agrees with the views of market-ing experts. As it can be seen, most of the designers
only partially agree with the statements of marketingexperts (figure 9).The tenth question referred to the views of designerson whether the changes in the educational system ofdesigners (the study of the principles of fashion mar-keting) and marketing experts (study of design princi-ples) could help in bridging their disagreement. Theanswers were surprising and encouraging: all 50designers, therefore 100% of respondents answeredaffirmatively to the question (figure 10)The second part of the research was carried out intwenty fashion companies in the Western Balkans.Testing of marketing experts was conducted in theperiod from October to November 2015. The usedtechnique was the personal-depth interview, whichassumes a formal, direct questions and informal con-versation. The purpose was to get respondents indi-cate free views about their disagreements withdesigners. Direct questions were related to: the roleof designers in differentiation of products, the exis-tence of disagreement, the reasons of good cooper-ation, and misunderstandings with young designersabout production material, price, selection of collec-tions for the upcoming season, about the require-ments of large customers, the meaning of marketingresearch, caused by company owners and related todifferences in formal education.
162industria textila 2018, vol. 69, nr. 2˘
Fig. 7. The causes of disagreement between designersand marketing experts
Fig. 8. Terms of designing new models in companiesand market
Fig. 9. Claims about requires for success
It has been asked if there is a misunderstanding withthe designers with whom they work in their compa-nies, 25% of marketing experts responded negative-ly. As reasons for the good cooperation and under-standing of the experience of designers, their respectfor market requirements and specific situations thatare told precisely by them have been specified.The remaining 75% marketing experts draws atten-tion to different (occasional) causes of disagreementwith designers. Most complaints (32%) are given toyounger designers, because of their pretension orattitude that they need marketing experts only for thepromotion of their models and for the offer to cus-tomers.About 23% of respondents state design proposalsrelated to the material for making garments as a rea-son for misunderstanding. They do not dispute theright of designers in selection of the material, but theypoint out that the selected material is often tooexpensive which threatens the planned profitability ofthese products. In fact, based on the purchasingpower of their target customer and the price of simi-lar competing products, they consider that theincrease of the final selling price is not possible. Disagreements are also present at the final evalua-tion, i.e. selection of models that should be producedin series for next season. 57% of marketing expertsthink that the applause of the present, selected audi-ence at fashion is not sufficient guarantee for themarket acceptance of those models that are carriedby mannequins, which is not the designers’ opinion. Misunderstandings occur because of the demandsand proposals of the key long-standing customers,those bound to both, the design and assortment ofgarments. Marketing experts consider that theseclaims should be accepted, and then, after the mar-ket testing, necessary redesigning and selection ofassortment, should be carried out.All interviewed marketing experts believe that design-ers cannot ignore the results of marketing research
as a basis for their creative efforts in the process offashion designing. Marketing experts almost completely agree withdesigners when it comes to excessive interference ofcompanies’ owners in their affairs.Misunderstandings could be reduced if designersacquired more marketing knowledge, and marketingexperts learn more about design.
THE CONCEPT OF FASHION MARKETING ASA POSSIBILITY OF REDUCING TENSIONSBETWEEN DESIGNERS AND MARKETINGEXPERT
Fashion marketing can be viewed as a business phi-losophy that deals with current and potential cus-tomers of clothing, as well as with products and ser-vices that are related to clothing, with the intention toachieve long-term goals of fashion companies [5].The concept of fashion marketing should includepositive aspects of high interest in design, customersand profit, admitting the existence of interdepen-dence between marketing and design.Tensions between designers and marketing expertscan be reduced if designer realize that marketingcan improve the creative process, and if marketingexperts accept the fact that in fashion industry designmay, in addition to compliance with customer require-ments, dictate these requirements. Marketing expertsmay produce a bunch of information on customers’requirements, and analyze the offered illustrations,but cannot develop detailed specifications for designof fashion products. Marketing used in the fashionindustry has to respect the role of design [9].Reducing tensions between designers and marketingexperts would help the greater appreciation of post-modern society and its culture. In this sense, design-ers are increasingly creating products that are notdefined by a function, but its identity. At the sametime, an equal role in deciding on purchase have botha product and its image, i.e. and public image. Application of the concept of modern marketingassumes review of curricula according to whichdesigners and marketing experts are traditionallyeducated. Marketing students must study the pro-cess of product design. Design students have toknow the key principles of marketing, especially offashion marketing that affirms their position in fashioncompanies [9].The concept of fashion marketing assumes closerelationship between marketing strategy and designstrategy. It is necessary to harmonize marketingexperts and designers for each strategic option indi-vidually.For the success of the concept of modern marketingthe crucial thing is integration of marketing and designin the process of development of a new product. Bymaking the use of the product easier and its perfor-mance better, designers contribute to the differentiation
163industria textila 2018, vol. 69, nr. 2˘
Fig. 10. The agreement on the importance of the princi-ples and techniques of marketing, i.e. design within theeducational system in contribution to better cooperation
between designers and marketing experts
of products and attracting customers. Marketingexperts provide information to designers on theneeds of customers, competition and problems inexisting products. Working together with marketingexperts, designers can generate and visualize ideasthat are sent to check. When the idea is visually pre-sented, marketing experts, together with the design-ers consider the decision and discuss whether it isfeasible. In the later stages of product developmentprocess, marketing experts test new models and col-lections before launching them into production. Newmodels must be secured by the designer. Marketingexperts have the responsibility of providing informa-tion, feedback and recommendations to designers.One of the complex activities of the fashion market-ing is foresight. However, designers and marketingexperts need to be aware that some changes in thebusiness environment and activities of competingfirms cannot be fully predicted. They both know thatthe fashion industry is known for its high rate of fail-ure of new products, as well as regular discounts fordesigned products that could not be sold in the peri-od of the main season.Failures are partly a reflection of the high risk thatcharacterizes the fashion market. They may also bea result of inadequate application of the concept offashion marketing. However, practice shows thatproper application of fashion marketing reducesuncertainty in the fashion industry and reduces thenumber of business failures [10].
CONCLUSION
Tensions between designers and marketing expertsin choosing the range of garments for the market arecertainly the consequence of distinct values in whichthey believe, shortcomings in their formal education,years of experience, the structure of the fashion mar-ket, etc.There are also the areas in which designers and mar-keting experts have the undivided attitude about val-ues. Successful designers and marketing expertsagree that succeed requires careful preparation andimplementation of professional skills, they under-stand the importance of communication even thoughthey attach greater importance to their visual aspect.
They tend to agree on the functional component ofgarments design.Conducted research shows some specifics in viewsof designers of the Western Balkans related to theirposition in the fashion companies, and even mild ten-dency toward understanding the point of view of mar-keting experts. Fashion designers of the WesternBalkans bother the owners-managers, who some-times make all the decisions by themselves, eventhose concerning which new models will be producedand offered in the market. They expect from market-ing experts timely information on fashion trends, cus-tomers’ reactions to their models, insight into theresults of the final sales to end customers, the levelof competitive prices, etc. Similarly, marketingexperts can help designers in creating a profile ofcustomers at the predetermined target market. Theybelieve that the misunderstandings between thedesigners and marketing experts can be reduced bybetter mutual communication, as well as by changesin educational programs in both areas.The views of marketing experts engaged in fashioncompanies in the Western Balkans, generally speak-ing, do not differ from those found in the literature.From the knowledge obtained through the interviewswith 20 marketing experts, it can be noted a signifi-cant increase of appreciation of the role of thedesigner. However, they, as well as designers, com-plain about the non-compliance of risk and misunder-standing of the owners-managers. The main issueson which they disagree with designers include:reduction of marketing only to promotion, lack ofappreciation for the results of marketing research, therole of large customers, pretentiousness of youngdesigners, the selection of new models, the selectionof materials, lack of sensitivity to costs, etc.Application of the concept of fashion marketing cangreatly reduce misunderstandings between thedesigners and marketing experts. The concept basi-cally has equal appreciation of design and marketing,creative freedom and market reality, inspiration ofdesigners and calculations of marketing experts. In aword, according to the concept of fashion marketing,designers must take into account the logic of profit,while marketing experts must pay attention to theiremotions, which are the basis for that “something”that makes new creations specific.
164industria textila 2018, vol. 69, nr. 2˘
BIBLIOGRAPHY
[1] Vasiljević, M. Dizajn – savremeni pogledi, In: Belgrade, 2005, Novi Dani, pp. 267–268.
[2] Bloch, P. Product Design and Marketing: Reflections after fifteen years, In: Journal of Product InnovationManagement. 2011, no. 28, pp. 378–380.
[3] De Mozota, B.B. Design management: Using design to built brand value and corporate innovation, Allworth Press,New York, 2003, ISBN 1-58115-283-3.
[4] Bohdanovich, J., Clamp, L. Fashion marketing, Routladge London and New York, 1995, ISBN 0-415-05939-9.
[5] Gašović, M. Modni marketing. Institute of Economic Sciences, Belgrade, 1998, ISBN 86-80315-40-0.

165industria textila 2018, vol. 69, nr. 2˘
Authors:
MILAN M. GAŠOVIĆ 1
DJURDJICA DJ. VUKAJLOVIĆ 2
NIKOLA V. ĆURČIĆ 2
1 Tehnical Faculty, University Singidunum,Danijelova 32, 11 000 Belgrade, Serbia
2 University Business Academy in Novi Sad, Faculty of Applied Management, Economics and Finanse,Jevrejska 24/I, 11 000 Belagrade, Serbia
e-mail: [email protected]; [email protected]
Corresponding author:
DJURDJICA DJ. VUKAJLOVIĆe-mail: [email protected]
[6] Easey, M. Fashion marketing, Blackwell Science, London, 1995, ISBN 0-632-03459-9.
[7] Hsu, Y. Design innovation and marketing strategy in successful product competition, In: Journal of Business &Industrial Marketing 26/4 nr. 9, 2011, pp. 223–236.
[8] Gašović, M. Mogućnosti poboljšanja saradnje između dizajnera i stručnjaka za marketing u modnim poduzećima,In: Tekstil, vol. 62, no. 3–4, pp. 174–185, Zagreb, 2013.
[9] Kotler, P., Keller, L.K. Marketing menadžment, In: XII edition, Data Status, Belgrade, 2006, ISBN 86-7478-013-X.
[10] Petrović, V., Gašović, M. Modna kolekcija, ISBN 978-86-7672-257-0, Technical faculty “Mihajlo Pupin”, Zrenjanin,2016.
[11] Best, K. The Fundamentals of Design Management, AVA Publishing Sa Lausanne, Switzerland, 2010, ISBN 978-2-940411-07-8.
[12] Beverland, B.M. Managing the design innovation – Brand Marketing Interface: Resolving the tension betweenArtistic Creation and Commercial Imperatives, In: Journal of Product Innovation Management No. 22, 2005,pp. 193–207.
[13] Hsu, Y. Design innovation and marketing strategy in successful product competition, In: Journal of Business &Industrial Marketing, vol. 26, no. 42011, pp. 223–236.
[14] Zhang, D., Peng, H., KotabeO, M. Marketing – Industrial Design in New Product Development: The case of China,In: Journal of Product Innovation Management, No. 28, 2011, pp. 360–373.