remedy simulation of a mono-phase fault on a · pdf fileremedy simulation of a mono-phase...
TRANSCRIPT
U.P.B. Sci. Bull., Series C, Vol. 73, Iss. 1, 2011 ISSN 1454-234x
REMEDY SIMULATION OF A MONO-PHASE FAULT ON A 110 kV AERIAL ELECTRIC POWER LINE WITH THE
PURPOSE OF OBTAINING RESULTS APPLICABLE TO THE PROTECTION SYSTEM
Sebastian ANGHELESCU1
Articolul urmăreşte în principal exemplificarea modului de funcţionare a sistemului de protecţie în scopul clarificarii analizelor de incident, prin simularea unui defect. În analiza acestui defect, mărimiile electrice reprezentate de curenţi şi tensiuni sunt vizualizate din înregistrariile făcute pe baza sistemului de conducere a statiei electrice. Simularea a fost realizată cu ajutorul programului Matlab 7.8. prin care se modelează un defect în reţeaua electrică împreună cu sistemul de protectie destinat eliminării acestui defect .
This article mainly aims at illustrating the operating manner of the protection system with the aim to clarify incident analyses, by simulating a fault. In the analysis of this fault the electric measures, represented by electric currents and voltage measurements, are visualized through the recordings made by the management sistem of the electric station. The simulation is designed using Matlab 7.8 program with the aid of which, a fault in the electric network is modeled together with the protection system, which removes this fault.
Keywords: protection system, electric network, simulation
1. Introduction
Two pieces of software were used for the simulation of the electric network and for calculating the normal operation and short-circuit regimes.
Using Matlab, version 7.8, a mono-phase power failure for an electric network of 110 kV was modeled.
The configuration of the elements making up the electric network is selected from the factory bulletins and the technical standards in order that it might be analyzed for the actual, real situation.
For the purpose of drawing an accurate conclusion, it was compared with the real case, so that the simulation results with Matlab were analyzed in comparison with the results obtained at the tests on site, by injecting the voltage and current electrical magnitudes from the test set.
1 Eng., CN Transelectrica, Electric Transmission Branch, Bucharest, Romania, e-mail: [email protected], [email protected]
40 Sebastian Anghelescu
The aim of this paper is represented by the illustration of the operating manner of the protection system by means of analyzing and comparing the real case with the simulation case using the software mentioned.
2. Paper Contents The purpose of this paper is to know what is the operating manner of the
protection system for various regimes of operation depending on the evolution of the voltage and current magnitudes in view of simplifying the manner of operation.
The analysis of the incidents that may occur in the high voltage networks, depends on the manner of investigating the metering record of the electrical magnitudes which have caused the incident.
2.1 Electric Network Configuration through application in Matlab, Version 7.8
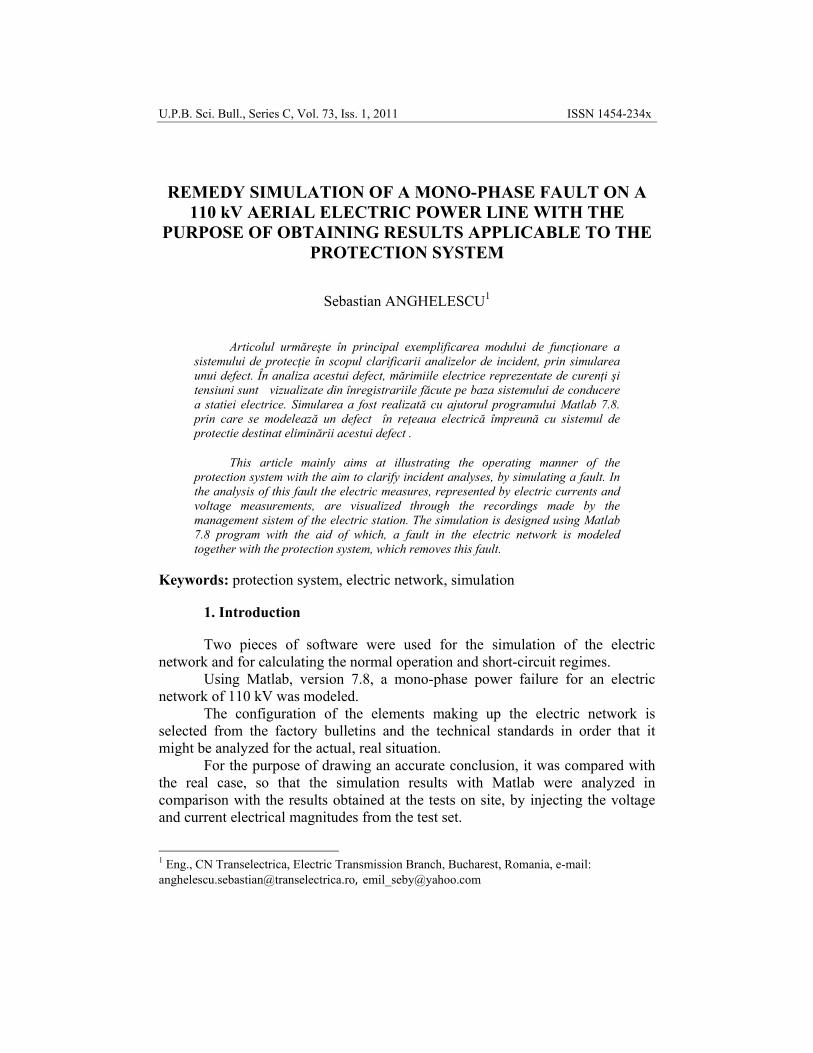
For Matlab, the same chosen electric network is parameterized as follows: The power source (Fig. 1) is characterized by the following parameters:
nominal operation voltage Un=220 kV; nominal operation frequency fn=50 Hz; grouping: Y-connection; short-circuit capacity: Sn=4000 MVA; ratio between reactance and resistance: 5.
Fig. 1. Power source block, 220 kV
Remedy simulation of a mono-phase fault on a 110 kV aerial electric power line (…) 41
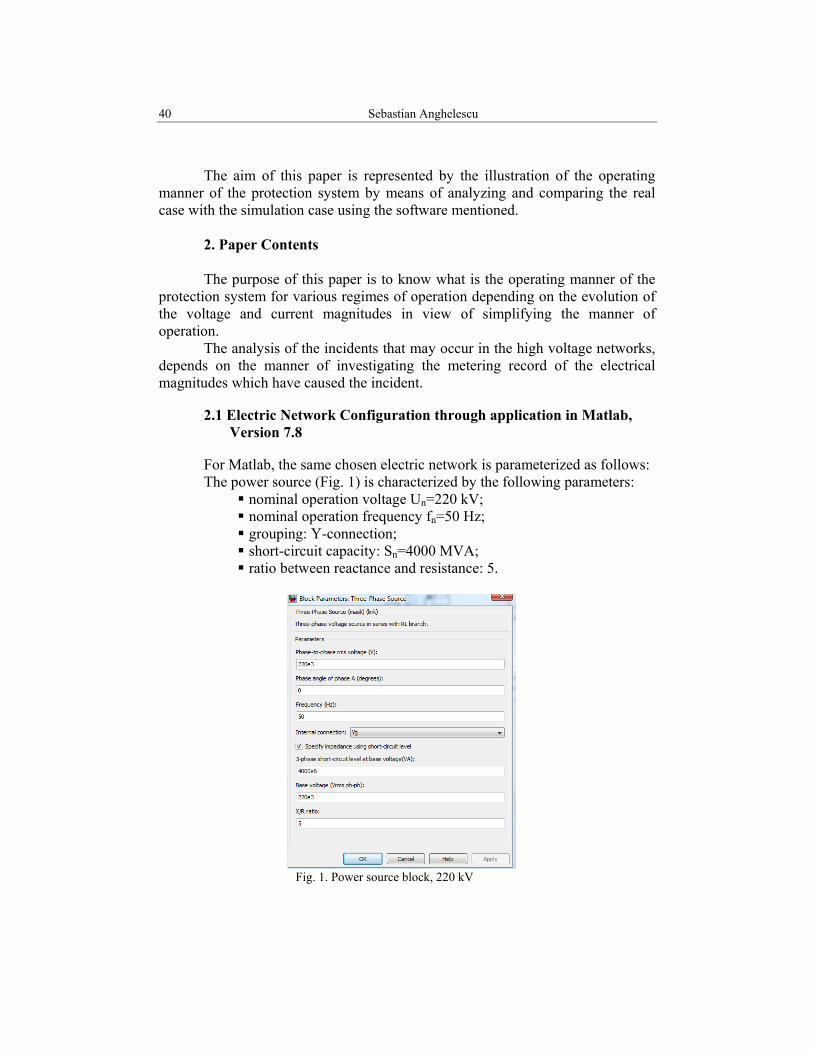
The power transformer (Fig. 2) is chosen to be a step-down transformer with double winding: 220/110kV and it is characterized by the following parameters: connection group for the high voltage winding of 220 kV, Y-connection; connection group for the low voltage winding of 110 kV: Y-connection; nominal operation voltage magnitudes: 220 kV and 110 kV; nominal capacity: Sn = 200 MVA; nominal operation frequency: fn=50 Hz; reistance: R1=0.363 Ω; inductance: L1=0.07 H; for the low voltage winding we have: nominal operation voltage: U2=110 kV; magnetizing inductance Lm=inf.
Fig. 2.Power tranformer block
The technical data making up the configuration of the chosen electric
transformation block, is selected from its factory bulletin, as per tables 1, 2 and 3. Table 1
Short-circuit test Winding
Im [A] Usc [kV] Usc [%] Supplied Under short-circuit
IT (13b) JT (121 kV) 500 22,06 9,55 Table2
Technical data Nominal capacity [MVA]
Voltage on primary winding
[kV]
Voltage on secondary winding
[kV]
Nominal currents on
primary winding
[A]
Nominal currents on secondary winding
[A]
Connection group
200 231 121 500 934.5 Yoyo
42 Sebastian Anghelescu
Table 3 Resistances of windings at the temperature of 26oC
Resistance of primary winding
[Ω]
Resistance of secondary winding
[Ω] 0.345 0.1147
Knowing the short-circuit voltage in [%], one can calculate the
transformer’s reactance:
n
nscT S
UuX2
100%⋅= (1)
fXL T
T ⋅⋅=
π2 (2)
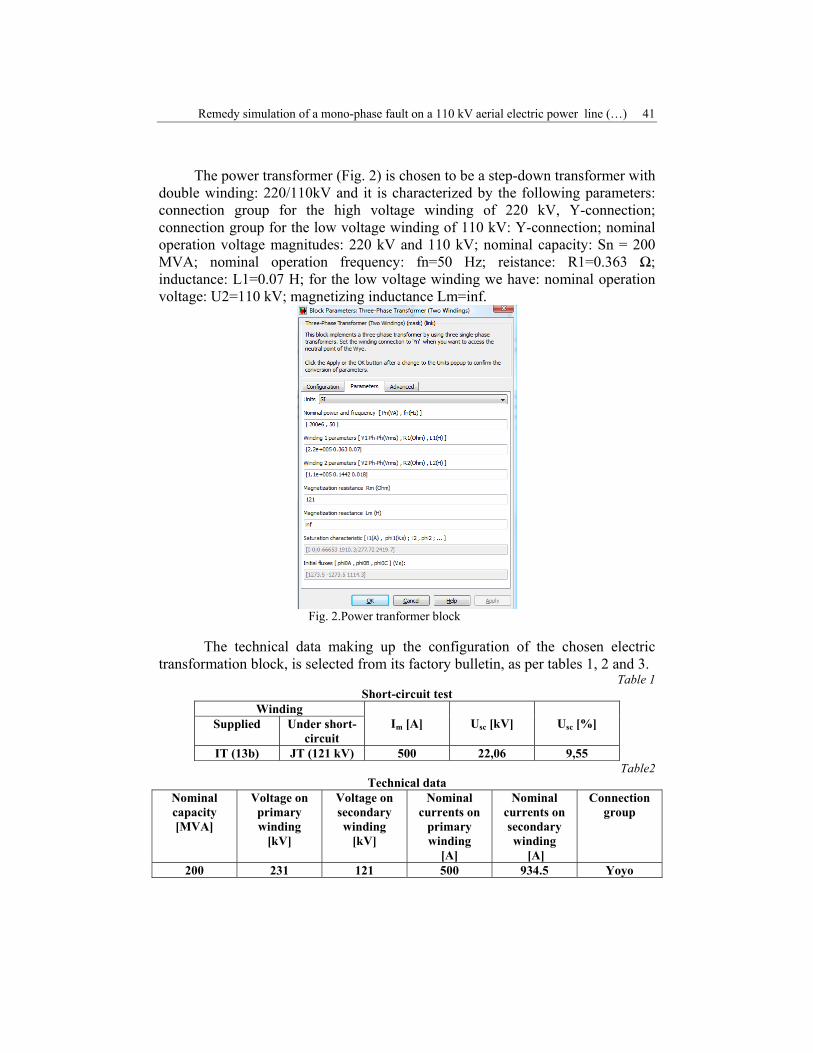
The power switch (Fig. 3) is a switch for the nominal operation voltage of 110 kV, having: breaking resistance of the electric arc: R=250 Ω; peak resistance: 5000 Ω; peak capacity: 10 F.
Fig. 3. Power switch block for 110 kV voltage
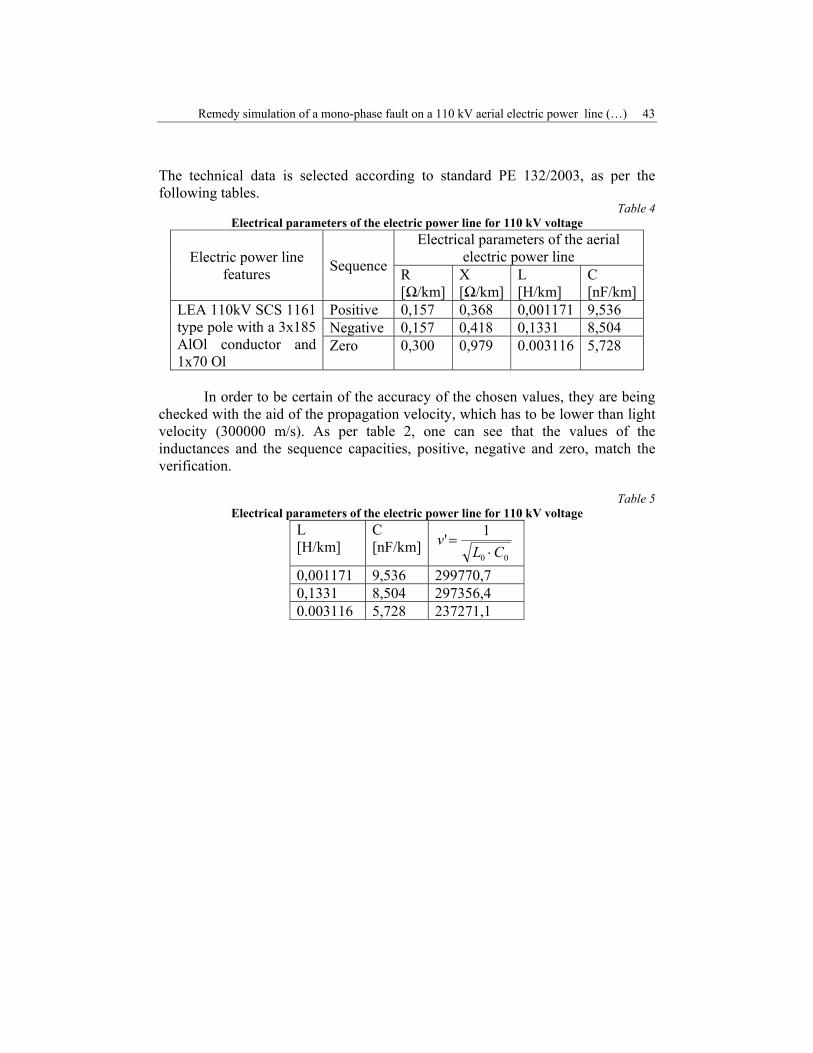
The electric power line (Fig. 4) is a three-phase power line and it works at
the nominal voltage of 110 kV, having the following parameters: nominal frequency, fn=50 Hz; the resistance, inductance and capacity of the line are distributed in the three symmetric sequence systems, plus, minus and zero, as follows: R+=R-=0.157 Ω/km; R0=0.300 Ω/km; L+=L-=0.011 H/km, L0=0.0031 H/km, C+=C-=9.53 nF/km; C0=5.7 F/km, and the length of the line is 90 km.
Remedy simulation of a mono-phase fault on a 110 kV aerial electric power line (…) 43
The technical data is selected according to standard PE 132/2003, as per the following tables.
Table 4 Electrical parameters of the electric power line for 110 kV voltage
Electric power line features Sequence
Electrical parameters of the aerial electric power line
R [Ω/km]
X [Ω/km]
L [H/km]
C [nF/km]
LEA 110kV SCS 1161 type pole with a 3x185 AlOl conductor and 1x70 Ol
Positive 0,157 0,368 0,001171 9,536 Negative 0,157 0,418 0,1331 8,504 Zero 0,300 0,979 0.003116 5,728
In order to be certain of the accuracy of the chosen values, they are being
checked with the aid of the propagation velocity, which has to be lower than light velocity (300000 m/s). As per table 2, one can see that the values of the inductances and the sequence capacities, positive, negative and zero, match the verification.
Table 5
Electrical parameters of the electric power line for 110 kV voltage L [H/km]
C [nF/km]
00
1'CL
v⋅
=
0,001171 9,536 299770,7 0,1331 8,504 297356,4 0.003116 5,728 237271,1
44 Sebastian Anghelescu
Fig. 4. Electric power line block for 110 kV voltage
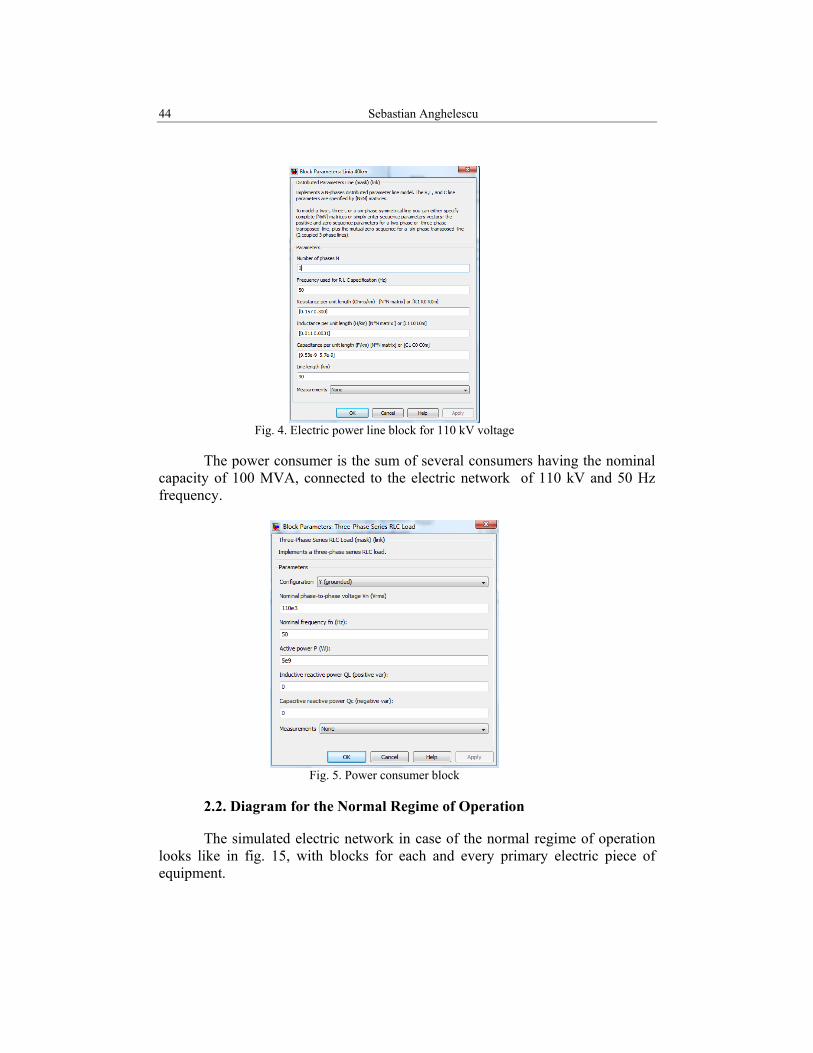
The power consumer is the sum of several consumers having the nominal
capacity of 100 MVA, connected to the electric network of 110 kV and 50 Hz frequency.
Fig. 5. Power consumer block
2.2. Diagram for the Normal Regime of Operation
The simulated electric network in case of the normal regime of operation looks like in fig. 15, with blocks for each and every primary electric piece of equipment.
Remedy simulation of a mono-phase fault on a 110 kV aerial electric power line (…) 45
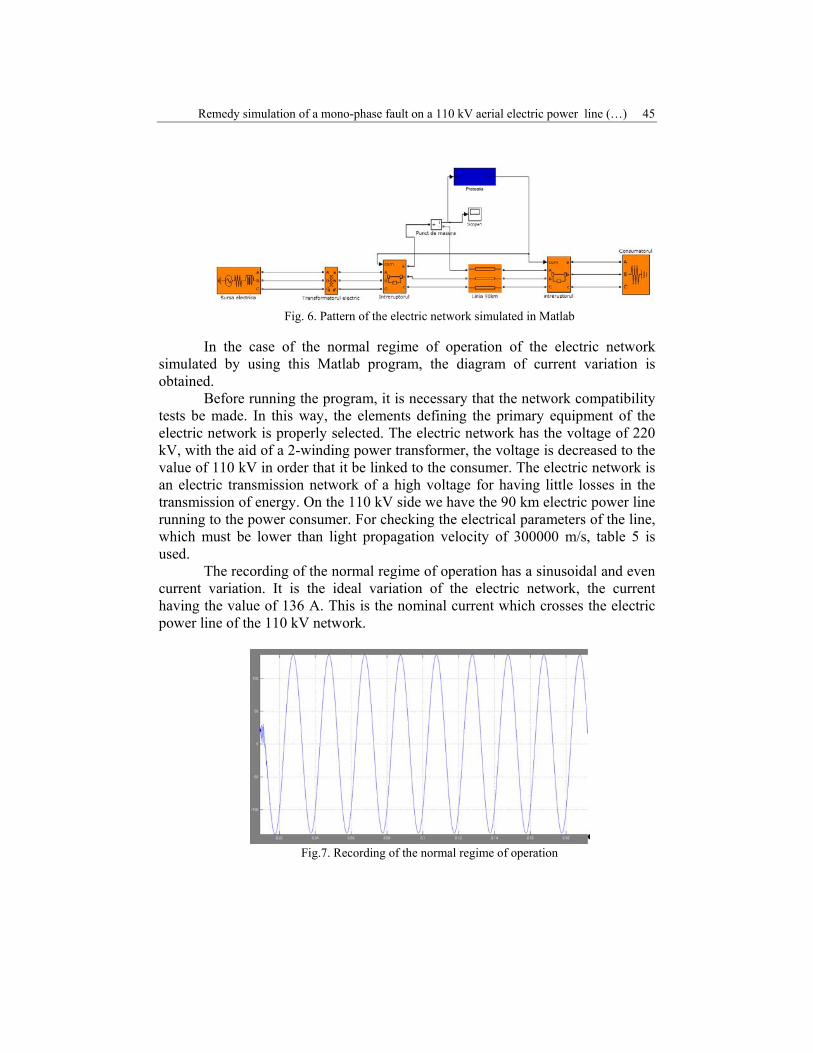
Fig. 6. Pattern of the electric network simulated in Matlab
In the case of the normal regime of operation of the electric network
simulated by using this Matlab program, the diagram of current variation is obtained.
Before running the program, it is necessary that the network compatibility tests be made. In this way, the elements defining the primary equipment of the electric network is properly selected. The electric network has the voltage of 220 kV, with the aid of a 2-winding power transformer, the voltage is decreased to the value of 110 kV in order that it be linked to the consumer. The electric network is an electric transmission network of a high voltage for having little losses in the transmission of energy. On the 110 kV side we have the 90 km electric power line running to the power consumer. For checking the electrical parameters of the line, which must be lower than light propagation velocity of 300000 m/s, table 5 is used.
The recording of the normal regime of operation has a sinusoidal and even current variation. It is the ideal variation of the electric network, the current having the value of 136 A. This is the nominal current which crosses the electric power line of the 110 kV network.
Fig.7. Recording of the normal regime of operation
46 Sebastian Anghelescu
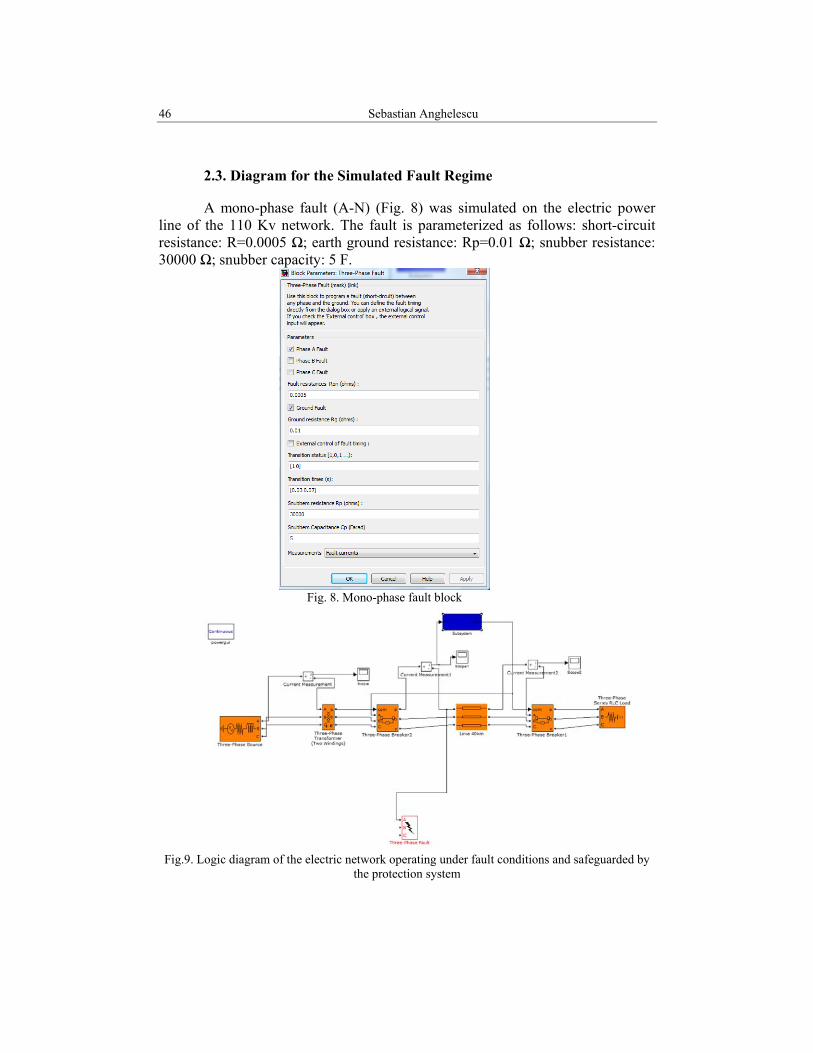
2.3. Diagram for the Simulated Fault Regime
A mono-phase fault (A-N) (Fig. 8) was simulated on the electric power line of the 110 Kv network. The fault is parameterized as follows: short-circuit resistance: R=0.0005 Ω; earth ground resistance: Rp=0.01 Ω; snubber resistance: 30000 Ω; snubber capacity: 5 F.
Fig. 8. Mono-phase fault block
Fig.9. Logic diagram of the electric network operating under fault conditions and safeguarded by
the protection system
Remedy simulation of a mono-phase fault on a 110 kV aerial electric power line (…) 47
The electric network under the fault regime simulated in Matlab is represented in fig. 17. The fault occurs on the electric power line, phase A with ground N. In this way, the current is absorbed, the short-circuit current occurs, which exceeds the nominal value of this current.
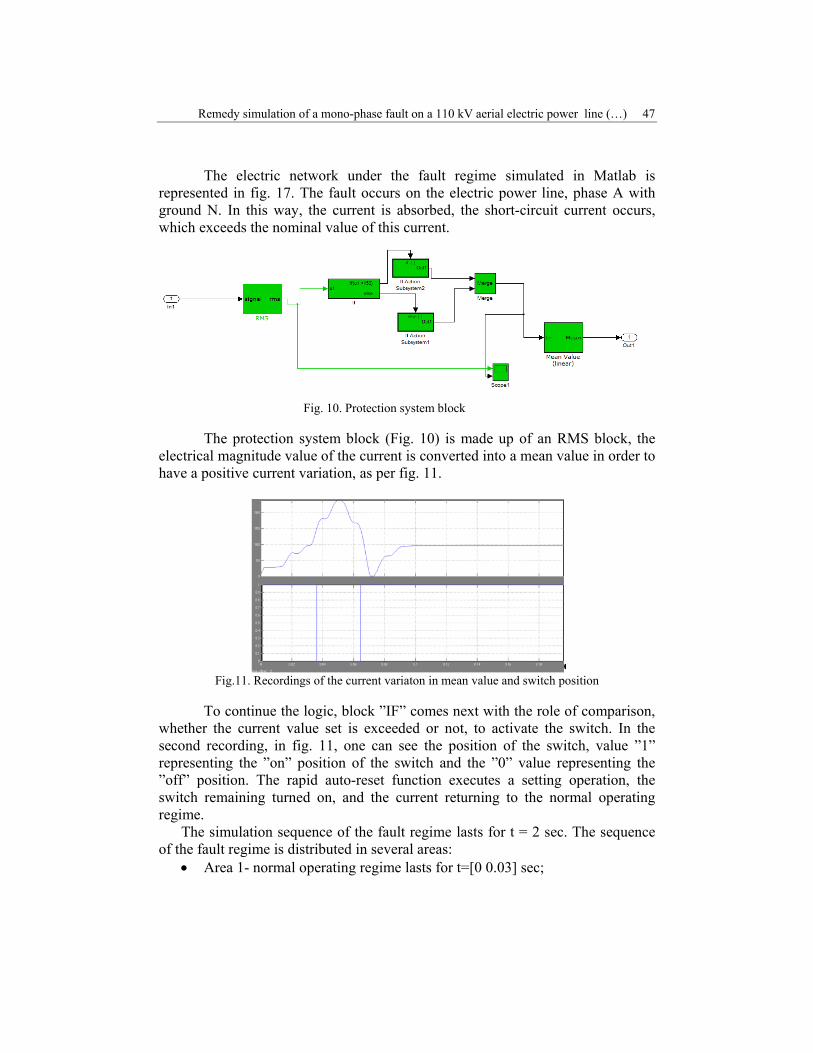
Fig. 10. Protection system block
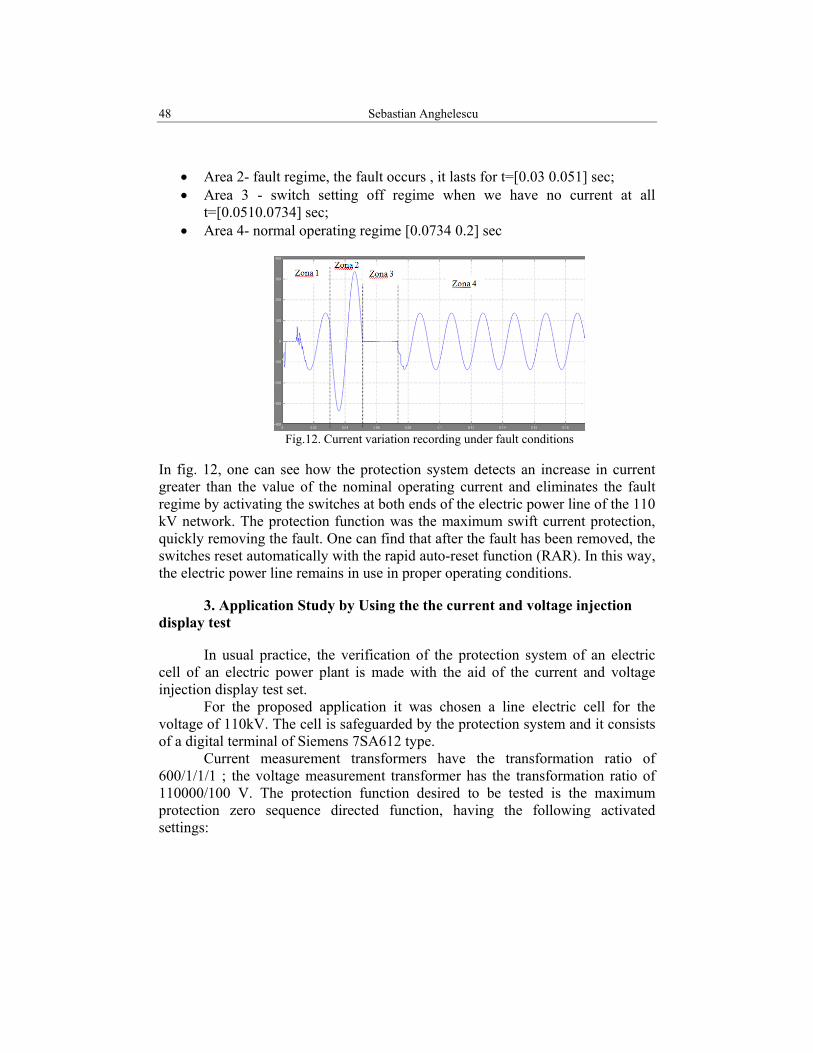
The protection system block (Fig. 10) is made up of an RMS block, the
electrical magnitude value of the current is converted into a mean value in order to have a positive current variation, as per fig. 11.
Fig.11. Recordings of the current variaton in mean value and switch position
To continue the logic, block ”IF” comes next with the role of comparison,
whether the current value set is exceeded or not, to activate the switch. In the second recording, in fig. 11, one can see the position of the switch, value ”1” representing the ”on” position of the switch and the ”0” value representing the ”off” position. The rapid auto-reset function executes a setting operation, the switch remaining turned on, and the current returning to the normal operating regime.
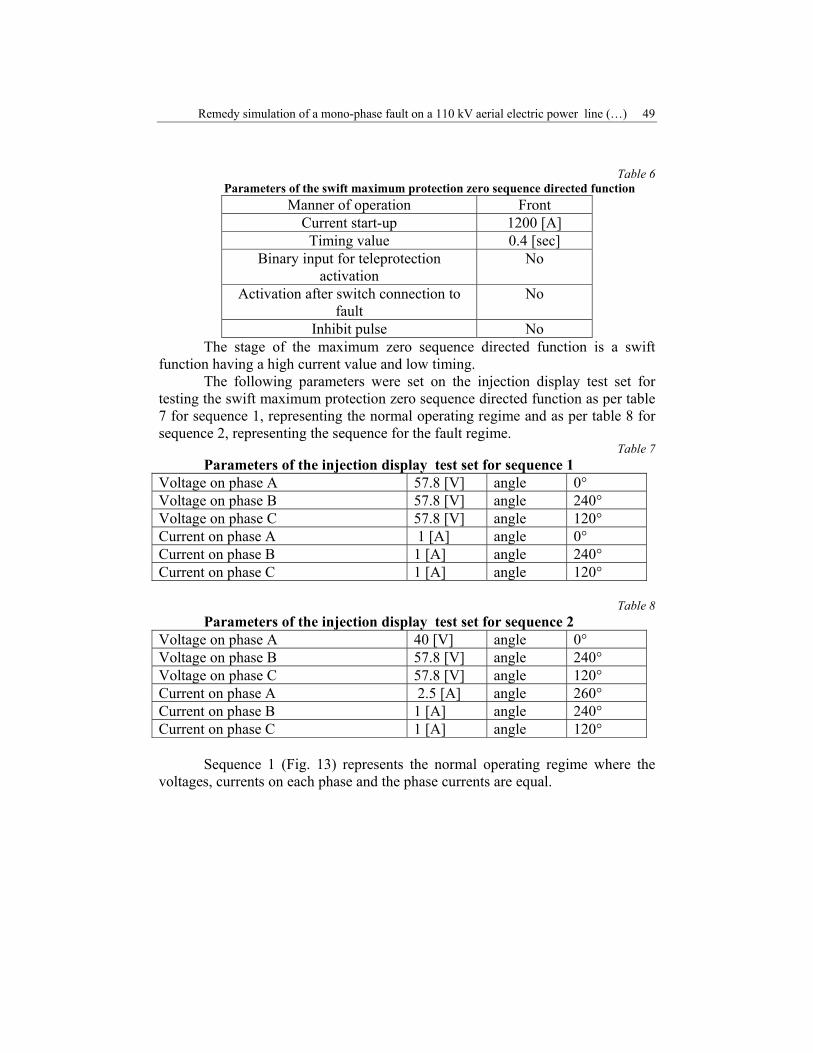
The simulation sequence of the fault regime lasts for t = 2 sec. The sequence of the fault regime is distributed in several areas:
• Area 1- normal operating regime lasts for t=[0 0.03] sec;
48 Sebastian Anghelescu
• Area 2- fault regime, the fault occurs , it lasts for t=[0.03 0.051] sec; • Area 3 - switch setting off regime when we have no current at all
t=[0.0510.0734] sec; • Area 4- normal operating regime [0.0734 0.2] sec
Fig.12. Current variation recording under fault conditions
In fig. 12, one can see how the protection system detects an increase in current greater than the value of the nominal operating current and eliminates the fault regime by activating the switches at both ends of the electric power line of the 110 kV network. The protection function was the maximum swift current protection, quickly removing the fault. One can find that after the fault has been removed, the switches reset automatically with the rapid auto-reset function (RAR). In this way, the electric power line remains in use in proper operating conditions.
3. Application Study by Using the the current and voltage injection display test
In usual practice, the verification of the protection system of an electric cell of an electric power plant is made with the aid of the current and voltage injection display test set.
For the proposed application it was chosen a line electric cell for the voltage of 110kV. The cell is safeguarded by the protection system and it consists of a digital terminal of Siemens 7SA612 type.
Current measurement transformers have the transformation ratio of 600/1/1/1 ; the voltage measurement transformer has the transformation ratio of 110000/100 V. The protection function desired to be tested is the maximum protection zero sequence directed function, having the following activated settings:
Remedy simulation of a mono-phase fault on a 110 kV aerial electric power line (…) 49
Table 6 Parameters of the swift maximum protection zero sequence directed function
Manner of operation Front Current start-up 1200 [A] Timing value 0.4 [sec]
Binary input for teleprotection activation
No
Activation after switch connection to fault
No
Inhibit pulse No The stage of the maximum zero sequence directed function is a swift
function having a high current value and low timing. The following parameters were set on the injection display test set for
testing the swift maximum protection zero sequence directed function as per table 7 for sequence 1, representing the normal operating regime and as per table 8 for sequence 2, representing the sequence for the fault regime.
Table 7 Parameters of the injection display test set for sequence 1
Voltage on phase A 57.8 [V] angle 0° Voltage on phase B 57.8 [V] angle 240° Voltage on phase C 57.8 [V] angle 120° Current on phase A 1 [A] angle 0° Current on phase B 1 [A] angle 240° Current on phase C 1 [A] angle 120°
Table 8
Parameters of the injection display test set for sequence 2 Voltage on phase A 40 [V] angle 0° Voltage on phase B 57.8 [V] angle 240° Voltage on phase C 57.8 [V] angle 120° Current on phase A 2.5 [A] angle 260° Current on phase B 1 [A] angle 240° Current on phase C 1 [A] angle 120°
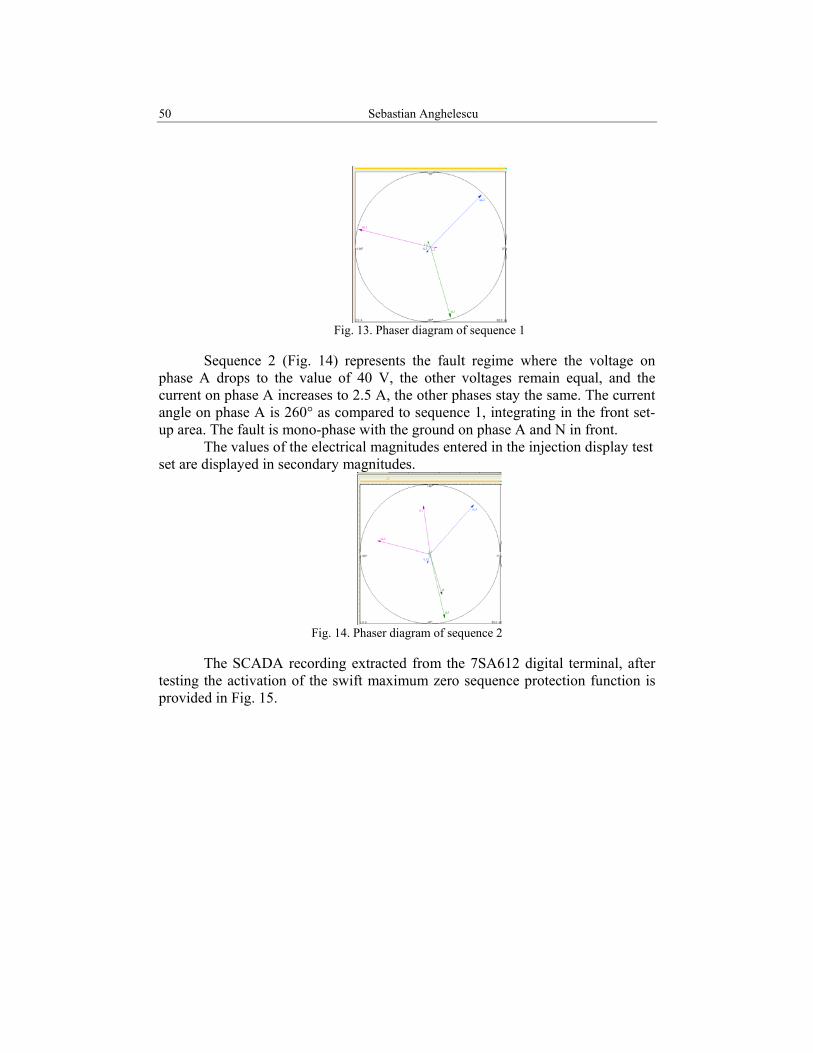
Sequence 1 (Fig. 13) represents the normal operating regime where the
voltages, currents on each phase and the phase currents are equal.
50 Sebastian Anghelescu
Fig. 13. Phaser diagram of sequence 1
Sequence 2 (Fig. 14) represents the fault regime where the voltage on
phase A drops to the value of 40 V, the other voltages remain equal, and the current on phase A increases to 2.5 A, the other phases stay the same. The current angle on phase A is 260° as compared to sequence 1, integrating in the front set-up area. The fault is mono-phase with the ground on phase A and N in front.
The values of the electrical magnitudes entered in the injection display test set are displayed in secondary magnitudes.
Fig. 14. Phaser diagram of sequence 2
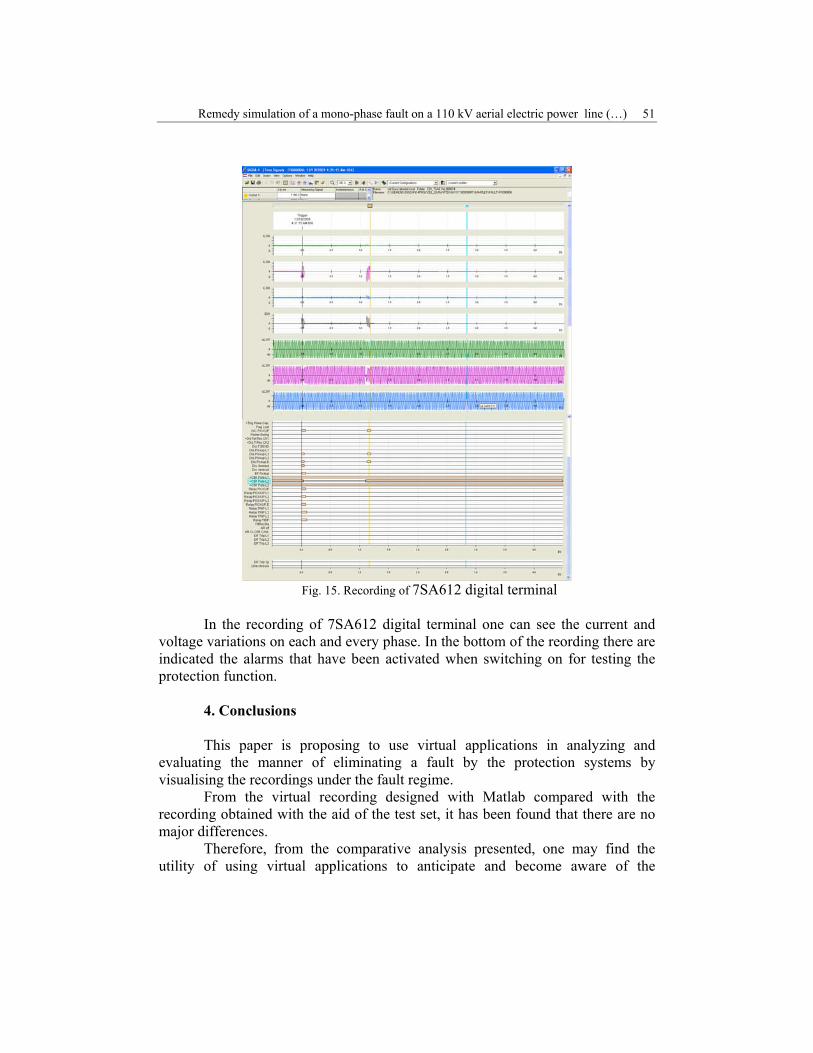
The SCADA recording extracted from the 7SA612 digital terminal, after
testing the activation of the swift maximum zero sequence protection function is provided in Fig. 15.
Remedy simulation of a mono-phase fault on a 110 kV aerial electric power line (…) 51
Fig. 15. Recording of 7SA612 digital terminal
In the recording of 7SA612 digital terminal one can see the current and
voltage variations on each and every phase. In the bottom of the reording there are indicated the alarms that have been activated when switching on for testing the protection function.
4. Conclusions
This paper is proposing to use virtual applications in analyzing and evaluating the manner of eliminating a fault by the protection systems by visualising the recordings under the fault regime.
From the virtual recording designed with Matlab compared with the recording obtained with the aid of the test set, it has been found that there are no major differences.
Therefore, from the comparative analysis presented, one may find the utility of using virtual applications to anticipate and become aware of the
52 Sebastian Anghelescu
evolution of variations in current and voltage and the feed-back manner of protection systems, in the case of the different operating regimes of the high voltage networks.
This type of application helps personnel simplify the analysis and interpretation of the incidents occuring in the electric networks.
The advantages of this simulation are represented by the possibility to analyze and evaluate the operating regime and efficiency of the protection systems before they are actually configured and tested in the power plant.
R E F E R E N C E S
[1] C. Soare. S.S. Iliescu, Ioana Fagarasan, V. Tudor, Oana Faida Niculescu, Proiectarea asistată de calculator în Matlab şi Simulink – Conducerea avansată a proceselor (in English “Computer Aided Design Using Matlab and Simulink – Advanced Process Management”); Agir Publishing House, Bucharest, 2006
[2] C. Soare. S.S. Iliescu, Ioana Fagarasan, V. Tudor, Oana Faida Niculescu, Proiectarea asistată de calculator în Matlab şi Simulink Modelarea şi simularea proceselor (in English “Computer Aided Design Using Matlab and Simulink. Process Modelling and Simulation”), Agir Publishing House, Bucharest, 2006
[3] C. Soare. S.S. Iliescu, Ioana Fagarasan, V. Tudor, Oana Faida Niculescu, Proiectarea asistată de calculator în Matlab şi Simulink – Exemple şi studii de caz” (in English “Computer Aided Design Using Matlab and Simulink – Illustrations and Case Studies”), Agir Publishing House, Bucharest, 2006
[4] M. Eremia, Electric Power Systems, Electric Networks, the Romanian Academy Publishing House, Bucharest, 2006
[5] M. Eremia, J. Trecat, A. Germond, Réseaux electriques. Aspects actuels, Ed. Tehnica, Bucuresti, 2000
[6] F. Milano, An Open Source Power System Analysis Toolbox, IEEETransactions on Power Systems, vol. 20, no. 3, pp.1199-1206, August 2005
[6] *** Normativul PE 132/2003 pentru proiectarea relelelor electrice [7] *** OMICRON Test Universe 2.11 Online Help