form ti... · 2017-11-20 · tehnologia inovativĂ – revista „construcţia de maşini” n. r....
TRANSCRIPT
REVISTA CONSTRUCŢIA DE MAŞINI - SERIE NOUĂ
Anul 64, Nr. 3-4 / 2012
Din sumar
MECANICĂ / MECHANICS
MODELARE & SIMULARE / MODELLING & SIMULATION
TEHNOLOGIE INOVATIVĂ / INNOVATIVE TECHNOLOGY ECONOMIE INDUSTRIALĂ /
INDUSTRIAL ECONOMY
• "Tehnologia Inovativa" printed form: ISSN 2248 - 0420; ISSN-L 2248 - 0420 • "Tehnologia Inovativa" online form: ISSN 2248 - 0420; ISSN-L 2248 - 0439 EDITOR: ICTCM – CITAf 041303 Bucuresti Şos. Olteniţei nr. 103, sector 4, O.P. 8 Tel: 021 332.37.70/234 Fax: 021 332.07.75 / 021 332.31.95 E-mail: [email protected]
Responsabil editor: Irina Rădulescu Responsabil difuzare: Ionuţ Dimache INFORMAŢII, ABONAMENTE: Revista este evaluată CNCSIS la categoria B+, apare trimestrial. Abonamentele se fac direct, prin dispoziţie de plată sau mandat poştal, trimis pe adresa revistei. CONT – ICTCM: nr. RO58 RNCB 0075 0352 1240 0001; BCR sector 4 TIPAR: ICTCM – CITAf COPYRIGHT 2003 Toate drepturile asupra acestei ediţii sunt rezervate ICTCM – CITAf. Nu este permisă reproducerea integrală sau parţială a articolelor din revista „Tehnologia Inovativă” fără consimţământul scris al editorului. Opiniile exprimate în revistă aparţin semnatarilor articolelor, fără să reflecte obligatoriu şi punctul de vedere al editorului.
TEHNOLOGIA INOVATIVĂ – Revista „Construcţia de maşini” nr. 3-4 / 2012
ANUL 64 / 2012 – NR. 3-4
TEHNOLOGIA INOVATIVĂ
REVISTA CONSTRUCŢIA DE MAŞINI
COLEGIUL DE REDACŢIE Octavian BOLOGA - Universitatea „Lucian Blaga” din Sibiu
Olivier BONNEAU – Universitatea din Poitiers, Franţa
Ion BOSTAN – Universitatea Tehnică a Moldovei
K.D. BOUZAKIS – Aristoteles University of Thessaloniki, Grecia
Doug BRANHAM - Lubrication Systems Company, Houston, Texas, USA
Dan BRÎNDAŞU - Universitatea „Lucian Blaga” din Sibiu
Mircea CIOBANU - Universitatea „Ştefan cel Mare” din Suceava
Valeriu DULGHERU – Universitatea Tehnică a Moldovei
Dan FILIPOIU - Universitatea POLITEHNICA din Bucureşti
Michel FILLON – Universitatea din Poitiers, Franţa
Mohamed HAJJAM – Universitatea din Poitiers, Franţa
Tudor ICLĂNZAN - Universitatea „Politehnica” din Timişoara
Nicolae Valentin IVAN - Universitatea „TRANSILVANIA” din Braşov
Gheorghe MOGAN – Universitatea „TRANSILVANIA” din Braşov
Ilie MUSCĂ - Universitatea „Ştefan cel Mare” din Suceava
Nicolae OANCEA - Universitatea „Dunărea de Jos” din Galaţi
Dumitru OLARU - Universitatea Tehnică „Gheorghe Asachi” din Iaşi
Juozas PADGURSKAS – Lithuanian University of Agriculture, Lithuania
Radu POPESCU – Academia Română - INCE – CEIS, Bucureşti
Tudor PRISĂCARU - Universitatea POLITEHNICA din Bucureşti
Vasile PUIU - Universitatea din Bacău
Stanisław PYTKO - University of Science and Technology, Kraków, Poland
Alexandru RĂDULESCU - Universitatea POLITEHNICA din Bucureşti
Minodora RÎPĂ - Universitatea „Dunărea de Jos” din Galaţi
Lucian TUDOSE - Universitatea din Cluj
Thami ZEGHLOUL – Universitatea din Poitiers, Franţa
TEHNOLOGIA INOVATIVĂ – Revista „Construcţia de maşini” nr. 3-4 / 2012
COMITET ONORIFIC
Gheorghe AMZA - Universitatea POLITEHNICA din Bucureşti
Niculae Napoleon ANTONESCU – Universitatea „Petrol şi Gaze” din Ploieşti
Traian AURITE - Universitatea POLITEHNICA din Bucureşti
Gavrilă CALEFARIU - Universitatea „TRANSILVANIA” din Braşov
Mircea COZMÎNCĂ - Universitatea Tehnică „Gheorghe Asachi” din Iaşi
Emanuel DIACONESCU – Universitatea „Ştefan cel Mare” din Suceava
Marian GHEORGHE - Universitatea POLITEHNICA din Bucureşti
Constantin ISPAS - Universitatea POLITEHNICA din Bucureşti
Valeriu JINESCU - Universitatea POLITEHNICA din Bucureşti
Aurel JULA - Universitatea „TRANSILVANIA” din Braşov
Constantin MINCIU - Universitatea POLITEHNICA din Bucureşti
Eugen PAY - Universitatea de Nord din Baia Mare
Iulian POPESCU - Universitatea din Craiova
Aurelian VLASE - Universitatea POLITEHNICA din Bucureşti
Ioan VOICA - Universitatea POLITEHNICA din Bucureşti
EDITOR Oficiul de Informare Documentară pentru Industrie, Cercetare, Management
din cadrul S.C. ICTCM S.A. BUCUREŞTI
RESPONSABIL EDITOR Irina Rădulescu
REDACTOR Irina Rădulescu
WEBMASTER Ramona Ioanid
TEHNOLOGIA INOVATIVĂ – Revista „Construcţia de maşini” nr. 3-4 / 2012
CUPRINS
MECANICĂ / MECHANICS
1. ANALYTICAL STUDY OF PRESSURE VARIATION AT DENTAL CONTACT INTERFACE pag. 5 Mihai Catalin Frunza1, Gheorghe Frunza2 1 University of Medicine and Pharmacy, Faculty of Dental Medicine, Bucharest, ROMANIA, 2 University of Suceava, Faculty of Mechanical Engineering, ROMANIA
2. DENTAL BIOCONTACTS MODELING pag. 9
Mihai Catalin Frunza1, Gheorghe Frunza2
1 University of Medicine and Pharmacy, Faculty of Dental Medicine, Bucharest, ROMANIA 2 University of Suceava, Faculty of Mechanical Engineering, Mechatronics and Management, ROMANIA
MODELARE & SIMULARE / MODELLING & SIMULATION
3. MODELLING AND TESTING OF AN ADHESIVE BONDED JOINT pag. 17
Cătălin Pîrvu, Mihail Boţan “Dunarea de Jos” University of Galati, Galati, ROMANIA
TEHNOLOGIE INOVATIVĂ / INNOVATIVE TECHNOLOGY
4. CERCETĂRI PRIVIND UN NOU TIP DE MOTOCOMPRESOR pag. 25 Teodor Mădăraşan1, Stelian Cosmin Cărnaru2, Adrian Marinescu3 1 Universitatea Tehnică, Cluj –Napoca, ROMANIA 2 Universitatea Tehnică, Cluj –Napoca, ROMANIA 3 Universitatea Politehnica, Bucureşti, ROMANIA
5. ELECTROHYDRAULIC SYSTEMS FOR CONTROLLING THE FLOW DIRECTION
OF WIND TURBINES pag. 31 Ioan Lepadatu, Liliana Dumitrescu Hydraulics and Pneumatics Research Institute INOE 2000-IHP, Bucharest, ROMANIA
6. MODERN TECHNOLOGIES OF MAINTENANCE, REPAIR AND TESTING
FOR HYDRAULIC EQUIPMENTS pag. 35 Cătălin Dumitrescu, Corneliu Cristescu Hydraulics and Pneumatics Research Institute INOE 2000-IHP, Bucharest, ROMANIA,
7. ENERGY EFFICIENCY OF THE HYDRAULIC PLATFORM OF THE ELEVATION –
DESCENT FOR PEOPLE BY PROMOTING ENERGY RECOVERY pag. 43 Catalin Dumitrescu, Corneliu Cristescu, Florin Georgescu, Liliana Dumitrescu INOE 2000-IHP Bucuresti, ROMÂNIA
8. THE MECHATRONIC DEVICES FOR HYDRAULIC SYSTEMS pag. 47
G.Matache1, C. Dumitrescu2, A. Drumea3
1Hydraulics and Pneumatics Research Institute, Bucharest ROMANIA, 2Hydraulics and Pneumatics Research Institute, Bucharest ROMANIA 3 Politehnica” University Bucharest, Bucharest, ROMANIA
9. MECHATRONIC CONTROL OF PRESSURE USING A PIEZOELECTRIC CONVERTOR pag. 51
G.Matache, I. Dutu
Hydraulics and Pneumatics Research Institute, Bucharest, ROMANIA
10. RESEARCHES REGARDING MOVEMENT SYNCHRONIZATION OF TWO HYDRAULIC CYLINDERS FOR LIFTING APPLICATIONS pag. 57
Radu Radoi, Gabriela Matache Hydraulics and Pneumatics Research Institute, Bucharest, ROMANIA

TEHNOLOGIA INOVATIVĂ – Revista „Construcţia de maşini” nr. 3-4 / 2012
ECONOMIE INDUSTRIALĂ / INDUSTRIAL ECONOMY
11. CERCETĂRI DE MARKETING PRIVIND SATISFACEREA CLIENŢILOR UNUI DEALER AUTO AUTORIZAT pag. 61 Ilie Filip, Rădulescu Alexandru , Petrescu Alina Maria Universitatea POLITEHNICA Bucureşti, Bucureşti , ROMANIA
12. MANAGEMENTUL RESURSELOR DE TIMP SI FINANCIARE pag. 71
Tulea Claudia Oana, Radulescu Alexandru Universitatea POLITEHNICA Bucureşti, Bucureşti , ROMANIA
TEHNOLOGIA INOVATIVĂ – Revista „Construcţia de maşini” nr. 3-4 / 2012
ABSTRACTS “INNOVATIVE TECHNOLOGY” 3-4 / 2012
ANALYTICAL STUDY OF PRESSURE VARIATION AT DENTAL CONTACT
INTERFACE
Mihai Catalin Frunza1, Gheorghe Frunza2
1 University of Medicine and Pharmacy, Faculty of Dental Medicine, Bucharest, ROMANIA,
2 University of Suceava, Faculty of Mechanical Engineering, Mechatronics and Management,
ROMANIA Any two bodies in contact determine at the interface a pressure, which will create inside the bodies a stress state. This pressure varies depending on contact normal load Q, geometrical configuration, dental material and interface body nature. Teeth come into contact when the mouth closes, so that they can be considered biomechanical bodies which are subjected to the physics laws. The purpose of this research was theoretical computation of pressure in the dental contacts, using a simplified model of the hertzian contact. The equations were solved using the Mathcad applications, for different materials, dimensions, loads etc. For a chewing force of 600 N between molar teeth, results a contact pressure of 4.68 GPa. We identified that pressure depends greatly on surface geometry, i.e. tooth cusp dimensions. When the cusp radii have values over 1mm, the pressure is minimal and the overall risks of biomechanical failure are lower.
DENTAL BIOCONTACTS MODELING
Mihai Catalin Frunza1, Gheorghe Frunza2
1 University of Medicine and Pharmacy, Faculty of Dental Medicine, Bucharest, ROMANIA,
2 University of Suceava, Faculty of Mechanical Engineering, Mechatronics and Management,
ROMANIA The tooth structure dilapidates itself due to bacterial pathogens (dental caries, periodontitis) and to mechanical factors. Food or gum chewing, tooth grinding or clenching are events in which upper and lower tooth come together. Dental contacts are loaded with forces of different intensity (based on muscle development, eating habits etc.) and through out the time deteriorate by wear and fracture. To prevent and diminish the harmful effects of abnormal dental loading, one must determine the stress state and strains which appear at different moments. For this purpose it is necessary to develop models of the dental biocontacts. In practical terms this is very difficult to achieve, therefore the most frequent used
are numerical models, which take advantage of the principles and equations from the different fields of mechanics. Thus one can use the hertzian contact concept, finite element method, combined with various aspects of tribology. None the less, new theories, principles and equations must be developed to reunite all the models so to be as close as possible to the real tooth anatomy and oral dynamic conditions.
MODELLING AND TESTING OF AN ADHESIVE BONDED JOINT
Cătălin Pîrvu, Mihail Boţan
“Dunarea de Jos” University of Galati, Galati,
ROMANIA
This paper presents a simulation of a single lap bonded joint and experimental results on the same geometry of adhesive joint, after being tested in traction. The model of the adhesive joint was run taking into account an elastic behavior of all involved materials and the obtained results were in agreement with the results obtained from traction tests. There were identified the failure mechanisms of the single lap bonded joints tested in traction. The simulation of the bonded joint gives good results in agreement with the results obtained from the traction tests. Assemblies obtained by adhesive joint of fragile materials are characterized by larger spread ranges of the mechanical properties. Except Young modulus that exhibits a narrow range for traction tests, the other properties are spread ±30% around the average values. For this assembly, the mechanical characteristics are lower as compared to each of the involved materials, but complex shapes may be obtained.
CERCETĂRI PRIVIND UN NOU TIP
DE MOTOCOMPRESOR
Teodor Mădăraşan1, Stelian Cosmin Cărnaru2, Adrian Marinescu3
1 Universitatea Tehnică, Cluj –Napoca, ROMANIA 2 Universitatea Tehnică, Cluj –Napoca, ROMANIA 3 Universitatea Politehnica, Bucureşti, ROMANIA
The aim of this paper is to present a new type of motor air-compressor, namely the direct drive motor air-compressor; this is an original, patent-based solution.
TEHNOLOGIA INOVATIVĂ – Revista „Construcţia de maşini” nr. 3-4 / 2012
The constructive solution and the functioning principle of the motor air-compressor are presented. Both power of the spark-ignition engine and the power needed for driving the compressor are calculated. An energy analysis regarding the functioning of the motor air-compressor is elaborated and the experimental plant is presented; the advantages of the new type of motor air-compressor with respect to construction and to functioning are marked out.
ELECTROHYDRAULIC SYSTEMS FOR CONTROLLING THE FLOW DIRECTION
OF WIND TURBINES
Ioan Lepadatu, Liliana Dumitrescu
Hydraulics and Pneumatics Research Institute INOE 2000-IHP, Bucharest, ROMANIA
In wind turbines with horizontal spindle which operate according to the principle of ”wind-determined direction” there is a must that, according to the wind speed, the turbine should change position under various angles considering the wind direction. For a ”wind-determined position” of the wind turbine, the authors of this paper have chosen hydraulic drive due to its advantages: high power density, accurate control over position etc. The paper presents in brief three conceptual models of electro-hydraulic systems to control and actuate wind-determined direction of wind turbines:
- open loop electro-hydraulic system with proportional components;
- closed loop electro-hydraulic system with proportional components;
- open loop electro-hydraulic system with conventional components.
MODERN TECHNOLOGIES
OF MAINTENANCE, REPAIR AND TESTING FOR HYDRAULIC EQUIPMENTS
Cătălin Dumitrescu, Corneliu Cristescu
Hydraulics and Pneumatics Research Institute INOE
2000-IHP, Bucharest, ROMANIA,
The paper presents certain considerations regarding the activity of maintenance of the fluid power equipments and systems, including the equipment required for performing tests forchecking and retesting the performance levels of the fluid power equipments, after they have been subjected to improvements or repairs. It is also presented a case study, where, after an important technical intervention at a hydrostatic pump, it was required to be performed tests on the stand, both for checking and attesting performances
after repair and for its adjustment, followed by the presentation of the scientific results achieved. ENERGY EFFICIENCY OF THE HYDRAULIC PLATFORM OF THE ELEVATION - DESCENT
FOR PEOPLE BY PROMOTING ENERGY RECOVERY
Catalin Dumitrescu, Corneliu Cristescu, Florin Georgescu, Liliana Dumitrescu
INOE 2000-IHP Bucuresti, ROMÂNIA
The article presents a technical solution for recovery of potential energy, with industrial application for electro-driven lifting platforms which are used for lifting persons with disabilities. We know that a load (weight) elevated to a certain height, involves the use of a form of energy, which in most cases is not recovered, not even partially, but it is dissipated into the environment. The basic idea of the solution presented is the recovery of potential energy from the descent load (weight), its conversion and storage, followed by its use in lifting phase of load.
THE MECHATRONIC DEVICES FOR HYDRAULIC SYSTEMS
G.Matache1, C. Dumitrescu1, A. Drumea2
1Hydraulics and Pneumatics Research Institute,
Bucharest, ROMANIA 2 Politehnica” University Bucharest, Bucharest,
ROMANIA Hydraulic axis is a typical mechatronic system that combines fine mechanics, fluid power, electronics and computing. Modern devices embed all their control electronics components into mechanical body for increased reliability, cable reduction or elimination and global miniaturization. Together with specialists from Technical University Bucharest, our team from Research Institute for Hydraulics and Pneumatics started design of an integrated electronic module for hydraulic axis control based on 16-bit system on chip device. Extensive testing is performed in laboratory and on test bench to adapt control algorithm to mechanical subsystem specific aspects.
MECHATRONIC CONTROL OF PRESSURE USING A PIEZOELECTRIC CONVERTOR
G.Matache, I. Dutu
Hydraulics and Pneumatics Research Institute,
Bucharest, ROMANIA The paper presents the results of the mathematic model of the pilot stage of a piezoelectric pressure regulator, validated experimentally in the Laboratory of the Hydraulics and Pneumatics Institute from
TEHNOLOGIA INOVATIVĂ – Revista „Construcţia de maşini” nr. 3-4 / 2012
Bucharest. The paper also presents original selection software for a piezoelectric actuator that is the basic component of the pressure regulator.
RESEARCHES REGARDING MOVEMENT SYNCHRONIZATION OF TWO HYDRAULIC CYLINDERS FOR LIFTING APPLICATIONS
Radu Radoi, Gabriela Matache
Hydraulics and Pneumatics Research Institute,
Bucharest, ROMANIA
Machinery used in various fields such as construction, industry, agriculture and logging are the different mechanisms that must be operated simultaneously by two hydraulic cylinders which operate synchronously. The article presents some methods to synchronize hydraulic cylinders by using flow dividers and control elements, as well as the scheme with electro hydraulic proportional directional valves and hydraulic cylinders for lifting LVDT provided with the platform. Schemes can be applied for driving rigs a crane arm, a cross pressures and different mechanisms for the woodworking industry.
CERCETĂRI DE MARKETING PRIVIND SATISFACEREA CLIENŢILOR UNUI DEALER
AUTO AUTORIZAT
Ilie Filip, Rădulescu Alexandru , Petrescu Alina Maria
Universitatea POLITEHNICA
Bucureşti, Bucureşti , ROMANIA
Marketing research is a powerful management tool that can be used for risk management and decision making, to increase the turnover of a company. Defining and setting goals is the first step in making a successful marketing research. For carmaker, the main objective is to achieve maximum customer satisfaction considering the car bought. Regarding the authorized car dealer, the main objective is to become market leader in his exclusively holding, relying on customer focus, innovation and quality. The purpose of this paper is to study the customer satisfaction of a company car, setting guest satisfaction through authorized car dealer and how to place a marketing research in the field.
MANAGEMENTUL RESURSELOR DE TIMP SI FINANCIARE
Tulea Claudia Oana, Alexandru Radulescu
Universitatea POLITEHNICA Bucureşti, Bucureşti ,
ROMANIA This paper presents the time and financial resources management to achieve a grain grinder. There were presented for this achievement three possible variants of making the project and it was chosen the best in terms of cost of the project.
TEHNOLOGIA INOVATIVA – Revista „Construcţia de maşini” nr. 3-4 / 2012
5
ANALYTICAL STUDY OF PRESSURE VARIATION AT DENTAL CONTACT INTERFACE
Mihai Catalin Frunza1, Gheorghe Frunza2
1 University of Medicine and Pharmacy, Faculty of Dental Medicine, Bucharest, ROMANIA, 2 University of Suceava, Faculty of Mechanical Engineering, Mechatronics and Management, ROMANIA
E-mail: [email protected]
ABSTRACT: Any two bodies in contact determine at the interface a pressure, which will create inside the bodies a stress state. This pressure varies depending on contact normal load Q, geometrical configuration, dental material and interface body nature. Teeth come into contact when the mouth closes, so that they can be considered biomechanical bodies which are subjected to the physics laws. The purpose of this research was theoretical computation of pressure in the dental contacts, using a simplified model of the hertzian contact. The equations were solved using the Mathcad applications, for different materials, dimensions, loads etc. For a chewing force of 600 N between molar teeth, results a contact pressure of 4.68 GPa. We identified that pressure depends greatly on surface geometry, i.e. tooth cusp dimensions. When the cusp radii have values over 1mm, the pressure is minimal and the overall risks of biomechanical failure are lower. KEY WORDS: dental contact, contact pressure, hertzian contact, dental contact area
1. INTRODUCTION
The mastication process takes place by the movement of the two maxillary bones through mouth closing and by contact between the opposite teeth. After these contacts are established, a pressure occurs at the interface which depends on several aspects: shape and area of the contact surface, contact force, material properties, tooth mobility etc. High values of the pressure correlate with a higher risk of biomechanical failure by cracks, fractures, wear and other (Neale et al, 2001). By determining the pressure of contact, one can model the surface of different restorations as required and can provide information on tooth contact durability. On the other hand, as stated by Ludema et al, 1996, any study which deals with the resistance to wear of a material must take into account the pressure level.
Studies concerning the area of contact and pressure distribution were done especially in orthopaedics (Fukubayashi et al, 1980; Genda et al, 2001; Tuoheti et al, 2005). Currently, in the literature, there are few data concerning the values of the interface dental contact pressure. The most common measurements deal with forces that appear between teeth. But these show only the jaw muscle contraction ability and are not related in any way with the anatomy (geometry) of dental arches.
Dejak and al. (2004) determine the stresses and implicitly the pressure in molars through finite element analysis. Xie and al (2009) presumes the pressure value, using the data from literature (force and contact area). Though, until now, by the author knowledge, there hasn’t been done any study to deal expressly with the dental contact pressure.
The premise of this study was that contact pressure at the tooth interface varies depending on the occlusal surface anatomy and especially on its degree of curvature.
2. MATERIAL AND METHOD
In this paper there were used mainly principles and equation from contact mechanics. From a biomechanical point of view, one can consider all contacts between teeth as hertzian contacts, as suggested by Fischer-Cripps et al, 2007. In the case of elastic hertzian contact, the following assumptions are done: (1) the curvature radius of tooth crown / cusp is bigger than the radius of the contact area, (2) the tooth dimensions are larger compared with the contact area, (3) the contact is frictionless, (4) the surfaces are continuous and non-conform.
TEHNOLOGIA INOVATIVA – Revista „Construcţia de maşini” nr. 3-4 / 2012
6
Due to their anatomy, the frontal teeth establish linear contacts and the posterior ones – punctual contacts. However, the actual contact surface topography may differ from the ideal anatomical shape specified in various textbooks (Okeson et al. 1985, Ash et al., 1993, Scheid et al, 2007). Thereby, when the incisal edge of the lower frontal teeth comes into contact with the marginal ridges of the superior ones it will form punctual contacts. As well, a lateral tooth cusp with well contoured ridges may have linear contacts in some portions with the opposite fossa. As a consequence, dental contact modelling may include other various types (i.e. surface contact, multipunctual contact and other). The surface or conform contacts are seen in bodies who’s surfaces join perfectly together, but this case is very rarely seen in dentistry, as teeth need escape passages for food fragments during mastication.
The dental contact is charged with a normal load Q which presses the teeth in the direction of their longitudinal ax. In the case of nonconform surfaces in contact, there will be at first a contact point between teeth and, as the jaws come closer, the contact will be made on a surface, following the subsequent microdisplacements. Teeth deform (only very little and reversible) resulting a contact area and approach one another with the value δ, called distance of mutual approach.
In this paper, we modeled the contact between two opposing cusps as two elastic half-spaces. The radius of curvature of the cusps varied and the pressure was determined for each instance using Hertz’s equations for punctual contact. The maximal pressure p0 and the distance of mutual approach (load-point displacement) δ are defined by:
2
p 30
n 3 Kp Q2
= π η
( )23
n 9 K Q2 4δ
δ = η
where2 21 2
1 2
1 1E E−ν − ν
η = + , ijij
1K k= =ρ∑ .
Abbreviations: Q- Normal load in contact; F- Bite force; ή- Elastic constant of bodies in contact; ν1, ν2 – Poisson’s coefficient for bodies 1 and 2; E1, E2 - Young’s module for bodies 1 and 2; ρij – principal curvature radii of the bodies in contact; np, nδ – coefficients which depend on the body configuration (radii of curvature in two planes) and on the material nature; β = b/a; where a and b are the big, respectively the small semiaxe of the contact ellipse.
The equations from above were solved for different particular situation with a Mathcad designed program, whose tolerance was 10-13. We considered
enamel and ceramic as materials in contact, Table 1, with the known constants: Young’s modulus 75 GPa for enamel and 70 GPa for ceramic and Poisson’s coefficient, 0.33 and respectively 0.19 (Dejak et al, 2003; Romeed et al, 2004; Craig et al, 2001; Mahoney et al, 2000).
The program determines the numerical values of the ellipse semi axes a and b, β ratio, distance of teeth mutual approach δ and maximal hertzian pressure p0.
Every cusp can be considered a halfspace, with radii of certain value in two of the direction (sagital and transversal) and in the third one being infinite. The cusps radii were determined in a previous paper (Frunza et al., 2012), resulting maximal values of 2.5 mm and a difference between the two directions of 0.4 mm.
As a consequence, in this paper to one of the cusps was imposed constant radii R11=2.1 mm and R12=2.5 mm and the other had variable radii R21=0.3 mm, R22=0.7 mm, which were raised simultaneously with 0.2 mm until they reached the values of the first cusp, i.e. R21=2.1 mm and R22=2.5 mm. So, for each pair of materials in contact we had 10 cases of different radii.
After a literature research we have identified a maximal occlusal force at the level of molar teeth of 600 N (Judge et al 2003; Pigno et al 2001). We assumed that this load is distributed equal on four cusps, resulting a force of 125 N for one cusp. This limited assumption considers also that one cusp has only one occlusal contact with the opposite cusp. 3. RESULTS
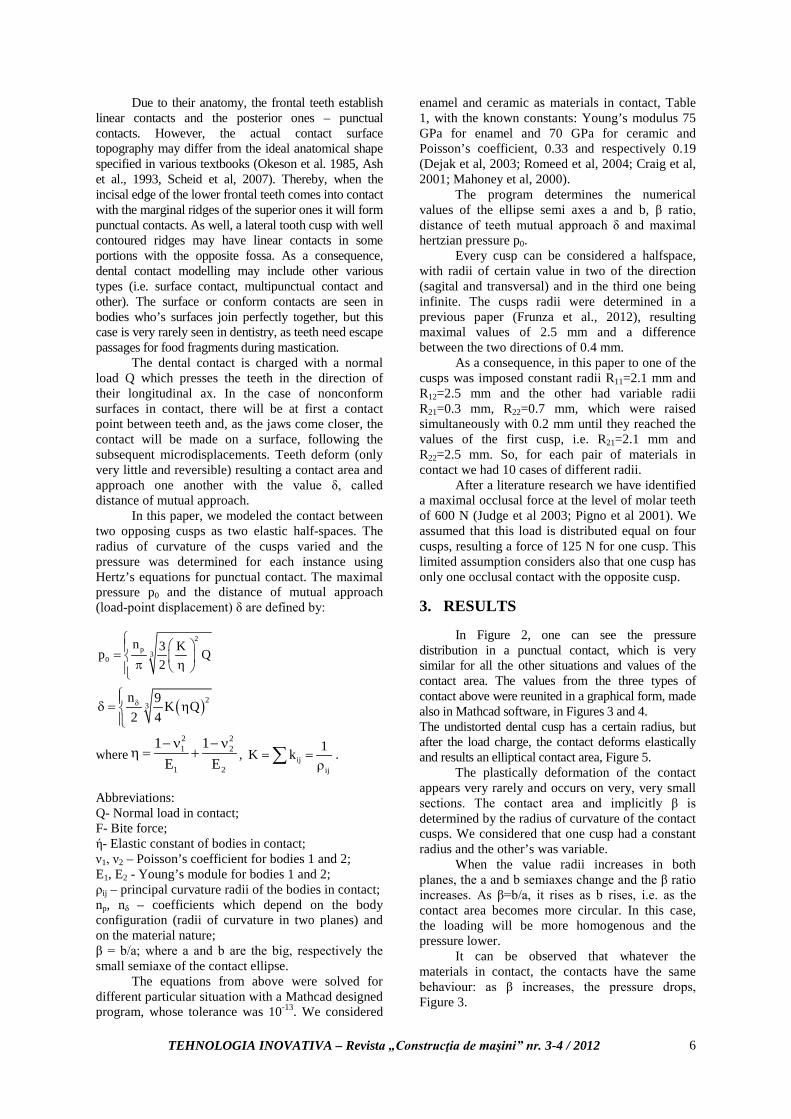
In Figure 2, one can see the pressure distribution in a punctual contact, which is very similar for all the other situations and values of the contact area. The values from the three types of contact above were reunited in a graphical form, made also in Mathcad software, in Figures 3 and 4. The undistorted dental cusp has a certain radius, but after the load charge, the contact deforms elastically and results an elliptical contact area, Figure 5.
The plastically deformation of the contact appears very rarely and occurs on very, very small sections. The contact area and implicitly β is determined by the radius of curvature of the contact cusps. We considered that one cusp had a constant radius and the other’s was variable.
When the value radii increases in both planes, the a and b semiaxes change and the β ratio increases. As β=b/a, it rises as b rises, i.e. as the contact area becomes more circular. In this case, the loading will be more homogenous and the pressure lower.
It can be observed that whatever the materials in contact, the contacts have the same behaviour: as β increases, the pressure drops, Figure 3.
TEHNOLOGIA INOVATIVA – Revista „Construcţia de maşini” nr. 3-4 / 2012
7
Concretely, the increase of β from 0.6 to 0.8 determines a pressure drop at the contact interface of approximately 35%, for a mastication load of 600 N. Thus, when a contact is defined through cusps with curvature radii chosen so as β is equal or greater than 0.8, then the interface pressure will decrease with a third and all the biomechanical failure risks (by fatigue, wear, crack) will decrease considerably. Besides the cases here presented, also through the Mathcad program, we have done computation for some other radii values. It was found that beta β has values over 0.8 when:
- R11 ≥ 0.8 mm, R12 ≥ 1.2 and R12 ≥ 1.6, R22 ≥ 1.9 - R11 ≥ 0.9 mm, R12 ≥ 1.3 and R12 ≥ 1.3, R22 ≥ 1.7 - R11 ≥ 1.0 mm, R12 ≥ 1.4 and R12 ≥ 1.2, R22 ≥ 1.6 - R11 ≥ 1.1 mm, R12 ≥ 1.5 and R12 ≥ 1.1, R22 ≥ 1.5
If one considers spherical cusps with radii
quasi equal in the two dimensions, the contact satisfies the criteria above, if:
R11 ~ R12 ~ R12 ~ R22> 0,6mm.
Enamel and ceramic had a similar behaviour,
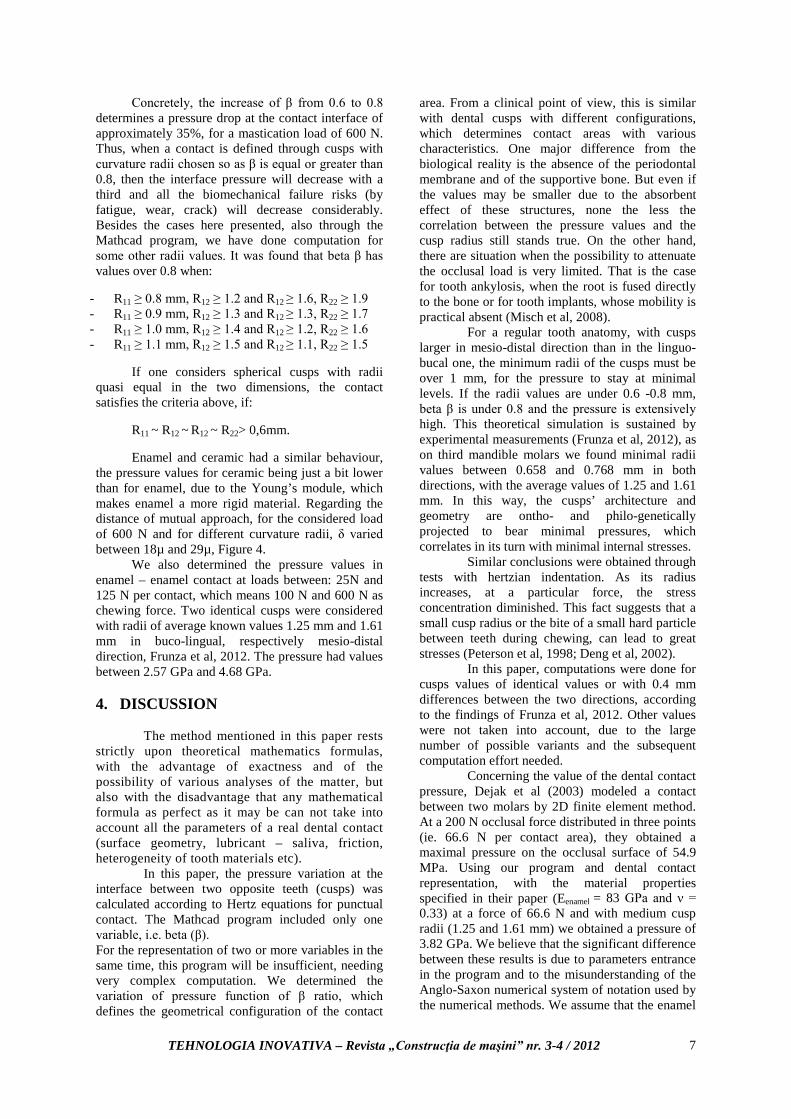
the pressure values for ceramic being just a bit lower than for enamel, due to the Young’s module, which makes enamel a more rigid material. Regarding the distance of mutual approach, for the considered load of 600 N and for different curvature radii, δ varied between 18µ and 29µ, Figure 4.
We also determined the pressure values in enamel – enamel contact at loads between: 25N and 125 N per contact, which means 100 N and 600 N as chewing force. Two identical cusps were considered with radii of average known values 1.25 mm and 1.61 mm in buco-lingual, respectively mesio-distal direction, Frunza et al, 2012. The pressure had values between 2.57 GPa and 4.68 GPa. 4. DISCUSSION
The method mentioned in this paper rests strictly upon theoretical mathematics formulas, with the advantage of exactness and of the possibility of various analyses of the matter, but also with the disadvantage that any mathematical formula as perfect as it may be can not take into account all the parameters of a real dental contact (surface geometry, lubricant – saliva, friction, heterogeneity of tooth materials etc). In this paper, the pressure variation at the interface between two opposite teeth (cusps) was calculated according to Hertz equations for punctual contact. The Mathcad program included only one variable, i.e. beta (β). For the representation of two or more variables in the same time, this program will be insufficient, needing very complex computation. We determined the variation of pressure function of β ratio, which defines the geometrical configuration of the contact
area. From a clinical point of view, this is similar with dental cusps with different configurations, which determines contact areas with various characteristics. One major difference from the biological reality is the absence of the periodontal membrane and of the supportive bone. But even if the values may be smaller due to the absorbent effect of these structures, none the less the correlation between the pressure values and the cusp radius still stands true. On the other hand, there are situation when the possibility to attenuate the occlusal load is very limited. That is the case for tooth ankylosis, when the root is fused directly to the bone or for tooth implants, whose mobility is practical absent (Misch et al, 2008).
For a regular tooth anatomy, with cusps larger in mesio-distal direction than in the linguo-bucal one, the minimum radii of the cusps must be over 1 mm, for the pressure to stay at minimal levels. If the radii values are under 0.6 -0.8 mm, beta β is under 0.8 and the pressure is extensively high. This theoretical simulation is sustained by experimental measurements (Frunza et al, 2012), as on third mandible molars we found minimal radii values between 0.658 and 0.768 mm in both directions, with the average values of 1.25 and 1.61 mm. In this way, the cusps’ architecture and geometry are ontho- and philo-genetically projected to bear minimal pressures, which correlates in its turn with minimal internal stresses.
Similar conclusions were obtained through tests with hertzian indentation. As its radius increases, at a particular force, the stress concentration diminished. This fact suggests that a small cusp radius or the bite of a small hard particle between teeth during chewing, can lead to great stresses (Peterson et al, 1998; Deng et al, 2002).
In this paper, computations were done for cusps values of identical values or with 0.4 mm differences between the two directions, according to the findings of Frunza et al, 2012. Other values were not taken into account, due to the large number of possible variants and the subsequent computation effort needed.
Concerning the value of the dental contact pressure, Dejak et al (2003) modeled a contact between two molars by 2D finite element method. At a 200 N occlusal force distributed in three points (ie. 66.6 N per contact area), they obtained a maximal pressure on the occlusal surface of 54.9 MPa. Using our program and dental contact representation, with the material properties specified in their paper (Eenamel = 83 GPa and ν = 0.33) at a force of 66.6 N and with medium cusp radii (1.25 and 1.61 mm) we obtained a pressure of 3.82 GPa. We believe that the significant difference between these results is due to parameters entrance in the program and to the misunderstanding of the Anglo-Saxon numerical system of notation used by the numerical methods. We assume that the enamel
TEHNOLOGIA INOVATIVA – Revista „Construcţia de maşini” nr. 3-4 / 2012
8
Young’s modulus written as is in the paper „83.000” actually means “83”, error found in the final results. We must admit that we have done also a similar mistake in a preliminary stage of the current paper. So, the real pressure obtained by the paper would be in fact 5.49 GPa. As a consequence taking into account the different methods used one can consider that the pressure values are quite similar.
In an other article Xie et al (2009) determined a value pressure on enamel of 2.5 GPa, similar with the values of the present study.
Ceramic revealed a very similar behavior to enamel and a consequence it seems for the present the most fitted material for dental restorations, as previously suggested by Robinson et al, 2004.
Both ceramic and enamel suffered a deformation between 18µ and 29µ. This situation can be of concern when the tooth or implant has minimal or no mobility at all. These deformations can be part of a fatigue wear process, which leads to the destruction of the crown. But on normal bases, teeth move apically 8 to 28 µ (Misch et al., 2008), so the deformation can be sustained by the periodontal viscoelastic properties. The advantage of this theoretical perspective is represented by the possibility to determine the interface pressure on different contact configurations and tooth anatomies (natural or artificial). Function of the used materials, one can make an optimization of the form of the contact surfaces, considering the pressure and the chewing forces. Nowadays, this assertion is materialized by modeling the dental prosthesis with minimal high cusps (ie. high radii values) for minimizing the risk of tangential loading. Within the actual cad-cam systems, the form optimization could be done more precisely through scanning of the occlusal surface of the modelled and of the opposite cusps. For a particular opposite cusp radius (geometry), one can determine quite easy the optimal radius so as to minimize the biomechanical risks. One other important problem in dentistry is to choose the most proper material for various restorations. One imperative condition is for the material to have a resistance to wear similar to natural dental structure. Until now this challenge was not fulfilled. In the scientific research one of first steps in analyzing and selecting such a material is exactly the determination of the pressure and stresses from contact, Ludema, 1996. The reason is that when stresses are high enough, frequently on a small dental surface with great loads, microcracks, delamination and wear can appear. 5. CONCLUSIONS
- the theoretical study of hertzian contacts offers an exactly approach of the relation between surface geometry and the interface pressure;
- the pressure of the contact interface for a enamel-enamel contact, for an oclusal loading of 100 – 600 N varies between 2.57 GPa and 4.68 GPa.
- when the cusp radii in sagital and transversal direction has values over 1 mm, the interface pressure is very diminished and the risks of the biomechanical failure is lower.
REFERENCES 1. Ash M., Wheeler’s dental anatomy and physiology,
Saunders, seventh edition, 1993 2. Craig R, Powers JM., Restaurative dental materials,
Mosby, 2001 3. Dejak B, Młotkowski A, Romanowicz M, Finite element
analysis of stresses in molars during clenching and Mastication, J Prosthet Dent 2003; 90:591-7
4. Deng Y., Lawn B.R., Lloyd I.K., Characterization of damages modes in dental ceramic bilayer structures, J Biomed Mater Res (Appl Biomater) 2002, 63:137-145
5. Fischer-Cripps AC., Introduction to contact mechanics in Elastic contact, pg 101, second edition, Springer 2007, USA
6. Frunza MC., Suciu C., Cusp radius measurement through digital image analysis, Acta Odont Scand, in print, 2012
7. Fukubayashi T. and Kurossawa H., The contact area and pressure distribution pattern of the knee, Acta Orthop. Scand., 51:871-879, 1980
8. Genda E., Iwasaki N., MacWilliams BA., Barrance PJ., Chao EYS., Normal hip joint contact pressure distribution in single-leg standing – effect of gender and anatomic parameters, J Biomech, 34(7):895-905;2001
9. Judge RB, Palamara JEA, Taylor RG, Davies HMS, Clement JG, Description of a photoelastic coating technique to describe surface strain of a dog skull loaded in vitro, J Prosthet Dent 2003; 90:92-6
10. Ludema KC., Friction, Wear, Lubrication, a textbook in tribology, CRC Press, 1996
11. Mahoney E., Holt A.., Swain M., Kilpatrick N., The hardness and modulus of elasticity of primary molar teeth: an ultra-micro-indentation study, J Dent 28(8):589-94, 2000
12. Misch C. et al, Contemporary implant dentistry, Mosby, 2008
13. Neale MJ., The tribology handbook, second edition, Butterworth-Heinemann, Oxford, 2001, in Summers-Smith JD., Neale MJ., section Failure patterns and failure analysis D1
14. Okeson J., Fundamentals of occlusion and temporomandibular disorders, C.V. Mosby, 1985
15. Peterson, Pajares, Lawn, Thompson, Rekow, Mechanical characterization of dental ceramics by Hertzian contacts, Journal of Dental Research 1998; 77(4):589
16. Pigno MA, Hatch JP, Rodrigues-Garcia RCM, Sakai S, Rugh JD, Severity, Distribution, and Correlates of Occlusal Tooth Wear in a Sample of Mexican-American and European-American Adults, Int J Prosthodont 2001;14:65–70
17. Robinson C., Connell S., Kirkham J., Shore R., Smith A., Dental enamel – a biological ceramic: regular substructures in enamel hydroxyapatite crystals revealed by atomic force microscopy, J. Mater. Chem, 14: 2242-2248, 2004
18. Romeed S.A., Fok S.L., Wilson N.H.F., Biomechanics of cantilever fixed partial dentures in shortened dental arch terapy, J Prosthodont 2004; 13:90-100
19. Scheid R., Woelfel’s dental anatomy, Lippincott, 2007 20. Tuoheti Y., Itoi E., Yamamoto N., Seki N., Abe H.,
Minagawa H., Okada K., Shimada Y., Contact area, contact pressure and pressure patterns of the tendon-bone interface after rotator cuff repair, Am J Sports Med, 33(12):1869-1874, 2005
21. Xie Z.H., Swain M.V., Swadener G., Munroe P., Hoffman M., Effect of microstructure upon elastic behaviour of human tooth enamel, J Biomech 2009; (42):1075-1080.
TEHNOLOGIA INOVATIVA – Revista „Construcţia de maşini” nr. 3-4 / 2012
9
DENTAL BIOCONTACTS MODELING
Mihai Catalin Frunza1, Gheorghe Frunza2
1 University of Medicine and Pharmacy, Faculty of Dental Medicine, Bucharest, ROMANIA, 2 University of Suceava, Faculty of Mechanical Engineering, Mechatronics and Management, ROMANIA
E-mail: [email protected]
ABSTRACT: The tooth structure dilapidates itself due to bacterial pathogens (dental caries, periodontitis) and to mechanical factors. Food or gum chewing, tooth grinding or clenching are events in which upper and lower tooth come together. Dental contacts are loaded with forces of different intensity (based on muscle development, eating habits etc.) and through out the time deteriorate by wear and fracture. To prevent and diminish the harmful effects of abnormal dental loading, one must determine the stress state and strains which appear at different moments. For this purpose it is necessary to develop models of the dental biocontacts. In practical terms this is very difficult to achieve, therefore the most frequent used are numerical models, which take advantage of the principles and equations from the different fields of mechanics. Thus one can use the hertzian contact concept, finite element method, combined with various aspects of tribology. None the less, new theories, principles and equations must be developed to reunite all the models so to be as close as possible to the real tooth anatomy and oral dynamic conditions. KEY WORDS: biomechanics, bioinformatics, dental models
1. INTRODUCTION
As part of the masticatory system, teeth engage one another during normal functions (chewing and swallowing) but also abnormally in teeth grinding (bruxism). As Raadsheer et al. [1] showed, these contacts are loaded in cycles, often with increased forces that present vertical and horizontal components. Variety is the main feature of dental contacts as there are no two identical contacts. They are influenced by many factors such as population (race), geographical area, age, gender and type of food [2]. Variable components are: tooth type (deciduous / permanent, incisor / canine / premolar / molar), shape and size, degree of toothwear, position in the alveolar process, force and type of chewing, parafunctions.
Despite the fact that enamel is the hardest tissue in the body, it wears off during life and sometimes suffers major destructions (fissures, fractures, accelerated wear). Various types of dental restorations (fillings, prostheses) modify the occuring contacts. The materials used have different physical, mechanical and chemical properties than enamel. Moreover, in order to minimise the risk of biomechanical failure of dental restorations, sometimes the shape differs from the original, like Torbjorner shows in [3]. This fact can influence the efficiency of chewing.
Studies of dental contacts are useful to
determine the stress within the structure [4], to assess the clinical situations with increased biomechanic risk [5] and also to determine the primary parameters requested for a sustainable restoration [6].
The research of dental contacts in vivo is difficult because of the various clinical situations, as Hidaka et al stated in [7]. They require an increased working time, their repeatability is questionable and the results don't have a large enough degree of generality. In addition, due to the mentioned variability, there will be cases that will never be studied, because of the low prevalence in the population or due to the difficulty of analysis. Some types of malocclusion constitute very difficult cases for the clinical study of teeth contacts. For example the analysis of the jaw movements in a patient with bruxism is virtually impossible.
In general. The dental contacts effects were studied through finite numerical methods [8], experimental setups by indentation [9] or through photoelasticity [10].
TEHNOLOGIA INOVATIVA – Revista „Construcţia de maşini” nr. 3-4 / 2012
10
2. MATERIAL AND METHOD
The mechanical forces and their distribution within the masticatory system can not be measured directly in a non-destructive way. In order to study the biomechanics of the stomatognathic system it is necessary to create a representation of the system or a model [11]. According to the Merriam - Webster dictionary, a model is a description or analogy used to help visualizing something that cannot be directly observed. Through modeling we don't need to obtain exactly the same characteristics but we try to simulate the object behavior. The model represents the object but without copying it precisely.
There can be biological, chemical, mechanical or thermal behavior modeling. This paper presents possible variants of biomechanical modeling of the teeth and their contacts, which can be used in future research. 3. RESULTS AND DISCUSSION
We propose five types of biomechanical models: hertzian and non-hertzian, numerical, topographic, „morpho-functional” Catia and tribologic.
1.1. Hertzian şi non-hertzian models
Dental contacts can be described as: hertzian contacts - initially they are linear or punctual - non-hertzian, multicontact or surface contacts. Other authors have similar approaches [12-15]. Okeson notes that modeling of cusp tip - marginal ridge contact, due to the slightly convex shape of the latter, can be made by a cusp tip in contact with a flat surface [16].
The hertzian model is based on theories derived from contact mechanics, assimilating teeth with elastic bodies with known characteristics. The elements in contact, including cusps, marginal ridges and pits etc. are treated as elastic half-spaces, considering that dimensions of the contact area are much smaller than their radii of curvature [17].
Another prerequisite is that the surfaces surrounding the contact area have very small slopes. In other words, there should not be obvious variations of surface contour like depressions, irregularities, ditches etc. Most often, however, the surfaces of teeth have an irregular geometry but in the hertzian modeling this characteristic is deliberately neglected. In addition, the deformation after contact should be small, and that is consistent with the clinical situation.
Contact stresses are very high in the vicinity of contact area and decreases rapidly away from it; so, the area of interest in the biomechanical analysis is the dental contact area. Stresses in this area do not depend very much on the actual shape of the teeth nor on the periodontal support, unless it presents with an excessive mobility.
With these premises established, we can apply the known equations and calculations of contact mechanics to determine: - pressure at the contact interface; - stresses in zones surrounding the contact areas; - strains that occur within materials in contact
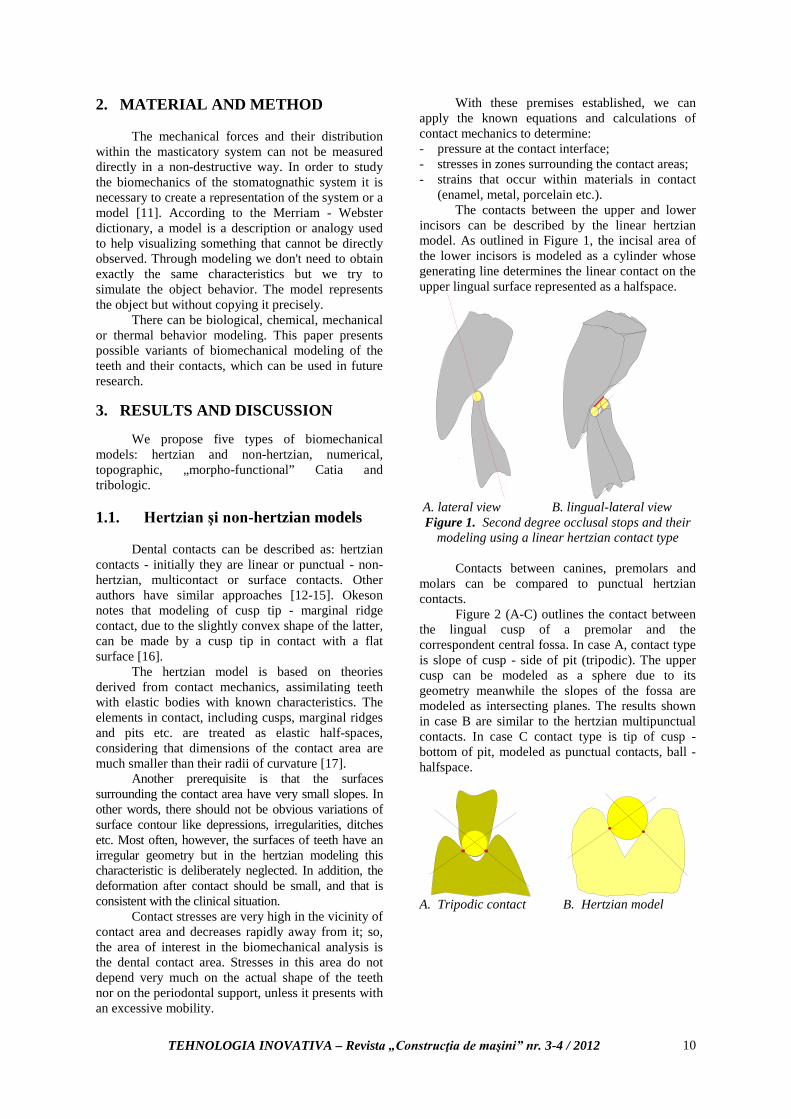
(enamel, metal, porcelain etc.). The contacts between the upper and lower
incisors can be described by the linear hertzian model. As outlined in Figure 1, the incisal area of the lower incisors is modeled as a cylinder whose generating line determines the linear contact on the upper lingual surface represented as a halfspace.
A. lateral view B. lingual-lateral view Figure 1. Second degree occlusal stops and their
modeling using a linear hertzian contact type
Contacts between canines, premolars and molars can be compared to punctual hertzian contacts.
Figure 2 (A-C) outlines the contact between the lingual cusp of a premolar and the correspondent central fossa. In case A, contact type is slope of cusp - side of pit (tripodic). The upper cusp can be modeled as a sphere due to its geometry meanwhile the slopes of the fossa are modeled as intersecting planes. The results shown in case B are similar to the hertzian multipunctual contacts. In case C contact type is tip of cusp - bottom of pit, modeled as punctual contacts, ball - halfspace.
A. Tripodic contact B. Hertzian model
TEHNOLOGIA INOVATIVA – Revista „Construcţia de maşini” nr. 3-4 / 2012
11
C. Tip cusp – bottom pit contact
D. Cusp slope – pit slope contacts
E.Cusp tip- bottom pit contacts
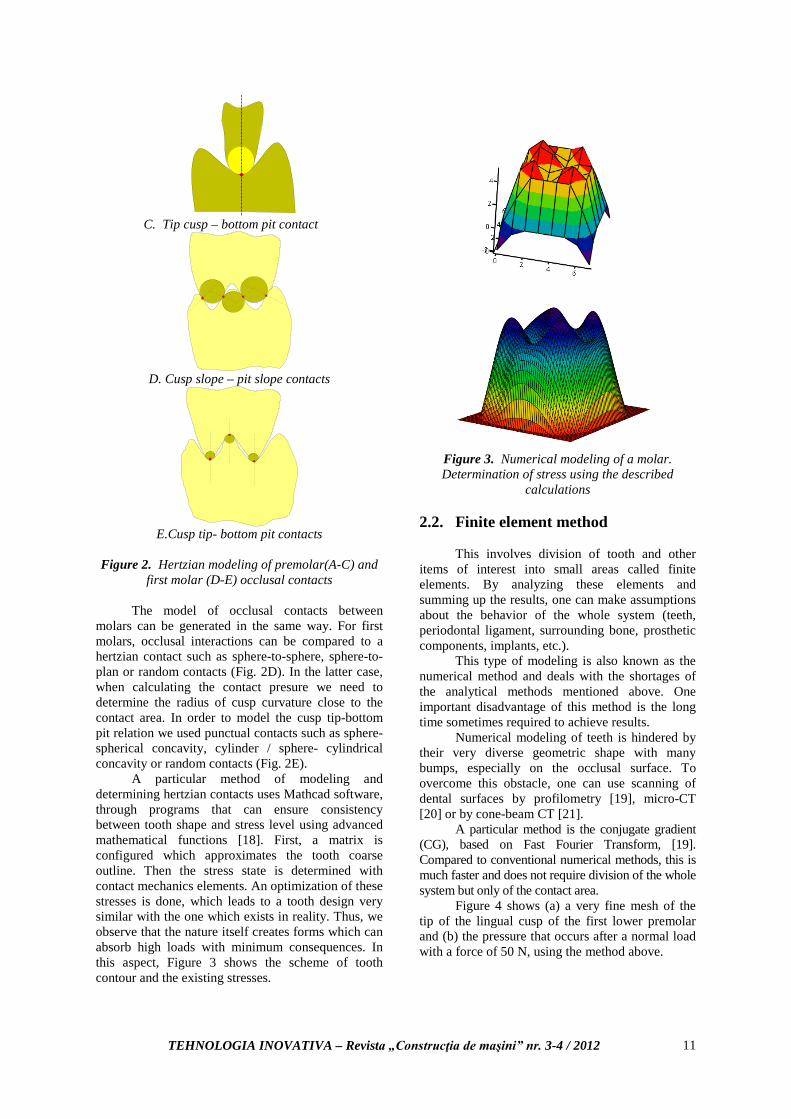
Figure 2. Hertzian modeling of premolar(A-C) and
first molar (D-E) occlusal contacts The model of occlusal contacts between molars can be generated in the same way. For first molars, occlusal interactions can be compared to a hertzian contact such as sphere-to-sphere, sphere-to-plan or random contacts (Fig. 2D). In the latter case, when calculating the contact presure we need to determine the radius of cusp curvature close to the contact area. In order to model the cusp tip-bottom pit relation we used punctual contacts such as sphere-spherical concavity, cylinder / sphere- cylindrical concavity or random contacts (Fig. 2E).
A particular method of modeling and determining hertzian contacts uses Mathcad software, through programs that can ensure consistency between tooth shape and stress level using advanced mathematical functions [18]. First, a matrix is configured which approximates the tooth coarse outline. Then the stress state is determined with contact mechanics elements. An optimization of these stresses is done, which leads to a tooth design very similar with the one which exists in reality. Thus, we observe that the nature itself creates forms which can absorb high loads with minimum consequences. In this aspect, Figure 3 shows the scheme of tooth contour and the existing stresses.
Figure 3. Numerical modeling of a molar. Determination of stress using the described
calculations
2.2. Finite element method
This involves division of tooth and other items of interest into small areas called finite elements. By analyzing these elements and summing up the results, one can make assumptions about the behavior of the whole system (teeth, periodontal ligament, surrounding bone, prosthetic components, implants, etc.).
This type of modeling is also known as the numerical method and deals with the shortages of the analytical methods mentioned above. One important disadvantage of this method is the long time sometimes required to achieve results.
Numerical modeling of teeth is hindered by their very diverse geometric shape with many bumps, especially on the occlusal surface. To overcome this obstacle, one can use scanning of dental surfaces by profilometry [19], micro-CT [20] or by cone-beam CT [21].
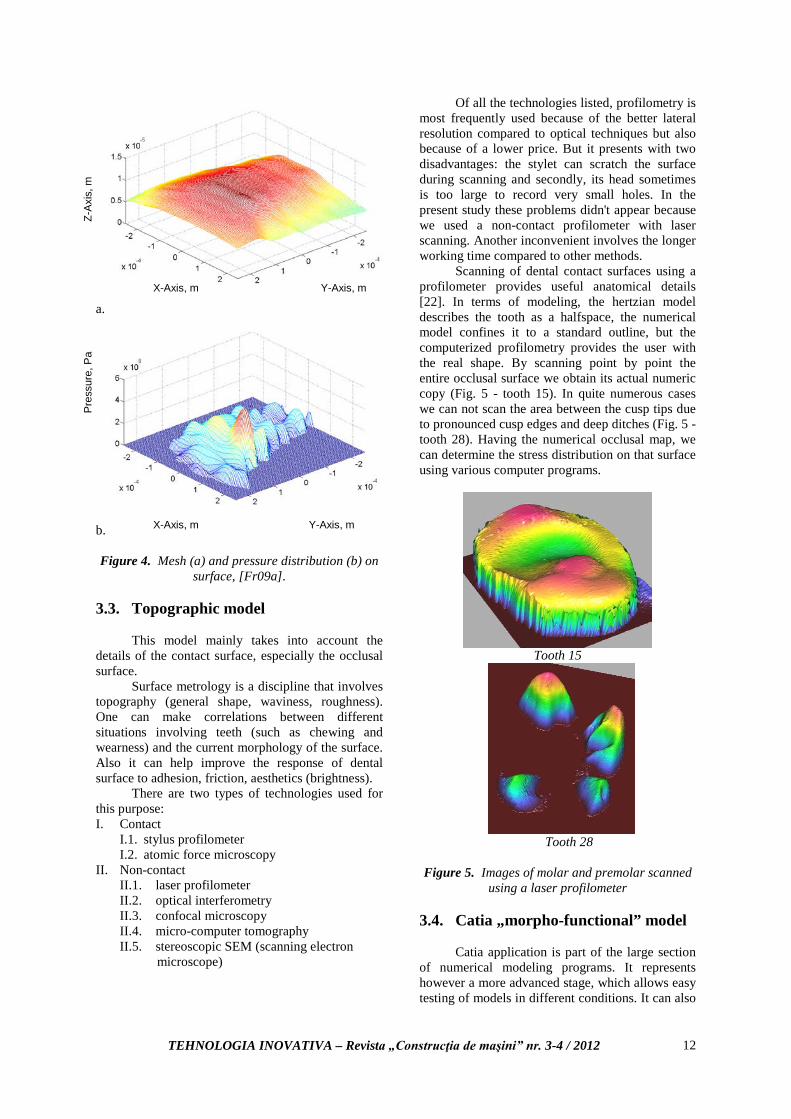
A particular method is the conjugate gradient (CG), based on Fast Fourier Transform, [19]. Compared to conventional numerical methods, this is much faster and does not require division of the whole system but only of the contact area.
Figure 4 shows (a) a very fine mesh of the tip of the lingual cusp of the first lower premolar and (b) the pressure that occurs after a normal load with a force of 50 N, using the method above.
TEHNOLOGIA INOVATIVA – Revista „Construcţia de maşini” nr. 3-4 / 2012
12
a.
b.
Figure 4. Mesh (a) and pressure distribution (b) on
surface, [Fr09a].
3.3. Topographic model
This model mainly takes into account the details of the contact surface, especially the occlusal surface.
Surface metrology is a discipline that involves topography (general shape, waviness, roughness). One can make correlations between different situations involving teeth (such as chewing and wearness) and the current morphology of the surface. Also it can help improve the response of dental surface to adhesion, friction, aesthetics (brightness).
There are two types of technologies used for this purpose: I. Contact
I.1. stylus profilometer I.2. atomic force microscopy
II. Non-contact II.1. laser profilometer II.2. optical interferometry II.3. confocal microscopy II.4. micro-computer tomography II.5. stereoscopic SEM (scanning electron
microscope)
Of all the technologies listed, profilometry is most frequently used because of the better lateral resolution compared to optical techniques but also because of a lower price. But it presents with two disadvantages: the stylet can scratch the surface during scanning and secondly, its head sometimes is too large to record very small holes. In the present study these problems didn't appear because we used a non-contact profilometer with laser scanning. Another inconvenient involves the longer working time compared to other methods.
Scanning of dental contact surfaces using a profilometer provides useful anatomical details [22]. In terms of modeling, the hertzian model describes the tooth as a halfspace, the numerical model confines it to a standard outline, but the computerized profilometry provides the user with the real shape. By scanning point by point the entire occlusal surface we obtain its actual numeric copy (Fig. 5 - tooth 15). In quite numerous cases we can not scan the area between the cusp tips due to pronounced cusp edges and deep ditches (Fig. 5 - tooth 28). Having the numerical occlusal map, we can determine the stress distribution on that surface using various computer programs.
Tooth 15
Tooth 28
Figure 5. Images of molar and premolar scanned
using a laser profilometer
3.4. Catia „morpho-functional” model
Catia application is part of the large section of numerical modeling programs. It represents however a more advanced stage, which allows easy testing of models in different conditions. It can also
X-Axis, m Y-Axis, m
X-Axis, m Y-Axis, m
Z-A
xis,
m
Pre
ssur
e, P
a
TEHNOLOGIA INOVATIVA – Revista „Construcţia de maşini” nr. 3-4 / 2012
13
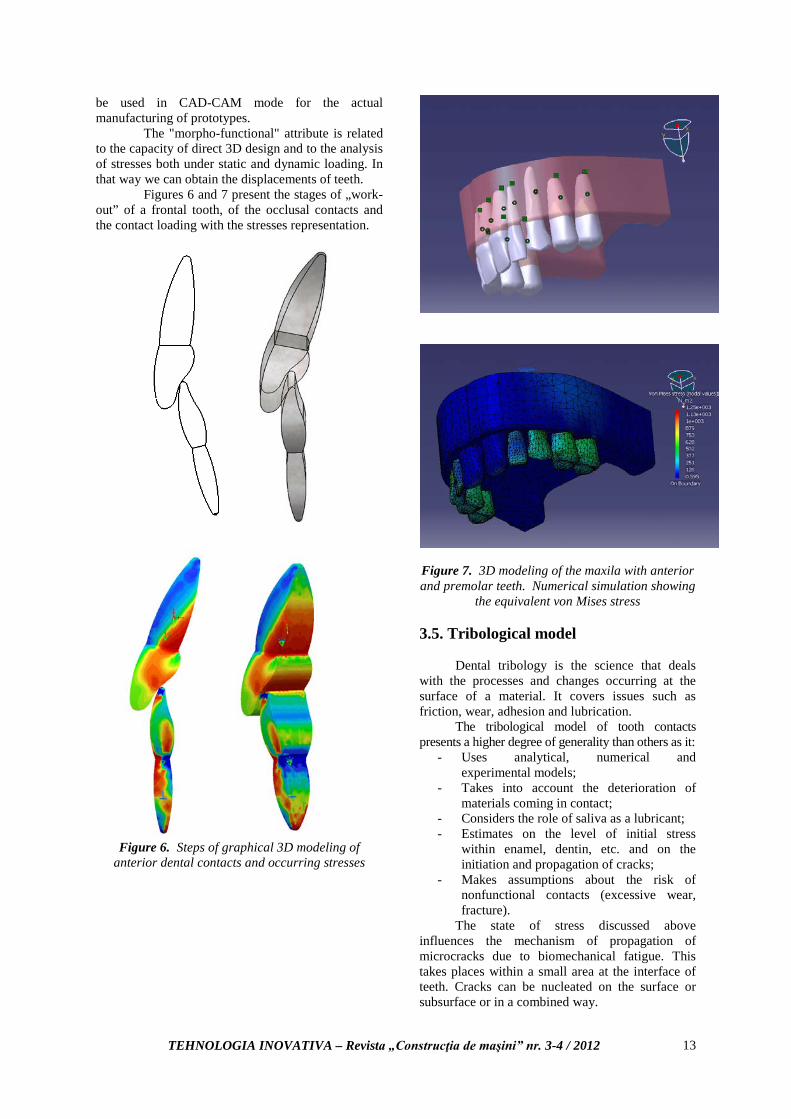
be used in CAD-CAM mode for the actual manufacturing of prototypes. The "morpho-functional" attribute is related to the capacity of direct 3D design and to the analysis of stresses both under static and dynamic loading. In that way we can obtain the displacements of teeth. Figures 6 and 7 present the stages of „work-out” of a frontal tooth, of the occlusal contacts and the contact loading with the stresses representation.
Figure 6. Steps of graphical 3D modeling of
anterior dental contacts and occurring stresses
Figure 7. 3D modeling of the maxila with anterior and premolar teeth. Numerical simulation showing
the equivalent von Mises stress
3.5. Tribological model
Dental tribology is the science that deals with the processes and changes occurring at the surface of a material. It covers issues such as friction, wear, adhesion and lubrication.
The tribological model of tooth contacts presents a higher degree of generality than others as it:
- Uses analytical, numerical and experimental models;
- Takes into account the deterioration of materials coming in contact;
- Considers the role of saliva as a lubricant; - Estimates on the level of initial stress
within enamel, dentin, etc. and on the initiation and propagation of cracks;
- Makes assumptions about the risk of nonfunctional contacts (excessive wear, fracture).
The state of stress discussed above influences the mechanism of propagation of microcracks due to biomechanical fatigue. This takes places within a small area at the interface of teeth. Cracks can be nucleated on the surface or subsurface or in a combined way.
TEHNOLOGIA INOVATIVA – Revista „Construcţia de maşini” nr. 3-4 / 2012
14
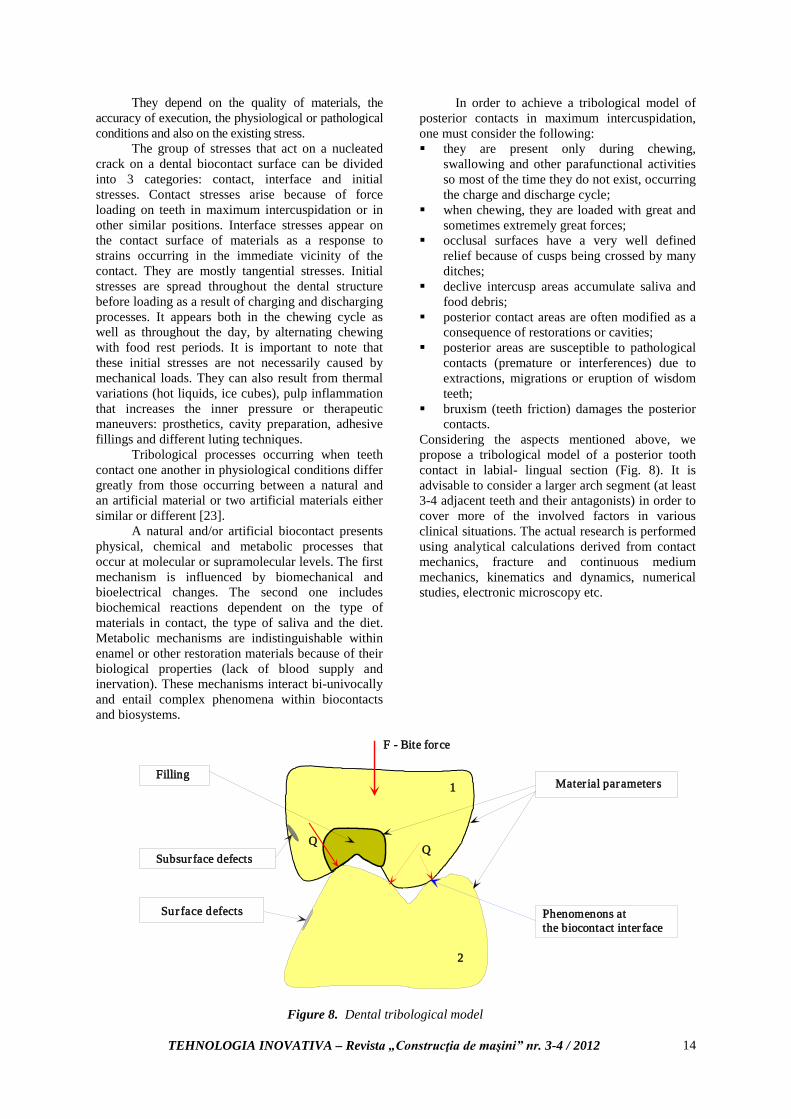
They depend on the quality of materials, the accuracy of execution, the physiological or pathological conditions and also on the existing stress.
The group of stresses that act on a nucleated crack on a dental biocontact surface can be divided into 3 categories: contact, interface and initial stresses. Contact stresses arise because of force loading on teeth in maximum intercuspidation or in other similar positions. Interface stresses appear on the contact surface of materials as a response to strains occurring in the immediate vicinity of the contact. They are mostly tangential stresses. Initial stresses are spread throughout the dental structure before loading as a result of charging and discharging processes. It appears both in the chewing cycle as well as throughout the day, by alternating chewing with food rest periods. It is important to note that these initial stresses are not necessarily caused by mechanical loads. They can also result from thermal variations (hot liquids, ice cubes), pulp inflammation that increases the inner pressure or therapeutic maneuvers: prosthetics, cavity preparation, adhesive fillings and different luting techniques.
Tribological processes occurring when teeth contact one another in physiological conditions differ greatly from those occurring between a natural and an artificial material or two artificial materials either similar or different [23].
A natural and/or artificial biocontact presents physical, chemical and metabolic processes that occur at molecular or supramolecular levels. The first mechanism is influenced by biomechanical and bioelectrical changes. The second one includes biochemical reactions dependent on the type of materials in contact, the type of saliva and the diet. Metabolic mechanisms are indistinguishable within enamel or other restoration materials because of their biological properties (lack of blood supply and inervation). These mechanisms interact bi-univocally and entail complex phenomena within biocontacts and biosystems.
In order to achieve a tribological model of posterior contacts in maximum intercuspidation, one must consider the following: they are present only during chewing,
swallowing and other parafunctional activities so most of the time they do not exist, occurring the charge and discharge cycle;
when chewing, they are loaded with great and sometimes extremely great forces;
occlusal surfaces have a very well defined relief because of cusps being crossed by many ditches;
declive intercusp areas accumulate saliva and food debris;
posterior contact areas are often modified as a consequence of restorations or cavities;
posterior areas are susceptible to pathological contacts (premature or interferences) due to extractions, migrations or eruption of wisdom teeth;
bruxism (teeth friction) damages the posterior contacts.
Considering the aspects mentioned above, we propose a tribological model of a posterior tooth contact in labial- lingual section (Fig. 8). It is advisable to consider a larger arch segment (at least 3-4 adjacent teeth and their antagonists) in order to cover more of the involved factors in various clinical situations. The actual research is performed using analytical calculations derived from contact mechanics, fracture and continuous medium mechanics, kinematics and dynamics, numerical studies, electronic microscopy etc.
1
2
F - Bite force
Mater ial parameters
Phenomenons at the biocontact inter face
Sur face defects
Subsurface defects
Filling
Figure 8. Dental tribological model
TEHNOLOGIA INOVATIVA – Revista „Construcţia de maşini” nr. 3-4 / 2012
15
4. CONCLUSION
A representation or a model of the stomatognathic system is necessary in order to study the biomechanics of teeth contacts. Modeling can create a useful conceptual framework for developing hypotheses on the role of stresses in the mastication process despite of existing limitations. REFERENCES 1. Raadsheer MC, van Eijden TM, van Ginkell FC, Prahl-
Andersen B, Contribution of Jaw Muscle Size and Craniofacial Morphology to Human Bite Force Magnitude, J Dent Res 1999; 78(1): 31-42
2. Scott G.R., Turner C.G., The anthropology of modern human teeth. Dental morphology and its variation in recent human population, Cambridge University Press, 1997
3. Torbjörner A., Fransson B., Biomechanical aspects of prosthetic treatment of structurally compromised teeth, Int J Prosthodont 2004; 17:135–141
4. Korioth TWP, Hannam AG. Deformation of the human mandible during simulated tooth clenching, J Dent Res 1994; 73:56-66
5. Oh WS, Götzen N, Anusavice KJ. Influence of Connector Design on Fracture Probability of Ceramic Fixed-partial Dentures. J Dent Res 2002; 81:623-627
6. Spears IR., A Three-dimensional finite element model of prismatic enamel: A reappraisal of the data on the Young's modulus of enamel., J Dent Res 1997; 76:1690-1697
7. Hidaka 0., Iwasaki M., Saito M., Morimoto T., Influence of clenching intensity on bite force balance, occlusal contact area and average bite pressure, J Dent Res 1999, 78(7): 1336-1344
8. Frunza M., Frunza G, Luca R., The use of numerical applications in the study of dental contacts, Appl Med Inform 2010, 26(2): 73-82
9. Lawn B, Indentation of Ceramics with Spheres: A Century after Hertz, J Am Ceram Soc 1998, 81(8): 1977-1994
10. Wang MQ, Zhang M, Zhang JH, Photoelastic study of the effects of occlusal surface morphology on tooth apical stress from vertical bite forces, J Contemp Dent Pract 2004; 5(1):74-93
11. Pileicikiene G., Varpiotas E., Surna R., Surna A., A three-dimensional model of the human masticatory system, including the mandible, the dentition and the temporomandibular joints, Stomatologija, Baltic Dental and Maxillofacial Journal 2007; 9:27-32
12. Peterson IM, Pajares A, Lawn BR, Thompson VP, Rekow ED. Mechanical characterization of dental ceramics by Hertzian contacts. J Dent Res 1998;77:589-602
13. Deng Y, Lawn BR, Lloyd IK. Characterization of damages modes in dental ceramic bilayer structures, J Biomed Mater Res (Appl Biomater) 2002; 63:137-145.
14. Lawn BR, Deng Y, Lloyd IK, Janal MN, Rekow ED, Thompson YP. Materials design of ceramic-based layer structures for crowns. J Dent Res 2002;81:433-438.
15. Chai H, Lawn BR. Hydraulically pumped cone fracture in brittle solids. Acta Materialia 2005;53: 4237–4244
16. Okeson J., Fundamentals of occlusion and temporomandibular disorders, C.V. Mosby, 1985
17. Frunza G. et al, Research Upon The Effects Of Initial Stresses In Dental Biocontacts, Research Report, Grant CNCSIS 757, 2009
18. Frunza G, Frunza MC. Stress state in enamel layer of dental contacts. J Biomech 2008;41(suppl 1): S217
19. Frunza G, Spanu S, Frunza MC. Numerical simulation of pressure distribution in multiasperity dental contacts. Annals of the Oradea University. Fascicle of Management and Tehnological Engineering 2009;VIII:236-239.
20. Magne P, Efficient 3D finite element analysis of dental restorative procedures using micro-CT data, Dental Mater 2007; 23(5):539-548
21. Hassan B., Souza P.C., Jacobs R., Berti S.A, Stelt P., Influence of scanning and reconstruction parameters on quality of three-dimensional surface models of the dental arches from cone beam computed tomography, Clin Oral Invest 2010; 14(3): 303-310
22. Mikulewicz M., SEM and profilometric evaluation of enamel surface after air rotor stripping – an in vitro study, Acta Bioeng Biomech 2007, 9(1): 11-17
23. Koczorowski R., Tribological wear of some prosthetic materials in contact with dental ceramic (in vitro investigation), Acta Bioeng Biomech 1999, 1 (2):13-17.
Quick Info MULTI-PHOTON MICROSCOPY IMPROVES BRAIN IMAGING
At Cornell University, Ithaca, NY, scientists have demonstrated a new way of taking high-resolution, 3D images of the brain's inner workings by a three-fold improvement in the depth limits of multiphoton microscopy, a fluorescence-based imaging technique.
A team of engineers demonstrated high-resolution, 3D imaging of the subcortical region of a live, intact mouse brain, breaking the previous depth limit of standard two-photon microscopy, which is a widely used imaging technology invented in 1990 at Cornell.
Their research describes three-photon fluorescence, combined with a longer excitation wavelength of the laser pulse, to overcome such obstacles as tissue scattering and absorption, which prohibit high-resolution imaging deep within biological tissues.
Using a mouse model, the researchers proved the principle of three-photon microscopy operating at a wavelength of 1,700 nanometers. This, in combination with the new laser specifically created for three-photon excitation, allows the researchers to perform high-resolution imaging of neurons at unprecedented depths within a mouse brain, which could eventually prove useful in imaging brains ofpeople with depression or Alzheimer's associated with changes deep inside the brain.
(Source: http://www.medicaldesignbriefs.com/component/ content/article/15702)
TEHNOLOGIA INOVATIVA – Revista „Construcţia de maşini” nr. 3-4 / 2012
16
NEW IMAGING METHOD TO STUDY DIABETES
A group of researchers at Umeå University Center for Molecular Medicine in Sweden have developed a new biomedical imaging method using optical projection tomography (OPT) to study insulin-producing cells in diabetes.
Initially the method could only be used on relatively small preparations, but five years ago the scientists were able to adapt the technology to study whole organs including the pancreas from adult mice.
The findings describe a further development of the OPT technology by going from ordinary visible light to the near-infrared spectrum. Near infrared light has longer wavelengths that can more easily penetrate tissue, so the newly developed imaging platform can enable the study of much larger samples than was previously possible.
Being able to image in near-infrared light, also means that it’s possible to study more and different cell types in one organ preparation. Near Infrared-OPT technology may also be used as a tool to calibrate the non-invasive read out by magnetic resonance imaging.
This will be tested in the newly launched Marie Curie project "European Training Network for Excellence in Molecular Imaging in Diabetes," which links together five major EU-funded research consortia with different cutting-edge competences in the field.
(Source: http://www.medicaldesignbriefs.com/component/ content/article/15701)
USING HAND GESTURES TO REVIEW MRI IMAGES?
Surgeons may soon be able to use a system in the operating room that recognizes hand gestures as commands to a computer to browse and display medical images of the patient during a surgery. Researchers at Purdue University, West Lafayette, IN, are creating a system that uses depth-sensing cameras and specialized algorithms to recognize hand gestures as commands to manipulate MRI images on a large display.
Surgeons routinely need to review medical images and records during surgery, but stepping away from the operating table and touching a keyboard and mouse can delay the procedure and increase the risk of spreading infection-causing bacteria, said Juan Pablo Wachs, an assistant professor of industrial engineering at Purdue University.
When nurses or assistants operate the keyboard for the surgeon, the process of conveying information accurately is cumbersome and inefficient since spoken dialogue can be time-consuming and leads to frustration and delays in the surgery."
The algorithm takes into account what phase the surgery is in, which aids in determining the proper context for interpreting the gestures and reducing the browsing time. The system also has been shown to have a mean accuracy of about 93 percent in translating gestures into specific commands, such as rotating and browsing images. Their findings were detailed in a paper published in December in the Journal of the American Medical Informatics Association.
(Source: http://www.medicaldesignbriefs.com/component/ content/article/15525)
TEHNOLOGIA INOVATIVĂ – Revista „Construcţia de maşini” nr. 3-4 / 2012
17
MODELLING AND TESTING OF AN ADHESIVE BONDED JOINT
Cătălin Pîrvu, Mihail Boţan
“Dunarea de Jos” University of Galati, Galati, ROMANIA, e-mail: [email protected]
REZUMAT Această lucrare prezintă o simulare a unei lipituri simplu suprapuse şi rezultate experimentale pentru aceeaşi lipitură, obţinute din teste de tracţiune. Modelul ansamblului lipit a fost rulat in domeniul elastic şi rezultatele obţinute sunt în concordanţă cu rezultatele expimentale ale testelor de tracţiune. Au fost identificate mecanisme de rupere pentru asamblări lipite simplu suprapuse, testate la tracţiune. Simularea asamblării lipite a dat rezultate bune, în concordanţă cu rezultatele obţinute din testele de tracţiune. Asamblările obţinute prin lipirea materialelor fragile sunt caracterizate de o împrăştiere mai mare a proprietăţilor mecanice. Cu excepţia modulului lui Young care a avut un interval mic de împrăştiere pentru testele la tracţiune, celelate proprietăţi au avut o împrăştire de ±30% faţă de valoarea medie. Pentru acest ansamblu, caracteristicile mecanice au avut valori mai mici comparativ cu proprietăţile fiecăruia din materialele participante la asamblare, dar se pot obţine forme complexe. ABSTRACT This paper presents a simulation of a single lap bonded joint and experimental results on the same geometry of adhesive joint, after being tested in traction. The model of the adhesive joint was run taking into account an elastic behavior of all involved materials and the obtained results were in agreement with the results obtained from traction tests. There were identified the failure mechanisms of the single lap bonded joints tested in traction. The simulation of the bonded joint gives good results in agreement with the results obtained from the traction tests. Assemblies obtained by adhesive joint of fragile materials are characterized by larger spread ranges of the mechanical properties. Except Young modulus that exhibits a narrow range for traction tests, the other properties are spread ±30% around the average values. For this assembly, the mechanical characteristics are lower as compared to each of the involved materials, but complex shapes may be obtained.
KEYWORDS: FEM, adhesive lap joint, traction test CUVINTE CHEIE: FEM, asamblare simplu suprapusă prin lipire, test de tracţiune
1. INTRODUCTION
Adhesive joints are of great interest in the research field as they offer solutions for assembling dissimilar materials and to design complex shapes with materials that technologically are hard to be modeled [5, 7, 10, 14, 15].
This paper presents a simulation and an experimental work in order to point out the „bridge” between these two aspects of designing adhesive joints. A model close to the actual system and its results from FEM simulation to the sample behavior in tests are benefit for the designers, saving time and money when using adhesives [1, 4, 11, 12, 16, 17].
TEHNOLOGIA INOVATIVĂ – Revista „Construcţia de maşini” nr. 3-4 / 2012
18
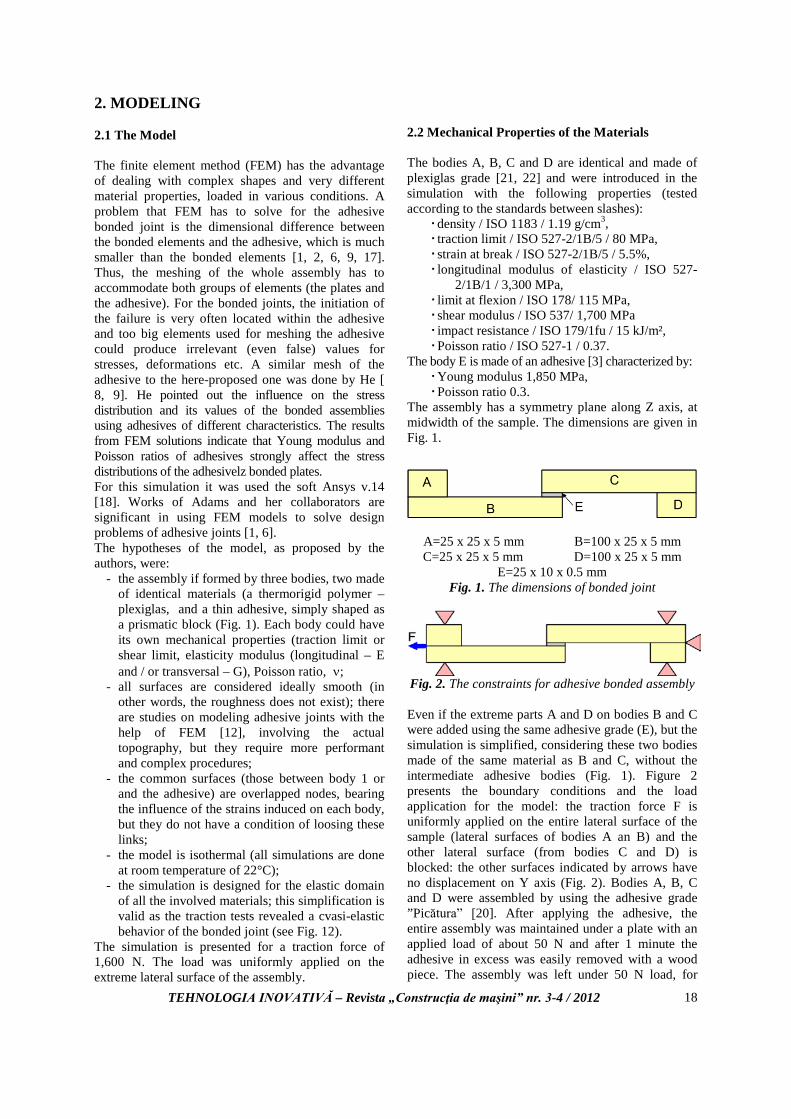
2. MODELING 2.1 The Model The finite element method (FEM) has the advantage of dealing with complex shapes and very different material properties, loaded in various conditions. A problem that FEM has to solve for the adhesive bonded joint is the dimensional difference between the bonded elements and the adhesive, which is much smaller than the bonded elements [1, 2, 6, 9, 17]. Thus, the meshing of the whole assembly has to accommodate both groups of elements (the plates and the adhesive). For the bonded joints, the initiation of the failure is very often located within the adhesive and too big elements used for meshing the adhesive could produce irrelevant (even false) values for stresses, deformations etc. A similar mesh of the adhesive to the here-proposed one was done by He [ 8, 9]. He pointed out the influence on the stress distribution and its values of the bonded assemblies using adhesives of different characteristics. The results from FEM solutions indicate that Young modulus and Poisson ratios of adhesives strongly affect the stress distributions of the adhesivelz bonded plates. For this simulation it was used the soft Ansys v.14 [18]. Works of Adams and her collaborators are significant in using FEM models to solve design problems of adhesive joints [1, 6]. The hypotheses of the model, as proposed by the authors, were:
- the assembly if formed by three bodies, two made of identical materials (a thermorigid polymer – plexiglas, and a thin adhesive, simply shaped as a prismatic block (Fig. 1). Each body could have its own mechanical properties (traction limit or shear limit, elasticity modulus (longitudinal – E and / or transversal – G), Poisson ratio, ν;
- all surfaces are considered ideally smooth (in other words, the roughness does not exist); there are studies on modeling adhesive joints with the help of FEM [12], involving the actual topography, but they require more performant and complex procedures;
- the common surfaces (those between body 1 or and the adhesive) are overlapped nodes, bearing the influence of the strains induced on each body, but they do not have a condition of loosing these links;
- the model is isothermal (all simulations are done at room temperature of 22°C);
- the simulation is designed for the elastic domain of all the involved materials; this simplification is valid as the traction tests revealed a cvasi-elastic behavior of the bonded joint (see Fig. 12).
The simulation is presented for a traction force of 1,600 N. The load was uniformly applied on the extreme lateral surface of the assembly.
2.2 Mechanical Properties of the Materials The bodies A, B, C and D are identical and made of plexiglas grade [21, 22] and were introduced in the simulation with the following properties (tested according to the standards between slashes):
density / ISO 1183 / 1.19 g/cm3, traction limit / ISO 527-2/1B/5 / 80 MPa, strain at break / ISO 527-2/1B/5 / 5.5%, longitudinal modulus of elasticity / ISO 527-
2/1B/1 / 3,300 MPa, limit at flexion / ISO 178/ 115 MPa, shear modulus / ISO 537/ 1,700 MPa impact resistance / ISO 179/1fu / 15 kJ/m², Poisson ratio / ISO 527-1 / 0.37.
The body E is made of an adhesive [3] characterized by: Young modulus 1,850 MPa, Poisson ratio 0.3.
The assembly has a symmetry plane along Z axis, at midwidth of the sample. The dimensions are given in Fig. 1.
A=25 x 25 x 5 mm B=100 x 25 x 5 mm C=25 x 25 x 5 mm D=100 x 25 x 5 mm
E=25 x 10 x 0.5 mm Fig. 1. The dimensions of bonded joint
Fig. 2. The constraints for adhesive bonded assembly
Even if the extreme parts A and D on bodies B and C were added using the same adhesive grade (E), but the simulation is simplified, considering these two bodies made of the same material as B and C, without the intermediate adhesive bodies (Fig. 1). Figure 2 presents the boundary conditions and the load application for the model: the traction force F is uniformly applied on the entire lateral surface of the sample (lateral surfaces of bodies A an B) and the other lateral surface (from bodies C and D) is blocked: the other surfaces indicated by arrows have no displacement on Y axis (Fig. 2). Bodies A, B, C and D were assembled by using the adhesive grade ”Picătura” [20]. After applying the adhesive, the entire assembly was maintained under a plate with an applied load of about 50 N and after 1 minute the adhesive in excess was easily removed with a wood piece. The assembly was left under 50 N load, for
TEHNOLOGIA INOVATIVĂ – Revista „Construcţia de maşini” nr. 3-4 / 2012
19
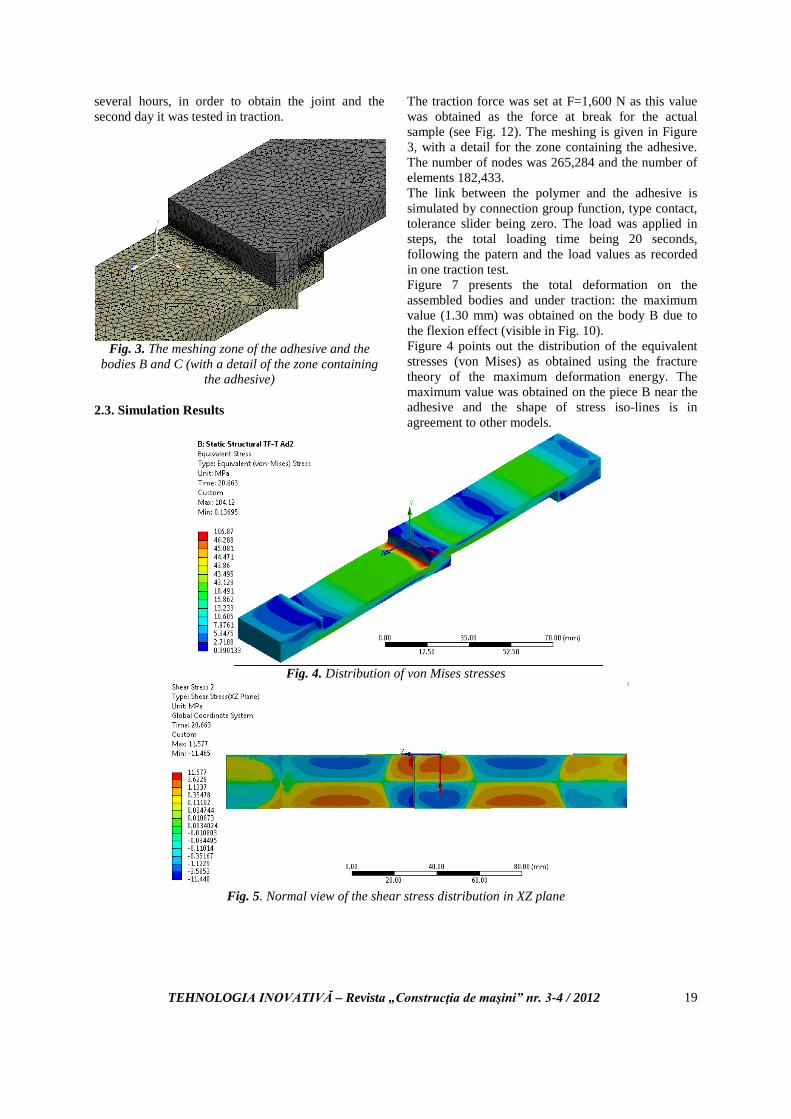
several hours, in order to obtain the joint and the second day it was tested in traction.
Fig. 3. The meshing zone of the adhesive and the
bodies B and C (with a detail of the zone containing the adhesive)
2.3. Simulation Results
The traction force was set at F=1,600 N as this value was obtained as the force at break for the actual sample (see Fig. 12). The meshing is given in Figure 3, with a detail for the zone containing the adhesive. The number of nodes was 265,284 and the number of elements 182,433. The link between the polymer and the adhesive is simulated by connection group function, type contact, tolerance slider being zero. The load was applied in steps, the total loading time being 20 seconds, following the patern and the load values as recorded in one traction test. Figure 7 presents the total deformation on the assembled bodies and under traction: the maximum value (1.30 mm) was obtained on the body B due to the flexion effect (visible in Fig. 10). Figure 4 points out the distribution of the equivalent stresses (von Mises) as obtained using the fracture theory of the maximum deformation energy. The maximum value was obtained on the piece B near the adhesive and the shape of stress iso-lines is in agreement to other models.
Fig. 4. Distribution of von Mises stresses
Fig. 5. Normal view of the shear stress distribution in XZ plane

TEHNOLOGIA INOVATIVĂ – Revista „Construcţia de maşini” nr. 3-4 / 2012
20
Fig. 6. Shear stress distribution in plane XZ
(a detail of Figure 5 presenting the adhesive, bodies B and C being transparent)
Fig. 7. Total strain distribution
Fig. 8. Strain distribution along Z direction
TEHNOLOGIA INOVATIVĂ – Revista „Construcţia de maşini” nr. 3-4 / 2012
21
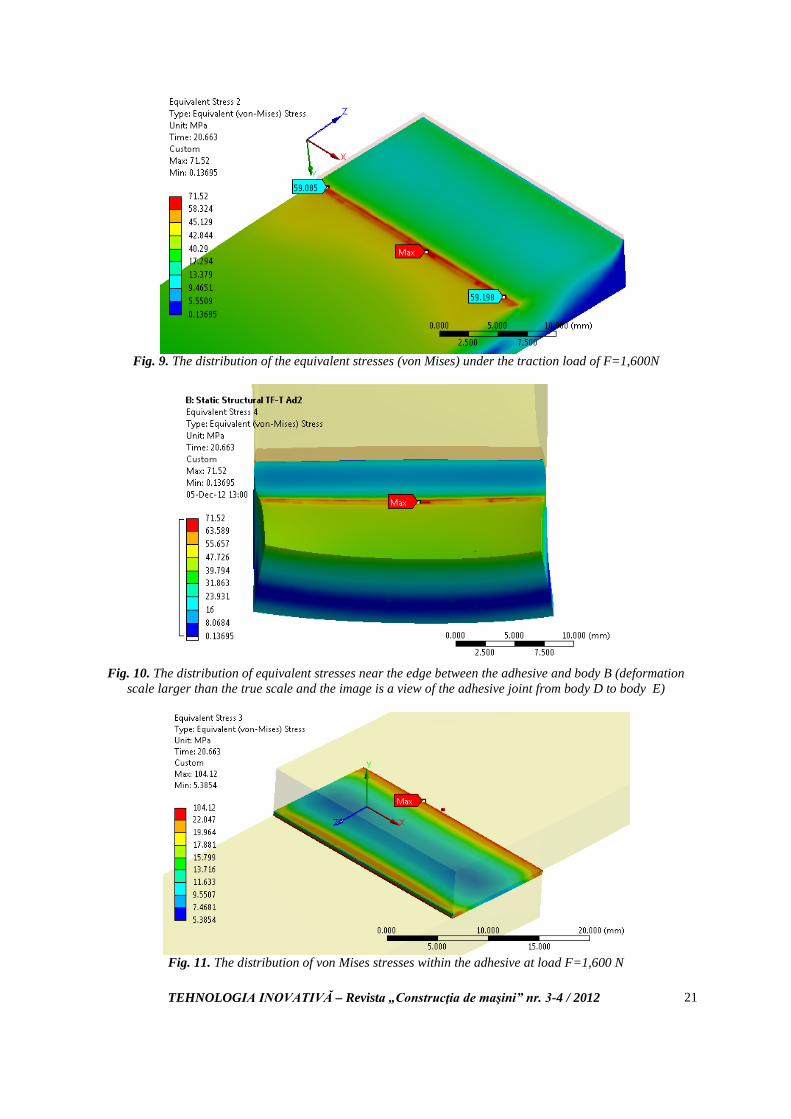
Fig. 9. The distribution of the equivalent stresses (von Mises) under the traction load of F=1,600N
Fig. 10. The distribution of equivalent stresses near the edge between the adhesive and body B (deformation
scale larger than the true scale and the image is a view of the adhesive joint from body D to body E)
Fig. 11. The distribution of von Mises stresses within the adhesive at load F=1,600 N
TEHNOLOGIA INOVATIVĂ – Revista „Construcţia de maşini” nr. 3-4 / 2012
22
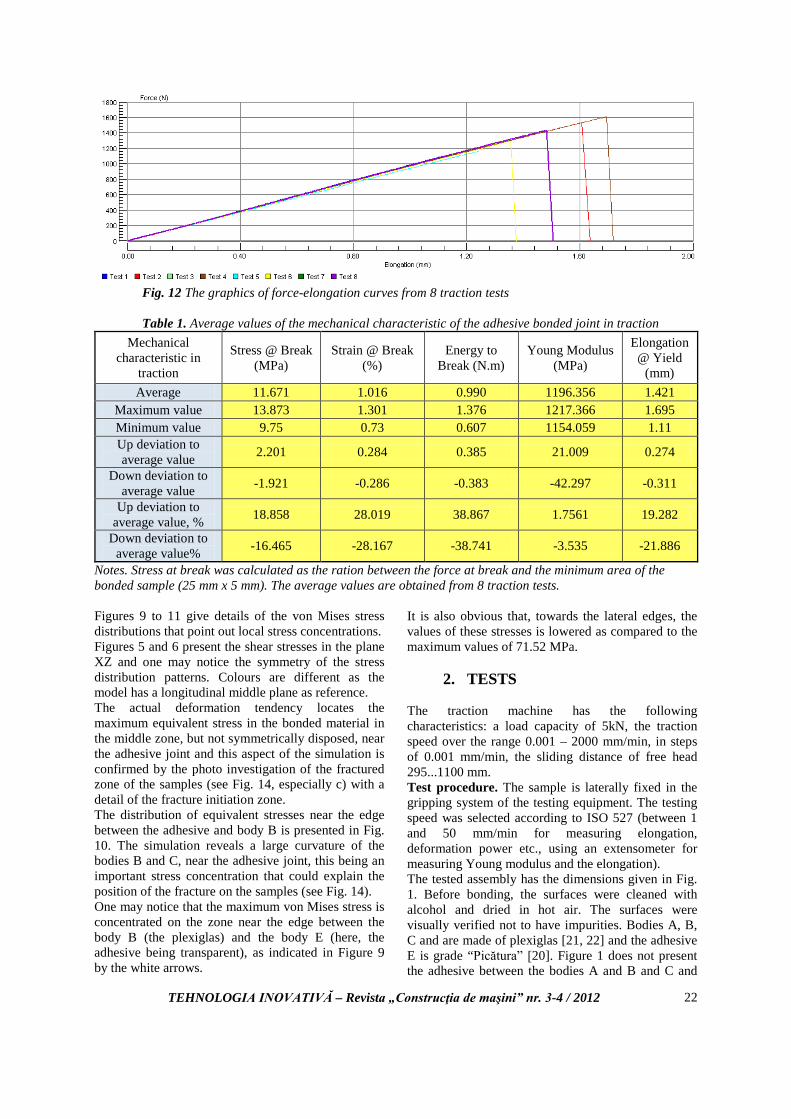
Fig. 12 The graphics of force-elongation curves from 8 traction tests Table 1. Average values of the mechanical characteristic of the adhesive bonded joint in traction
Mechanical characteristic in
traction
Stress @ Break (MPa)
Strain @ Break (%)
Energy to Break (N.m)
Young Modulus (MPa)
Elongation @ Yield
(mm) Average 11.671 1.016 0.990 1196.356 1.421
Maximum value 13.873 1.301 1.376 1217.366 1.695 Minimum value 9.75 0.73 0.607 1154.059 1.11 Up deviation to average value 2.201 0.284 0.385 21.009 0.274
Down deviation to average value -1.921 -0.286 -0.383 -42.297 -0.311
Up deviation to average value, % 18.858 28.019 38.867 1.7561 19.282
Down deviation to average value% -16.465 -28.167 -38.741 -3.535 -21.886
Notes. Stress at break was calculated as the ration between the force at break and the minimum area of the bonded sample (25 mm x 5 mm). The average values are obtained from 8 traction tests. Figures 9 to 11 give details of the von Mises stress distributions that point out local stress concentrations. Figures 5 and 6 present the shear stresses in the plane XZ and one may notice the symmetry of the stress distribution patterns. Colours are different as the model has a longitudinal middle plane as reference. The actual deformation tendency locates the maximum equivalent stress in the bonded material in the middle zone, but not symmetrically disposed, near the adhesive joint and this aspect of the simulation is confirmed by the photo investigation of the fractured zone of the samples (see Fig. 14, especially c) with a detail of the fracture initiation zone. The distribution of equivalent stresses near the edge between the adhesive and body B is presented in Fig. 10. The simulation reveals a large curvature of the bodies B and C, near the adhesive joint, this being an important stress concentration that could explain the position of the fracture on the samples (see Fig. 14). One may notice that the maximum von Mises stress is concentrated on the zone near the edge between the body B (the plexiglas) and the body E (here, the adhesive being transparent), as indicated in Figure 9 by the white arrows.
It is also obvious that, towards the lateral edges, the values of these stresses is lowered as compared to the maximum values of 71.52 MPa.
2. TESTS
The traction machine has the following characteristics: a load capacity of 5kN, the traction speed over the range 0.001 – 2000 mm/min, in steps of 0.001 mm/min, the sliding distance of free head 295...1100 mm. Test procedure. The sample is laterally fixed in the gripping system of the testing equipment. The testing speed was selected according to ISO 527 (between 1 and 50 mm/min for measuring elongation, deformation power etc., using an extensometer for measuring Young modulus and the elongation). The tested assembly has the dimensions given in Fig. 1. Before bonding, the surfaces were cleaned with alcohol and dried in hot air. The surfaces were visually verified not to have impurities. Bodies A, B, C and are made of plexiglas [21, 22] and the adhesive E is grade “Picătura” [20]. Figure 1 does not present the adhesive between the bodies A and B and C and
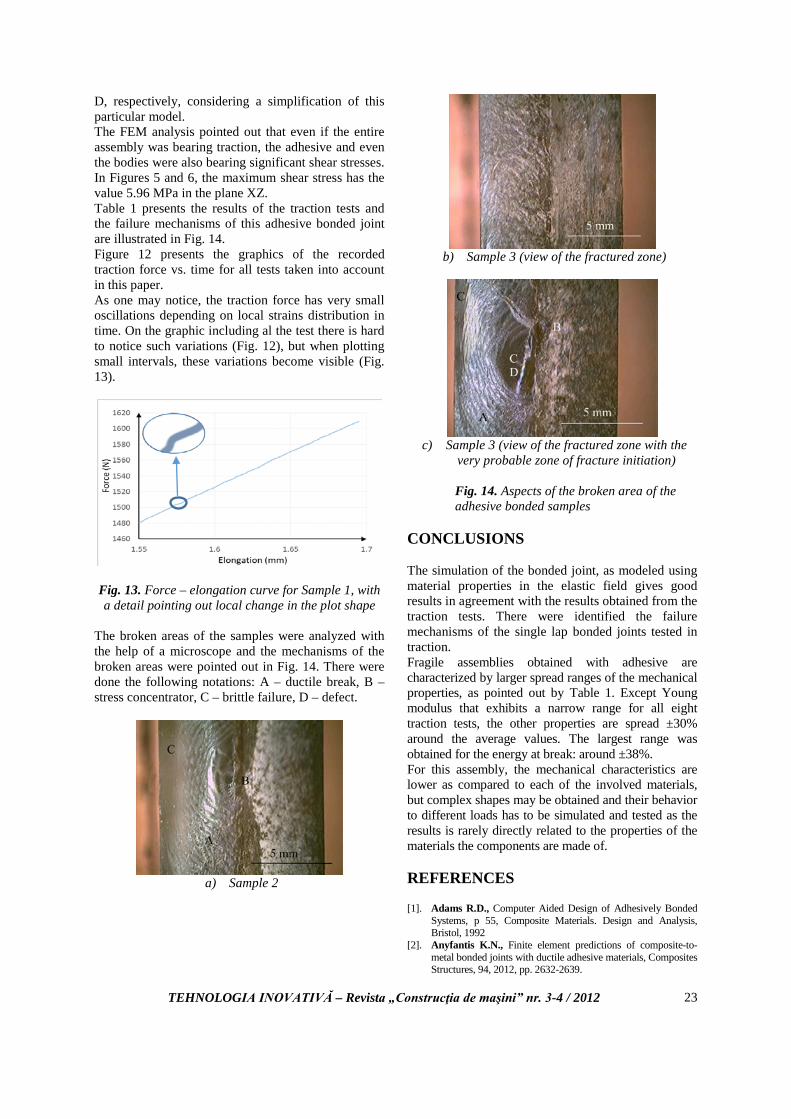
TEHNOLOGIA INOVATIVĂ – Revista „Construcţia de maşini” nr. 3-4 / 2012
23
D, respectively, considering a simplification of this particular model. The FEM analysis pointed out that even if the entire assembly was bearing traction, the adhesive and even the bodies were also bearing significant shear stresses. In Figures 5 and 6, the maximum shear stress has the value 5.96 MPa in the plane XZ. Table 1 presents the results of the traction tests and the failure mechanisms of this adhesive bonded joint are illustrated in Fig. 14. Figure 12 presents the graphics of the recorded traction force vs. time for all tests taken into account in this paper. As one may notice, the traction force has very small oscillations depending on local strains distribution in time. On the graphic including al the test there is hard to notice such variations (Fig. 12), but when plotting small intervals, these variations become visible (Fig. 13).
Fig. 13. Force – elongation curve for Sample 1, with a detail pointing out local change in the plot shape
The broken areas of the samples were analyzed with the help of a microscope and the mechanisms of the broken areas were pointed out in Fig. 14. There were done the following notations: A – ductile break, B – stress concentrator, C – brittle failure, D – defect.
a) Sample 2
b) Sample 3 (view of the fractured zone)
c) Sample 3 (view of the fractured zone with the
very probable zone of fracture initiation)
Fig. 14. Aspects of the broken area of the adhesive bonded samples
CONCLUSIONS The simulation of the bonded joint, as modeled using material properties in the elastic field gives good results in agreement with the results obtained from the traction tests. There were identified the failure mechanisms of the single lap bonded joints tested in traction. Fragile assemblies obtained with adhesive are characterized by larger spread ranges of the mechanical properties, as pointed out by Table 1. Except Young modulus that exhibits a narrow range for all eight traction tests, the other properties are spread ±30% around the average values. The largest range was obtained for the energy at break: around ±38%. For this assembly, the mechanical characteristics are lower as compared to each of the involved materials, but complex shapes may be obtained and their behavior to different loads has to be simulated and tested as the results is rarely directly related to the properties of the materials the components are made of. REFERENCES [1]. Adams R.D., Computer Aided Design of Adhesively Bonded
Systems, p 55, Composite Materials. Design and Analysis, Bristol, 1992
[2]. Anyfantis K.N., Finite element predictions of composite-to-metal bonded joints with ductile adhesive materials, Composites Structures, 94, 2012, pp. 2632-2639.
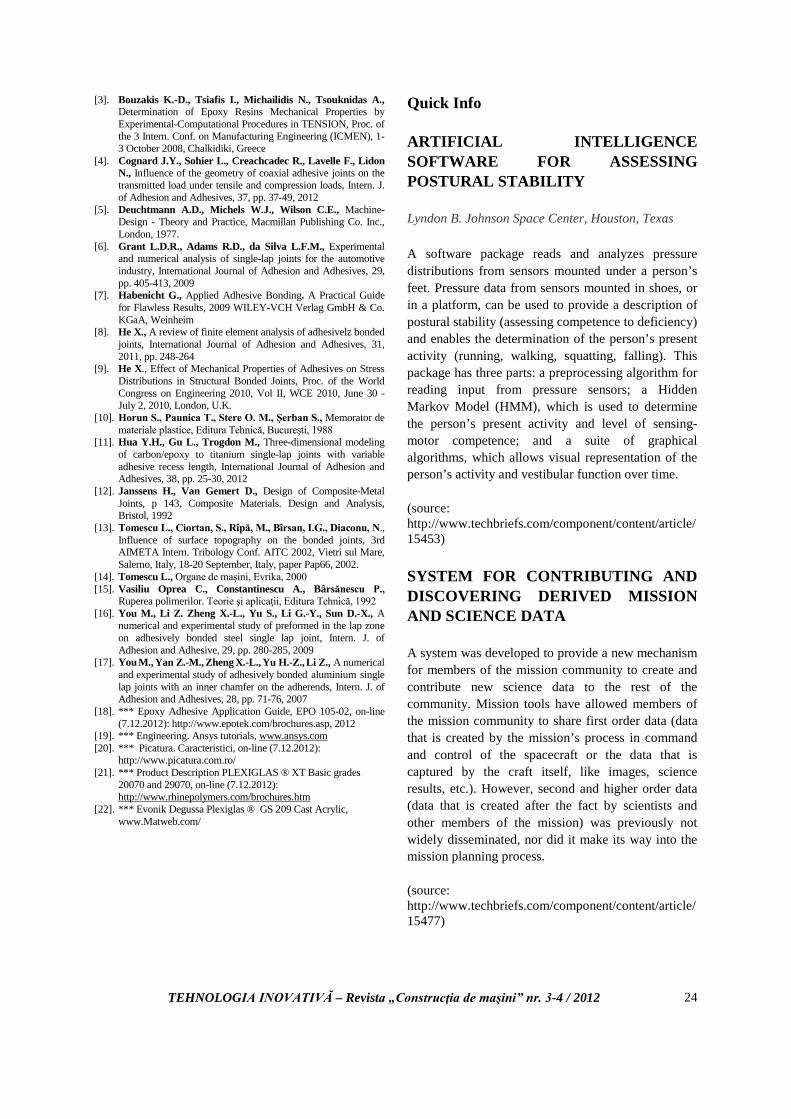
TEHNOLOGIA INOVATIVĂ – Revista „Construcţia de maşini” nr. 3-4 / 2012
24
[3]. Bouzakis K.-D., Tsiafis I., Michailidis N., Tsouknidas A., Determination of Epoxy Resins Mechanical Properties by Experimental-Computational Procedures in TENSION, Proc. of the 3 Intern. Conf. on Manufacturing Engineering (ICMEN), 1-3 October 2008, Chalkidiki, Greece
[4]. Cognard J.Y., Sohier L., Creachcadec R., Lavelle F., Lidon N., Influence of the geometry of coaxial adhesive joints on the transmitted load under tensile and compression loads, Intern. J. of Adhesion and Adhesives, 37, pp. 37-49, 2012
[5]. Deuchtmann A.D., Michels W.J., Wilson C.E., Machine-Design - Theory and Practice, Macmillan Publishing Co. Inc., London, 1977.
[6]. Grant L.D.R., Adams R.D., da Silva L.F.M., Experimental and numerical analysis of single-lap joints for the automotive industry, International Journal of Adhesion and Adhesives, 29, pp. 405-413, 2009
[7]. Habenicht G., Applied Adhesive Bonding. A Practical Guide for Flawless Results, 2009 WILEY-VCH Verlag GmbH & Co. KGaA, Weinheim
[8]. He X., A review of finite element analysis of adhesivelz bonded joints, International Journal of Adhesion and Adhesives, 31, 2011, pp. 248-264
[9]. He X., Effect of Mechanical Properties of Adhesives on Stress Distributions in Structural Bonded Joints, Proc. of the World Congress on Engineering 2010, Vol II, WCE 2010, June 30 - July 2, 2010, London, U.K.
[10]. Horun S., Paunica T., Stere O. M., Şerban S., Memorator de materiale plastice, Editura Tehnică, Bucureşti, 1988
[11]. Hua Y.H., Gu L., Trogdon M., Three-dimensional modeling of carbon/epoxy to titanium single-lap joints with variable adhesive recess length, International Journal of Adhesion and Adhesives, 38, pp. 25-30, 2012
[12]. Janssens H., Van Gemert D., Design of Composite-Metal Joints, p 143, Composite Materials. Design and Analysis, Bristol, 1992
[13]. Tomescu L., Ciortan, S., Rîpă, M., Bîrsan, I.G., Diaconu, N., Influence of surface topography on the bonded joints, 3rd AIMETA Intern. Tribology Conf. AITC 2002, Vietri sul Mare, Salerno, Italy, 18-20 September, Italy, paper Pap66, 2002.
[14]. Tomescu L., Organe de maşini, Evrika, 2000 [15]. Vasiliu Oprea C., Constantinescu A., Bârsănescu P.,
Ruperea polimerilor. Teorie şi aplicaţii, Editura Tehnică, 1992 [16]. You M., Li Z. Zheng X.-L., Yu S., Li G.-Y., Sun D.-X., A
numerical and experimental study of preformed in the lap zone on adhesively bonded steel single lap joint, Intern. J. of Adhesion and Adhesive, 29, pp. 280-285, 2009
[17]. You M., Yan Z.-M., Zheng X.-L., Yu H.-Z., Li Z., A numerical
and experimental study of adhesively bonded aluminium single lap joints with an inner chamfer on the adherends, Intern. J. of Adhesion and Adhesives, 28, pp. 71-76, 2007
[18]. *** Epoxy Adhesive Application Guide, EPO 105-02, on-line (7.12.2012): http://www.epotek.com/brochures.asp, 2012
[19]. *** Engineering. Ansys tutorials, www.ansys.com [20]. *** Picatura. Caracteristici, on-line (7.12.2012):
http://www.picatura.com.ro/ [21]. *** Product Description PLEXIGLAS ® XT Basic grades
20070 and 29070, on-line (7.12.2012): http://www.rhinepolymers.com/brochures.htm
[22]. *** Evonik Degussa Plexiglas ® GS 209 Cast Acrylic, www.Matweb.com/
Quick Info
ARTIFICIAL INTELLIGENCE SOFTWARE FOR ASSESSING POSTURAL STABILITY
Lyndon B. Johnson Space Center, Houston, Texas
A software package reads and analyzes pressure distributions from sensors mounted under a person’s feet. Pressure data from sensors mounted in shoes, or in a platform, can be used to provide a description of postural stability (assessing competence to deficiency) and enables the determination of the person’s present activity (running, walking, squatting, falling). This package has three parts: a preprocessing algorithm for reading input from pressure sensors; a Hidden Markov Model (HMM), which is used to determine the person’s present activity and level of sensing-motor competence; and a suite of graphical algorithms, which allows visual representation of the person’s activity and vestibular function over time.
(source: http://www.techbriefs.com/component/content/article/15453)
SYSTEM FOR CONTRIBUTING AND DISCOVERING DERIVED MISSION AND SCIENCE DATA
A system was developed to provide a new mechanism for members of the mission community to create and contribute new science data to the rest of the community. Mission tools have allowed members of the mission community to share first order data (data that is created by the mission’s process in command and control of the spacecraft or the data that is captured by the craft itself, like images, science results, etc.). However, second and higher order data (data that is created after the fact by scientists and other members of the mission) was previously not widely disseminated, nor did it make its way into the mission planning process.
(source: http://www.techbriefs.com/component/content/article/15477)
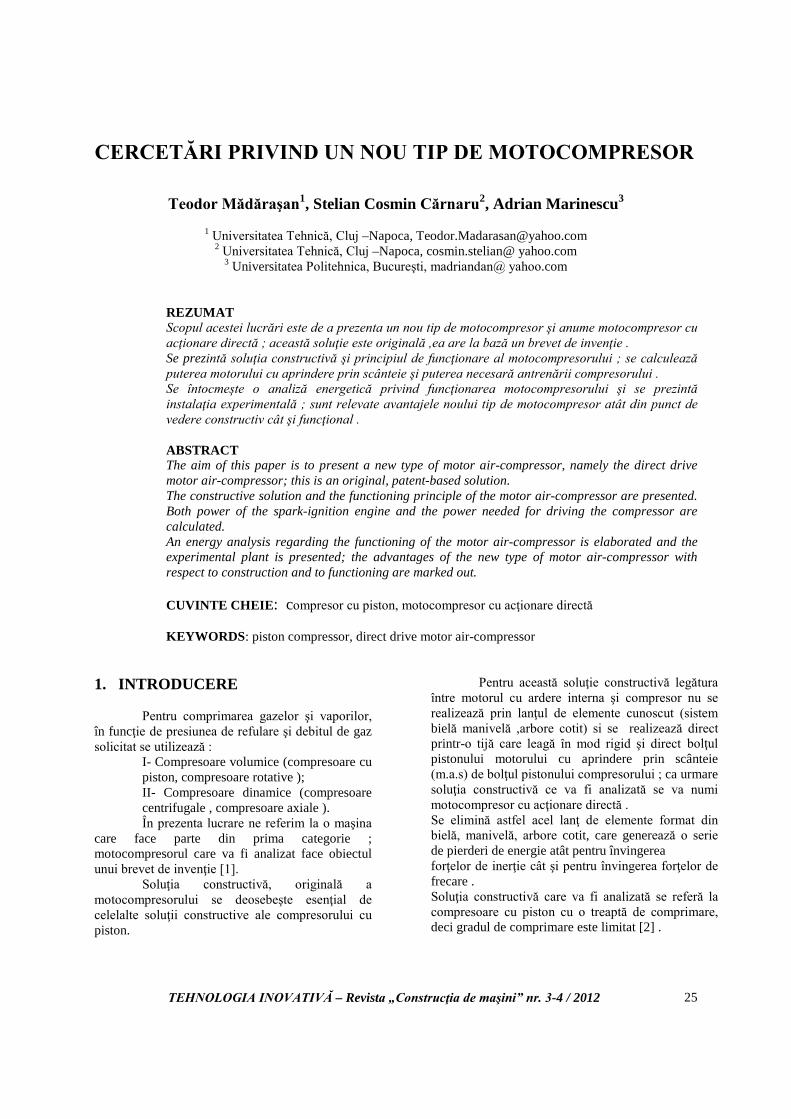
TEHNOLOGIA INOVATIVĂ – Revista „Construcţia de maşini” nr. 3-4 / 2012
25
CERCETĂRI PRIVIND UN NOU TIP DE MOTOCOMPRESOR
Teodor Mădăraşan1, Stelian Cosmin Cărnaru2, Adrian Marinescu3
1 Universitatea Tehnică, Cluj –Napoca, [email protected] 2 Universitatea Tehnică, Cluj –Napoca, cosmin.stelian@ yahoo.com
3 Universitatea Politehnica, Bucureşti, madriandan@ yahoo.com
REZUMAT Scopul acestei lucrări este de a prezenta un nou tip de motocompresor şi anume motocompresor cu acţionare directă ; această soluţie este originală ,ea are la bază un brevet de invenţie . Se prezintă soluţia constructivă şi principiul de funcţionare al motocompresorului ; se calculează puterea motorului cu aprindere prin scânteie şi puterea necesară antrenării compresorului . Se întocmeşte o analiză energetică privind funcţionarea motocompresorului şi se prezintă instalaţia experimentală ; sunt relevate avantajele noului tip de motocompresor atât din punct de vedere constructiv cât şi funcţional . ABSTRACT The aim of this paper is to present a new type of motor air-compressor, namely the direct drive motor air-compressor; this is an original, patent-based solution. The constructive solution and the functioning principle of the motor air-compressor are presented. Both power of the spark-ignition engine and the power needed for driving the compressor are calculated. An energy analysis regarding the functioning of the motor air-compressor is elaborated and the experimental plant is presented; the advantages of the new type of motor air-compressor with respect to construction and to functioning are marked out. CUVINTE CHEIE: compresor cu piston, motocompresor cu acţionare directă
KEYWORDS: piston compressor, direct drive motor air-compressor
1. INTRODUCERE
Pentru comprimarea gazelor şi vaporilor, în funcţie de presiunea de refulare şi debitul de gaz solicitat se utilizează :
I- Compresoare volumice (compresoare cu piston, compresoare rotative ); II- Compresoare dinamice (compresoare centrifugale , compresoare axiale ). În prezenta lucrare ne referim la o maşina
care face parte din prima categorie ; motocompresorul care va fi analizat face obiectul unui brevet de invenţie [1].
Soluţia constructivă, originală a motocompresorului se deosebeşte esenţial de celelalte soluţii constructive ale compresorului cu piston.
Pentru această soluţie constructivă legătura între motorul cu ardere interna şi compresor nu se realizează prin lanţul de elemente cunoscut (sistem bielă manivelă ,arbore cotit) si se realizează direct printr-o tijă care leagă în mod rigid şi direct bolţul pistonului motorului cu aprindere prin scânteie (m.a.s) de bolţul pistonului compresorului ; ca urmare soluţia constructivă ce va fi analizată se va numi motocompresor cu acţionare directă . Se elimină astfel acel lanţ de elemente format din bielă, manivelă, arbore cotit, care generează o serie de pierderi de energie atât pentru învingerea forţelor de inerţie cât şi pentru învingerea forţelor de frecare . Soluţia constructivă care va fi analizată se referă la compresoare cu piston cu o treaptă de comprimare, deci gradul de comprimare este limitat [2] .
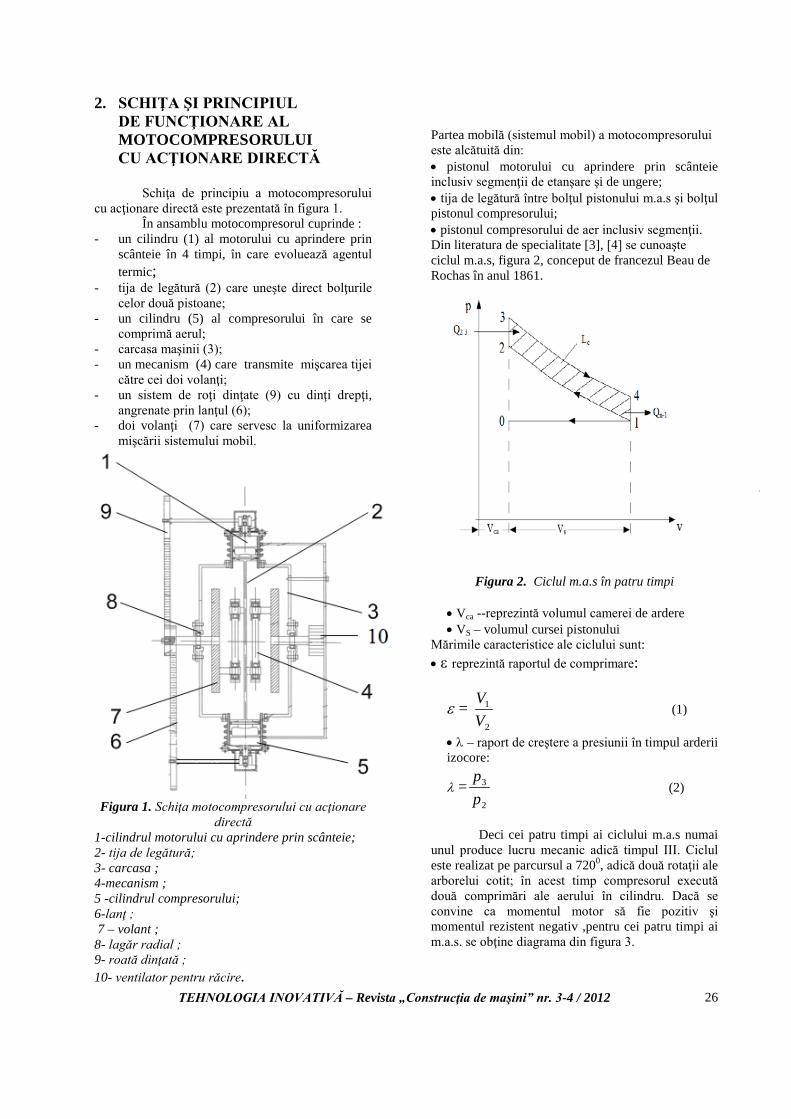
TEHNOLOGIA INOVATIVĂ – Revista „Construcţia de maşini” nr. 3-4 / 2012
26
2. SCHIŢA ŞI PRINCIPIUL DE FUNCŢIONARE AL MOTOCOMPRESORULUI CU ACŢIONARE DIRECTĂ
Schiţa de principiu a motocompresorului cu acţionare directă este prezentată în figura 1.
În ansamblu motocompresorul cuprinde : - un cilindru (1) al motorului cu aprindere prin
scânteie în 4 timpi, în care evoluează agentul termic;
- tija de legătură (2) care uneşte direct bolţurile celor două pistoane;
- un cilindru (5) al compresorului în care se comprimă aerul;
- carcasa maşinii (3); - un mecanism (4) care transmite mişcarea tijei
către cei doi volanţi; - un sistem de roţi dinţate (9) cu dinţi drepţi,
angrenate prin lanţul (6); - doi volanţi (7) care servesc la uniformizarea
mişcării sistemului mobil.
Figura 1. Schiţa motocompresorului cu acţionare
directă 1-cilindrul motorului cu aprindere prin scânteie; 2- tija de legătură; 3- carcasa ; 4-mecanism ; 5 -cilindrul compresorului; 6-lanţ ; 7 – volant ; 8- lagăr radial ; 9- roată dinţată ; 10- ventilator pentru răcire.
Partea mobilă (sistemul mobil) a motocompresorului este alcătuită din: • pistonul motorului cu aprindere prin scânteie inclusiv segmenţii de etanşare şi de ungere; • tija de legătură între bolţul pistonului m.a.s şi bolţul pistonul compresorului; • pistonul compresorului de aer inclusiv segmenţii. Din literatura de specialitate [3], [4] se cunoaşte ciclul m.a.s, figura 2, conceput de francezul Beau de Rochas în anul 1861.
Figura 2. Ciclul m.a.s în patru timpi
• Vca --reprezintă volumul camerei de ardere • VS – volumul cursei pistonului
Mărimile caracteristice ale ciclului sunt: • ε reprezintă raportul de comprimare:
ε = 2
1
VV
(1)
• λ – raport de creştere a presiunii în timpul arderii izocore:
λ =2
3
pp
(2)
Deci cei patru timpi ai ciclului m.a.s numai
unul produce lucru mecanic adică timpul III. Ciclul este realizat pe parcursul a 7200, adică două rotaţii ale arborelui cotit; în acest timp compresorul execută două comprimări ale aerului în cilindru. Dacă se convine ca momentul motor să fie pozitiv şi momentul rezistent negativ ,pentru cei patru timpi ai m.a.s. se obţine diagrama din figura 3.
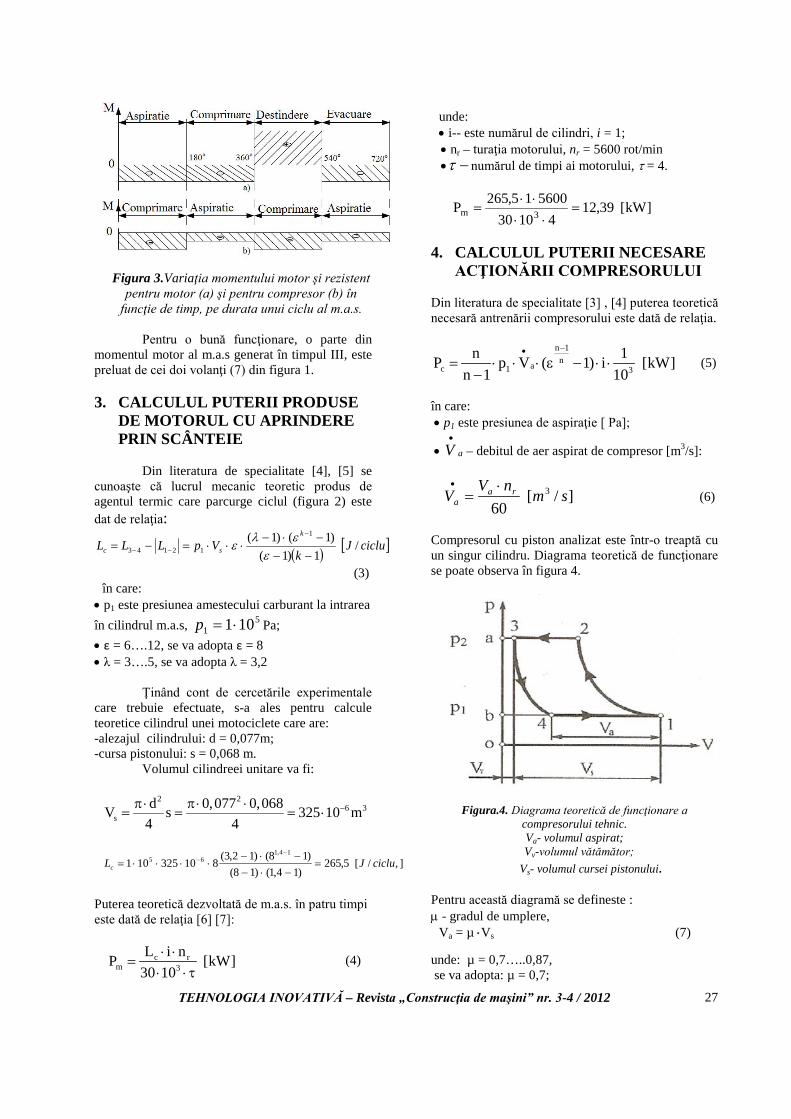
TEHNOLOGIA INOVATIVĂ – Revista „Construcţia de maşini” nr. 3-4 / 2012
27
Figura 3.Variaţia momentului motor şi rezistent
pentru motor (a) şi pentru compresor (b) în funcţie de timp, pe durata unui ciclu al m.a.s.
Pentru o bună funcţionare, o parte din
momentul motor al m.a.s generat în timpul III, este preluat de cei doi volanţi (7) din figura 1. 3. CALCULUL PUTERII PRODUSE DE MOTORUL CU APRINDERE PRIN SCÂNTEIE
Din literatura de specialitate [4], [5] se
cunoaşte că lucrul mecanic teoretic produs de agentul termic care parcurge ciclul (figura 2) este dat de relaţia:
( ) [ ]cicluJk
VpLLLk
sc /1)1(
)1()1( 1
12143 −−−⋅−
⋅⋅⋅=−=−
−− εελ
ε
(3) în care:
• p1 este presiunea amestecului carburant la intrarea în cilindrul m.a.s, 5
1 101⋅=p Pa; • ε = 6….12, se va adopta ε = 8 • λ = 3….5, se va adopta λ = 3,2
Ţinând cont de cercetările experimentale
care trebuie efectuate, s-a ales pentru calcule teoretice cilindrul unei motociclete care are: -alezajul cilindrului: d = 0,077m; -cursa pistonului: s = 0,068 m.
Volumul cilindreei unitare va fi:
2 26 3
sd 0,077 0,068V s 325 10 m
4 4−π ⋅ π ⋅ ⋅
= = = ⋅
],/[5,265)14,1()18(
)18()12,3(81032510114,1
65 cicluJLc =−⋅−−⋅−
⋅⋅⋅⋅=−
−
Puterea teoretică dezvoltată de m.a.s. în patru timpi este dată de relaţia [6] [7]:
c rm 3
L i nP [kW]30 10
⋅ ⋅=
⋅ ⋅ τ (4)
unde: • i-- este numărul de cilindri, i = 1;
• nr – turaţia motorului, nr = 5600 rot/min • −τ numărul de timpi ai motorului, τ = 4.
]kW[39,1241030
560015,265P 3m =⋅⋅
⋅⋅=
4. CALCULUL PUTERII NECESARE ACŢIONĂRII COMPRESORULUI Din literatura de specialitate [3] , [4] puterea teoretică necesară antrenării compresorului este dată de relaţia.
n 1nac 1 3
n 1P p V ( 1) i [kW]n 1 10
−•
= ⋅ ⋅ ⋅ ε − ⋅ ⋅−
(5)
în care: • p1 este presiunea de aspiraţie [ Pa];
• aV•
– debitul de aer aspirat de compresor [m3/s]:
]/[60
3 smnV
V raa
⋅=
•
(6)
Compresorul cu piston analizat este într-o treaptă cu un singur cilindru. Diagrama teoretică de funcţionare se poate observa în figura 4.
Figura.4. Diagrama teoretică de funcţionare a
compresorului tehnic. Va- volumul aspirat;
Vv-volumul vătămător; Vs- volumul cursei pistonului.
Pentru această diagramă se defineste : µ - gradul de umplere,
Va = µ ⋅Vs (7)
unde: µ = 0,7…..0,87, se va adopta: µ = 0,7;

TEHNOLOGIA INOVATIVĂ – Revista „Construcţia de maşini” nr. 3-4 / 2012
28
Vs – volumul cursei pistonului, Vs=325⋅10 6− 3m
rotmVa /105,227103257,0 366 −− ⋅=⋅⋅=
nr = 5600 rot/min
]/[1023,211060
56005,227 336
.
smV a−−
•
⋅=⋅⋅
=
[ ]kWPc 49,510
1)17(1023,2110114,1
4,13
4,114,1
35 =⋅−⋅⋅⋅⋅⋅−
=−
−
Din calcule a rezultat că puterea teoretică a m.a.s este de 12,39 kW iar puterea de antrenare a compresorului este de 5,49 kW . Diferenţa de putere este consumată atât pentru învingerea forţelor de inerţie care apar în mişcarea rectilinie alternativă a sistemului mobil cât şi pentru învingerea forţelor de frecare care apar la sistemul mobil.
5. ÎNTOCMIREA UNEI ANALIZE
ENERGETICE PRIVIND FUNCŢIONAREA MOTOCOMPRESORULUI
Analiza se va efectua pe durata unui ciclu
al m.a.s în 4 timpi ,adică pentru două rotaţii ale arborelui cotit la motoarele obişnuite.
Dacă la lucrul mecanic produs de agentul termic care parcurge ciclul (Lc) se adaugă energia disponibilă (Ecin) atunci energia disponibilă (Ed) care va asigura funcţionarea motorului pe parcursul unui ciclu va fi:
cincd ELE += (8)
Energia cinetică a unui volant:
2
21 ω⋅⋅= jEcin (9)
Valoarea momentului de inerţie a unui volant:
02025,08
15,02,78
22
=⋅
=⋅
=Dmj
în care : m-masa volantului D-diametrul volantului
sradn /1,58660
5600260
2=
⋅⋅=
⋅⋅=
ππω
][2,34781,58602025,021 2 JEcin =⋅⋅=
Ţinând cont că avem doi volanţi: ][0,72222,347825,265 JEd =⋅+=
Această energie disponibilă pe durata unui ciclu de funcţionare al m.a.s va fi utilizată pentru :
A) Efectuarea a două procese de comprimare politropă a aerului în cilindrul compresorului (Ecomp);
B) Asigurarea deplasării sistemului mobil în mişcare rectilinie alternativă (4 timpi) adică pentru învingerea forţelor de frecare (Efr) şi de inerţie (Ein). infrcompd EEEE ++= (10)
Mărimea compE va fi egală cu de două ori lucrul mecanic necesar parcurgerii diagramei
)( dL compresorului tehnic [1].
]/[)1(1
1
diagrjVpn
nL nn
ad
−
−⋅⋅⋅−
= ε (11)
unde: • sa VV ⋅= µ (12) • n = 1,4
]/[59)71(105,22710114,1
4,1 4,114,1
65 diagrjLd =−⋅⋅⋅⋅⋅−
=−
−
[ ]jLE dcomp 1185922 =⋅==
Din calculele de mai sus se observă că
Lc>2Ld respectiv Ed>Ecomp+Efr+Ein , fapt ce asigură o bună funcţionare a compresorului. După efectuarea măsurătorilor experimentale se vor stabili puterea efectivă a m.a.s. şi a compresorului şi se va stabili un bilanţ energetic al acestei instalaţii. 6. INSTALAŢIA EXPERIMENTALĂ
Soluţia constructivă propusă cuprinde un singur cilindru pentru comprimarea aerului .
Dacă acest ciclu era încadrat într-o schemă clasică ar fi fost necesare : de la bolţul pistonului compresorului un mecanism bielă manivelă arbore cotit , cuplajul către m.a.s .
La m.a.s ar fi fost necesare arborele cotit ,sistem bielă manivelă până la bolţul pistonului m.a.s. Evident acest lanţ de elemente constructive pentru care se consumă materiale şi manopera dispare în cazul motocompresorului cu acţionare directă .
Deasemenea se reduce consumul de energie necesar pentru deplasarea acestor elemente constructive ; soluţia expusă este simplă şi viabilă.
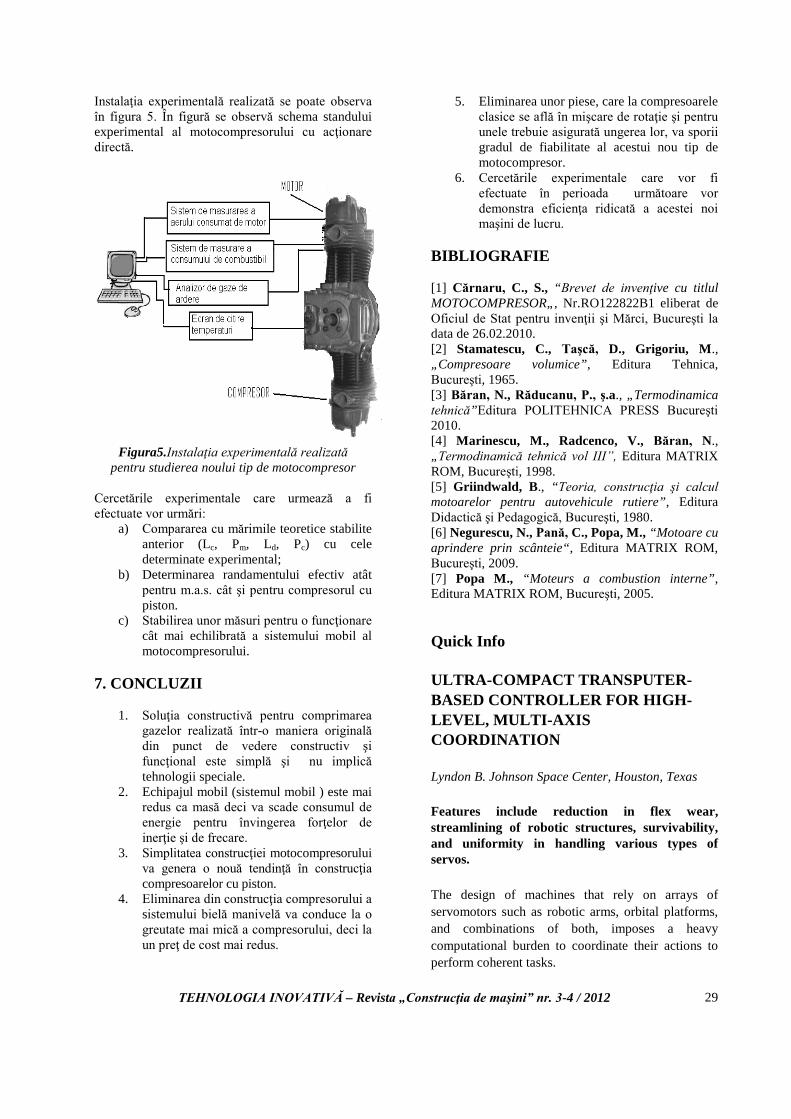
TEHNOLOGIA INOVATIVĂ – Revista „Construcţia de maşini” nr. 3-4 / 2012
29
Instalaţia experimentală realizată se poate observa în figura 5. În figură se observă schema standului experimental al motocompresorului cu acţionare directă.
Figura5.Instalaţia experimentală realizată
pentru studierea noului tip de motocompresor Cercetările experimentale care urmează a fi efectuate vor urmări:
a) Compararea cu mărimile teoretice stabilite anterior (Lc, Pm, Ld, Pc) cu cele determinate experimental;
b) Determinarea randamentului efectiv atât pentru m.a.s. cât şi pentru compresorul cu piston.
c) Stabilirea unor măsuri pentru o funcţionare cât mai echilibrată a sistemului mobil al motocompresorului.
7. CONCLUZII
1. Soluţia constructivă pentru comprimarea gazelor realizată într-o maniera originală din punct de vedere constructiv şi funcţional este simplă şi nu implică tehnologii speciale.
2. Echipajul mobil (sistemul mobil ) este mai redus ca masă deci va scade consumul de energie pentru învingerea forţelor de inerţie şi de frecare.
3. Simplitatea construcţiei motocompresorului va genera o nouă tendinţă în construcţia compresoarelor cu piston.
4. Eliminarea din construcţia compresorului a sistemului bielă manivelă va conduce la o greutate mai mică a compresorului, deci la un preţ de cost mai redus.
5. Eliminarea unor piese, care la compresoarele clasice se află în mişcare de rotaţie şi pentru unele trebuie asigurată ungerea lor, va sporii gradul de fiabilitate al acestui nou tip de motocompresor.
6. Cercetările experimentale care vor fi efectuate în perioada următoare vor demonstra eficienţa ridicată a acestei noi maşini de lucru.
BIBLIOGRAFIE [1] Cărnaru, C., S., “Brevet de invenţive cu titlul MOTOCOMPRESOR„, Nr.RO122822B1 eliberat de Oficiul de Stat pentru invenţii şi Mărci, Bucureşti la data de 26.02.2010. [2] Stamatescu, C., Taşcă, D., Grigoriu, M., „Compresoare volumice”, Editura Tehnica, Bucureşti, 1965. [3] Băran, N., Răducanu, P., ş.a., „Termodinamica tehnică”Editura POLITEHNICA PRESS Bucureşti 2010. [4] Marinescu, M., Radcenco, V., Băran, N., „Termodinamică tehnică vol III”, Editura MATRIX ROM, Bucureşti, 1998. [5] Griindwald, B., “Teoria, construcţia şi calcul motoarelor pentru autovehicule rutiere”, Editura Didactică şi Pedagogică, Bucureşti, 1980. [6] Negurescu, N., Pană, C., Popa, M., “Motoare cu aprindere prin scânteie“, Editura MATRIX ROM, Bucureşti, 2009. [7] Popa M., “Moteurs a combustion interne”, Editura MATRIX ROM, Bucureşti, 2005. Quick Info
ULTRA-COMPACT TRANSPUTER-BASED CONTROLLER FOR HIGH-LEVEL, MULTI-AXIS COORDINATION
Lyndon B. Johnson Space Center, Houston, Texas
Features include reduction in flex wear, streamlining of robotic structures, survivability, and uniformity in handling various types of servos.
The design of machines that rely on arrays of servomotors such as robotic arms, orbital platforms, and combinations of both, imposes a heavy computational burden to coordinate their actions to perform coherent tasks.
TEHNOLOGIA INOVATIVĂ – Revista „Construcţia de maşini” nr. 3-4 / 2012
30
For example, the robotic equivalent of a person tracing a straight line in space requires enormously complex kinematics calculations, and complexity increases with the number of servo nodes. The conventional method of executing these calculations is with a PC-style set of electronics including a powerful CPU (central processing unit) microprocessor, operating system, power supply, a number of peripherals, connectors to support each servo node, and a web of startopology wiring across the machine (including flexing joints), generally exceeding 100 conductors. In industry, the most common implementation is one or more dedicated PC cards mounted on an ISA (Industry Standard Architecture), PCI (Peripheral Component Interconnect), or VME bus. These cards provide the I/O connectors and supplement the CPU to execute the massive kinematic calculations in real time.
(source: http://www.techbriefs.com/component/content/article/15469)
MAGNETICALLY ACTUATED SEAL
Marshall Space Flight Center, Alabama
Design replaces existing pressure-actuated lift-off seals in turbopumps and eliminates low pressure drains, thereby increasing overall efficiency.
This invention is a magnetically actuated seal in which either a single electromagnet, or multiple electromagnets, are used to control the seal’s position. This system can either be an open/close type of system or an actively controlled system.
(source: http://www.techbriefs.com/component/content/article/15470)
REGOLITH ADVANCED SURFACE SYSTEMS OPERATIONS ROBOT EXCAVATOR John F. Kennedy Space Center, Florida This design enables new ways of excavating for resources on planetary bodies. The Regolith Advanced Surface Systems Operations Robot (RASSOR) excavator robot is a teleoperated mobility platform with a space regolith excavation capability. This more compact, lightweight design (<50 kg) has counter- rotating bucket drums, which results in a net-zero reaction horizontal force due to the self-cancelation of the symmetrical, equal but opposing, digging forces. (source: http://www.techbriefs.com/component/content/article/15471) HYBRID ELECTROSTATIC/ FLEXTENSIONAL MIR ROR FOR LIGHTWEIGHT, LARGE-APERTURE, AND CR YOGENIC SPACE TELESCOPES Marshall Space Flight Center, Alabama A much lighter-weight structure with higher correction range uses polymer-based membrane mirror technology. A lightweight, cryogenically capable, scalable, deformable mirror has been developed for space telescopes. This innovation makes use of polymer-based membrane mirror technology to enable large-aperture mirrors that can be easily launched and deployed. The key component of this innovation is a lightweight, large-stroke, cryogenic actuator array that combines the high degree of mirror figure control needed with a large actuator influence function. The latter aspect of the innovation allows membrane mirror figure correction with a relatively low actuator density, preserving the lightweight attributes of the system. (source: http://www.techbriefs.com/component/content/article/15472)
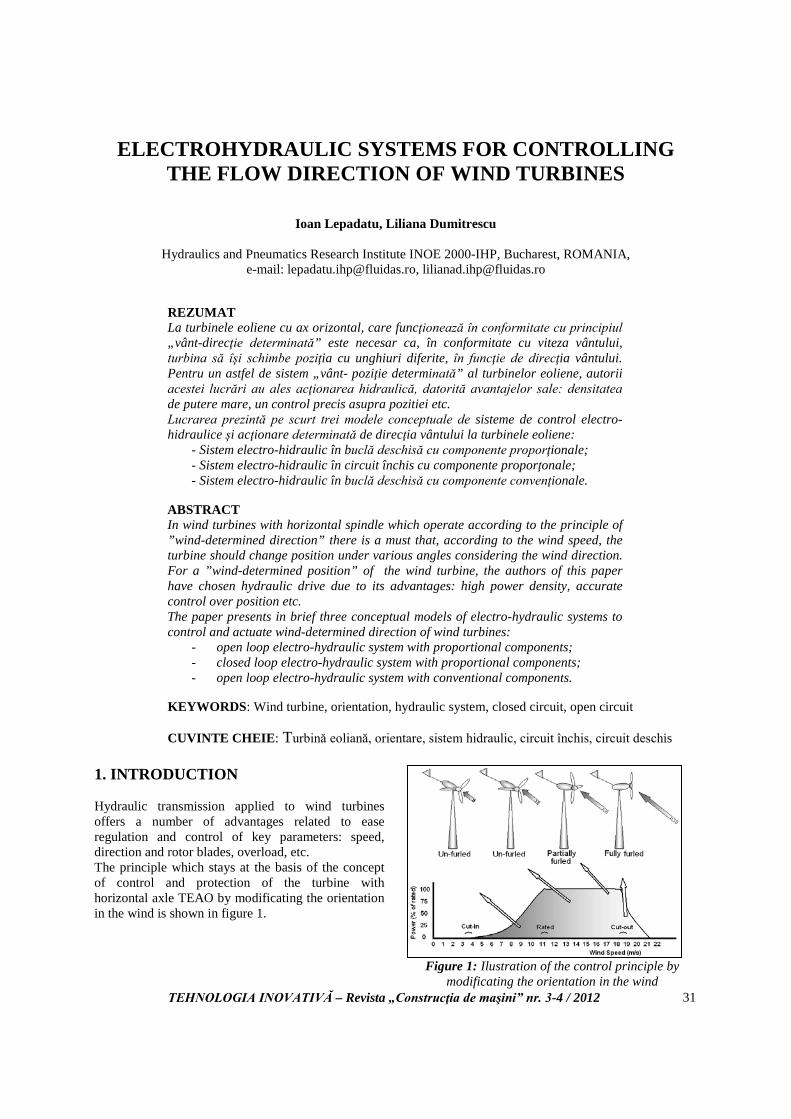
TEHNOLOGIA INOVATIVĂ – Revista „Construcţia de maşini” nr. 3-4 / 2012
31
ELECTROHYDRAULIC SYSTEMS FOR CONTROLLING THE FLOW DIRECTION OF WIND TURBINES
Ioan Lepadatu, Liliana Dumitrescu
Hydraulics and Pneumatics Research Institute INOE 2000-IHP, Bucharest, ROMANIA, e-mail: [email protected], [email protected]
REZUMAT La turbinele eoliene cu ax orizontal, care funcţionează în conformitate cu principiul „vânt-direcţie determinată” este necesar ca, în conformitate cu viteza vântului, turbina să îşi schimbe poziţia cu unghiuri diferite, în funcţie de direcţia vântului. Pentru un astfel de sistem „vânt- poziţie determinată” al turbinelor eoliene, autorii acestei lucrări au ales acţionarea hidraulică, datorită avantajelor sale: densitatea de putere mare, un control precis asupra pozitiei etc. Lucrarea prezintă pe scurt trei modele conceptuale de sisteme de control electro-hidraulice şi acţionare determinată de direcţia vântului la turbinele eoliene:
- Sistem electro-hidraulic în buclă deschisă cu componente proporţionale; - Sistem electro-hidraulic în circuit închis cu componente proporţonale; - Sistem electro-hidraulic în buclă deschisă cu componente convenţionale.
ABSTRACT In wind turbines with horizontal spindle which operate according to the principle of ”wind-determined direction” there is a must that, according to the wind speed, the turbine should change position under various angles considering the wind direction. For a ”wind-determined position” of the wind turbine, the authors of this paper have chosen hydraulic drive due to its advantages: high power density, accurate control over position etc. The paper presents in brief three conceptual models of electro-hydraulic systems to control and actuate wind-determined direction of wind turbines:
- open loop electro-hydraulic system with proportional components; - closed loop electro-hydraulic system with proportional components; - open loop electro-hydraulic system with conventional components.
KEYWORDS: Wind turbine, orientation, hydraulic system, closed circuit, open circuit CUVINTE CHEIE: Turbină eoliană, orientare, sistem hidraulic, circuit închis, circuit deschis
1. INTRODUCTION Hydraulic transmission applied to wind turbines offers a number of advantages related to ease regulation and control of key parameters: speed, direction and rotor blades, overload, etc. The principle which stays at the basis of the concept of control and protection of the turbine with horizontal axle TEAO by modificating the orientation in the wind is shown in figure 1.
Figure 1: Ilustration of the control principle by
modificating the orientation in the wind
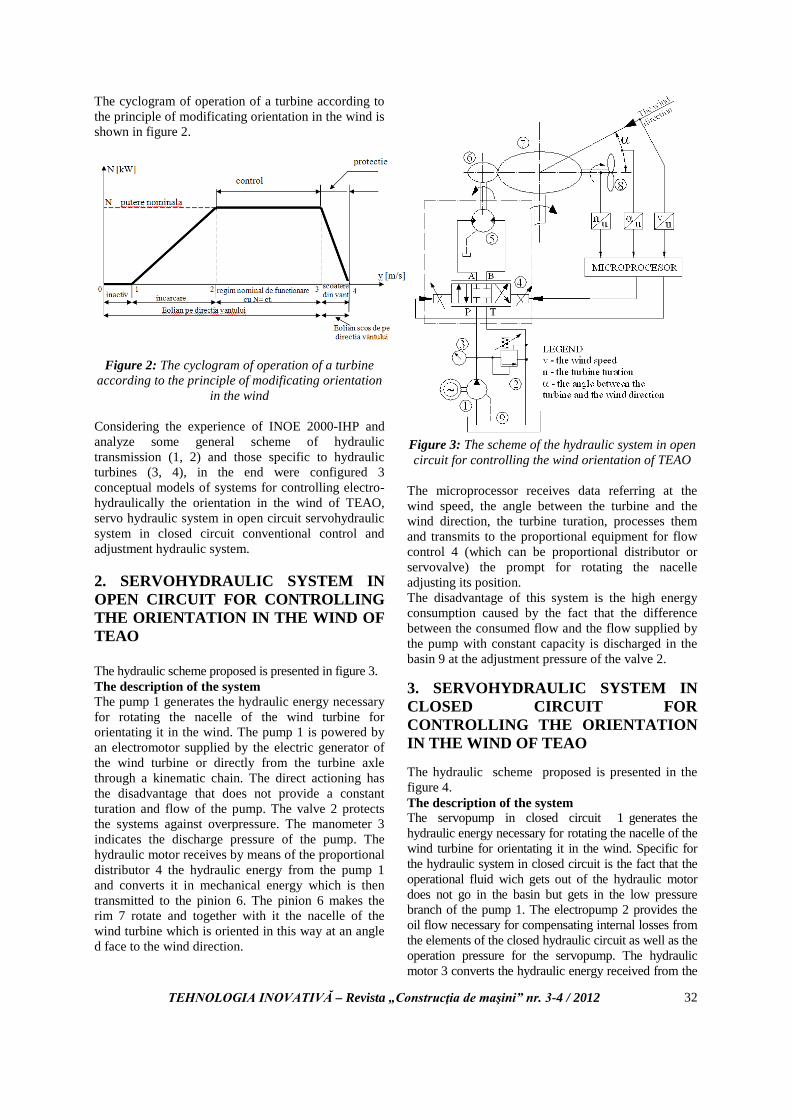
TEHNOLOGIA INOVATIVĂ – Revista „Construcţia de maşini” nr. 3-4 / 2012
32
The cyclogram of operation of a turbine according to the principle of modificating orientation in the wind is shown in figure 2.
Figure 2: The cyclogram of operation of a turbine according to the principle of modificating orientation
in the wind
Considering the experience of INOE 2000-IHP and analyze some general scheme of hydraulic transmission (1, 2) and those specific to hydraulic turbines (3, 4), in the end were configured 3 conceptual models of systems for controlling electro-hydraulically the orientation in the wind of TEAO, servo hydraulic system in open circuit servohydraulic system in closed circuit conventional control and adjustment hydraulic system. 2. SERVOHYDRAULIC SYSTEM IN OPEN CIRCUIT FOR CONTROLLING THE ORIENTATION IN THE WIND OF TEAO The hydraulic scheme proposed is presented in figure 3. The description of the system The pump 1 generates the hydraulic energy necessary for rotating the nacelle of the wind turbine for orientating it in the wind. The pump 1 is powered by an electromotor supplied by the electric generator of the wind turbine or directly from the turbine axle through a kinematic chain. The direct actioning has the disadvantage that does not provide a constant turation and flow of the pump. The valve 2 protects the systems against overpressure. The manometer 3 indicates the discharge pressure of the pump. The hydraulic motor receives by means of the proportional distributor 4 the hydraulic energy from the pump 1 and converts it in mechanical energy which is then transmitted to the pinion 6. The pinion 6 makes the rim 7 rotate and together with it the nacelle of the wind turbine which is oriented in this way at an angle d face to the wind direction.
Figure 3: The scheme of the hydraulic system in open circuit for controlling the wind orientation of TEAO
The microprocessor receives data referring at the wind speed, the angle between the turbine and the wind direction, the turbine turation, processes them and transmits to the proportional equipment for flow control 4 (which can be proportional distributor or servovalve) the prompt for rotating the nacelle adjusting its position. The disadvantage of this system is the high energy consumption caused by the fact that the difference between the consumed flow and the flow supplied by the pump with constant capacity is discharged in the basin 9 at the adjustment pressure of the valve 2. 3. SERVOHYDRAULIC SYSTEM IN CLOSED CIRCUIT FOR CONTROLLING THE ORIENTATION IN THE WIND OF TEAO The hydraulic scheme proposed is presented in the figure 4. The description of the system The servopump in closed circuit 1 generates the hydraulic energy necessary for rotating the nacelle of the wind turbine for orientating it in the wind. Specific for the hydraulic system in closed circuit is the fact that the operational fluid wich gets out of the hydraulic motor does not go in the basin but gets in the low pressure branch of the pump 1. The electropump 2 provides the oil flow necessary for compensating internal losses from the elements of the closed hydraulic circuit as well as the operation pressure for the servopump. The hydraulic motor 3 converts the hydraulic energy received from the

TEHNOLOGIA INOVATIVĂ – Revista „Construcţia de maşini” nr. 3-4 / 2012
33
pump 1 into mechanical energy which is then transmitted to the pinion 6.
Figure 4: The scheme of the hydraulic system in closed circuit for controlling the orientation in the
windofTEAO
The pinion makes the rim 7 rotate and this orientates the wind turbine at an α angle from the wind direction. The angular value d between the turbine and the wind direction is fixed by the microprocessor on the basis of the data received from the system transducers and for its realization the microprocessor gives a prompt to the device 5 (which can be proportional distributor or servovalve) for correcting the turbine position. The hydraulic apparatus 4 provide the operation of the closed hydraulic circuit between the pump and the motor by accomplishing the following tasks: - compensate the internal losses from the circuit - supplies the circuit with fresh oil do not allow overpressures in the operational circuits - provide the operation pressure - necessary for the servopump This system is more expensive than the one in open circuit because it has in its structure more devices which are more complex but in the same time is more advantageous than the previous one due to the fact that the main pump 1 send in the system exactly the amount of oil necessary for rotating the nacelle.
4. CONVENTIONAL HYDRAULIC SYSTEM FOR CONTROL AND ADJUSTMENT OF THE ORIENTATION IN THE WIND OF THE TURBINE The hydraulic scheme proposed is presented in the figure 5. The description of the system The electropump 1 generates the hydraulic energy necessary for rotating the nacelle of the turbine for orietating it in the wind. The hydraulic motor converts the hydraulic energy received from the pump 1 into mechanical energy which is then transmitted to the pinion 6 and this makes the jegged rim 7 rotate and in the same time with it the nacelle of the wind turbine which is oriented at an d angle from the wind direction. The distributor 3 inverts the direction of rotation of the hydraulic motor 6 and of the nacelle. The valve 4 limitates the maximum pressure in the hydraulic circuit and the manometer 5 displays the operational pressure. On the basis of the data from the system regarding the wind speed the microprocessor fixes the minimum and maximum value of the angle d between the wind direction and the turbine. When the nacelle reaches αmax the microprocessor gives prompt to the distributor 4 and to the electromotor 1 for positioning the nacelle at αmin.
Figure 5: The scheme of the conventional hydraulic system of control and adjustment of the orientation in
the wind of the turbine
TEHNOLOGIA INOVATIVĂ – Revista „Construcţia de maşini” nr. 3-4 / 2012
34
Comparing this system with the previous ones, presented above at point 1 and 2, we can say that this has a more simplified structure, is more resistent and cheaper and with a lower energy consumption. The low energetic consumption is due to the fact that the system operates intermitently starting to work for adjusting the position of the turbine only when this exceeds the maximum angle admitted from the wind direction. In what regard the dynamic performances and the positioning precision, these are inferior comparing them with the performances of the other two systems. CONCLUSIONS Were found 3 solutions for controlling electro hydraulically the orientation in the wind of TEAO. The proposed solutions take into account the researches (5,6) and systems realised in INOE 2000-IHP too, in the field of optimised linear and rotary hydraulic transmisions: - The servohydraulic system in open circuit realized with proportional elements was described in detail at point 1. It has satisfactory dynamic performances. It realizes a precise positioning of the turbine and it is of an average complexity but is disadvantageous in what regards the energetic consumption. - The servohydraulic system in closed circuit realized with proportional elements was described in detail at point 2. It is as performant as the previous one but is more expensive because has a more complex structure including more devices. It is more advantageous in what regards the energetic consumption. - The conventional hydraulic system for control and adjustment realized with classical hydraulic devices was described in detail at point 3. It has a simplified structure, is more resistant and cheaper and with a lower energetic consumption. But it is less performant than the previous ones. The selection of one or another of the above presented solutions will be made depending on the advantages and disadvantages of each one.
REFERENCES: [1]. Vasiliu, N., Catana, I., „Transmisii hidraulice si
electrohidraulice”. Volumul I Masini hidraulice volumice. Editura Tehnica Bucuresti, 1988.
[2]. Vasiliu, D., Vasiliu, N., Catana, I., „Transmisii hidraulice si electrohidraulice” Volumul II - Reglarea masinilor hidraulice volumice. Editura Tehnica, Bucuresti, 1997
[3]. Burton, T., Sharpe, D., Jenkins, N. and Bossanyi, E. A., „Wind Energy Handbook”, John Willes & Sons, Ltd, NY; 2001.
[4]. Bossanyi, E. A., „The Design of Closed-long Controllers for Wind Turbines, Wind Energy” vol. 3, 2000
[5]. Guţă, D. D. I., Popescu T. C., Dumitrescu, C., „Optimization of hydrostatic transmissions by means of virtual instrumentation technique”, Conference on Advanced Topics in Optoelectronics and and Nanotechnologies,, Proceedings of SPIE-The International Society for Optical Engineering, vol. 7821, article number 782129, DOI: 10.1117/12.881904, Constanţa, România, 26-29 Aug. 2010
[6]. Dumitrescu, C., Rădoi, R., Cristescu, C., „Synchronous actuation of linear and rotary motors” Hidraulica, vol. 1, 2010, pp. 57-64. ISSN 1453-7303.
TEHNOLOGIA INOVATIVĂ – Revista „Construcţia de maşini” nr. 3-4 / 2012
35
MODERN TECHNOLOGIES OF MAINTENANCE, REPAIR AND TESTING FOR HYDRAULIC EQUIPMENTS
Cătălin Dumitrescu, Corneliu Cristescu Hydraulics and Pneumatics Research Institute INOE 2000-IHP, Bucharest, ROMANIA,
e-mail: [email protected] , [email protected]
REZUMAT Articolul prezintă unele consideraţii privind activitatea de întreţinere a echipamentelor şi sistemelor hidraulice, inclusiv cele utilizate pe standurile de probare ale aparaturii hidraulice reparate. Este prezentat de asemenea un studiu de caz, în care se arată că după reparare, este necesară efectuarea de probe pe stand, pentru verificarea şi atestarea performanţelor după remediere şi reglare, şi sunt prezentate rezultatele obţinute. ABSTRACT The paper presents certain considerations regarding the activity of maintenance of the fluid power equipments and systems, including the equipment required for performing tests forchecking and retesting the performance levels of the fluid power equipments, after they have been subjected to improvements or repairs. It is also presented a case study, where, after an important technical intervention at a hydrostatic pump, it was required to be performed tests on the stand, both for checking and attesting performances after repair and for its adjustment, followed by the presentation of the scientific results achieved.
KEYWORDS: maintenance, fluid power, hydraulics, hydraulic equipments, testing CUVINTE CHEIE: întreţinere, acţionări, hidraulica, echipamente hidraulice, testare
1. INTRODUCTION
The use in optimum conditions of the fluid power equipments depends by a lot of the right selection and adjustment of the hydraulic components, especially of the safety elements [1]. The maintenance activities play a significant role, together with a hydraulic fluid with a low content of impurities as well. The fluid filtering fineness used at a hydraulic installation it is essential and imposed by the hydraulic element requiring the lowest filtering class, for ex. 0-1-5 NAS Classes), [2]. At the running of the hydraulic equipment it is required to detect the flaws from their very initial stage, before causing malfunctions to the equipment, sometimes this meaning even during the maintenance, revision and repair operations.
The maintenance encloses operations of revision, inspection, supply, lubrication and periodical interventions, performed in order to prolong the lifespan of the hydraulic equipment.
The maintenance is a planned activity, which takes
into account the operational mode of the equipment, the stress level and the environmental conditions.
The maintenance operations include general works applied to all the hydraulic installations and, also, specific works, for the installation, in general, or different component of interest. The volume and frequency of the maintenance works depend on the requirements regarding reliability, being determined by the degree of failure admitted for various utilizations. Generally, in maintenance works, an important role is played by the check-up of the oil temperature and level of the contents of impurities.
The overheating and high level of noise, generated by certain component parts, is obvious signs that it is necessary to make a revision or even some general repair. The revision and repair activities sometimes lead to important interventions upon the hydraulic components, implying the replacement of certain parts or elements from the general structure,
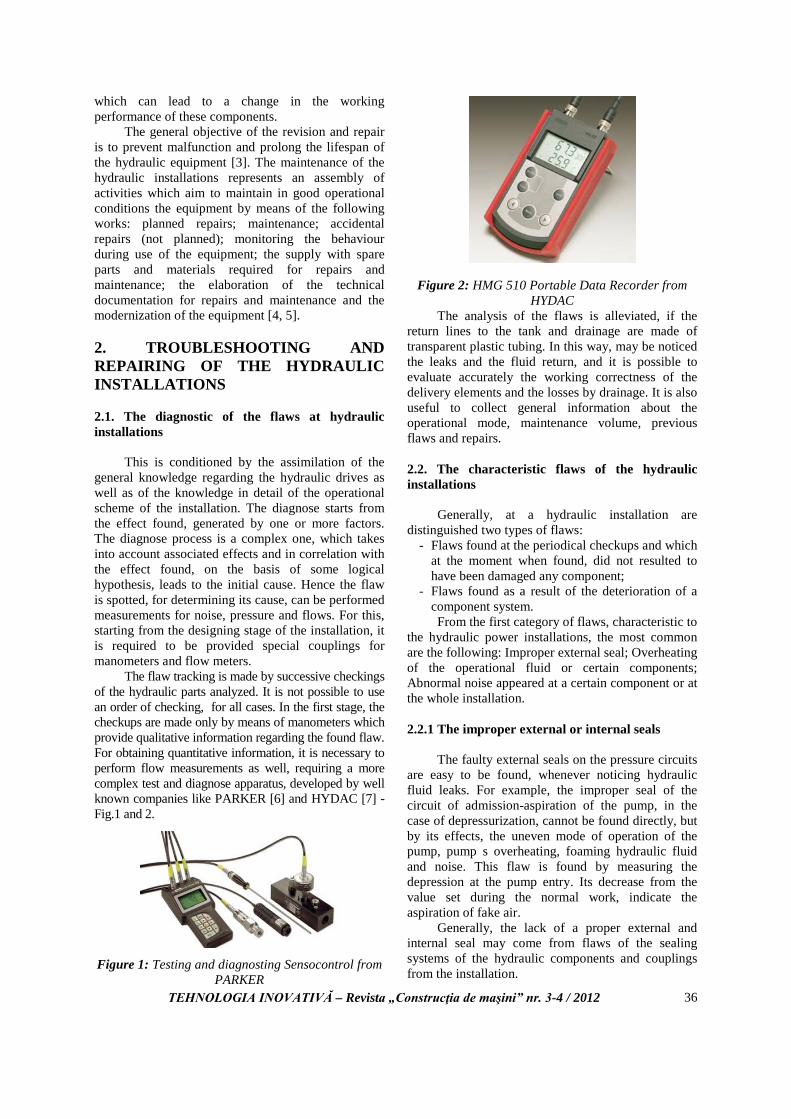
TEHNOLOGIA INOVATIVĂ – Revista „Construcţia de maşini” nr. 3-4 / 2012
36
which can lead to a change in the working performance of these components.
The general objective of the revision and repair is to prevent malfunction and prolong the lifespan of the hydraulic equipment [3]. The maintenance of the hydraulic installations represents an assembly of activities which aim to maintain in good operational conditions the equipment by means of the following works: planned repairs; maintenance; accidental repairs (not planned); monitoring the behaviour during use of the equipment; the supply with spare parts and materials required for repairs and maintenance; the elaboration of the technical documentation for repairs and maintenance and the modernization of the equipment [4, 5]. 2. TROUBLESHOOTING AND REPAIRING OF THE HYDRAULIC INSTALLATIONS 2.1. The diagnostic of the flaws at hydraulic installations
This is conditioned by the assimilation of the general knowledge regarding the hydraulic drives as well as of the knowledge in detail of the operational scheme of the installation. The diagnose starts from the effect found, generated by one or more factors. The diagnose process is a complex one, which takes into account associated effects and in correlation with the effect found, on the basis of some logical hypothesis, leads to the initial cause. Hence the flaw is spotted, for determining its cause, can be performed measurements for noise, pressure and flows. For this, starting from the designing stage of the installation, it is required to be provided special couplings for manometers and flow meters.
The flaw tracking is made by successive checkings of the hydraulic parts analyzed. It is not possible to use an order of checking, for all cases. In the first stage, the checkups are made only by means of manometers which provide qualitative information regarding the found flaw. For obtaining quantitative information, it is necessary to perform flow measurements as well, requiring a more complex test and diagnose apparatus, developed by well known companies like PARKER [6] and HYDAC [7] - Fig.1 and 2.
Figure 1: Testing and diagnosting Sensocontrol from PARKER
Figure 2: HMG 510 Portable Data Recorder from HYDAC
The analysis of the flaws is alleviated, if the return lines to the tank and drainage are made of transparent plastic tubing. In this way, may be noticed the leaks and the fluid return, and it is possible to evaluate accurately the working correctness of the delivery elements and the losses by drainage. It is also useful to collect general information about the operational mode, maintenance volume, previous flaws and repairs. 2.2. The characteristic flaws of the hydraulic installations
Generally, at a hydraulic installation are distinguished two types of flaws:
- Flaws found at the periodical checkups and which at the moment when found, did not resulted to have been damaged any component;
- Flaws found as a result of the deterioration of a component system. From the first category of flaws, characteristic to
the hydraulic power installations, the most common are the following: Improper external seal; Overheating of the operational fluid or certain components; Abnormal noise appeared at a certain component or at the whole installation. 2.2.1 The improper external or internal seals
The faulty external seals on the pressure circuits are easy to be found, whenever noticing hydraulic fluid leaks. For example, the improper seal of the circuit of admission-aspiration of the pump, in the case of depressurization, cannot be found directly, but by its effects, the uneven mode of operation of the pump, pump s overheating, foaming hydraulic fluid and noise. This flaw is found by measuring the depression at the pump entry. Its decrease from the value set during the normal work, indicate the aspiration of fake air.
Generally, the lack of a proper external and internal seal may come from flaws of the sealing systems of the hydraulic components and couplings from the installation.
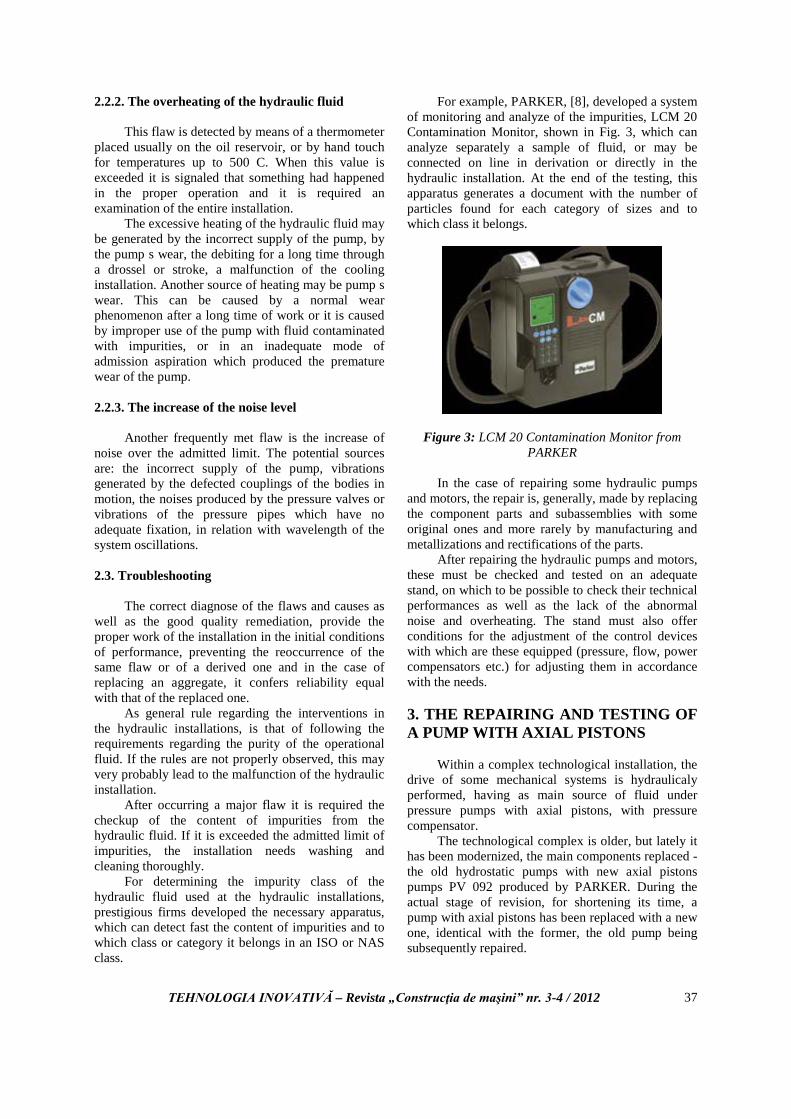
TEHNOLOGIA INOVATIVĂ – Revista „Construcţia de maşini” nr. 3-4 / 2012
37
2.2.2. The overheating of the hydraulic fluid
This flaw is detected by means of a thermometer placed usually on the oil reservoir, or by hand touch for temperatures up to 500 C. When this value is exceeded it is signaled that something had happened in the proper operation and it is required an examination of the entire installation.
The excessive heating of the hydraulic fluid may be generated by the incorrect supply of the pump, by the pump s wear, the debiting for a long time through a drossel or stroke, a malfunction of the cooling installation. Another source of heating may be pump s wear. This can be caused by a normal wear phenomenon after a long time of work or it is caused by improper use of the pump with fluid contaminated with impurities, or in an inadequate mode of admission aspiration which produced the premature wear of the pump. 2.2.3. The increase of the noise level
Another frequently met flaw is the increase of noise over the admitted limit. The potential sources are: the incorrect supply of the pump, vibrations generated by the defected couplings of the bodies in motion, the noises produced by the pressure valves or vibrations of the pressure pipes which have no adequate fixation, in relation with wavelength of the system oscillations. 2.3. Troubleshooting
The correct diagnose of the flaws and causes as well as the good quality remediation, provide the proper work of the installation in the initial conditions of performance, preventing the reoccurrence of the same flaw or of a derived one and in the case of replacing an aggregate, it confers reliability equal with that of the replaced one.
As general rule regarding the interventions in the hydraulic installations, is that of following the requirements regarding the purity of the operational fluid. If the rules are not properly observed, this may very probably lead to the malfunction of the hydraulic installation.
After occurring a major flaw it is required the checkup of the content of impurities from the hydraulic fluid. If it is exceeded the admitted limit of impurities, the installation needs washing and cleaning thoroughly.
For determining the impurity class of the hydraulic fluid used at the hydraulic installations, prestigious firms developed the necessary apparatus, which can detect fast the content of impurities and to which class or category it belongs in an ISO or NAS class.
For example, PARKER, [8], developed a system of monitoring and analyze of the impurities, LCM 20 Contamination Monitor, shown in Fig. 3, which can analyze separately a sample of fluid, or may be connected on line in derivation or directly in the hydraulic installation. At the end of the testing, this apparatus generates a document with the number of particles found for each category of sizes and to which class it belongs.
Figure 3: LCM 20 Contamination Monitor from PARKER
In the case of repairing some hydraulic pumps
and motors, the repair is, generally, made by replacing the component parts and subassemblies with some original ones and more rarely by manufacturing and metallizations and rectifications of the parts.
After repairing the hydraulic pumps and motors, these must be checked and tested on an adequate stand, on which to be possible to check their technical performances as well as the lack of the abnormal noise and overheating. The stand must also offer conditions for the adjustment of the control devices with which are these equipped (pressure, flow, power compensators etc.) for adjusting them in accordance with the needs. 3. THE REPAIRING AND TESTING OF A PUMP WITH AXIAL PISTONS
Within a complex technological installation, the drive of some mechanical systems is hydraulicaly performed, having as main source of fluid under pressure pumps with axial pistons, with pressure compensator.
The technological complex is older, but lately it has been modernized, the main components replaced - the old hydrostatic pumps with new axial pistons pumps PV 092 produced by PARKER. During the actual stage of revision, for shortening its time, a pump with axial pistons has been replaced with a new one, identical with the former, the old pump being subsequently repaired.

TEHNOLOGIA INOVATIVĂ – Revista „Construcţia de maşini” nr. 3-4 / 2012
38
After about a month of work, the new pump started to produce overheat and the noise during work became abnormal, fact which determined the responsible factors to disassemble it from the installation and replace the new pump with the old one which works acceptably. The client complained about the impossibility of adjusting the pressure level of the regulator-compensator and the displacement geometrical volume of the pump. The new pump was brought at INOE 2000-IHP, which undertook the action of diagnose, troubleshooting and testing. Because at the date when the pump was disassembled, the color of the fluid from the tank of the installation was dark, were taken samples of hydraulic oil and made tests for finding the impurities contained in the fluid, by means of a PARKER apparatus.
The result was surprising, cause the quantity and size of the impurities was from class 12 NAS 1638, equivalent with 22/21/18 to ISO 4406, which was far over the accepted limit of about 7 NAS Class. The oil it, also, contained water. According to the producer’s catalogue (PARKER), the filtering requirements for the hydraulic oil is in general of class 19/13 to ISO 4406, equivalent with class 8 NAS 1368 and for component parts with higher lifespan it is of 16/13 to ISO 4046, equivalent with class 5 NAS 1638. Taking into account these facts, it was very obvious that the conditions of work of the new pump were not appropriate, even dangerous for a new pump with minimum adjustments and little use. Therefore, was recommended, to the beneficiary company, to replace completely the hydraulic oil from tank. 3.1. The diagnose of the hydrostatic pump
The hydrostatic pump with axial pistons, which was investigated, is a pump with pressure compensator type PV 092, (fig. 4), manufactured by PARKER [6]. The main technical data of the pump are: pump code PV 092; type - with axial pistons; displacement 92 cm3/rot; max pressure 350 bar; nominal pressure 280 bar; max rev. 3000 rot/ min.
Figure 4: The hydrostatic pump with axial pistons
After dissembling and examining, were found the following: the component parts are not much damaged; the port plate is in a good condition; the pressure plate presents scratches of 5-10 μm, insignificant for work; the assembly pistons plate with bronze coating is good, but the crimping of a piston is deteriorated, cause a semicircular piece broke. Very probably the break produced cause of a material flaw (blows, inclusions) or the existence of certain internal tensions.
From the way, it looks the break occurred during disassembly cause neither the detached parts nor the adjacent parts have scratches or traces. The last motion from the crimping of the pistons are a bit bigger than normal, being possible to produce in certain conditions some noise. On the pump casing were noticed rust stains, probably cause there is water in the oil, but the consequences were not very serious.
At a careful examination, on the shaft cannot be seen any blue areas which to put into evidence the occurrence of a high temperature and an overheating of the pump. The bearing with cylindrical balls type NU NJ 2209 E YVL (di = 45 mm; De = 85 mm; l = 23 mm) has an axial loose of 0.8 mm, quasi-normal, which could generate some beats if the pump’s coupling cannot provide the coaxial connection between motor and pump. The interior ring of the bearing has an axial loose between it and the shut safety ring Seeger of 0.3 mm, which can generate some sort of banging during work. The pressure compensator was in good condition.
It was found that it was attempted to regulate pressure at a different level, but the method for performing that action was not properly known by the operator, thus being unable to perform it. 3.2. The repair of the detected flaws
After diagnosing the pump, for repairing the flaws, were proposed and performed the following operations for improving the pump condition:
1. Purchase a complete kit of axial pistons from the manufacturer and assemble it in the pump body;
2. Adjust decrease the axial loose of the interior ring of the ball bearing by inserting a flat ring which ensures a second support for the interior ring thicker with 0,2...0,3 mm;
3. If it is necessary, the ball bearing will be replaced with another with a lower loose between the rings;
4. The testing of the pump on the stand, watching carefully the eventual occurrence of over noise and overheating during work, as well as the possibilities of adjustment of the pressure compensator depending on the desired pressure value and the possibility of performing an adjustment variation of the pump’s displacement, depending on the pre-set flow.

TEHNOLOGIA INOVATIVĂ – Revista „Construcţia de maşini” nr. 3-4 / 2012
39
After drawing the conclusions at testing, it is decided if the pump may be or not recommended to be assembled in the hydraulic installation. 3.3. Testing on stand of pump’s workability and adjustability
After repairing it, the pump with axial pistons and pressure compensator was mounted on the stand for testing the pumps with variable flow, stand from the Lab for testing hydraulic apparatus for high pressure from IHP. 3.3.1 The pump’s testing objectives and scheme
The testing of the pump had focused on the following objectives:
- The possibility of adjusting the pump’s flow by the variation of the displacement /geometrical volume;
- The possibility of adjusting pressure at the pressure compensator/regulator;
- Watch the way the pump works, with all normal values.
For testing the workability and adjustability, the pump was mounted on a stand, according to the scheme of fig. 5.
Figure 5: Scheme of testing
As it may be seen in Fig. 5, the pump PP,
subjected to tests, was coupled, by means of an elastic coupling, to the ax of the electric asynchrony motor, which is supplied by network through a frequency inverter VF, which allows the variation of the electric motor revolution.
The pump is presented graphically in a symbolic form, in detail, in Fig. 5, where are put into evidence the scheme of the displacement adjustment device RC and the scheme of the pressure compensator PC.
The testing of the pump consisted in performing different flow, adjustments by means of the special device provided for modifying the pump s displacement RC, as well as other various pressure adjustments at the pressure compensator PC Were tested the adjustment of the revolution by adjusting the electric motor’s supply frequency.
3.3.2 The presentation of the testing stand
The stand for testing the pumps with variable displacement, from INOE 2000 IHP, shown in Fig. 6, materializes the testing scheme from Fig. 5.
a) overall view of the
stand b) pump on the stand
c) Flow transducer,
manometer, throttle and pressure limitator
d) data acquisition system for the fluid flow
Figure 6: Stand views 3.3.3 The operation mode for testing the pump
The operation performed on the testing stand consisted in the following:
After starting the pump’s motor, Fig. 6b, with the throttle DR completely open for each max. pressure value set adjusted at the compensator PC, the throttle was gradually close, until the compensator passed the pump on null, flow = 0. For each pressure value desired and read on the manometer M, Fig. 6c, included in the range of pressure values, from 0 to the max set value, was noted the corresponding flow value, detected by the flow transducer TD and indicated by the electronic measurement system from Fig. 6d. The results were listed in the next tables. 3.3.4 The adjustment of the pump flow
The adjustment of the pump flow was made by readjusting the displacement of the pump, from the screw, especially provided, and by modifying the frequency of the electric current supply of the motor. The flow variation by turning on the screw of the displacement RC:
The flow variation was made at a revolution of 1000 rot/min, corresponding to a frequency read on the electric panel of 33,333 Hz, by turning on the screw adjusting displacement, this being placed on the pump body for changing the angle of inclination of the pump disk. This allowed obtaining a max flow of
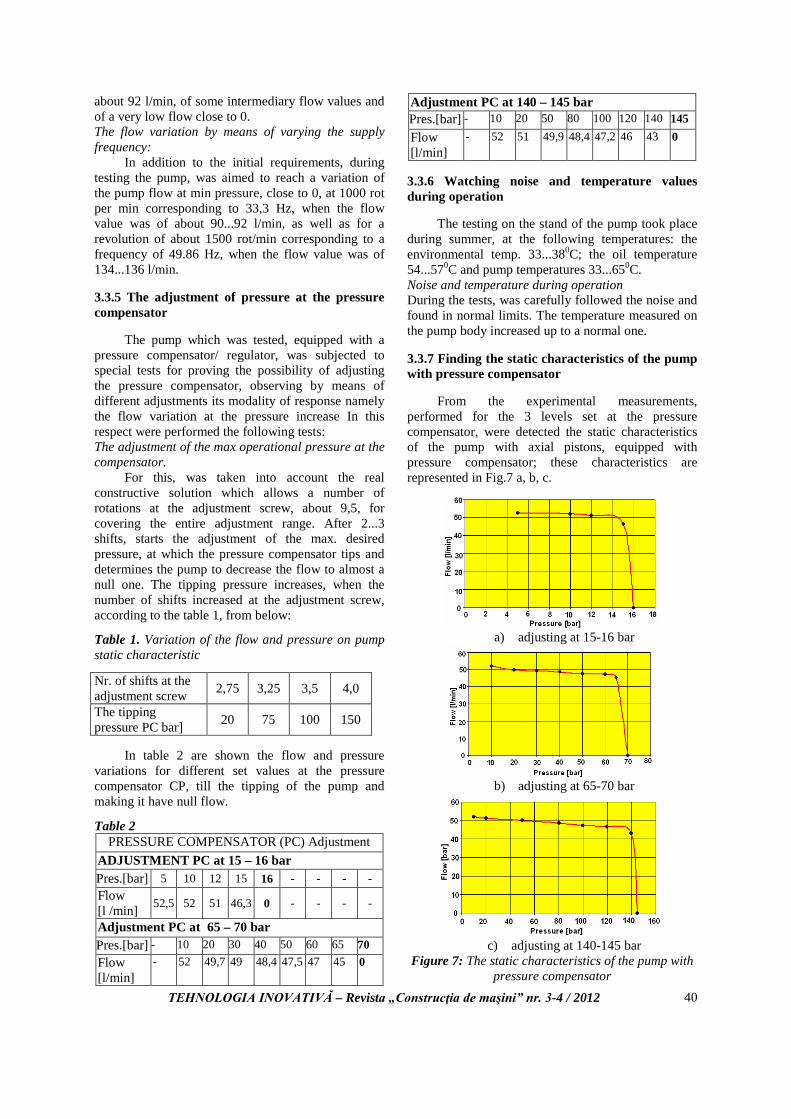
TEHNOLOGIA INOVATIVĂ – Revista „Construcţia de maşini” nr. 3-4 / 2012
40
about 92 l/min, of some intermediary flow values and of a very low flow close to 0. The flow variation by means of varying the supply frequency:
In addition to the initial requirements, during testing the pump, was aimed to reach a variation of the pump flow at min pressure, close to 0, at 1000 rot per min corresponding to 33,3 Hz, when the flow value was of about 90...92 l/min, as well as for a revolution of about 1500 rot/min corresponding to a frequency of 49.86 Hz, when the flow value was of 134...136 l/min. 3.3.5 The adjustment of pressure at the pressure compensator
The pump which was tested, equipped with a pressure compensator/ regulator, was subjected to special tests for proving the possibility of adjusting the pressure compensator, observing by means of different adjustments its modality of response namely the flow variation at the pressure increase In this respect were performed the following tests: The adjustment of the max operational pressure at the compensator.
For this, was taken into account the real constructive solution which allows a number of rotations at the adjustment screw, about 9,5, for covering the entire adjustment range. After 2...3 shifts, starts the adjustment of the max. desired pressure, at which the pressure compensator tips and determines the pump to decrease the flow to almost a null one. The tipping pressure increases, when the number of shifts increased at the adjustment screw, according to the table 1, from below:
Table 1. Variation of the flow and pressure on pump static characteristic
In table 2 are shown the flow and pressure
variations for different set values at the pressure compensator CP, till the tipping of the pump and making it have null flow.
Table 2 PRESSURE COMPENSATOR (PC) Adjustment
ADJUSTMENT PC at 15 – 16 bar Pres.[bar] 5 10 12 15 16 - - - - Flow [l /min] 52,5 52 51 46,3 0 - - - -
Adjustment PC at 65 – 70 bar Pres.[bar] - 10 20 30 40 50 60 65 70 Flow [l/min]
- 52 49,7 49 48,4 47,5 47 45 0
Adjustment PC at 140 – 145 bar Pres.[bar] - 10 20 50 80 100 120 140 145 Flow [l/min]
- 52 51 49,9 48,4 47,2 46 43 0
3.3.6 Watching noise and temperature values during operation
The testing on the stand of the pump took place during summer, at the following temperatures: the environmental temp. 33...380C; the oil temperature 54...570C and pump temperatures 33...650C. Noise and temperature during operation During the tests, was carefully followed the noise and found in normal limits. The temperature measured on the pump body increased up to a normal one. 3.3.7 Finding the static characteristics of the pump with pressure compensator
From the experimental measurements, performed for the 3 levels set at the pressure compensator, were detected the static characteristics of the pump with axial pistons, equipped with pressure compensator; these characteristics are represented in Fig.7 a, b, c.
a) adjusting at 15-16 bar
b) adjusting at 65-70 bar
c) adjusting at 140-145 bar
Figure 7: The static characteristics of the pump with pressure compensator
Nr. of shifts at the adjustment screw 2,75 3,25 3,5 4,0
The tipping pressure PC bar] 20 75 100 150
TEHNOLOGIA INOVATIVĂ – Revista „Construcţia de maşini” nr. 3-4 / 2012
41
4. CONCLUSIONS AND REMARKS From the information presented above, it may be noticed the significant role of an adequate maintenance of the hydraulic installations, for ensuring a long lifespan. This comes out from the theoretical approach from the beginning and from the real case studied in the second part. It was concluded that the tested pump has a normal behavior, having the possibility of adjusting the displacement and the pressure compensator as well, these being proven by means of the performed tests. The pump was found adequate for being assembled at the hydraulic installation with the condition of a careful assemblage and of a proper maintenance, being recommended to use good quality hydraulic oil, with the required characteristics, according to the manufacturer’s recommendations. REFERENCES [1]. N. Vasiliu, D. Vasiliu, “Fluid Power Systems“, Vol.I. Technical Publishing House, Bucharest, 2005 [2]. *** PARKER: Catalogue Industrial Hydraulics HZ11- 2500/UK, March 2002 [3]. Marin V., Moscovici, Rd., Teneslav, D. “Hydraulic drive
systems with automatic adjustment. Practical problems, design, execution, exploitation”. Technical Publishing, Bucharest, 1981.
[4]. Drumea, P., Cristescu, C., “Tribology researches on increasing the lifetime of hydraulic components and
systems”. In: PROCEEDINGS of the International Scientific-Technical Conference HYDRAULICS AND PNEUMATICS-2012,16-18th of May 2012, Wroclaw, Poland.
[5] Lepadatu, I., Experimental research focused the mechatronic positioning systems for regulating the
geometrical volume of the pumps with radial pistons, Buletin Stiintific nr. 4 al UPB, 2010
[6]. *** PARKER, Senso-Control, http://www.rotec.net/pdf/senso%20control.pdf [7]. *** HYDAC, HMG 500: http://www.hydac.com/de- en/products/measurement-display-and-analysis-
tools/measuring-instruments/handheld-measuring-instruments/hmg-500.html
[8]. *** PARKER, LCM20, http://www.ezihose.com/pdfs/catalogues/LaserCM.pdf
Quick Info
Microbullets Reveal Material Strengths
In the macro world, it’s easy to see what happens when a bullet hits an object. But what happens at the nanoscale with very tiny bullets? A Rice University lab, in collaboration with researchers at the Massachusetts Institute of Technology and its Institute for Soldier Nanotechnologies, decided to find out by creating the nanoscale target materials, the microscale ammo and even the method for firing them.
In the process, they gathered a surprising amount of information about how materials called block copolymers dissipate the strain of sudden impact. The goal of the researchers is to find novel ways to make materials more impervious to deformation or failure for stronger and lighter body armor, jet engine turbine blades for aircraft, and for cladding to protect spacecraft and satellites from micrometeorites and space junk.
The researchers, led by Rice materials scientist Ned Thomas and Rice research scientist and lead author Jae-Hwang Lee, were inspired by their observations in macroscopic ballistic tests in which a complex multiblock copolymer polyurethane material showed the ability to not only stop a 9 mm bullet but also seal the entryway behind it.
“The polymer has actually arrested the bullet and sealed it,” Thomas said, holding a hockey puck-sized piece of clear plastic with three bullets firmly embedded. “There’s no macroscopic damage; the material hasn’t failed; it hasn’t cracked. You can still see through it. This would be a great ballistic windshield material. “We want to find out why this polyurethane works the way it does. Theoretically, no one understood why this particular kind of material – which has nanoscale features of glassy and rubbery domains – would be so good at dissipating energy.”
One problem, Thomas said, is that cutting the polymer to analyze it on the nanoscale “would take days.” The researchers sought a model material that would react similarly at the nanoscale and could be analyzed much faster. They found one in a polystyrene-polydimethylsiloxane diblock-copolymer. The material self-assembles into alternating 20-nanometer layers of glassy and rubbery polymers. Under a scanning electron microscope, it looks like corduroy; after the test, the disruption pattern from impact can be clearly seen.
TEHNOLOGIA INOVATIVĂ – Revista „Construcţia de maşini” nr. 3-4 / 2012
42
The results showed several expected deformation mechanisms and the unexpected result that for sufficiently high velocities, the layered material melted into a homogeneous liquid that seemed to help arrest the projectile and, like the polymer, seal its entry path. The copolymer also behaved differently depending on where the spheres hit. The material showed the best ability to dissipate the energy of impact when spheres were fired perpendicular to the layers, Thomas said.
Testing their ideas took special equipment. The research team came up with a miniaturized test method, dubbed the laser-induced projectile impact test (LIPIT), that uses a laser pulse to fire glass spheres about 3 microns in diameter. The spheres sit on one side of a thin absorbing film facing the target. When a pulse hits the film, the energy causes it to vaporize and the spheres to fly off, hitting speeds between .5 and 5 kilometers per second. Since the kinetic energy scales with velocity squared, the factor of 10 in speed translates to a factor of 100 in impact energy, Thomas said.
Lee calculated the impact in real-world terms. The spheres strike their target 2,000 times faster than an apple falling one meter hits the ground, but with a million times less force. However, because the sphere’s impact area is so concentrated, the impact energy is more than 760 times greater. That leaves a mark, he said.
The team tested their materials in two ways: horizontally, with the impact perpendicular to the micro grain, and vertically, straight into the layered edges. They found the horizontal material best at stopping projectiles, perhaps because the layers reflect part of the incident shock wave. Beyond the melt zone in front of the projectile, the layers showed the ability to deform without breaking, which led to improved energy absorption.
“After the impact we can go in and cross-section the structure and see how deep the bullet got, and see what happened to these nice parallel layers,” Thomas said. “They tell the story of the evolution of penetration of the projectile and help us understand what mechanisms, at the nanoscale, may be taking place in order for this to be such a great, high-performance, lightweight protection material.”
Thomas would like to extend LIPIT testing to other lightweight, nanostructured materials like boron nitride, carbon nanotube-reinforced composites and graphite and graphene-based materials. The ultimate goal, he said, is to accelerate the design of metamaterials with precise control of their nano- and microstructures for a variety of applications.
(source:http://www.techbriefs.com/component/content/ article/15319)
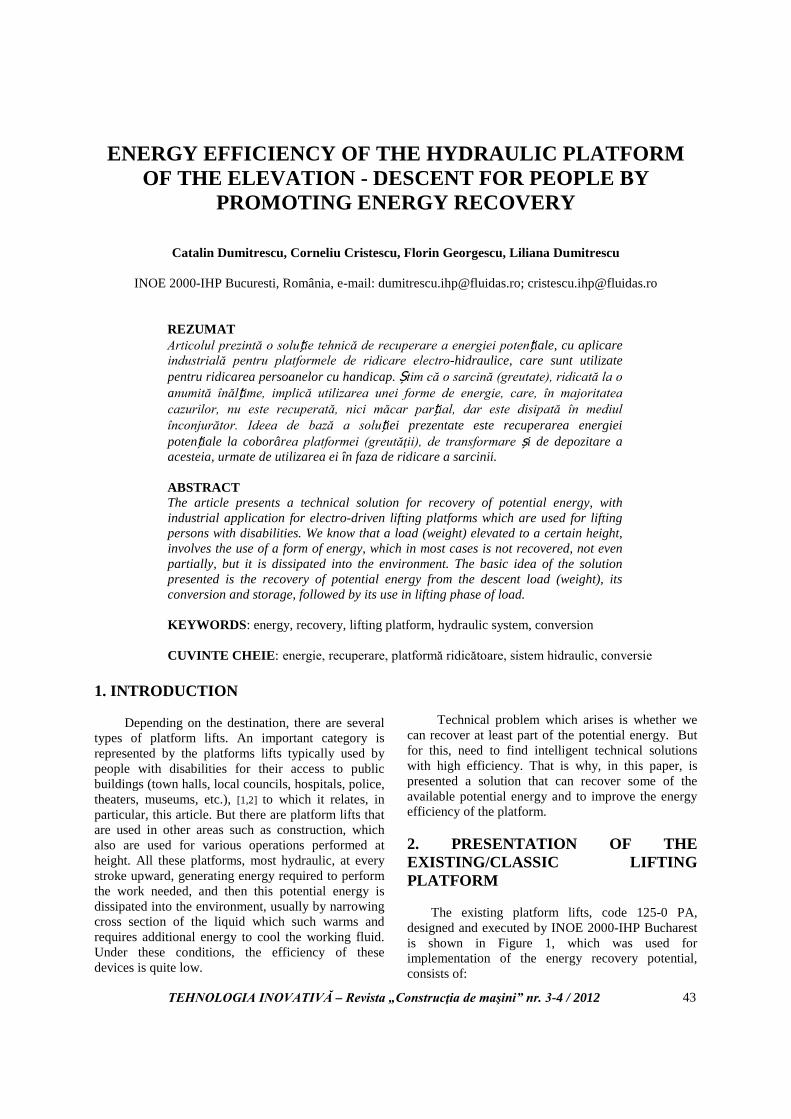
TEHNOLOGIA INOVATIVĂ – Revista „Construcţia de maşini” nr. 3-4 / 2012
43
ENERGY EFFICIENCY OF THE HYDRAULIC PLATFORM OF THE ELEVATION - DESCENT FOR PEOPLE BY
PROMOTING ENERGY RECOVERY
Catalin Dumitrescu, Corneliu Cristescu, Florin Georgescu, Liliana Dumitrescu
INOE 2000-IHP Bucuresti, România, e-mail: [email protected]; [email protected]
REZUMAT Articolul prezintă o soluție tehnică de recuperare a energiei potențiale, cu aplicare industrială pentru platformele de ridicare electro-hidraulice, care sunt utilizate pentru ridicarea persoanelor cu handicap. Știm că o sarcină (greutate), ridicată la o anumită înălțime, implică utilizarea unei forme de energie, care, în majoritatea cazurilor, nu este recuperată, nici măcar parțial, dar este disipată în mediul înconjurător. Ideea de bază a soluției prezentate este recuperarea energiei potențiale la coborârea platformei (greutăţii), de transformare și de depozitare a acesteia, urmate de utilizarea ei în faza de ridicare a sarcinii.
ABSTRACT The article presents a technical solution for recovery of potential energy, with industrial application for electro-driven lifting platforms which are used for lifting persons with disabilities. We know that a load (weight) elevated to a certain height, involves the use of a form of energy, which in most cases is not recovered, not even partially, but it is dissipated into the environment. The basic idea of the solution presented is the recovery of potential energy from the descent load (weight), its conversion and storage, followed by its use in lifting phase of load.
KEYWORDS: energy, recovery, lifting platform, hydraulic system, conversion CUVINTE CHEIE: energie, recuperare, platformă ridicătoare, sistem hidraulic, conversie
1. INTRODUCTION
Depending on the destination, there are several types of platform lifts. An important category is represented by the platforms lifts typically used by people with disabilities for their access to public buildings (town halls, local councils, hospitals, police, theaters, museums, etc.), [1,2] to which it relates, in particular, this article. But there are platform lifts that are used in other areas such as construction, which also are used for various operations performed at height. All these platforms, most hydraulic, at every stroke upward, generating energy required to perform the work needed, and then this potential energy is dissipated into the environment, usually by narrowing cross section of the liquid which such warms and requires additional energy to cool the working fluid. Under these conditions, the efficiency of these devices is quite low.
Technical problem which arises is whether we can recover at least part of the potential energy. But for this, need to find intelligent technical solutions with high efficiency. That is why, in this paper, is presented a solution that can recover some of the available potential energy and to improve the energy efficiency of the platform. 2. PRESENTATION OF THE EXISTING/CLASSIC LIFTING PLATFORM
The existing platform lifts, code 125-0 PA, designed and executed by INOE 2000-IHP Bucharest is shown in Figure 1, which was used for implementation of the energy recovery potential, consists of:
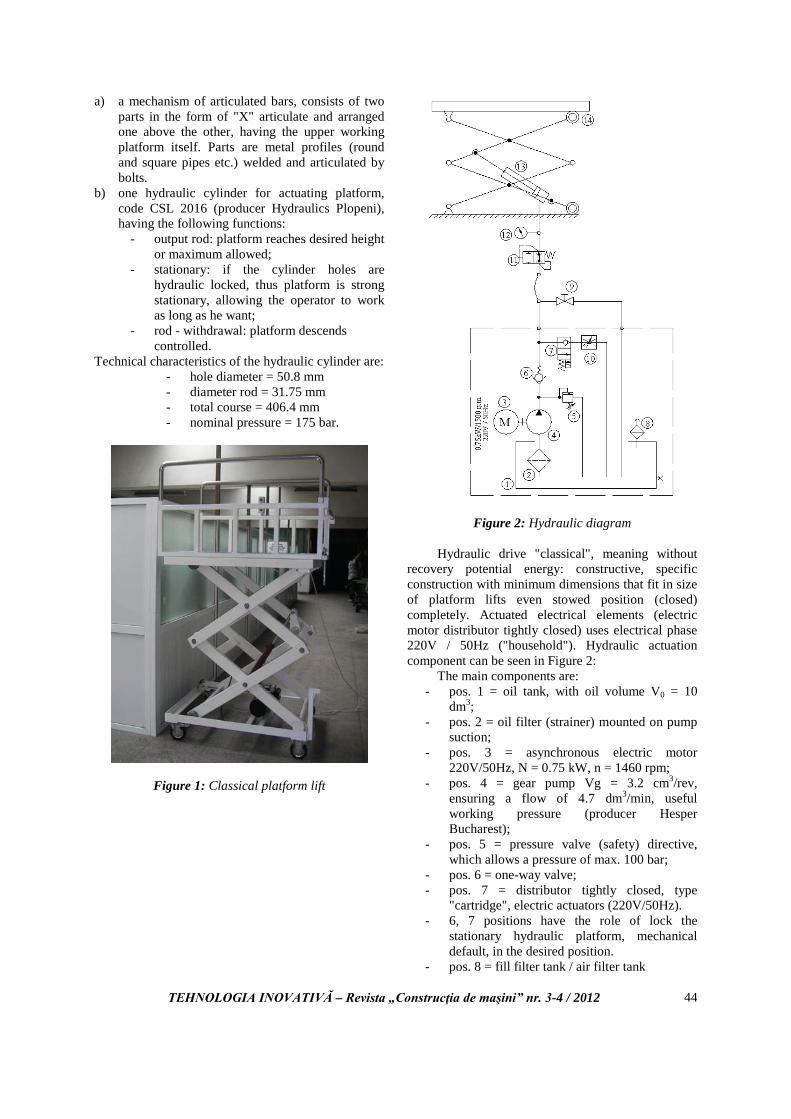
TEHNOLOGIA INOVATIVĂ – Revista „Construcţia de maşini” nr. 3-4 / 2012
44
a) a mechanism of articulated bars, consists of two parts in the form of "X" articulate and arranged one above the other, having the upper working platform itself. Parts are metal profiles (round and square pipes etc.) welded and articulated by bolts.
b) one hydraulic cylinder for actuating platform, code CSL 2016 (producer Hydraulics Plopeni), having the following functions:
- output rod: platform reaches desired height or maximum allowed;
- stationary: if the cylinder holes are hydraulic locked, thus platform is strong stationary, allowing the operator to work as long as he want;
- rod - withdrawal: platform descends controlled.
Technical characteristics of the hydraulic cylinder are: - hole diameter = 50.8 mm - diameter rod = 31.75 mm - total course = 406.4 mm - nominal pressure = 175 bar.
Figure 1: Classical platform lift
Figure 2: Hydraulic diagram
Hydraulic drive "classical", meaning without recovery potential energy: constructive, specific construction with minimum dimensions that fit in size of platform lifts even stowed position (closed) completely. Actuated electrical elements (electric motor distributor tightly closed) uses electrical phase 220V / 50Hz ("household"). Hydraulic actuation component can be seen in Figure 2:
The main components are: - pos. 1 = oil tank, with oil volume V0 = 10
dm3; - pos. 2 = oil filter (strainer) mounted on pump
suction; - pos. 3 = asynchronous electric motor
220V/50Hz, N = 0.75 kW, n = 1460 rpm; - pos. 4 = gear pump Vg = 3.2 cm3/rev,
ensuring a flow of 4.7 dm3/min, useful working pressure (producer Hesper Bucharest);
- pos. 5 = pressure valve (safety) directive, which allows a pressure of max. 100 bar;
- pos. 6 = one-way valve; - pos. 7 = distributor tightly closed, type
"cartridge", electric actuators (220V/50Hz). - 6, 7 positions have the role of lock the
stationary hydraulic platform, mechanical default, in the desired position.
- pos. 8 = fill filter tank / air filter tank
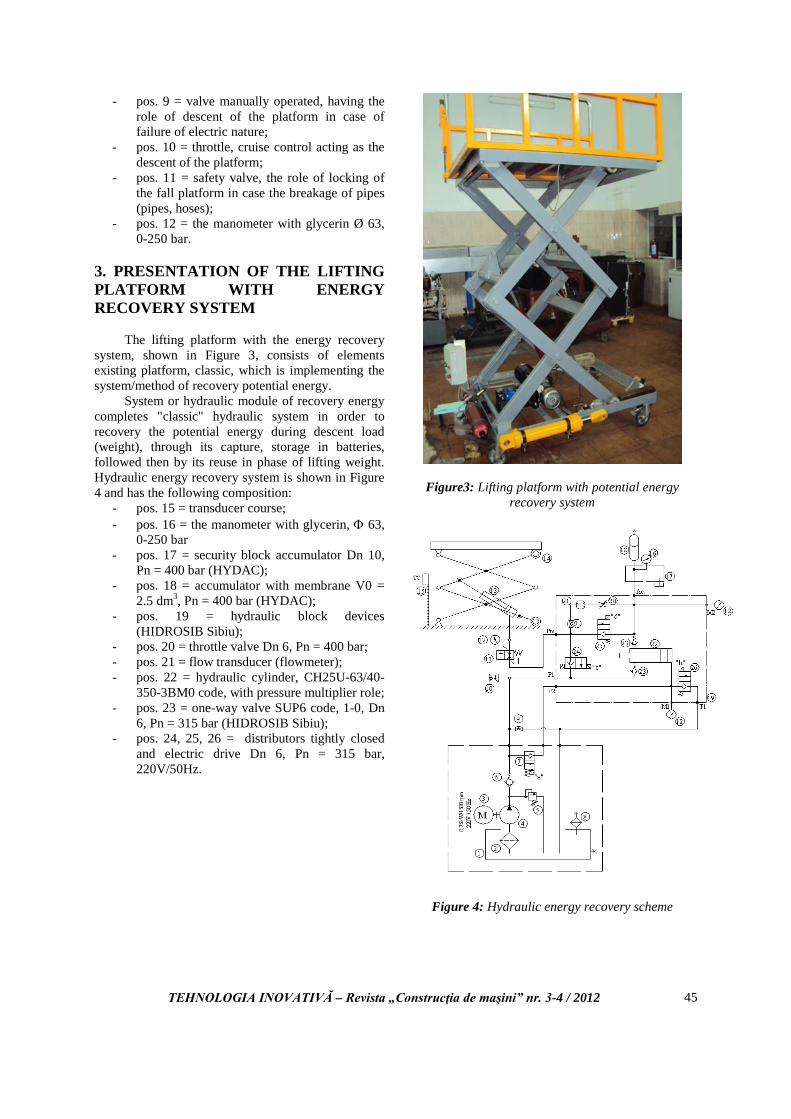
TEHNOLOGIA INOVATIVĂ – Revista „Construcţia de maşini” nr. 3-4 / 2012
45
- pos. 9 = valve manually operated, having the role of descent of the platform in case of failure of electric nature;
- pos. 10 = throttle, cruise control acting as the descent of the platform;
- pos. 11 = safety valve, the role of locking of the fall platform in case the breakage of pipes (pipes, hoses);
- pos. 12 = the manometer with glycerin Ø 63, 0-250 bar.
3. PRESENTATION OF THE LIFTING PLATFORM WITH ENERGY RECOVERY SYSTEM
The lifting platform with the energy recovery system, shown in Figure 3, consists of elements existing platform, classic, which is implementing the system/method of recovery potential energy.
System or hydraulic module of recovery energy completes "classic" hydraulic system in order to recovery the potential energy during descent load (weight), through its capture, storage in batteries, followed then by its reuse in phase of lifting weight. Hydraulic energy recovery system is shown in Figure 4 and has the following composition:
- pos. 15 = transducer course; - pos. 16 = the manometer with glycerin, Φ 63,
0-250 bar - pos. 17 = security block accumulator Dn 10,
Pn = 400 bar (HYDAC); - pos. 18 = accumulator with membrane V0 =
2.5 dm3, Pn = 400 bar (HYDAC); - pos. 19 = hydraulic block devices
(HIDROSIB Sibiu); - pos. 20 = throttle valve Dn 6, Pn = 400 bar; - pos. 21 = flow transducer (flowmeter); - pos. 22 = hydraulic cylinder, CH25U-63/40-
350-3BM0 code, with pressure multiplier role; - pos. 23 = one-way valve SUP6 code, 1-0, Dn
6, Pn = 315 bar (HIDROSIB Sibiu); - pos. 24, 25, 26 = distributors tightly closed
and electric drive Dn 6, Pn = 315 bar, 220V/50Hz.
Figure3: Lifting platform with potential energy recovery system
Figure 4: Hydraulic energy recovery scheme

TEHNOLOGIA INOVATIVĂ – Revista „Construcţia de maşini” nr. 3-4 / 2012
46
4. FUNCTIONAL DESCRIPTION PLATFORM LIFTS WITH ENERGY RECOVERY
The functioning of platform lifts with potential energy recovery system, is based on the potential energy storage in the descent phase of platform / load in a hydraulic accumulator with membrane and its reuse in the lifting phase.
During the descent phase, hydraulic energy (pressure x flow) is multiplied by a hydraulic cylinder acting as multiplier and transferred into an accumulator with membrane, it can store up to start lifting phase, after which the hydraulic energy is transmitted to the hydraulic cylinder drive platform [3].
Hydraulic cylinder used for energy multiplication, multiply the output pressure of 1.675 times the input pressure (if present), the multiplication of pressure depending on the size of the piston and cylinder rod.
Below are described the main phases of platform lifts drive: A) Lifting platform: - command to start the electric motor, Item 3 and electromagnetic drive 'b' of distributor, Item 26; - electromagnets "a", "c" and "d" disengaged. Driving circuit: 4-6, P1 and from P1: * 24-25-18 * PM-11-13 (hydraulic cylinder drive of the platform 13, thus lifting platform) * 23, cylinder rod multiplier 22 is withdrawn, the liquid from piston chamber is evacuated to the tank by 26. B) Stop (stationary platform): Electrical drives previous are canceled, multiplier cylinder rod is withdrawn and all hydraulic circuits to the tank are closed. The platform stationary strong in place. C) Lowering platform: - simultaneous are commanded electromagnetic drive "a" and "c" of distributors Item 7 and 24; - Item 3 electric motor is not acted; - electromagnets "b" and "d" of distributors, Item 26 and 25 are disengaged. Driving circuit: -under the influence of weight (load), oil hydraulic from cylinder piston chamber of the platform 13-11-Pm-24-P1-P2-7-cylinder piston of chamber multiplier 22 which multiplies the pressure, 23-18. So at the end of this phase, the platform lowers, the accumulator 18 is loaded with pressure cylinder multiplied by the multiplier 22 and the cylinder rod is out. D) Lifting platform with energy recovered: - the electromagnet "d" of distributor Item 25 is acted Driving circuit: - from the accumulator pos-18-25-PM-11-chamber piston of hydraulic cylinder of the platform, Item 13, so the platform is raised to the desired height, cylinder rod multiplier Item 22 still remains outstanding.
CONCLUSIONS
The authors of this work, researchers at INOE 2000-IHP Bucharest, proposed theoretically and practically through experimentation on the physical model of the idea presented, the following:
- Hydraulic design approach and rethinking the idea of energy recovery drive hydraulic (pressure x flow) from passive phase of action, its storing in active phases of work [4];
- reduce electricity consumption, considering increase trend of its price;
- applying on an industrial scale of those listed, considering minimal modifications of existing lifting platforms on the market.
REFERENCES [1]. Drumea, P., Cristescu, C., Lepadatu, I., Dumitrescu, C.,
Dutu, I., Dumitrescu, L. „Echipament pentru deplasarea pe verticala a persoanelor cu dizabilitati locomotorii”. In: vol. Stiinta si Inginerie - Lucrarile cele de A- VI-a Conferinte Nationale multidisciplinare cu participare internationala – Profesorul Dorin Pavel-, fondatorul hidroenergeticii românesti, SEBES, 2006., pp. 401 – 406, ISBN 10 973 – 8130 – 82 – 4 / ISBN 13 978 - 973 – 8130 – 82 – 1.
[2]. Cristescu, C., „Theoretical Research Regarding the Evolution of the Dynamic Parameters of the Vertical
Elevation Equipment Used by the Persons with Locomotion Disabilities”. In: journal HIDRAULICA no. 1-2 , July 2006, pp. 14-22, ISSN 1453 - 7303.
[3]. Mirea, Ad., Radulescu, G., Matache, G., Cristescu, C., „Cercetari privind recuperarea energiilor libere la autovehicule rutiere”. In: Buletinul AGIR, no.4, 2006, pp. 90 – 95, Publishing House AGIR, Bucharest 2006, ISSN 1224 – 7928.
[4]. Virgil Marin, Rudolf Moscovici, Dumitru Teneslav, „Hydraulic drive systems and automatic”, Technical Publishing House, Bucharest 1981.
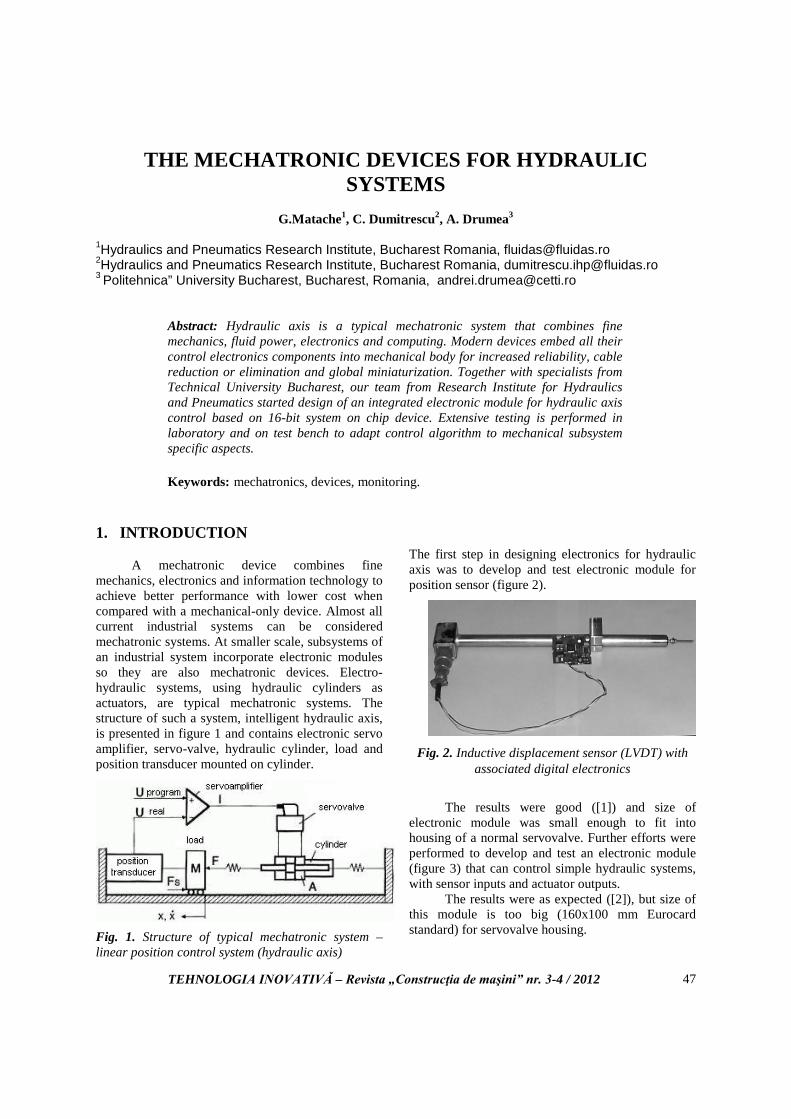
TEHNOLOGIA INOVATIVĂ – Revista „Construcţia de maşini” nr. 3-4 / 2012
47
THE MECHATRONIC DEVICES FOR HYDRAULIC SYSTEMS
G.Matache1, C. Dumitrescu2, A. Drumea3
1Hydraulics and Pneumatics Research Institute, Bucharest Romania, [email protected] 2Hydraulics and Pneumatics Research Institute, Bucharest Romania, [email protected] 3 Politehnica” University Bucharest, Bucharest, Romania, [email protected]
Abstract: Hydraulic axis is a typical mechatronic system that combines fine mechanics, fluid power, electronics and computing. Modern devices embed all their control electronics components into mechanical body for increased reliability, cable reduction or elimination and global miniaturization. Together with specialists from Technical University Bucharest, our team from Research Institute for Hydraulics and Pneumatics started design of an integrated electronic module for hydraulic axis control based on 16-bit system on chip device. Extensive testing is performed in laboratory and on test bench to adapt control algorithm to mechanical subsystem specific aspects. Keywords: mechatronics, devices, monitoring.
1. INTRODUCTION
A mechatronic device combines fine mechanics, electronics and information technology to achieve better performance with lower cost when compared with a mechanical-only device. Almost all current industrial systems can be considered mechatronic systems. At smaller scale, subsystems of an industrial system incorporate electronic modules so they are also mechatronic devices. Electro-hydraulic systems, using hydraulic cylinders as actuators, are typical mechatronic systems. The structure of such a system, intelligent hydraulic axis, is presented in figure 1 and contains electronic servo amplifier, servo-valve, hydraulic cylinder, load and position transducer mounted on cylinder.
Fig. 1. Structure of typical mechatronic system – linear position control system (hydraulic axis)
The first step in designing electronics for hydraulic axis was to develop and test electronic module for position sensor (figure 2).
Fig. 2. Inductive displacement sensor (LVDT) with
associated digital electronics
The results were good ([1]) and size of
electronic module was small enough to fit into housing of a normal servovalve. Further efforts were performed to develop and test an electronic module (figure 3) that can control simple hydraulic systems, with sensor inputs and actuator outputs.
The results were as expected ([2]), but size of this module is too big (160x100 mm Eurocard standard) for servovalve housing.
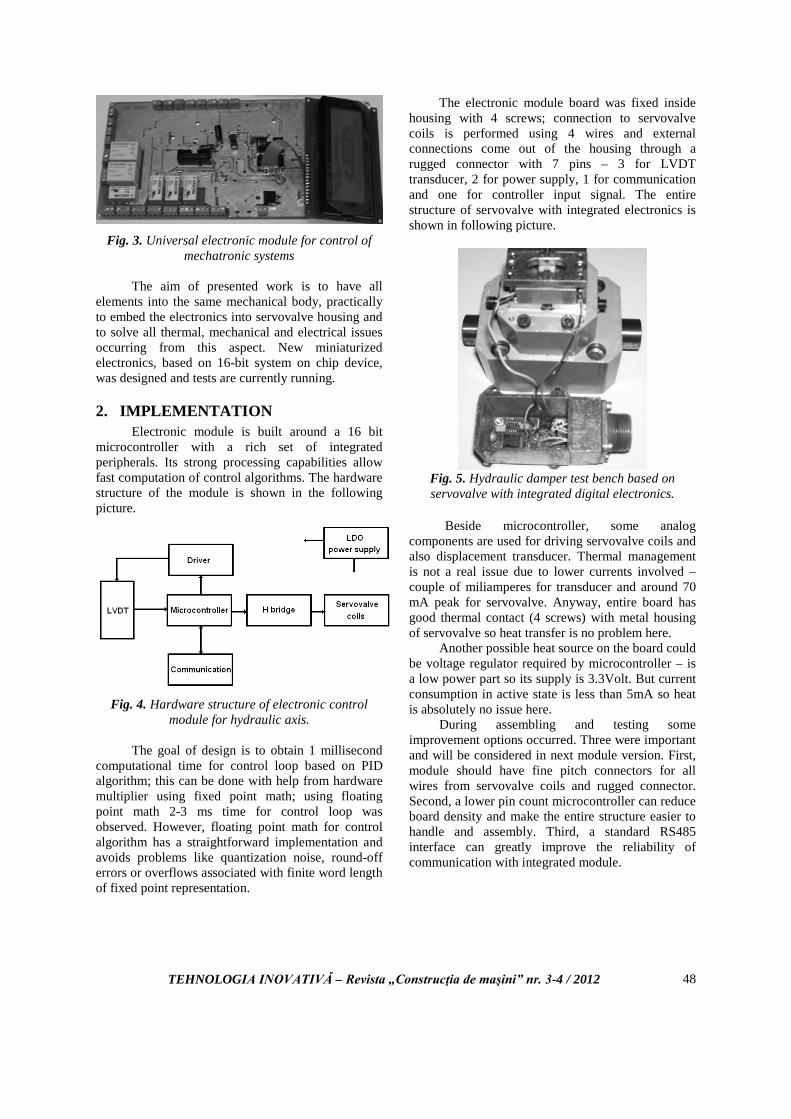
TEHNOLOGIA INOVATIVĂ – Revista „Construcţia de maşini” nr. 3-4 / 2012
48
Fig. 3. Universal electronic module for control of
mechatronic systems
The aim of presented work is to have all elements into the same mechanical body, practically to embed the electronics into servovalve housing and to solve all thermal, mechanical and electrical issues occurring from this aspect. New miniaturized electronics, based on 16-bit system on chip device, was designed and tests are currently running.
2. IMPLEMENTATION Electronic module is built around a 16 bit
microcontroller with a rich set of integrated peripherals. Its strong processing capabilities allow fast computation of control algorithms. The hardware structure of the module is shown in the following picture.
Fig. 4. Hardware structure of electronic control
module for hydraulic axis.
The goal of design is to obtain 1 millisecond computational time for control loop based on PID algorithm; this can be done with help from hardware multiplier using fixed point math; using floating point math 2-3 ms time for control loop was observed. However, floating point math for control algorithm has a straightforward implementation and avoids problems like quantization noise, round-off errors or overflows associated with finite word length of fixed point representation.
The electronic module board was fixed inside housing with 4 screws; connection to servovalve coils is performed using 4 wires and external connections come out of the housing through a rugged connector with 7 pins – 3 for LVDT transducer, 2 for power supply, 1 for communication and one for controller input signal. The entire structure of servovalve with integrated electronics is shown in following picture.
Fig. 5. Hydraulic damper test bench based on servovalve with integrated digital electronics.
Beside microcontroller, some analog components are used for driving servovalve coils and also displacement transducer. Thermal management is not a real issue due to lower currents involved – couple of miliamperes for transducer and around 70 mA peak for servovalve. Anyway, entire board has good thermal contact (4 screws) with metal housing of servovalve so heat transfer is no problem here.
Another possible heat source on the board could be voltage regulator required by microcontroller – is a low power part so its supply is 3.3Volt. But current consumption in active state is less than 5mA so heat is absolutely no issue here.
During assembling and testing some improvement options occurred. Three were important and will be considered in next module version. First, module should have fine pitch connectors for all wires from servovalve coils and rugged connector. Second, a lower pin count microcontroller can reduce board density and make the entire structure easier to handle and assembly. Third, a standard RS485 interface can greatly improve the reliability of communication with integrated module.
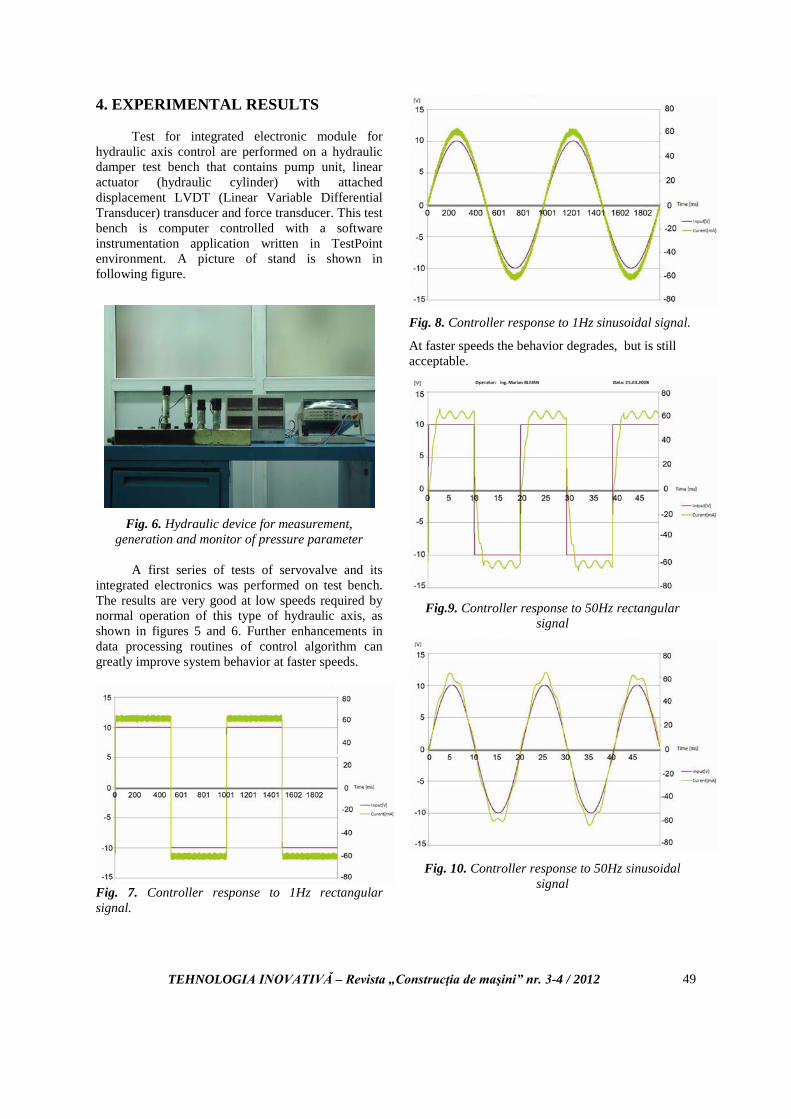
TEHNOLOGIA INOVATIVĂ – Revista „Construcţia de maşini” nr. 3-4 / 2012
49
4. EXPERIMENTAL RESULTS
Test for integrated electronic module for hydraulic axis control are performed on a hydraulic damper test bench that contains pump unit, linear actuator (hydraulic cylinder) with attached displacement LVDT (Linear Variable Differential Transducer) transducer and force transducer. This test bench is computer controlled with a software instrumentation application written in TestPoint environment. A picture of stand is shown in following figure.
Fig. 6. Hydraulic device for measurement,
generation and monitor of pressure parameter A first series of tests of servovalve and its
integrated electronics was performed on test bench. The results are very good at low speeds required by normal operation of this type of hydraulic axis, as shown in figures 5 and 6. Further enhancements in data processing routines of control algorithm can greatly improve system behavior at faster speeds.
Fig. 7. Controller response to 1Hz rectangular signal.
Fig. 8. Controller response to 1Hz sinusoidal signal. At faster speeds the behavior degrades, but is still acceptable.
Fig.9. Controller response to 50Hz rectangular
signal
Fig. 10. Controller response to 50Hz sinusoidal
signal
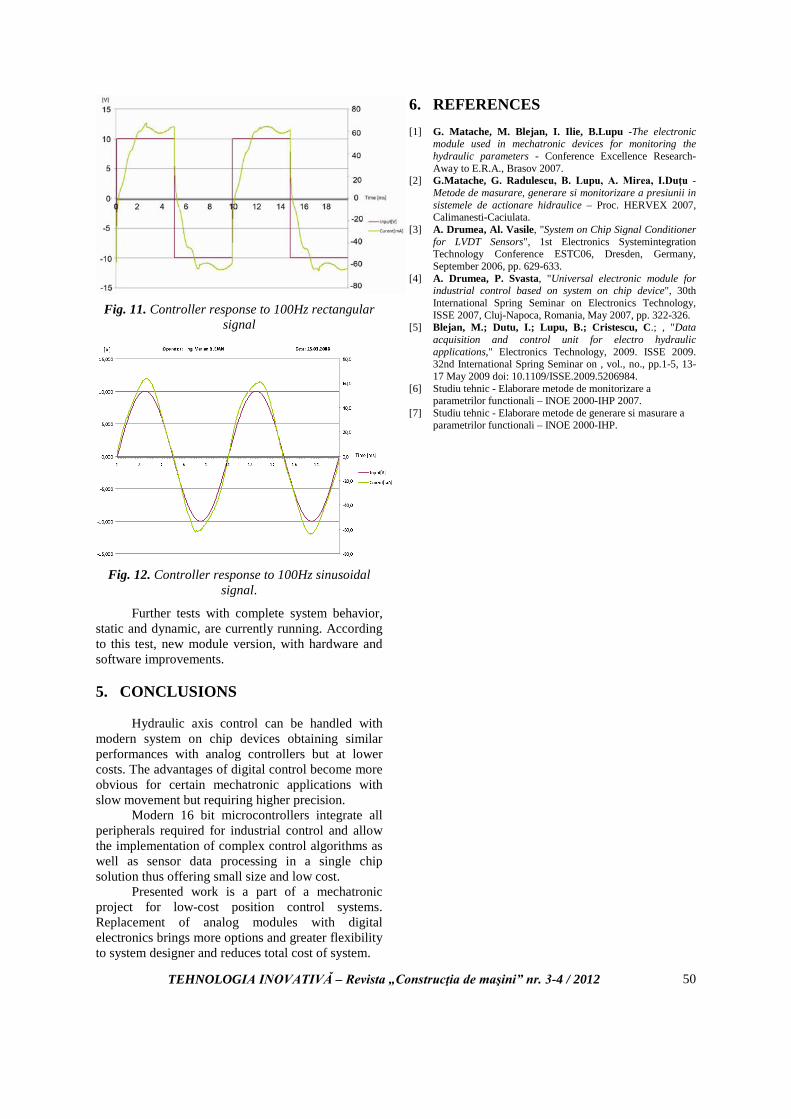
TEHNOLOGIA INOVATIVĂ – Revista „Construcţia de maşini” nr. 3-4 / 2012
50
Fig. 11. Controller response to 100Hz rectangular
signal
Fig. 12. Controller response to 100Hz sinusoidal
signal.
Further tests with complete system behavior, static and dynamic, are currently running. According to this test, new module version, with hardware and software improvements.
5. CONCLUSIONS
Hydraulic axis control can be handled with modern system on chip devices obtaining similar performances with analog controllers but at lower costs. The advantages of digital control become more obvious for certain mechatronic applications with slow movement but requiring higher precision.
Modern 16 bit microcontrollers integrate all peripherals required for industrial control and allow the implementation of complex control algorithms as well as sensor data processing in a single chip solution thus offering small size and low cost.
Presented work is a part of a mechatronic project for low-cost position control systems. Replacement of analog modules with digital electronics brings more options and greater flexibility to system designer and reduces total cost of system.
6. REFERENCES [1] G. Matache, M. Blejan, I. Ilie, B.Lupu -The electronic
module used in mechatronic devices for monitoring the hydraulic parameters - Conference Excellence Research- Away to E.R.A., Brasov 2007.
[2] G.Matache, G. Radulescu, B. Lupu, A. Mirea, I.Duţu - Metode de masurare, generare si monitorizare a presiunii in sistemele de actionare hidraulice – Proc. HERVEX 2007, Calimanesti-Caciulata.
[3] A. Drumea, Al. Vasile, "System on Chip Signal Conditioner for LVDT Sensors", 1st Electronics Systemintegration Technology Conference ESTC06, Dresden, Germany, September 2006, pp. 629-633.
[4] A. Drumea, P. Svasta, "Universal electronic module for industrial control based on system on chip device", 30th International Spring Seminar on Electronics Technology, ISSE 2007, Cluj-Napoca, Romania, May 2007, pp. 322-326.
[5] Blejan, M.; Dutu, I.; Lupu, B.; Cristescu, C.; , "Data acquisition and control unit for electro hydraulic applications," Electronics Technology, 2009. ISSE 2009. 32nd International Spring Seminar on , vol., no., pp.1-5, 13-17 May 2009 doi: 10.1109/ISSE.2009.5206984.
[6] Studiu tehnic - Elaborare metode de monitorizare a parametrilor functionali – INOE 2000-IHP 2007. [7] Studiu tehnic - Elaborare metode de generare si masurare a parametrilor functionali – INOE 2000-IHP.

TEHNOLOGIA INOVATIVĂ – Revista „Construcţia de maşini” nr. 3-4 / 2012 51
MECHATRONIC CONTROL OF PRESSURE USING A PIEZOELECTRIC CONVERTOR
G.Matache, I. Dutu
Hydraulics and Pneumatics Research Institute, Bucharest, ROMANIA, [email protected] Hydraulics and Pneumatics Research Institute, Bucharest ROMANIA, [email protected]
ABSTRACT: The paper presents the results of the mathematic model of the pilot stage of a piezoelectric pressure regulator, validated experimentally in the Laboratory of the Hydraulics and Pneumatics Institute from Bucharest. The paper also presents original selection software for a piezoelectric actuator that is the basic component of the pressure regulator.
KEYWORDS: mathematical model, piezoelectric, program
1. MATHEMATIC MODEL FOR THE PIEZOELECTRIC PNEUMATIC PRESSURE REGULATOR In Romania, the development of the pneumatic
servo-equipment isn’t meeting the international requirements; locally we produce only “classic” pneumatic regulators. In this case, we can mention the study, the design and the development of a piezoelectric pneumatic regulator. The Pneumatics laboratory from Hydraulics and Pneumatics Research Institute from Bucharest (abbreviated I.H.P.) has developed some proportional regulators DN6 and servo-regulators DN6 with good performances and high precision for pressure adjustment. These solutions are the subject of some patents.
When we designed the proportional regulators, we had in mind the following:
- achieving some overall dimensions, connection dimensions and fastening dimensions similar to products developed abroad;
- obtaining products with high reliability through the reduction of friction and usage in products;
- the materials we used to make the products came from our native production;
- the proportional electrical drive is made with a servo-controller, adapted from the national serial manufacture of servo-hydraulic systems.
The piezoelectric pneumatic pressure regulator [6],[7], [8], consists of two parts:
a) pneumatic module (formed by main valve, spring, membrane and body);
b) electro-mechanic converter (formed by torque engine, secondary membrane, swinging spring, discharge valve and mobile rod).
The functional principle of the piezoelectric pneumatic pressure regulator is given in figure no. 1.
Input pressure reaches the main valve and it is adjusted by a “nozzle-flap” converter, controlled by the driving circuit depending on given reference signal in order to achieve the desired output pressure.
In order to produce a structured mathematic model of the pneumatic pressure regulator, we used the
Main valve
Input pressure
Atmosphere
Pressure gauge
Pneumatic intensifier
Electro-pneumatic
converter
Control circuitry
Supply Reference
signal
Output pressure
Fig. 1. The functional principle
of the piezoelectric pneumatic pressure regulator
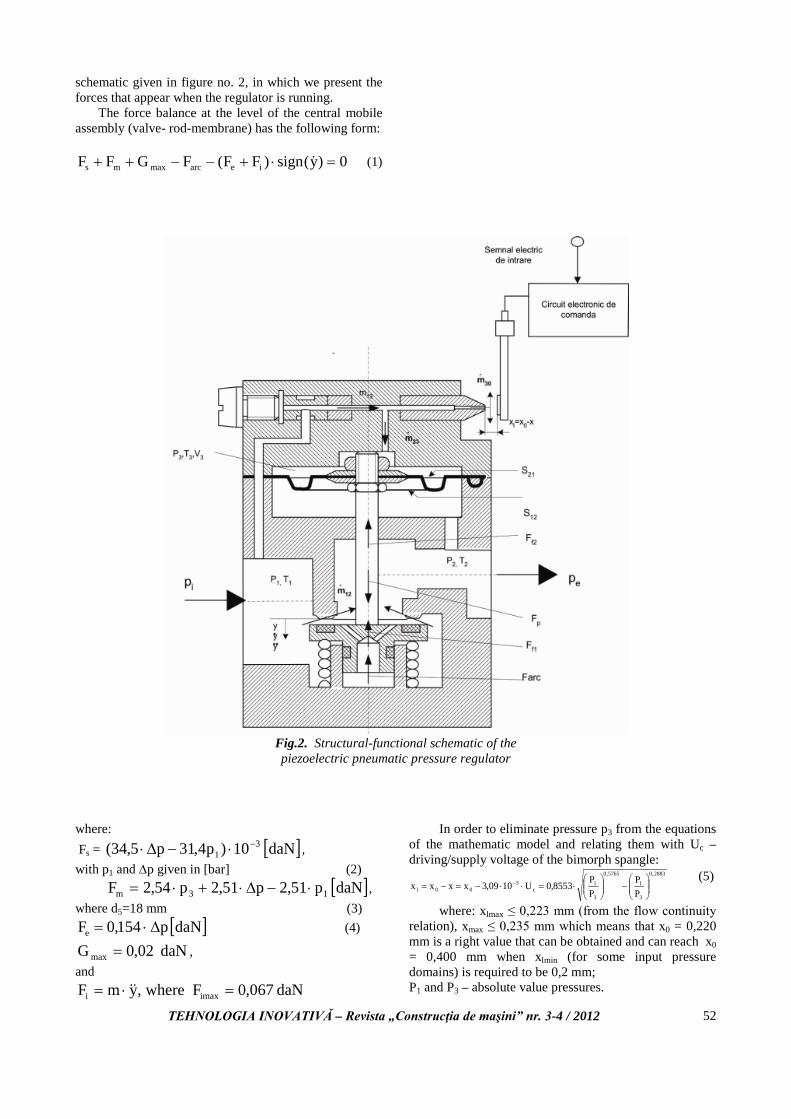
TEHNOLOGIA INOVATIVĂ – Revista „Construcţia de maşini” nr. 3-4 / 2012 52
schematic given in figure no. 2, in which we present the forces that appear when the regulator is running.
The force balance at the level of the central mobile assembly (valve- rod-membrane) has the following form:
0)y(sign)FF(FGFF iearcmaxms =⋅+−−++ (1)
Fig.2. Structural-functional schematic of the piezoelectric pneumatic pressure regulator
where: Fs = [ ]daN 10)p4,31p5,34( 3
1−⋅−∆⋅ ,
with p1 and ∆p given in [bar] (2) [ ]daN p51,2p51,2p54,2F 13m ⋅−∆⋅+⋅= , where d5=18 mm (3)
[ ]daN p154,0Fe ∆⋅= (4)
daN 02,0G max = , and
daN 067,0F where,ymF imaxi =⋅=
In order to eliminate pressure p3 from the equations of the mathematic model and relating them with Uc – driving/supply voltage of the bimorph spangle:
2883,0
3
1
5765,0
3
1c
300l P
PPP8553,0U1009,3xxxx
−
⋅=⋅⋅−=−= −
(5)
where: xlmax ≤ 0,223 mm (from the flow continuity relation), xmax ≤ 0,235 mm which means that x0 = 0,220 mm is a right value that can be obtained and can reach x0 = 0,400 mm when xlmin (for some input pressure domains) is required to be 0,2 mm; P1 and P3 – absolute value pressures.
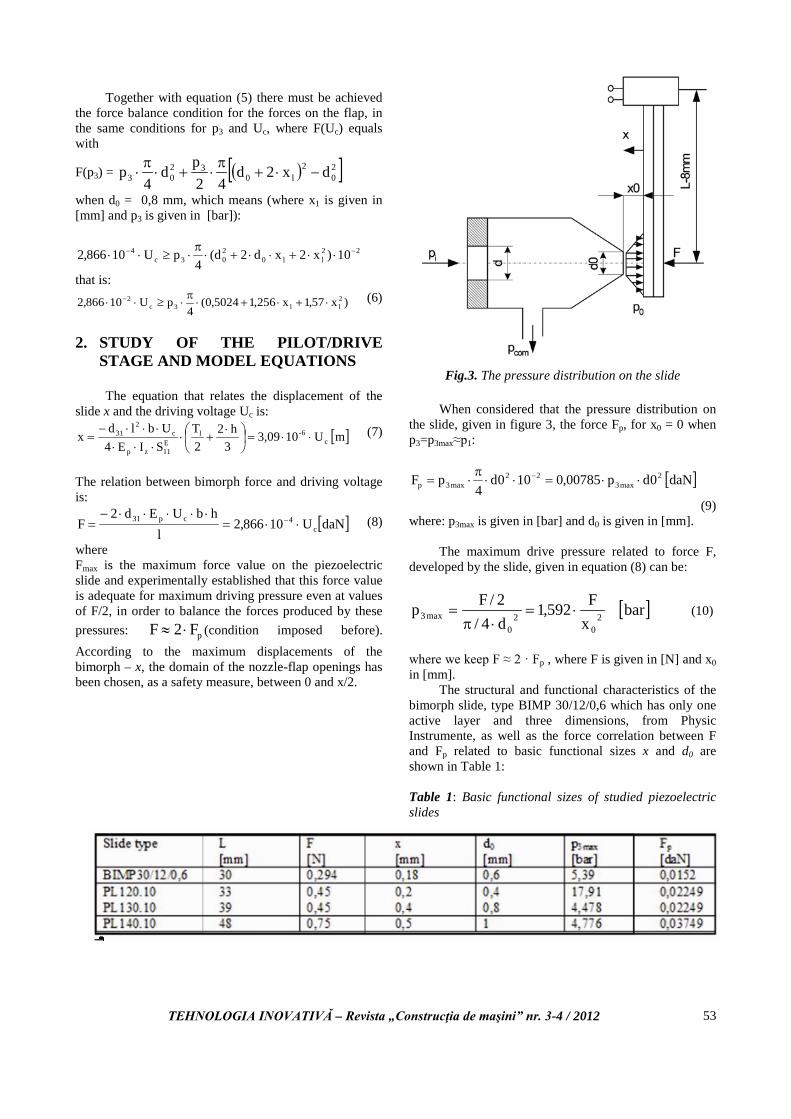
TEHNOLOGIA INOVATIVĂ – Revista „Construcţia de maşini” nr. 3-4 / 2012 53
Together with equation (5) there must be achieved
the force balance condition for the forces on the flap, in the same conditions for p3 and Uc, where F(Uc) equals with
F(p3) = ( )[ ]20
2l0
3203 dx2d
42pd
4p −⋅+
π⋅+⋅
π⋅
when d0 = 0,8 mm, which means (where x1 is given in [mm] and p3 is given in [bar]):
22ll0
203c
4 10)x2xd2d(4
pU10866,2 −− ⋅⋅+⋅⋅+⋅π⋅≥⋅⋅
that is:
)x57,1x256,15024,0(4
pU10866,2 2ll3c
2 ⋅+⋅+⋅π⋅≥⋅⋅ − (6)
2. STUDY OF THE PILOT/DRIVE
STAGE AND MODEL EQUATIONS
The equation that relates the displacement of the slide x and the driving voltage Uc is:
[ ]m U103,093
h22T
SIE4Ubld
x c6-l
E11zp
c2
31 ⋅⋅=
⋅
+⋅⋅⋅⋅⋅⋅⋅−
= (7)
The relation between bimorph force and driving voltage is:
[ ]daNU10866,2l
hbUEd2F c
4cp31 ⋅⋅=⋅⋅⋅⋅⋅−
= − (8)
where Fmax is the maximum force value on the piezoelectric slide and experimentally established that this force value is adequate for maximum driving pressure even at values of F/2, in order to balance the forces produced by these pressures: pF2F ⋅≈ (condition imposed before). According to the maximum displacements of the bimorph – x, the domain of the nozzle-flap openings has been chosen, as a safety measure, between 0 and x/2.
Fig.3. The pressure distribution on the slide
When considered that the pressure distribution on
the slide, given in figure 3, the force Fp, for x0 = 0 when p3=p3max≈p1:
[ ]daN 0dp00785,0100d4
pF 2max3
22max3p ⋅⋅=⋅⋅
π⋅= −
(9) where: p3max is given in [bar] and d0 is given in [mm].
The maximum drive pressure related to force F, developed by the slide, given in equation (8) can be:
[ ]bar xF592,1
d4/2/Fp 2
02
0max3 ⋅=
⋅π= (10)
where we keep F ≈ 2 · Fp , where F is given in [N] and x0 in [mm].
The structural and functional characteristics of the bimorph slide, type BIMP 30/12/0,6 which has only one active layer and three dimensions, from Physic Instrumente, as well as the force correlation between F and Fp related to basic functional sizes x and d0 are shown in Table 1:
Table 1: Basic functional sizes of studied piezoelectric slides
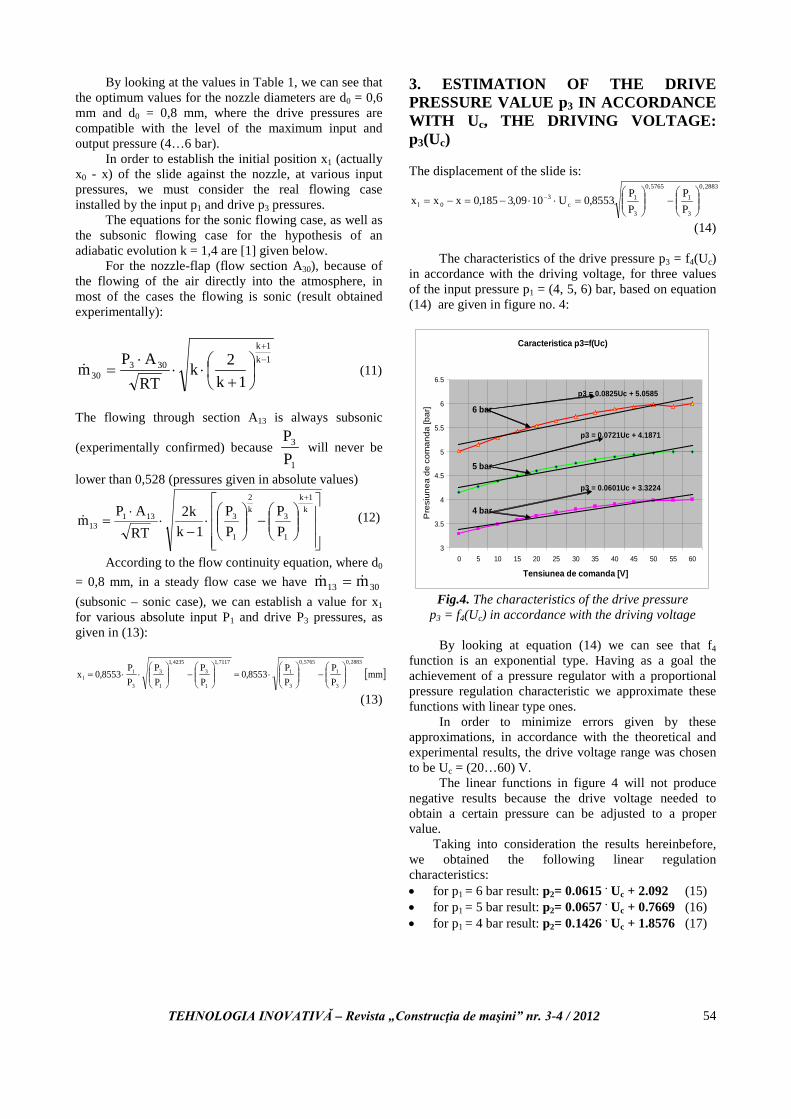
TEHNOLOGIA INOVATIVĂ – Revista „Construcţia de maşini” nr. 3-4 / 2012 54
By looking at the values in Table 1, we can see that the optimum values for the nozzle diameters are d0 = 0,6 mm and d0 = 0,8 mm, where the drive pressures are compatible with the level of the maximum input and output pressure (4…6 bar).
In order to establish the initial position x1 (actually x0 - x) of the slide against the nozzle, at various input pressures, we must consider the real flowing case installed by the input p1 and drive p3 pressures.
The equations for the sonic flowing case, as well as the subsonic flowing case for the hypothesis of an adiabatic evolution k = 1,4 are [1] given below.
For the nozzle-flap (flow section A30), because of the flowing of the air directly into the atmosphere, in most of the cases the flowing is sonic (result obtained experimentally):
1k1k
30330 1k
2kRTAP
m−+
+⋅⋅
⋅= (11)
The flowing through section A13 is always subsonic
(experimentally confirmed) because 1
3
PP
will never be
lower than 0,528 (pressures given in absolute values)
−
⋅
−⋅
⋅=
+k
1k
1
3k2
1
313113 P
PPP
1kk2
RTAP
m (12)
According to the flow continuity equation, where d0 = 0,8 mm, in a steady flow case we have 3013 mm = (subsonic – sonic case), we can establish a value for x1 for various absolute input P1 and drive P3 pressures, as given in (13):
[ ]mm PP
PP
8553,0PP
PP
PP
8553,0x2883,0
3
1
5765,0
3
17117,1
1
34235,1
1
3
3
1l
−
⋅=
−
⋅⋅=
(13)
3. ESTIMATION OF THE DRIVE PRESSURE VALUE p3 IN ACCORDANCE WITH Uc, THE DRIVING VOLTAGE: p3(Uc) The displacement of the slide is:
2883,0
3
1
5765,0
3
1c
30l P
PPP8553,0U1009,3185,0xxx
−
=⋅⋅−=−= −
(14)
The characteristics of the drive pressure p3 = f4(Uc) in accordance with the driving voltage, for three values of the input pressure p1 = (4, 5, 6) bar, based on equation (14) are given in figure no. 4:
Caracteristica p3=f(Uc)
p3 = 0.0721Uc + 4.1871
p3 = 0.0601Uc + 3.3224
p3 = 0.0825Uc + 5.0585
3
3.5
4
4.5
5
5.5
6
6.5
0 5 10 15 20 25 30 35 40 45 50 55 60
Tensiunea de comanda [V]
Pre
siun
ea d
e co
man
da [b
ar] 6 bar
5 bar
4 bar
Fig.4. The characteristics of the drive pressure
p3 = f4(Uc) in accordance with the driving voltage
By looking at equation (14) we can see that f4 function is an exponential type. Having as a goal the achievement of a pressure regulator with a proportional pressure regulation characteristic we approximate these functions with linear type ones.
In order to minimize errors given by these approximations, in accordance with the theoretical and experimental results, the drive voltage range was chosen to be Uc = (20…60) V.
The linear functions in figure 4 will not produce negative results because the drive voltage needed to obtain a certain pressure can be adjusted to a proper value.
Taking into consideration the results hereinbefore, we obtained the following linear regulation characteristics: • for p1 = 6 bar result: p2= 0.0615 . Uc + 2.092 (15) • for p1 = 5 bar result: p2= 0.0657 . Uc + 0.7669 (16) • for p1 = 4 bar result: p2= 0.1426 . Uc + 1.8576 (17)
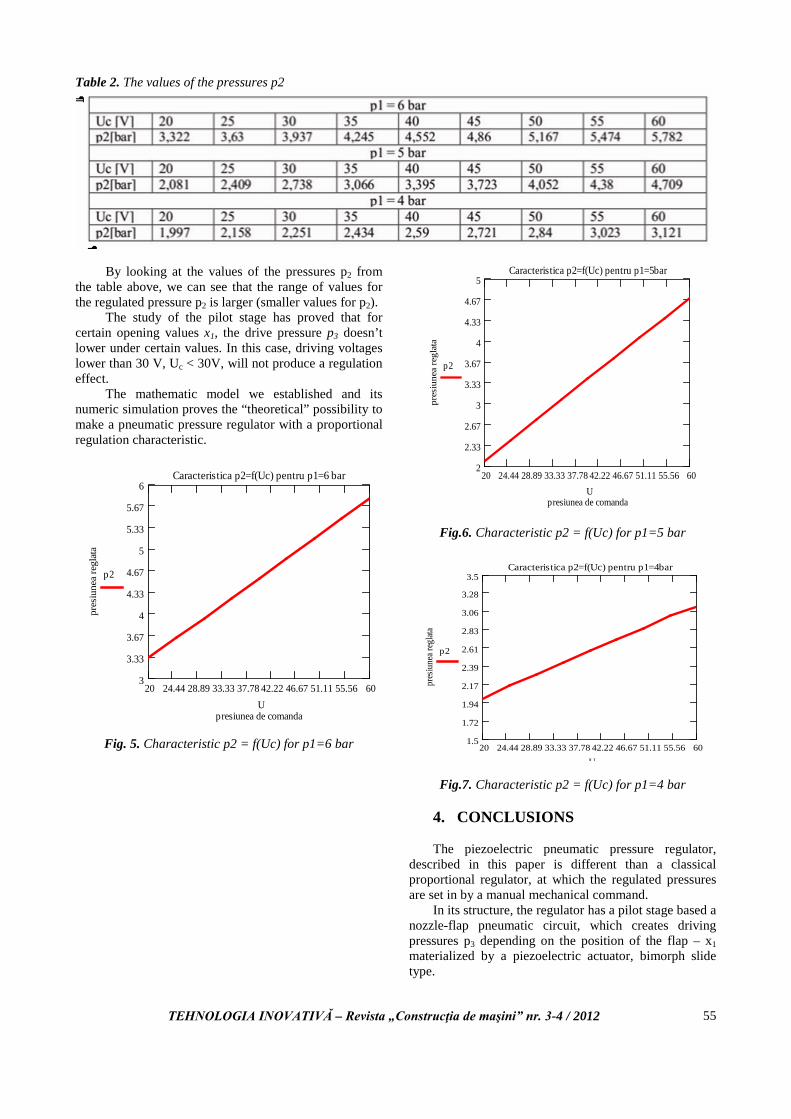
TEHNOLOGIA INOVATIVĂ – Revista „Construcţia de maşini” nr. 3-4 / 2012 55
Table 2. The values of the pressures p2
By looking at the values of the pressures p2 from the table above, we can see that the range of values for the regulated pressure p2 is larger (smaller values for p2).
The study of the pilot stage has proved that for certain opening values x1, the drive pressure p3 doesn’t lower under certain values. In this case, driving voltages lower than 30 V, Uc < 30V, will not produce a regulation effect.
The mathematic model we established and its numeric simulation proves the “theoretical” possibility to make a pneumatic pressure regulator with a proportional regulation characteristic.
20 24.44 28.89 33.33 37.78 42.22 46.67 51.11 55.56 603
3.33
3.67
4
4.33
4.67
5
5.33
5.67
6Caracteristica p2=f(Uc) pentru p1=6 bar
presiunea de comanda
pres
iune
a re
glat
a
p2
U
Fig. 5. Characteristic p2 = f(Uc) for p1=6 bar
20 24.44 28.89 33.33 37.78 42.22 46.67 51.11 55.56 602
2.33
2.67
3
3.33
3.67
4
4.33
4.67
5Caracteristica p2=f(Uc) pentru p1=5bar
presiunea de comanda
pres
iune
a re
glat
a
p2
U
Fig.6. Characteristic p2 = f(Uc) for p1=5 bar
20 24.44 28.89 33.33 37.78 42.22 46.67 51.11 55.56 601.5
1.72
1.94
2.17
2.39
2.61
2.83
3.06
3.28
3.5Caracteristica p2=f(Uc) pentru p1=4bar
pres
iune
a reg
lata
p2
U
Fig.7. Characteristic p2 = f(Uc) for p1=4 bar
4. CONCLUSIONS The piezoelectric pneumatic pressure regulator,
described in this paper is different than a classical proportional regulator, at which the regulated pressures are set in by a manual mechanical command.
In its structure, the regulator has a pilot stage based a nozzle-flap pneumatic circuit, which creates driving pressures p3 depending on the position of the flap – x1 materialized by a piezoelectric actuator, bimorph slide type.
TEHNOLOGIA INOVATIVĂ – Revista „Construcţia de maşini” nr. 3-4 / 2012 56
The study of this circuit, related to real air flowing through the two reference sections (A13 and A30) has allowed us to establish the function p3 = p3(x1) which was brought to the form p3 = p3(Uc) because of the deformation function of the bimorph slide x = x(Uc) and of the structural link x1 = x0 – x.
Although not linear, by using the mathematic model of the suggested regulator we obtained a linear characteristic (fig.5…7), p2 = p2(Uc).
In order to validate the characteristic over an experimental model, we conceived and accomplished a staged (logic) design of such a pressure regulator, which, for a given flow value, has conducted to a nominal dimension corresponding to nominal diameter Dn = 6 mm and has allowed to establish effective values for main structural and functional dimensions.
On the obtained pressure regulator, due to mathematic model development, we produced a theoretical proportional regulation characteristic; its validity will be examined in the near future, on a physical model realized at the dimensions determined in the designing stage.
5. REFERENCES
[1]. Radcenco, Vs., Alexandrescu, N. – Calculul şi proiectarea elementelor şi schemelor pneumatice de automatizare, Editura Tehnică, Bucureşti 1985
[2]. Blackburn, F.F., Reethof, G., - Mecanismes et servomecanismes a fluide sous pression , Tome I, Dunod, Paris, 1966
[3]. Matache, G., Mirea, A. Drumea, P., Enache, I. – Comenzi piezoelectrice in echipamentele de reglare electrohidraulice, HERVEX 2000
[4]. Matache, G., Matache, M., Mirea, A, Drumea, P.,Alexandrescu, N. - Piezoelectric convertor in proportional control of fluid valve – SITME 2000
[5]. Matache, G., Alexandrescu, N., Ilie, I. – Metodă numerică de proiectare şi verificare a actuatorilor piezoelectrici bimorfi – COMEFIM 7, 2004, 27-29 Mai.
[6]. Drumea, P. Matache, G., Comes, M., Marin, M., - Regulator de presiune piezoelectric - Brevet de invenţie nr. 118036/2002
[7]. Studiu tehnic – contract 157/2003 – Regulator de presiune pneumatic piezoelectric – IHP 2003
[8]. Dragos Ion Guta, Teodor Costinel, Popescu, Catalin Dumitrescu - Determination of the actuation force of spool valves with zero coverage, HIDRAULICA nr. 2 / 2010, pp. 33-38
Quick Info
Call for Papers: The International Congress on Engineering and Technology ICET 2013 From: RISE Association - international multidisciplinary professional not-for-profit association Venue: Dubrovnik / Croatia Website: http://www.i-cet.org Deadlines: Paper abstract: as soon as is possible, please (at http://www.i-jet.eu/is) • Camera-Ready Paper: 30th April 2013 • Date of the Congress: 25th -27th June 2013 The ICET 2013 is organized by RISE Association – independent international multidisciplinary professional not-for-profit association - for scientists, researchers, industrial partners, innovators, educators, students and other people interested on Engineering and Technology area. The congress proceedings will be published by RISE Association in hardcopy (ISBN 978-80-87670-07-1) and on CD-ROM (ISBN 978-80-87670-08-8). All the papers shall be cost free published in extended version in a journal of *JET* Group - periodicals focused on the Engineering and Technology area - www.i-jet.eu. The best articles (selected by Scientific Committee) will be published in these journals: TECHNICAL GAZETTE ISSN 1330-3651 referred in SciSearch, Scopus, INSPECT, CSA etc. Manufacturing Technology ISSN 1213-2489 indexed in SciVerse SCOPUS by Elsevier The following events are held as parts of the ICET 2013: • Plenary Sessions of the multidisciplinary International Congress on Engineering and Technologies; • International conference on Progressive Engineering and Technology Applications; • International conference of Recent Achievements in Materials Engineering; • International Conference of Innovative Mechanical Engineering; • International Conference of Education and Training on Engineering and Technology. For submission of paper, please, use http://www.i-jet.eu/is web page.

TEHNOLOGIA INOVATIVĂ – Revista „Construcţia de maşini” nr. 3-4 / 2012
57
RESEARCHES REGARDING MOVEMENT SYNCHRONIZATION OF TWO HYDRAULIC CYLINDERS
FOR LIFTING APPLICATIONS
Radu Radoi1, Gabriela Matache2
1 Hydraulics and Pneumatics Research Institute, Bucharest, ROMANIA, [email protected] 2 Hydraulics and Pneumatics Research Institute, Bucharest, ROMANIA, [email protected]
REZUMAT Utilajele folosite in diferite domenii precum constructiile, industrie, agricultura si domeniul exploatarior forestiere au diferite mecanisme ce trebuiesc actionate simultan de 2 cilindri hidraulici care sa functioneze sincron. In articol se prezinta cateva metode de sincronizare a cilindrilor hidraulici prin utilizarea unor divizoare de debit si elemente de comanda, precum si un sistem cu supape electro- hidraulice proportionale directionale si cilindri hidraulici prevăzuti cu LVDT pentru ridicarea unei platforme. Schemele pot fi aplicate pentru actionarea unor platforme, a bratului unei automacarale, a traversei unei prese sau pentru diferite mecanisme din industria de prelucrare a lemnului.
ABSTRACT Machinery used in various fields such as construction, industry, agriculture and logging are the different mechanisms that must be operated simultaneously by two hydraulic cylinders which operate synchronously. The article presents some methods to synchronize hydraulic cylinders by using flow dividers and control elements, as well as the scheme with electro hydraulic proportional directional valves and hydraulic cylinders for lifting LVDT provided with the platform. Schemes can be applied for driving rigs a crane arm, a cross pressures and different mechanisms for the woodworking industry.
KEYWORDS: hydraulic cylinder, synchronization, error correction, flow dividing CUVINTE CHEIE: cilindru hidraulic, sincronizare, corectie erori, divizare debit
1. INTRODUCERE /
INTRODUCTION Many machines used in various technical fields
such as constructions, industry or agriculture use different types of mechanisms and transmissions that use hydraulic cylinders that must be operated synchronously. In practice, the load is distributed between the two cylinders and can be unbalanced or the supply circuits of the cylinders may have different lengths and couplings that induce different power losses in each cylinder. Another factor that causes loss of synchronization is the mechanical efficiency of each cylinder, caused by frictions in sealing systems.
The authors present in this paper few synchronization methods based on flow dividers and control equipment.
Given diagrams can be used in various industrial hydraulic installations such as lifting platforms, control system for a crane’s arm or some wood processing installations.
2. CYLINDERS SYNCHRONIZATION WITH ERROR CORRECTION
The schematic given in Figure 1 is showing a method of synchronizing the movement of two independent differential hydraulic cylinders that contains two 4/3 directional valves, two discharge valves and a flow divider. In this diagram, each output of the flow divider supply through the directional valves a single hydraulic cylinder.
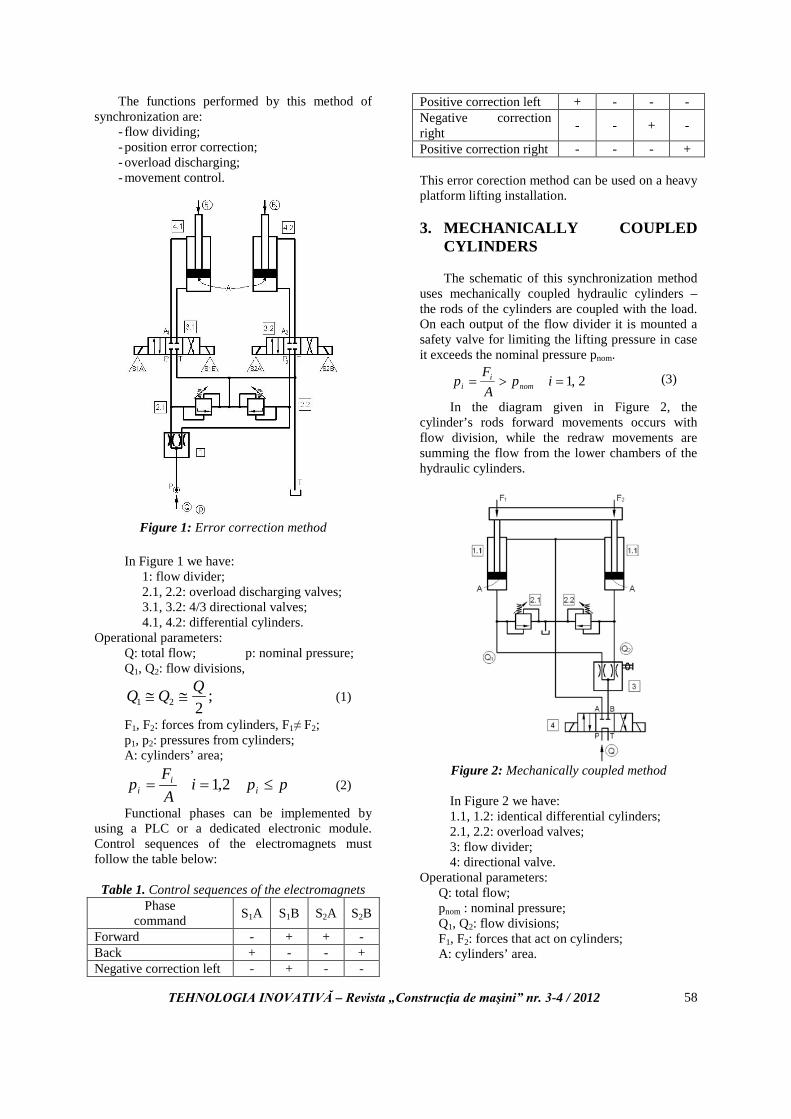
TEHNOLOGIA INOVATIVĂ – Revista „Construcţia de maşini” nr. 3-4 / 2012
58
The functions performed by this method of synchronization are:
- flow dividing; - position error correction; - overload discharging; - movement control.
Figure 1: Error correction method
In Figure 1 we have:
1: flow divider; 2.1, 2.2: overload discharging valves; 3.1, 3.2: 4/3 directional valves; 4.1, 4.2: differential cylinders.
Operational parameters: Q: total flow; p: nominal pressure; Q1, Q2: flow divisions,
221QQQ ≅≅ ; (1)
F1, F2: forces from cylinders, F1≠ F2; p1, p2: pressures from cylinders; A: cylinders’ area;
ppiAF
p ii
i ≤== 2,1 (2)
Functional phases can be implemented by using a PLC or a dedicated electronic module. Control sequences of the electromagnets must follow the table below: Table 1. Control sequences of the electromagnets
Phase command S1A S1B S2A S2B
Forward - + + - Back + - - + Negative correction left - + - -
Positive correction left + - - - Negative correction right - - + -
Positive correction right - - - + This error corection method can be used on a heavy platform lifting installation. 3. MECHANICALLY COUPLED
CYLINDERS
The schematic of this synchronization method uses mechanically coupled hydraulic cylinders – the rods of the cylinders are coupled with the load. On each output of the flow divider it is mounted a safety valve for limiting the lifting pressure in case it exceeds the nominal pressure pnom.
2,1=>= ipAF
p nomi
i (3)
In the diagram given in Figure 2, the cylinder’s rods forward movements occurs with flow division, while the redraw movements are summing the flow from the lower chambers of the hydraulic cylinders.
Figure 2: Mechanically coupled method
In Figure 2 we have:
1.1, 1.2: identical differential cylinders; 2.1, 2.2: overload valves; 3: flow divider; 4: directional valve. Operational parameters:
Q: total flow; pnom : nominal pressure; Q1, Q2: flow divisions; F1, F2: forces that act on cylinders; A: cylinders’ area.
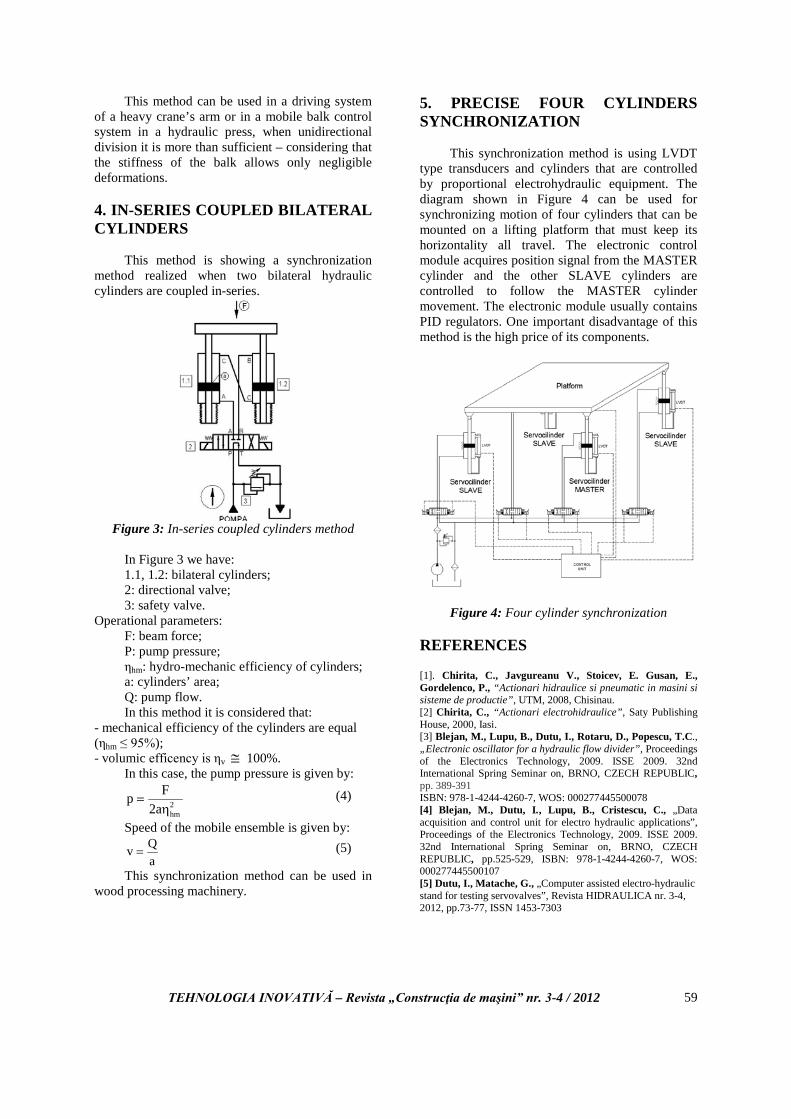
TEHNOLOGIA INOVATIVĂ – Revista „Construcţia de maşini” nr. 3-4 / 2012
59
This method can be used in a driving system of a heavy crane’s arm or in a mobile balk control system in a hydraulic press, when unidirectional division it is more than sufficient – considering that the stiffness of the balk allows only negligible deformations. 4. IN-SERIES COUPLED BILATERAL CYLINDERS
This method is showing a synchronization method realized when two bilateral hydraulic cylinders are coupled in-series.
Figure 3: In-series coupled cylinders method
In Figure 3 we have:
1.1, 1.2: bilateral cylinders; 2: directional valve; 3: safety valve. Operational parameters:
F: beam force; P: pump pressure; ηhm: hydro-mechanic efficiency of cylinders; a: cylinders’ area; Q: pump flow.
In this method it is considered that: - mechanical efficiency of the cylinders are equal (ηhm ≤ 95%); - volumic efficency is ηv ≅ 100%.
In this case, the pump pressure is given by:
2hma2
Fpη
= (4)
Speed of the mobile ensemble is given by:
aQv = (5)
This synchronization method can be used in wood processing machinery.
5. PRECISE FOUR CYLINDERS SYNCHRONIZATION
This synchronization method is using LVDT type transducers and cylinders that are controlled by proportional electrohydraulic equipment. The diagram shown in Figure 4 can be used for synchronizing motion of four cylinders that can be mounted on a lifting platform that must keep its horizontality all travel. The electronic control module acquires position signal from the MASTER cylinder and the other SLAVE cylinders are controlled to follow the MASTER cylinder movement. The electronic module usually contains PID regulators. One important disadvantage of this method is the high price of its components.
Figure 4: Four cylinder synchronization REFERENCES [1]. Chirita, C., Javgureanu V., Stoicev, E. Gusan, E., Gordelenco, P., “Actionari hidraulice si pneumatic in masini si sisteme de productie”, UTM, 2008, Chisinau. [2] Chirita, C., “Actionari electrohidraulice”, Saty Publishing House, 2000, Iasi. [3] Blejan, M., Lupu, B., Dutu, I., Rotaru, D., Popescu, T.C., „Electronic oscillator for a hydraulic flow divider”, Proceedings of the Electronics Technology, 2009. ISSE 2009. 32nd International Spring Seminar on, BRNO, CZECH REPUBLIC, pp. 389-391 ISBN: 978-1-4244-4260-7, WOS: 000277445500078 [4] Blejan, M., Dutu, I., Lupu, B., Cristescu, C., „Data acquisition and control unit for electro hydraulic applications”, Proceedings of the Electronics Technology, 2009. ISSE 2009. 32nd International Spring Seminar on, BRNO, CZECH REPUBLIC, pp.525-529, ISBN: 978-1-4244-4260-7, WOS: 000277445500107 [5] Dutu, I., Matache, G., „Computer assisted electro-hydraulic stand for testing servovalves”, Revista HIDRAULICA nr. 3-4, 2012, pp.73-77, ISSN 1453-7303
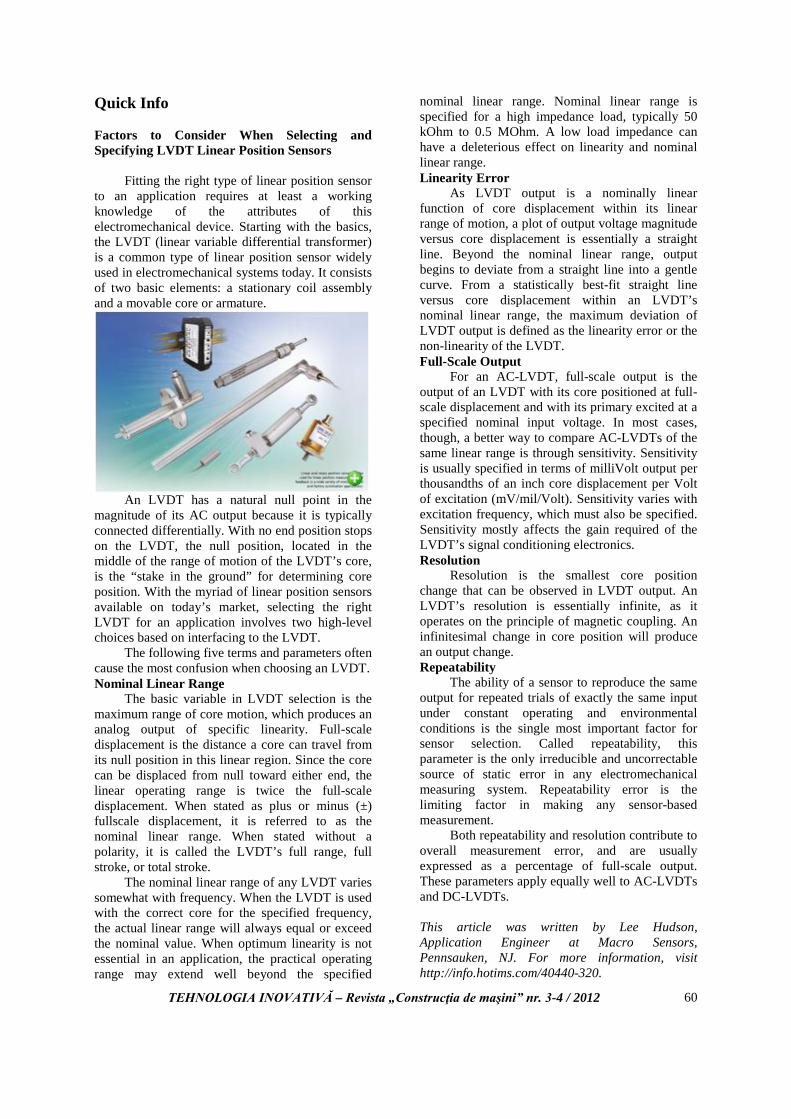
TEHNOLOGIA INOVATIVĂ – Revista „Construcţia de maşini” nr. 3-4 / 2012
60
Quick Info Factors to Consider When Selecting and Specifying LVDT Linear Position Sensors
Fitting the right type of linear position sensor to an application requires at least a working knowledge of the attributes of this electromechanical device. Starting with the basics, the LVDT (linear variable differential transformer) is a common type of linear position sensor widely used in electromechanical systems today. It consists of two basic elements: a stationary coil assembly and a movable core or armature.
An LVDT has a natural null point in the
magnitude of its AC output because it is typically connected differentially. With no end position stops on the LVDT, the null position, located in the middle of the range of motion of the LVDT’s core, is the “stake in the ground” for determining core position. With the myriad of linear position sensors available on today’s market, selecting the right LVDT for an application involves two high-level choices based on interfacing to the LVDT.
The following five terms and parameters often cause the most confusion when choosing an LVDT. Nominal Linear Range
The basic variable in LVDT selection is the maximum range of core motion, which produces an analog output of specific linearity. Full-scale displacement is the distance a core can travel from its null position in this linear region. Since the core can be displaced from null toward either end, the linear operating range is twice the full-scale displacement. When stated as plus or minus (±) fullscale displacement, it is referred to as the nominal linear range. When stated without a polarity, it is called the LVDT’s full range, full stroke, or total stroke.
The nominal linear range of any LVDT varies somewhat with frequency. When the LVDT is used with the correct core for the specified frequency, the actual linear range will always equal or exceed the nominal value. When optimum linearity is not essential in an application, the practical operating range may extend well beyond the specified
nominal linear range. Nominal linear range is specified for a high impedance load, typically 50 kOhm to 0.5 MOhm. A low load impedance can have a deleterious effect on linearity and nominal linear range. Linearity Error
As LVDT output is a nominally linear function of core displacement within its linear range of motion, a plot of output voltage magnitude versus core displacement is essentially a straight line. Beyond the nominal linear range, output begins to deviate from a straight line into a gentle curve. From a statistically best-fit straight line versus core displacement within an LVDT’s nominal linear range, the maximum deviation of LVDT output is defined as the linearity error or the non-linearity of the LVDT. Full-Scale Output
For an AC-LVDT, full-scale output is the output of an LVDT with its core positioned at full-scale displacement and with its primary excited at a specified nominal input voltage. In most cases, though, a better way to compare AC-LVDTs of the same linear range is through sensitivity. Sensitivity is usually specified in terms of milliVolt output per thousandths of an inch core displacement per Volt of excitation (mV/mil/Volt). Sensitivity varies with excitation frequency, which must also be specified. Sensitivity mostly affects the gain required of the LVDT’s signal conditioning electronics. Resolution
Resolution is the smallest core position change that can be observed in LVDT output. An LVDT’s resolution is essentially infinite, as it operates on the principle of magnetic coupling. An infinitesimal change in core position will produce an output change. Repeatability
The ability of a sensor to reproduce the same output for repeated trials of exactly the same input under constant operating and environmental conditions is the single most important factor for sensor selection. Called repeatability, this parameter is the only irreducible and uncorrectable source of static error in any electromechanical measuring system. Repeatability error is the limiting factor in making any sensor-based measurement.
Both repeatability and resolution contribute to overall measurement error, and are usually expressed as a percentage of full-scale output. These parameters apply equally well to AC-LVDTs and DC-LVDTs. This article was written by Lee Hudson, Application Engineer at Macro Sensors, Pennsauken, NJ. For more information, visit http://info.hotims.com/40440-320.
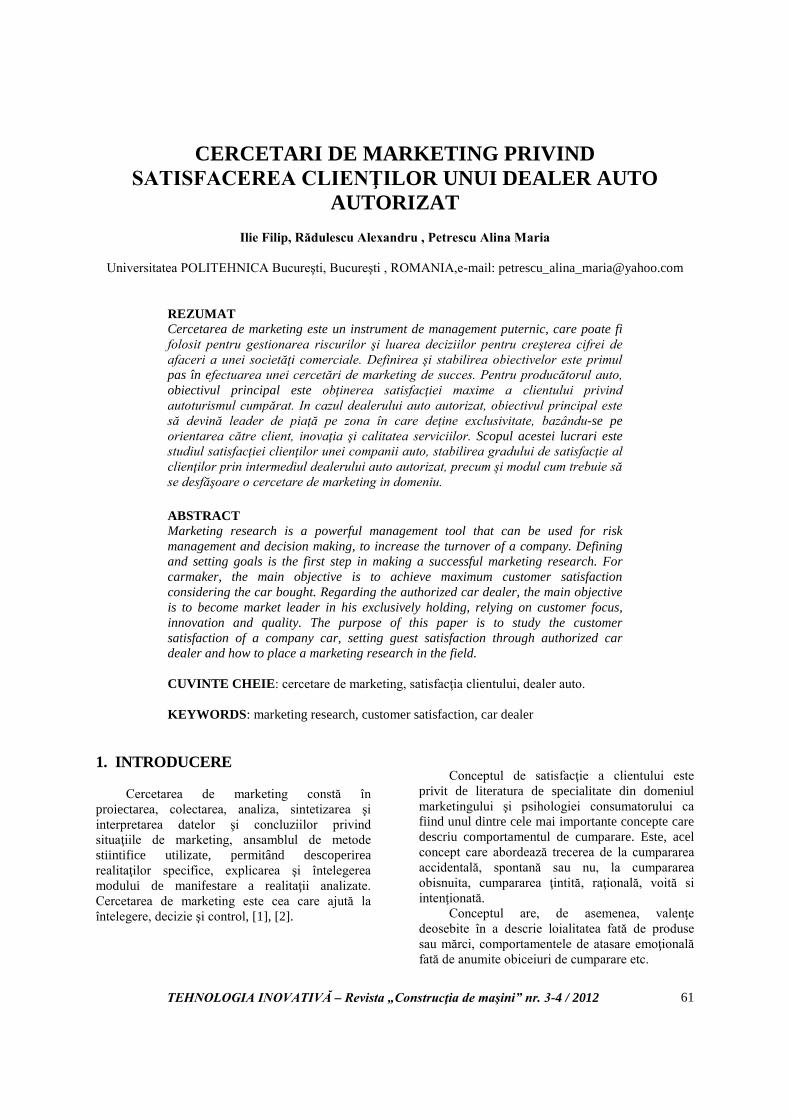
TEHNOLOGIA INOVATIVĂ – Revista „Construcţia de maşini” nr. 3-4 / 2012
61
CERCETARI DE MARKETING PRIVIND SATISFACEREA CLIENŢILOR UNUI DEALER AUTO
AUTORIZAT
Ilie Filip, Rădulescu Alexandru , Petrescu Alina Maria
Universitatea POLITEHNICA Bucureşti, Bucureşti , ROMANIA,e-mail: [email protected]
REZUMAT Cercetarea de marketing este un instrument de management puternic, care poate fi folosit pentru gestionarea riscurilor şi luarea deciziilor pentru creşterea cifrei de afaceri a unei societăţi comerciale. Definirea şi stabilirea obiectivelor este primul pas în efectuarea unei cercetări de marketing de succes. Pentru producătorul auto, obiectivul principal este obţinerea satisfacţiei maxime a clientului privind autoturismul cumpărat. In cazul dealerului auto autorizat, obiectivul principal este să devină leader de piaţă pe zona în care deţine exclusivitate, bazându-se pe orientarea către client, inovaţia şi calitatea serviciilor. Scopul acestei lucrari este studiul satisfacţiei clienţilor unei companii auto, stabilirea gradului de satisfacţie al clienţilor prin intermediul dealerului auto autorizat, precum şi modul cum trebuie să se desfăşoare o cercetare de marketing in domeniu. ABSTRACT Marketing research is a powerful management tool that can be used for risk management and decision making, to increase the turnover of a company. Defining and setting goals is the first step in making a successful marketing research. For carmaker, the main objective is to achieve maximum customer satisfaction considering the car bought. Regarding the authorized car dealer, the main objective is to become market leader in his exclusively holding, relying on customer focus, innovation and quality. The purpose of this paper is to study the customer satisfaction of a company car, setting guest satisfaction through authorized car dealer and how to place a marketing research in the field.
CUVINTE CHEIE: cercetare de marketing, satisfacţia clientului, dealer auto.
KEYWORDS: marketing research, customer satisfaction, car dealer
1. INTRODUCERE
Cercetarea de marketing constă în
proiectarea, colectarea, analiza, sintetizarea şi interpretarea datelor şi concluziilor privind situaţiile de marketing, ansamblul de metode stiintifice utilizate, permitând descoperirea realitaţilor specifice, explicarea şi întelegerea modului de manifestare a realitaţii analizate. Cercetarea de marketing este cea care ajută la întelegere, decizie şi control, [1], [2].
Conceptul de satisfacţie a clientului este
privit de literatura de specialitate din domeniul marketingului şi psihologiei consumatorului ca fiind unul dintre cele mai importante concepte care descriu comportamentul de cumparare. Este, acel concept care abordează trecerea de la cumpararea accidentală, spontană sau nu, la cumpararea obisnuita, cumpararea ţintită, raţională, voită si intenţionată.
Conceptul are, de asemenea, valenţe deosebite în a descrie loialitatea fată de produse sau mărci, comportamentele de atasare emoţională fată de anumite obiceiuri de cumparare etc.
TEHNOLOGIA INOVATIVĂ – Revista „Construcţia de maşini” nr. 3-4 / 2012
62
Satisfacţia clientului este un concept extrem de complex, care variază foarte mult de la individ la individ. Acesta ia în calcul nu doar performanţele, calitatea, fiabilitatea, costurile de operare şi relaţia cu anumite firme care realizează mentenanţa şi service-ul, ci şi aşteptările clientului de la produsul achiziţionat, [3]. Marii gânditori economici nu s-au preocupat prea mult de găsirea unei definiţii adecvate conceptului de satisfacţie a clientului. Deşi au fost mai multe încercari de definire a acestui concept se pot sintetiza trei caracteristici comune: a) satisfacţia clientului este un răspuns emoţional sau cognitiv b) răspunsul este axat asupra aşteptarilor, produsului, experienţei de cumparare; c) răspunsul se manifestă la un anumit moment de timp (după cumparare, după alegere, pe baza unei experienţe cumulate în timp).
În anul 2003 Kotler definea conceptul de satisfacţie a clienţilor drept "plăcerea pe care o resimte cineva atunci când işi compară impresia asupra performanţei unui produs cu aşteptarile pe care le avea înainte să îl cumpere", [4]. În anul 1969 Howard şi Sheth defineau conceptul de satisfaţie a clienţilor drept " starea cognitivă a cumpărătorului de a fi recompensat adecvat sau inadecvat pentru sacrificiile făcute", [4]. În anul 1977 Oliver definea conceptul de satisfacţie ca fiind "răspunsul consumatorului privind gradul de împlinire: ca o judecată care confirmă că produsul sau serviciul a oferit un anumit nivel de implinire", [4] Problema care se ridică este aceea că nici una dintre definiţiile elaborate în literatura de specialitate nu întruneşte întru-totul înţelesul teoretic al unei definiţii nominale. Cu toate acestea structura generică este evidentă, satisfacţia este un răspuns corespunzător unei anumite cumpărări sau situaţii de consum şi care se manifestă la un anumit moment de timp, [5].
Astfel, in aceasta lucrare se prezinta modul cum trebuie sa se desfasoare cercetarea de marketing pentru satisfacerea clientilor de catre un dealer auto, autorizat si care sunt asteptarile clientilor. 2. STUDIUL DE PIAŢĂ PENTRU SATISFACEREA CLIENŢILOR
2.1 Conţinutul, caracteristicile si factorii de satisfacţie ai clientilor Pana acum cativa ani, produsul si pretul erau factori de diferentiere dintre companiile concurente in cadrul aceluiasi sector. Deoarece produsele au ajuns la o pozitie similara privind cel mai inalt grad de tehnologie, fortand
ajustarea preturilor la un grad de subzistenta minima a poducatorilor si distribuitorilor, factorul service a devenit elementul cel mai relevant pentru client in timpul analizei sale privind alegerea marcii si a dealerului cu care va colabora. In sectorul auto, caracteristicile vehiculelor privind designul si tehnologia avansata, si preturile in cadrul aceluiasi segment variaza doar cu cateva sute de euro intre ele. Totusi, experienta clientilor privind calitatea activitatilor de “after sales” face diferentierea intre marci, si mai ales intre service-uri. Specialişii din domeniu estimează ca, criza din piaţa auto va genera efecte pozitive în ceea ce priveşte oferta de service, preţurile şi durata de aşteptare în unităţile specializate urmând să devină o miză esenţială pe o piaţă unde cererea este tot mai mică. Specialiştii în piaţa auto spun că astfel de probleme arată, în fapt, cât de gravă este criza." În condiţiile în care clientii au început să vină mai rar la service, iar vânzările de poliţe de asigurare au scăzut odată cu îngheţarea vânzărilor şi în contextul în care mulţi au renunţat la poliţele casco, este de aşteptat ca aceste probleme să se acutizeze", spune analistul auto Marius Carp. "Câştigatorii crizei ar trebui să fie clienţii care, în contextul creşterii concurenţei în domeniu, ar trebui să primească servicii mai bune şi mai ieftine", a mai spus analistul. Potrivit unui studiu realizat de PricewaterhouseCoopers™ (cea mai mare companie de servicii profesionale, de consultanţă şi audit din lume şi una dintre cele mai mari companii private) în rândul dealerilor auto din Europa Centrala şi de Est, dat publicităţii, din criza fără precedent din piaţa auto vor ieşi cu bine acei dealeri care îşi vor adapta structura afacerii, adică se vor baza mai mult pe servicii şi mai puţin pe vânzările de maşini noi. Astfel, adaosul comercial din preţul pieselor de schimb, preţul orei de service, numarul maşinilor deservite vor conta din ce în ce mai mult. Daca vom asista la o continuare a reducerilor de preţuri, este de aştept ca accentul să se mute tot mai puternic pe serviciile adiacente, ce au rolul să fidelizeze clientela. Timpul de aşteptare în service se va reduce, pentru ca proprietarii vor fi interesaţi să ruleze cât mai multe maşini, iar preţul pieselor de schimb ar putea să scadă până la nivelul celor din Occident. Rezultatele studiului PricewaterhouseCoopers™ arată că majoritatea dealerilor au început să exploreze noi idei de afaceri, cum ar fi tranzacţiile în sistem buy-back, serviciile de închiriere cu ora, sau au inclus noi tipuri de servicii în oferta lor. Pe o piaţă care a pierdut din vânzări în anii de criză, dealerii auto încearcă să atragă clienţii lansând noi oferte care să compenseze primele de casare.
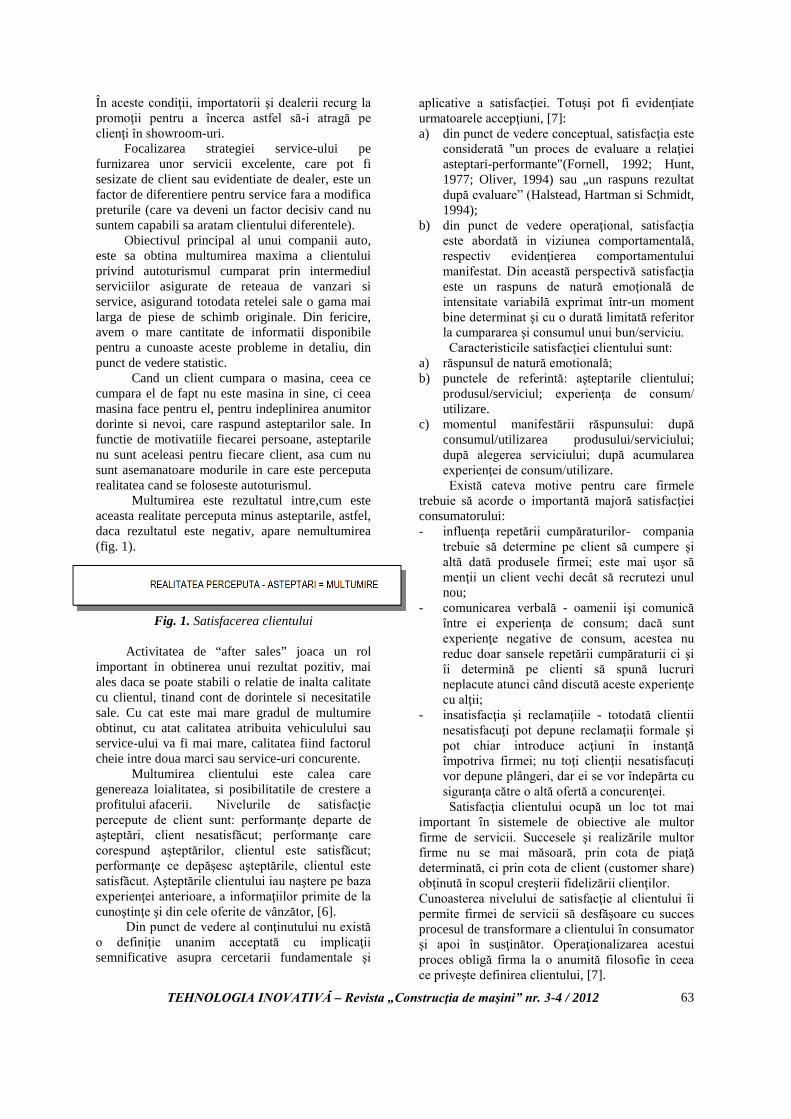
TEHNOLOGIA INOVATIVĂ – Revista „Construcţia de maşini” nr. 3-4 / 2012
63
În aceste condiţii, importatorii şi dealerii recurg la promoţii pentru a încerca astfel să-i atragă pe clienţi în showroom-uri.
Focalizarea strategiei service-ului pe furnizarea unor servicii excelente, care pot fi sesizate de client sau evidentiate de dealer, este un factor de diferentiere pentru service fara a modifica preturile (care va deveni un factor decisiv cand nu suntem capabili sa aratam clientului diferentele).
Obiectivul principal al unui companii auto, este sa obtina multumirea maxima a clientului privind autoturismul cumparat prin intermediul serviciilor asigurate de reteaua de vanzari si service, asigurand totodata retelei sale o gama mai larga de piese de schimb originale. Din fericire, avem o mare cantitate de informatii disponibile pentru a cunoaste aceste probleme in detaliu, din punct de vedere statistic. Cand un client cumpara o masina, ceea ce cumpara el de fapt nu este masina in sine, ci ceea masina face pentru el, pentru indeplinirea anumitor dorinte si nevoi, care raspund asteptarilor sale. In functie de motivatiile fiecarei persoane, asteptarile nu sunt aceleasi pentru fiecare client, asa cum nu sunt asemanatoare modurile in care este perceputa realitatea cand se foloseste autoturismul. Multumirea este rezultatul intre,cum este aceasta realitate perceputa minus asteptarile, astfel, daca rezultatul este negativ, apare nemultumirea (fig. 1).
Fig. 1. Satisfacerea clientului Activitatea de “after sales” joaca un rol
important in obtinerea unui rezultat pozitiv, mai ales daca se poate stabili o relatie de inalta calitate cu clientul, tinand cont de dorintele si necesitatile sale. Cu cat este mai mare gradul de multumire obtinut, cu atat calitatea atribuita vehiculului sau service-ului va fi mai mare, calitatea fiind factorul cheie intre doua marci sau service-uri concurente. Multumirea clientului este calea care genereaza loialitatea, si posibilitatile de crestere a profitului afacerii. Nivelurile de satisfacţie percepute de client sunt: performanţe departe de aşteptări, client nesatisfăcut; performanţe care corespund aşteptărilor, clientul este satisfăcut; performanţe ce depăşesc aşteptările, clientul este satisfăcut. Aşteptările clientului iau naştere pe baza experienţei anterioare, a informaţiilor primite de la cunoştinţe şi din cele oferite de vânzător, [6]. Din punct de vedere al conţinutului nu există o definiţie unanim acceptată cu implicaţii semnificative asupra cercetarii fundamentale şi
aplicative a satisfacţiei. Totuşi pot fi evidenţiate urmatoarele accepţiuni, [7]: a) din punct de vedere conceptual, satisfacţia este
considerată "un proces de evaluare a relaţiei asteptari-performante"(Fornell, 1992; Hunt, 1977; Oliver, 1994) sau „un raspuns rezultat după evaluare” (Halstead, Hartman si Schmidt, 1994);
b) din punct de vedere operaţional, satisfacţia este abordată in viziunea comportamentală, respectiv evidenţierea comportamentului manifestat. Din această perspectivă satisfacţia este un raspuns de natură emoţională de intensitate variabilă exprimat într-un moment bine determinat şi cu o durată limitată referitor la cumpararea şi consumul unui bun/serviciu.
Caracteristicile satisfacţiei clientului sunt: a) răspunsul de natură emotională; b) punctele de referintă: aşteptarile clientului;
produsul/serviciul; experienţa de consum/ utilizare.
c) momentul manifestării răspunsului: după consumul/utilizarea produsului/serviciului; după alegerea serviciului; după acumularea experienţei de consum/utilizare.
Există cateva motive pentru care firmele trebuie să acorde o importantă majoră satisfacţiei consumatorului: - influenţa repetării cumpăraturilor- compania
trebuie să determine pe client să cumpere şi altă dată produsele firmei; este mai uşor să menţii un client vechi decât să recrutezi unul nou;
- comunicarea verbală - oamenii işi comunică între ei experienţa de consum; dacă sunt experienţe negative de consum, acestea nu reduc doar sansele repetării cumpăraturii ci şi îi determină pe clienti să spună lucruri neplacute atunci când discută aceste experienţe cu alţii;
- insatisfacţia şi reclamaţiile - totodată clientii nesatisfacuţi pot depune reclamaţii formale şi pot chiar introduce acţiuni în instanţă împotriva firmei; nu toţi clienţii nesatisfacuţi vor depune plângeri, dar ei se vor îndepărta cu siguranţa către o altă ofertă a concurenţei.
Satisfacţia clientului ocupă un loc tot mai important în sistemele de obiective ale multor firme de servicii. Succesele şi realizările multor firme nu se mai măsoară, prin cota de piaţă determinată, ci prin cota de client (customer share) obţinută în scopul creşterii fidelizării clienţilor. Cunoasterea nivelului de satisfacţie al clientului îi permite firmei de servicii să desfăşoare cu succes procesul de transformare a clientului în consumator şi apoi în susţinător. Operaţionalizarea acestui proces obligă firma la o anumită filosofie în ceea ce priveşte definirea clientului, [7].
TEHNOLOGIA INOVATIVĂ – Revista „Construcţia de maşini” nr. 3-4 / 2012
64
În domeniul managementului reclamaţiilor există 3 standarde de calitate care presupun, [8]: - prevenirea reclamaţiilor prin utilizarea unui
cod de conduită adecvat pentru satisfacţia clientului;
- gestionarea reclamaţiilor interne, de exemplu atunci când sunt primite exprimări ale insatisfacţiei;
- soluţionarea externă a litigiilor pentru situaţiile în care reclamaţiile nu pot fi tratate satisfacator în interiorul organizaţiilor.
Întotdeauna ne intrebăm oare ce determină satisfacţia clientilor. Aproape în toate carţile de specialitate este descris cel mai important factor al satisfacţiei care este percepţia clientilor despre performanţele produsului în timpul consumului. În anul 1980, Richard Oliver a afirmat că satisfacţia depinde de o comparaţie dintre aşteptarile pre-cumparare şi rezultatele de după cumparare, [9]. Consumatorii cumpară un produs având aşteptari legate de îndeplinirea în realitate a unor performanţe, performanţe care pot fi împarţite in 3 categorii: - performanţe echitabile- performanţa pe care
clientul trebuie să o recepteze în schimbul eforturilor de cumparare si utilizare;
- performanţe ideale- care sunt denumite si, nivelul optim al performanţei;
- performanţe asteptate - rezultatul logic al procesului de evaluare al alternativelor, aşa se determină satisfacţia/insatisfacţia clientului.
În vânzare şi servicii sunt 4 factori majori care influenţează percepţia clientului: a) imaginea companiei; b) starea de spirit a clientului; c) atitudinea şi comportamentul salariaţiilor care intră in contact cu clientul; d) caracteristicile serviciilor oferite. a) Imaginea companiei este o părere
preconcepută a clientului asupra ceea ce va găsi când va cumpara de acolo, [10]. Clienţii işi formează în minte imaginea asupra companiei pe baza tuturor informaţiilor pe care le acumulează despre ea. Imaginea pe care o formăm clientului trebuie să fie cat mai aproape de realitate. Orice detaliu este înregistrat în mintea clientului şi generează un plus sau un minus de imagine. Dacă suma înregistrarilor este pozitivă atunci clientul se va duce să cumpere de acolo, [11].
b) Starea emoţională a clientului - dacă un client nu are o stare de spirit prea bună acesta devine agresiv în schimb ce un client aflat într-o stare de spirit bună este mai îngaduitor, dar si un client bine dispus poate deveni nervos din cauza unui detaliu. In acest caz personalul cu care vine in contact cu clientul, trebuie să ştie să interacţioneze cu el chiar dacă clientul a venit nervos, [10].
c) Atitudinea şi comportamentul personalului - cel mai important lucru într-o companie este ca patronul să fie interesat de satisfacerea clienţilor, acest lucru reflectându-se în atitudinea personalului faţa de client. Personalul trebuie să fie foarte bine instruit pe toate nivelele ierarhice din piramida organizaţională a companiei, iar cel care are contact direct cu publicul, este foarte important sa aibe un comportament atractiv, cu zâmbetul pe buze, deoarece îi poate aduce şi clientului zambetul pe buze şi acest lucru să conducă implicit la cumpararea unui produs.
d) Caracteristicile serviciilor - serviciile au constituit obiect de studiu de “sine stătător” care constituie un fenomen major al zilelor noastre. Există o cerere puternică de servicii corelată
cu evoluţia societăţii în general şi cu ridicarea nivelului de trai în special, [12]. Definiţia dată de Asociaţia Americană de Marketing: „serviciile reprezintă activităţi, beneficii sau utilităţi care sunt oferite pe piaţă sau prestate în asociere cu vânzarea unui bun material” este sugestiva, [13].
2.2 Conceptul de calitate al bunurilor şi serviciilor În general calitatea este vazută ca fiind capacitatea produsului sau serviciului de a satisface nevoile clientului. În sectorul serviciilor, calitatea poate fi definită ca rezultat al comparaţiei dintre serviciul/produsul dorit de client şi serviciul/produsul primit sau altfel spus, masura în care serviciul prestat corespunde aşteptarilor clientului, [14]. Deci pentru a aprecia un produs/serviciu, clientul compară ceea ce asteaptă de la serviciu/produs cu experienţa pe care o are in timpul consumului. Conform ISO 9000, referitor la terminologia calitaţii, aceasta reprezintă "o mulţime de proprietaţi şi caracteristici ale unui produs/serviciu care îi conferă capacitatea de a satisface exigenţe explicite sau implicite". Asteptarile (dorinţele şi necesitaţile) clientilor reprezintă elemente fundamentale pe care se bazează calitatea unui bun sau serviciu. Aşteptarile clientilor sunt determinate de experienţele anterioare, comunicaţiile personale în legatură cu produsul, serviciul, exigenţele personale şi informaţiile externe transmise de firma ofertantă (v. Fig. 2), [15]. Întregul set al factorilor care afectează calitatea serviciilor şi produselor (factori tehnici, administrativi şi umani) trebuie orientat spre reducerea, eliminarea şi cel mai important, prevenirea deficienţelor de calitate. Pentru a obţine maximul de eficacitate şi pentru a satisface aşteptarile clientilor, este esenţial ca
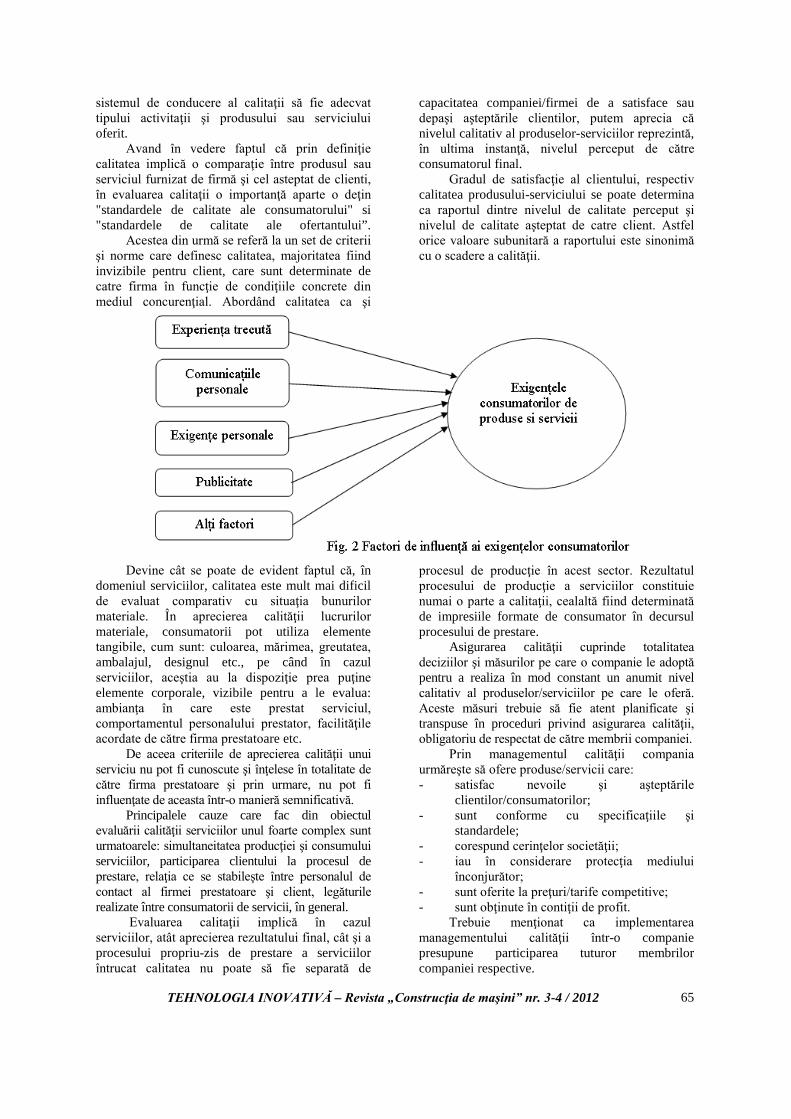
TEHNOLOGIA INOVATIVĂ – Revista „Construcţia de maşini” nr. 3-4 / 2012
65
sistemul de conducere al calitaţii să fie adecvat tipului activitaţii şi produsului sau serviciului oferit. Avand în vedere faptul că prin definiţie calitatea implică o comparaţie între produsul sau serviciul furnizat de firmă şi cel asteptat de clienti, în evaluarea calitaţii o importanţă aparte o deţin "standardele de calitate ale consumatorului" si "standardele de calitate ale ofertantului”. Acestea din urmă se referă la un set de criterii şi norme care definesc calitatea, majoritatea fiind invizibile pentru client, care sunt determinate de catre firma în funcţie de condiţiile concrete din mediul concurenţial. Abordând calitatea ca şi
capacitatea companiei/firmei de a satisface sau depaşi aşteptările clientilor, putem aprecia că nivelul calitativ al produselor-serviciilor reprezintă, în ultima instanţă, nivelul perceput de către consumatorul final.
Gradul de satisfacţie al clientului, respectiv calitatea produsului-serviciului se poate determina ca raportul dintre nivelul de calitate perceput şi nivelul de calitate aşteptat de catre client. Astfel orice valoare subunitară a raportului este sinonimă cu o scadere a calităţii.
Devine cât se poate de evident faptul că, în domeniul serviciilor, calitatea este mult mai dificil de evaluat comparativ cu situaţia bunurilor materiale. În aprecierea calităţii lucrurilor materiale, consumatorii pot utiliza elemente tangibile, cum sunt: culoarea, mărimea, greutatea, ambalajul, designul etc., pe când în cazul serviciilor, aceştia au la dispoziţie prea puţine elemente corporale, vizibile pentru a le evalua: ambianţa în care este prestat serviciul, comportamentul personalului prestator, facilităţile acordate de către firma prestatoare etc.
De aceea criteriile de aprecierea calităţii unui serviciu nu pot fi cunoscute şi înţelese în totalitate de către firma prestatoare şi prin urmare, nu pot fi influenţate de aceasta într-o manieră semnificativă. Principalele cauze care fac din obiectul evaluării calităţii serviciilor unul foarte complex sunt urmatoarele: simultaneitatea producţiei şi consumului serviciilor, participarea clientului la procesul de prestare, relaţia ce se stabileşte între personalul de contact al firmei prestatoare şi client, legăturile realizate între consumatorii de servicii, în general. Evaluarea calitaţii implică în cazul serviciilor, atât aprecierea rezultatului final, cât şi a procesului propriu-zis de prestare a serviciilor întrucat calitatea nu poate să fie separată de
procesul de producţie în acest sector. Rezultatul procesului de producţie a serviciilor constituie numai o parte a calitaţii, cealaltă fiind determinată de impresiile formate de consumator în decursul procesului de prestare. Asigurarea calităţii cuprinde totalitatea deciziilor şi măsurilor pe care o companie le adoptă pentru a realiza în mod constant un anumit nivel calitativ al produselor/serviciilor pe care le oferă. Aceste măsuri trebuie să fie atent planificate şi transpuse în proceduri privind asigurarea calităţii, obligatoriu de respectat de către membrii companiei. Prin managementul calităţii compania urmăreşte să ofere produse/servicii care: - satisfac nevoile şi aşteptările
clientilor/consumatorilor; - sunt conforme cu specificaţiile şi
standardele; - corespund cerinţelor societăţii; - iau în considerare protecţia mediului
înconjurător; - sunt oferite la preţuri/tarife competitive; - sunt obţinute în contiţii de profit. Trebuie menţionat ca implementarea managementului calităţii într-o companie presupune participarea tuturor membrilor companiei respective.
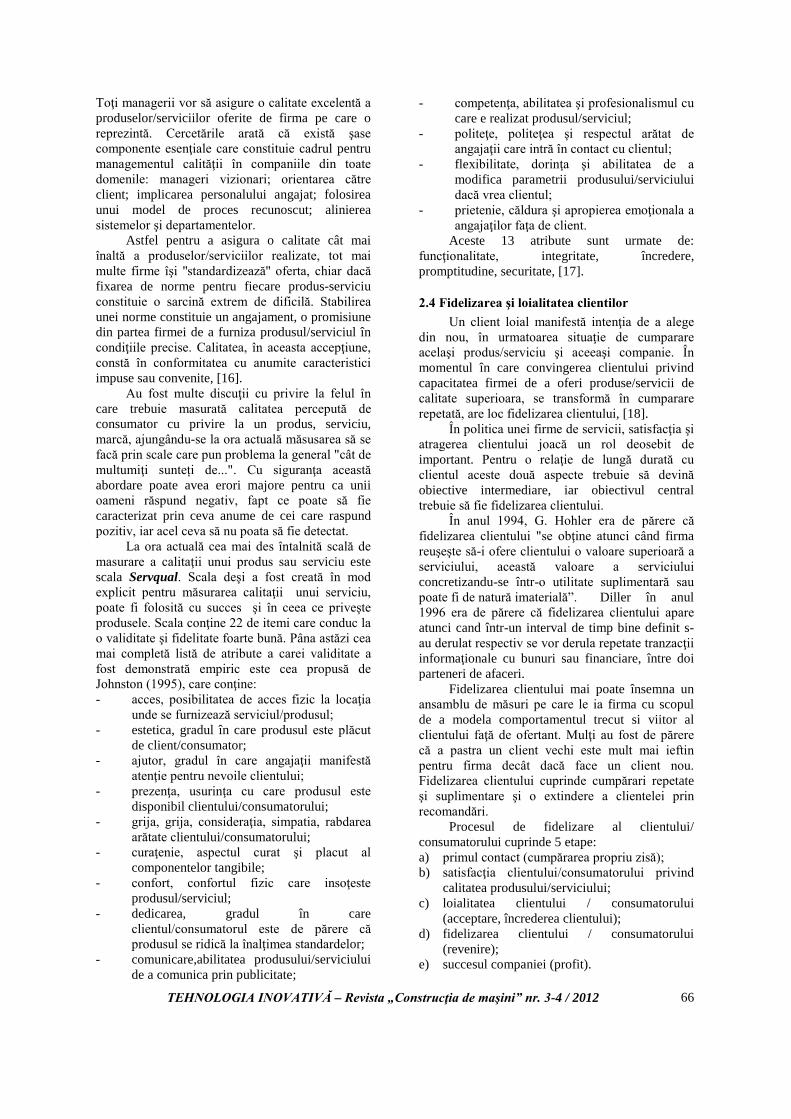
TEHNOLOGIA INOVATIVĂ – Revista „Construcţia de maşini” nr. 3-4 / 2012
66
Toţi managerii vor să asigure o calitate excelentă a produselor/serviciilor oferite de firma pe care o reprezintă. Cercetările arată că există şase componente esenţiale care constituie cadrul pentru managementul calităţii în companiile din toate domenile: manageri vizionari; orientarea către client; implicarea personalului angajat; folosirea unui model de proces recunoscut; alinierea sistemelor şi departamentelor. Astfel pentru a asigura o calitate cât mai înaltă a produselor/serviciilor realizate, tot mai multe firme îşi ''standardizează'' oferta, chiar dacă fixarea de norme pentru fiecare produs-serviciu constituie o sarcină extrem de dificilă. Stabilirea unei norme constituie un angajament, o promisiune din partea firmei de a furniza produsul/serviciul în condiţiile precise. Calitatea, în aceasta accepţiune, constă în conformitatea cu anumite caracteristici impuse sau convenite, [16]. Au fost multe discuţii cu privire la felul în care trebuie masurată calitatea percepută de consumator cu privire la un produs, serviciu, marcă, ajungându-se la ora actuală măsusarea să se facă prin scale care pun problema la general "cât de multumiţi sunteți de...". Cu siguranţa această abordare poate avea erori majore pentru ca unii oameni răspund negativ, fapt ce poate să fie caracterizat prin ceva anume de cei care raspund pozitiv, iar acel ceva să nu poata să fie detectat. La ora actuală cea mai des întalnită scală de masurare a calitaţii unui produs sau serviciu este scala Servqual. Scala deşi a fost creată în mod explicit pentru măsurarea calitaţii unui serviciu, poate fi folosită cu succes şi în ceea ce priveşte produsele. Scala conţine 22 de itemi care conduc la o validitate şi fidelitate foarte bună. Pâna astăzi cea mai completă listă de atribute a carei validitate a fost demonstrată empiric este cea propusă de Johnston (1995), care conţine: - acces, posibilitatea de acces fizic la locaţia
unde se furnizează serviciul/produsul; - estetica, gradul în care produsul este plăcut
de client/consumator; - ajutor, gradul în care angajaţii manifestă
atenţie pentru nevoile clientului; - prezenţa, usurinţa cu care produsul este
disponibil clientului/consumatorului; - grija, grija, consideraţia, simpatia, rabdarea
arătate clientului/consumatorului; - curaţenie, aspectul curat şi placut al
componentelor tangibile; - confort, confortul fizic care insoţeste
produsul/serviciul; - dedicarea, gradul în care
clientul/consumatorul este de părere că produsul se ridică la înalţimea standardelor;
- comunicare,abilitatea produsului/serviciului de a comunica prin publicitate;
- competenţa, abilitatea şi profesionalismul cu care e realizat produsul/serviciul;
- politeţe, politeţea şi respectul arătat de angajaţii care intră în contact cu clientul;
- flexibilitate, dorinţa şi abilitatea de a modifica parametrii produsului/serviciului dacă vrea clientul;
- prietenie, căldura şi apropierea emoţionala a angajaţilor faţa de client.
Aceste 13 atribute sunt urmate de: funcţionalitate, integritate, încredere, promptitudine, securitate, [17].
2.4 Fidelizarea şi loialitatea clientilor Un client loial manifestă intenţia de a alege din nou, în urmatoarea situaţie de cumparare acelaşi produs/serviciu şi aceeaşi companie. În momentul în care convingerea clientului privind capacitatea firmei de a oferi produse/servicii de calitate superioara, se transformă în cumparare repetată, are loc fidelizarea clientului, [18]. În politica unei firme de servicii, satisfacţia şi atragerea clientului joacă un rol deosebit de important. Pentru o relaţie de lungă durată cu clientul aceste două aspecte trebuie să devină obiective intermediare, iar obiectivul central trebuie să fie fidelizarea clientului. În anul 1994, G. Hohler era de părere că fidelizarea clientului "se obţine atunci când firma reuşeşte să-i ofere clientului o valoare superioară a serviciului, această valoare a serviciului concretizandu-se într-o utilitate suplimentară sau poate fi de natură imaterială”. Diller în anul 1996 era de părere că fidelizarea clientului apare atunci cand într-un interval de timp bine definit s-au derulat respectiv se vor derula repetate tranzacţii informaţionale cu bunuri sau financiare, între doi parteneri de afaceri.
Fidelizarea clientului mai poate însemna un ansamblu de măsuri pe care le ia firma cu scopul de a modela comportamentul trecut si viitor al clientului faţă de ofertant. Mulţi au fost de părere că a pastra un client vechi este mult mai ieftin pentru firma decât dacă face un client nou. Fidelizarea clientului cuprinde cumpărari repetate şi suplimentare şi o extindere a clientelei prin recomandări. Procesul de fidelizare al clientului/ consumatorului cuprinde 5 etape: a) primul contact (cumpărarea propriu zisă); b) satisfacţia clientului/consumatorului privind
calitatea produsului/serviciului; c) loialitatea clientului / consumatorului
(acceptare, încrederea clientului); d) fidelizarea clientului / consumatorului
(revenire); e) succesul companiei (profit).
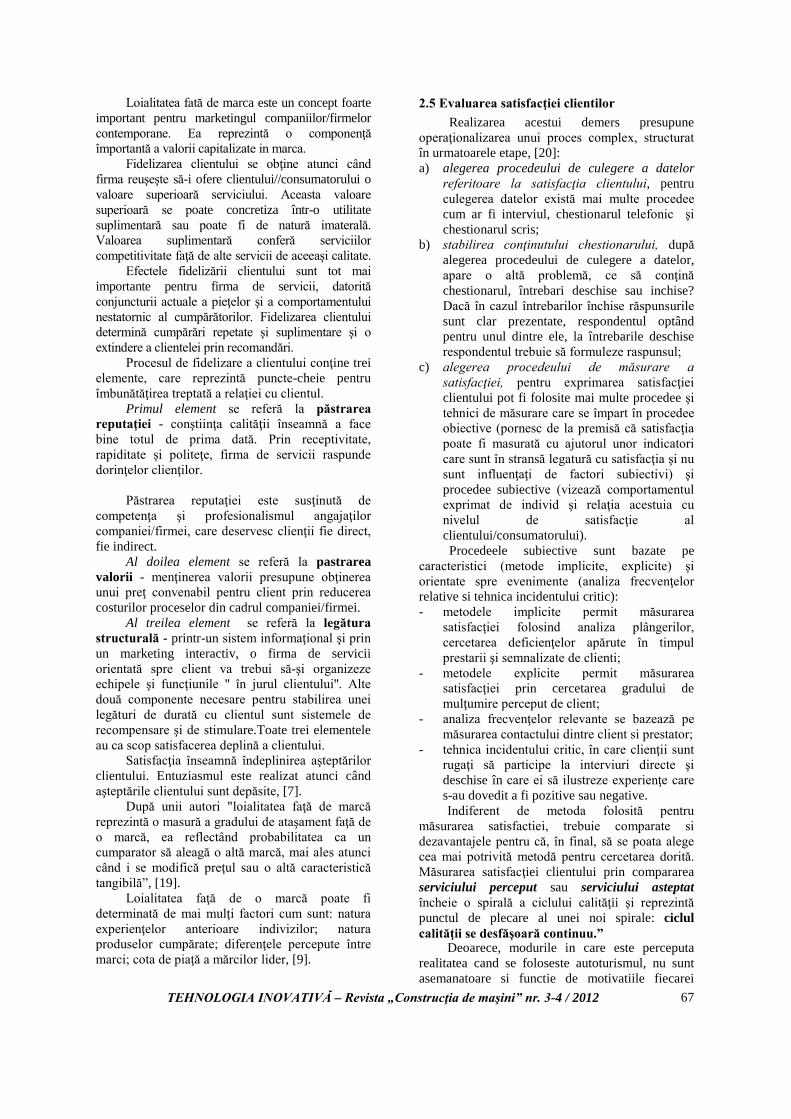
TEHNOLOGIA INOVATIVĂ – Revista „Construcţia de maşini” nr. 3-4 / 2012
67
Loialitatea fată de marca este un concept foarte important pentru marketingul companiilor/firmelor contemporane. Ea reprezintă o componenţă împortantă a valorii capitalizate in marca. Fidelizarea clientului se obţine atunci când firma reuşeşte să-i ofere clientului//consumatorului o valoare superioară serviciului. Aceasta valoare superioară se poate concretiza într-o utilitate suplimentară sau poate fi de natură imaterală. Valoarea suplimentară conferă serviciilor competitivitate faţă de alte servicii de aceeaşi calitate. Efectele fidelizării clientului sunt tot mai importante pentru firma de servicii, datorită conjuncturii actuale a pieţelor şi a comportamentului nestatornic al cumpărătorilor. Fidelizarea clientului determină cumpărări repetate şi suplimentare şi o extindere a clientelei prin recomandări.
Procesul de fidelizare a clientului conţine trei elemente, care reprezintă puncte-cheie pentru îmbunătăţirea treptată a relaţiei cu clientul. Primul element se referă la păstrarea reputaţiei - conştiinţa calităţii înseamnă a face bine totul de prima dată. Prin receptivitate, rapiditate şi politeţe, firma de servicii raspunde dorinţelor clienţilor.
Păstrarea reputaţiei este susţinută de competenţa şi profesionalismul angajaţilor companiei/firmei, care deservesc clienţii fie direct, fie indirect. Al doilea element se referă la pastrarea valorii - menţinerea valorii presupune obţinerea unui preţ convenabil pentru client prin reducerea costurilor proceselor din cadrul companiei/firmei.
Al treilea element se referă la legătura structurală - printr-un sistem informaţional şi prin un marketing interactiv, o firma de servicii orientată spre client va trebui să-şi organizeze echipele şi funcţiunile '' în jurul clientului''. Alte două componente necesare pentru stabilirea unei legături de durată cu clientul sunt sistemele de recompensare şi de stimulare.Toate trei elementele au ca scop satisfacerea deplină a clientului. Satisfacţia înseamnă îndeplinirea aşteptărilor clientului. Entuziasmul este realizat atunci când aşteptările clientului sunt depăsite, [7]. După unii autori "loialitatea faţă de marcă reprezintă o masură a gradului de ataşament faţă de o marcă, ea reflectând probabilitatea ca un cumparator să aleagă o altă marcă, mai ales atunci când i se modifică preţul sau o altă caracteristică tangibilă”, [19]. Loialitatea faţă de o marcă poate fi determinată de mai mulţi factori cum sunt: natura experienţelor anterioare indivizilor; natura produselor cumpărate; diferenţele percepute între marci; cota de piaţă a mărcilor lider, [9].
2.5 Evaluarea satisfacţiei clientilor Realizarea acestui demers presupune operaţionalizarea unui proces complex, structurat în urmatoarele etape, [20]: a) alegerea procedeului de culegere a datelor
referitoare la satisfacţia clientului, pentru culegerea datelor există mai multe procedee cum ar fi interviul, chestionarul telefonic şi chestionarul scris;
b) stabilirea conţinutului chestionarului, după alegerea procedeului de culegere a datelor, apare o altă problemă, ce să conţină chestionarul, întrebari deschise sau inchise? Dacă în cazul întrebarilor închise răspunsurile sunt clar prezentate, respondentul optând pentru unul dintre ele, la întrebarile deschise respondentul trebuie să formuleze raspunsul;
c) alegerea procedeului de măsurare a satisfacţiei, pentru exprimarea satisfacţiei clientului pot fi folosite mai multe procedee şi tehnici de măsurare care se împart în procedee obiective (pornesc de la premisă că satisfacţia poate fi masurată cu ajutorul unor indicatori care sunt în stransă legatură cu satisfacţia şi nu sunt influenţaţi de factori subiectivi) şi procedee subiective (vizează comportamentul exprimat de individ şi relaţia acestuia cu nivelul de satisfacţie al clientului/consumatorului). Procedeele subiective sunt bazate pe
caracteristici (metode implicite, explicite) şi orientate spre evenimente (analiza frecvenţelor relative si tehnica incidentului critic): - metodele implicite permit măsurarea
satisfacţiei folosind analiza plângerilor, cercetarea deficienţelor apărute în timpul prestarii şi semnalizate de clienti;
- metodele explicite permit măsurarea satisfacţiei prin cercetarea gradului de mulţumire perceput de client;
- analiza frecvenţelor relevante se bazează pe măsurarea contactului dintre client si prestator;
- tehnica incidentului critic, în care clienţii sunt rugaţi să participe la interviuri directe şi deschise în care ei să ilustreze experienţe care s-au dovedit a fi pozitive sau negative. Indiferent de metoda folosită pentru
măsurarea satisfactiei, trebuie comparate si dezavantajele pentru că, în final, să se poata alege cea mai potrivită metodă pentru cercetarea dorită. Măsurarea satisfacţiei clientului prin compararea serviciului perceput sau serviciului asteptat încheie o spirală a ciclului calităţii şi reprezintă punctul de plecare al unei noi spirale: ciclul calităţii se desfăşoară continuu.”
Deoarece, modurile in care este perceputa realitatea cand se foloseste autoturismul, nu sunt asemanatoare si functie de motivatiile fiecarei
TEHNOLOGIA INOVATIVĂ – Revista „Construcţia de maşini” nr. 3-4 / 2012
68
persoane, nici asteptarile nu sunt aceleasi pentru fiecare client, atunci este foarte important identificarea si eliminarea cauzelor care produc clienti nesatisfacuti. Unul din programele cele mai eficiente este Analiza de Imagine a Rezultatelor Serviciilor, în care o bază de clienţi, selectată aleatoriu, îşi exprimă opinia asupra gradului de satisfacţie cu privire la serviciile oferite de firma si dealerul autorizat.
Punctajele folosite pentru evaluarea rezultatelor permit diverselor comentarii şi opinii ale clienţilor să fie clasificate în anumite categorii principale, sau zone de observaţii. Prin intermediul acestora va fi măsurată fidelitatea clienţilor, şi vor fi determinate domeniile în care sunt necesare îmbunătăţiri. In urma studiilor CSS (Cercetarea Satisfactiei Clientilor) realizate in perioada septembrie 2010 – septembrie 2011, la un dealer auto, autorizat, s-a obtinut urmatorele rezultate privind evolutia loialitatii clientilor reprezentata grafic in fig. 3.
Fig. 3. Cresterea continua a indexului de loialitate
Cercetarea de marketing prin studiul de piata este folosita si pentru gestionarea riscurilor, luarea deciziilor pentru a ajuta compania sa creasca si sa transmita o imagine buna a companiei, dorinta si efortul de a satisface asteptarile clientilor.
“Penetrarea pietei” reprezinta una dintre cele mai importante sarcini ale politicii unei companii, dealerilor, unitatilor de service si servicii. Cei mai importanti factori care influenteaza penetrarea pietei sunt, pe de o parte, asteptarile, cerintele si dorintele diverse ale diferitelor grupuri de clienti, si pe de alta parte, modalitatea in care principalul dealer autorizat, unitate de service autorizata le recunoaste si le indeplineste.
O constientizare permanenta a acestor interdependente reprezinta o conditie fundamentala pentru un “management al pietei” de succes cu un nivel de penetrare a pietei la fel de ridicat. Modul de exteriorizare a clientilor, in urma asteptarilor lor se pot “vedea” in imaginile din fig. 4.
Rezulta ca, numai cine cunoaste asteptarile clientilor sai, poate sa le indeplineasca!
Modul in care clientii vor privi activitatea companiei, dealerului,unitatii de service si servicii, depinde de gradul in care asteptarile le sunt indeplinite. Aceste asteptari pot varia in cele mai mici detalii, in functie de tipul de client. Pe de alta parte, exista o serie de asteptari prezente in cazul tuturor tipurilor de clienti. Acestea includ:
Comportamentul politicos si amabil al angajatilor;
Sfaturile profesionale si dorinta de a se face util;
Respectarea tuturor punctelor stabilite de comun acord si a termenelor limita;
Executarea corecta a tuturor lucrarilor enumerate pe formularul de comanda.
Fig. 4. Manifestarile clientilor in urma asteptarilor
Din pacate aceste asteptari nu sunt intotdeauna indeplinite. Din moment ce avem nevoie de clienti satisfacuti, printre cele mai urgente, tinand de managementul calitatii se numara verificarea permanenta a proceselor de baza, precum si analiza si eliminarea punctelor slabe.
Succesul unei companii poate fi masurat in principal din raspunsul la doua intrebari:
1. Sunt clientii satisfacuti? 2. Sunt procedurile suficiente?

TEHNOLOGIA INOVATIVĂ – Revista „Construcţia de maşini” nr. 3-4 / 2012
69
Prima intrebare este mult mai dificila si mult mai importanta, întrucât dacă clienţii/consumatorii nemulţumiţi stau deoparte, procedurile vor deveni curând şi ele insuficiente.
O dificultate suplimentară este aceea că nu există nici o compensaţie simplă cu care clientul să fie satisfăcut în aceeaşi măsură, iar a doua intrebare este relativ simpla, pot raspunde contabilii.
Intrucat clientii, arareori spun ei insisi cat sunt de satisfacuti sau nesatisfacuti de dealer, unitatea de service si de lucrarile de intretinere efectuate, monitorizarea atenta a satisfactiei clientului trebuie sa constituie cea mai mare prioritate. 3. CONCLUZII Cercetarea de marketing este foarte importantă pentru o firma deoarece facând aceste cercetări, compania află care este poziţia ei pe piaţă şi află ce părere au clienţii despre produsele companiei. Satisfacţia clientului joaca un rol esenţial în felul în care se vand produsele/serviciile companiei, dacă nu ai un client satisfăcut o să îl pierzi pe viitor. O companie trebuie să ştie cum să îşi păstreze vechii clienţi şi cum să-si creeze alţii noi. Este un lucru bun părerea favorabilă pe care o au clienţii despre produsele/serviciile companiei, lucru pe care compania prin dealerii sai trebuie să facă totul pentru păstrarea sa, dar totodată compania trebuie să pună accent pe promovarea produselor, deoarece tot mai multi clienţi sa afle despre companie si produsele ei.
Pentru a tine sub control activitatea si a lua masurile necesare corectarii, imbunatatirii si eficientizarii activitatii, managerul trebuie sa stapaneasca intreaga activitate a dealerilor si sa cunoasca indicatorii cheie ai eficientei economice, avand si cunostiintele necesare.
Prin analiza eficientei economice, periodic si monitorizarea acesteia, se pot lua deciziile corecte si masurile inlaturarii aspectelor negative si a punctelor slabe.
Calitatea activităţilor de service si servicii, incluzând atât calitatea muncii, cât şi cea a atitudinii faţă de client, este considerată din ce în ce mai mult a fi primul factor de care depinde succesul (şi asta nu numai în comerţul cu autovehicule!). Acest factor este atât de important pentru evoluţia viitoare a unei afaceri, încât nu numai managerii, ci şi angajaţii trebuie să fie permanent conştienţi de existenţa sa.
Managementul calităţii în cadrul unei companii de distribuţie trebuie să verifice şi să asigure permanent respectarea structurii descrise de procesele de bază. Iniţial, acest fapt poate părea a nu fi decât un cost în plus, dar are un efect benefic asupra fidelităţii clienţilor, a imaginii publice a afacerii şi a rezultatelor financiare.
Pentru a preveni insatisfactiile clientilor, trebuie indentificat din timp cauzele posibile care ar putea duce la aparitia lor.Fara feedback, problemele raman adesea neidentificate si nu pot fi abordate la timp. Este mai important, mai usor si mai ieftin sa evitam insatisfactia decat sa satisfacem un client initial nesatisfacut. Reclamatiile ne ofera oportunitatea de a transforma insatisfactia clientilor in satisfactie. Obiectivul este atins atunci cand opinia clientului este: “per-total, acest distribuitor este destul de bun”.
BIBLIOGRAFIE
[1]. Danciu V., "Marketing Internaţional", Editura Economică,Bucureşti, 1998; [2]. Iliescu D., Petre D.,"Psihologia reclamei şi a consumatorului", Ed. Comunicare.ro, Bucureşti, 2004; [3]. Sterea C., "Satisfacţia clienţilor", http://www.amsonline.ro/raport/satisfactia-clientilor-studiu-jd-power; [4]. Giese J.L., Cote, J.A., Defining Consumer Satisfaction, Academy of Marketing Science Review,vol. 1, 2002 [5]. Bolog A., Stremţan F., Definiţii ale satisfacţiei consumatorului, Universitatea ”1 Decembrie 1918” Alba Iulia, 2006; [6]. Dupta P., "MARKETING", Note de curs, Februarie-Iunie 2003; [7]. Dumitrescu L, "Marketingul şi calitatea serviciilor", Ed. Expert, Bucureşti , 2009; [8]. Toma J., Satisfacţia clientului-element de bază in sistemul de management al calităţii, Revista CALITATEA-acces la succes, Nr. 1-2, 2009, pag 4; [9]. Isac F., "Comportamentul consumatorului", Ed. Mirton, Bucureşti , 2004; [10]. Comanescu B.," Percepţia clientului determină profilul companiei", http://www.accelera.ro/resurse/articole/percepţia_determină_profitul.pdf; [11]. Stanciu S.,"Bazele generale ale marketingului", http://ebooks.unibuc.ro/StiinteADM/sica/cuprins.htm,descărcat la 6 Decembrie 2010; [12]. Ion E., "Servicii şi utilităţi publice", http://www.scribd.com/doc/36266513/Servicii-Si-Utilitati-Publice; [13]. Marketing Definitions, a Glossary of Marketing Terms, Committee of definitions of the American Marketing Association, 1960; [14]. Teboul J., "Les Temps des services. Une nouvelle aproche de management", Ed. d'Organisation, Paris, 1999; [15]. Cetină I., Brandabur R., "Marketingul serviciilor.Abordare teoretică şi studii de caz", Ed. Uranus, Bucureşti, 2004; [16]. Plumb I., lucrarea "Reingineria serviciilor", http://www.biblioteca_digitală.ase.ro/biblioteca/pagina2.asp?id=cap14, Ed. ASE, Bucureşti, 2004; [17]. Purcărea T.," Comportamentul consumatorului o abordare de marketing", Ed. Universitară Carol Davila, Bucureşti,2007; [18]. Bruhn M.,"Orientarea spre clienţi. Temelia afacerii de succes", Ed. Economică, Bucureşti, 2001; [19]. Cătoiu I., Teodorescu N., "Comportamentul consumatorului. Abordare instrumentală", Ed. Uranus, Bucureşti 2001; [20]. Ilie F. , "Marketing Industrial", Editura BREN, Bucureşti, 2008.
TEHNOLOGIA INOVATIVĂ – Revista „Construcţia de maşini” nr. 3-4 / 2012
70
Quick Info
The 7th International Working Conference
SECOND ANNOUNCEMENT, CALL FOR PAPERS, PRESENTATIONS AND
PARTICIPATION
TOTAL QUALITY MANAGEMENT - ADVANCED AND INTELLIGENT
APPROACHES With Third Special Conference ’’Manufuture in Serbia 2013’’.
4th – 7th June, 2013, Belgrade, SERBIA.
TQM Conference Schedule: Sessions based on accepted papers on the topics of interest. Special sessions/Conferences organized and chaired by internationally recognized leaders of research in advanced topics. RTDs/WSs on special topics. TQM Conference Venue The TQM Conference will be held at the capital city of Belgrade, Serbia. Official Language The official language of the TQM Conference is English. Scope of the TQM Conference The main objective of the 7th TQM Conference is to provide an international forum around the world for the exchange of knowledge, experience, research results and information about various aspects of the state-of-the-art and the future development of total quality management. The scope of the Conference covers philosophical, scientific and practical concepts concerning research, development and application of TQM-based advanced approaches. Topics of interest Topics of interest include, but are not limited to: � Business excellence models (applications
and development trends); � TQM & manufacturing management; � World class performance; � Attractive quality; � Robust engineering; � Six sigma model; � Intelligent quality tools and methods; � Virtual factory and virtual quality; � Intelligent metrology in manufacturing;
� Intelligent and virtual CMM; � Business process improvement; � Breakthrough management; � Organizational Excellence; � Intelligent design for quality; � Intelligent Business; � Quality in Higher Education; � Quality of the Public Services / health care; � Advanced Quality approaches; � Digital engineering/manufacturing; � Manufuture initiative and Micro-nano
manufacturing / Metrology Special Session dedicated to Ph. D. thesis A special session will be dedicated to discussion of Ph. D. Thesis. An international committee will assign an award to the best paper from Ph. D. Thesis. Papers and Proceedings Prospective authors are invited to send their contributions on relevant topics. Papers may be submitted by e-mail in a Word file. The length of the paper should be 8A4 pages; 1.0 space typing; use Arial 10 point font. For the anonymity of review; please identify the following information separately: the title; author's full name; affiliation; address; e-mail address; telephone and fax numbers. Authors of accepted papers will be expected to sign a copyright release allowing publication in the proceedings. Pre - proceedings will be available before the Conference. After the Conference, the Proceedings with selected the best papers which will under a second review, RTD, panel discussion and conclusion will be published in a Special Issue of the TQM Journal - ISSN: 1754-2731 (Emerald). Registration The registration fee for the TQM Conference is Euro 150; if paid before 15th May 2013. After that date; the fee is Euro 200. For the registration fee please contact the Conference Secretariat. Lodging For details regarding hotel reservations please contact the Conference Secretariat. Important dates: January 15; 2013 – Proposal for special sessions and RTDs/WSs due. February 25; 2013 – Full paper due; 8 pages; electronic submission. March 15; 2013 – Final paper acceptance. March 25; 2013 – Registration announcement. April 25; 2013– Final program announcement. May 15; 2013 – Early registration deadline. 4th – 7th June – International Working Conference. Organized by Mechanical Engineering Faculty, Centre for Advanced Technology, Laboratory for Production Metrology and TQM, Belgrade, Serbia.
TEHNOLOGIA INOVATIVĂ – Revista „Construcţia de maşini” nr. 3-4 / 2012 71
MANAGEMENTUL RESURSELOR DE TIMP SI FINANCIARE
Tulea Claudia Oana, Alexandru Radulescu
Universitatea POLITEHNICA Bucureşti, Bucureşti , ROMANIA, e-mail: [email protected]
REZUMAT Lucrarea prezintă managementului resurselor de timp si financiare pentru realizarea unei masini de macinat cereale. Pentru realizarea aceste masini s-au prezentat trei variante posibile de realizare a proiectului si s-a ales varianta cea mai buna din punct de vedere al costurilor de realizare a proiectului. ABSTRACT This paper presents the time and financial resources management to achieve a grain grinder. There were presented for this achievement three possible variants of making the project and it was chosen the best in terms of cost of the project. KEYWORDS: time management, financial resources, costs CUVINTE CHEIE:management, resurse de timp si financiare, costuri
1. INTRODUCERE
Planificarea proiectului este procesul de definire
a cerinţelor proiectului într-un mod structurat, folosind instrumentele managementului de proiect, pentru comunicarea cerinţelor proiectului către toate părţile implicate, măsurarea performanţelor, precum şi pentru organizarea şi asigurarea controlului utilizării resurselor în scopul realizării obiectivelor propuse ale proiectului.
Un proiect trebuie să fie realizabil într-un termen relativ fix şi cu resurse limitate, iar definirea proiectului trebuie să ţină cont de aceste lucruri. Procesul de planificare a proiectului implică stabilirea obiectivelor, a beneficiarilor, a rezultatelor scontate, a activităţilor şi resurselor necesare (atât umane, cât şi financiare), precum şi stabilirea termenelor de realizare. În funcţie de mărimea proiectelor şi documentelor de planificare pot fi realizate în etape succesive care să asigure nivelul de detaliere necesar. La proiectele mari etapele iniţiale pot fi cele mai importante pentru obţinerea succesului scontat.
Progresul proiectului este măsurat prin realizarea evenimentelor ce reprezintă stadiile semnificative ale implementării unui proiect. Activităţile se desfăşoară într-un orizont de timp. Fiecare activitate este definită de un eveniment de începere şi de unul de finalizare.
Resursele sunt consumate de activităţi şi mai
puţin de evenimente. În general evenimentele şi activităţile necesare pentru execuţia unui proiect sunt dependente de rezultatele unor activităţi anterioare din sistem. Aceste relaţii fac ca activităţile să fie interdependente, iar aceste interdependenţe trebuie avute în vedere atunci când se face graficul de derulare al unui proiect, [1].
Managementul proiectelor este un domeniu destul de recent aparut, iar importanta sa a cunoscut o crestere majora datorita faptului ca, la scara europeana si internationala,tot mai multe actiuni se desfasoara în cadrul unor proiecte. Resursele utilizate de aceste proiecte (mai ales cele financiare) au un rol din ce în ce mai mare (vezi sumele derulate prin programele PHARE sau SAPARD) în dezvoltarea economica, iar aria lor de aplicabilitate este în crestere.
Proiectul reprezinta o suma de activitati care conduc la realizarea unui scop comun si necesita un consum important de resurse (umane, materiale, financiare, echipamente, informaţii documentare si timp). Punerea în practica a unui proiect presupune un moment initial si un moment final al proiectului, deci o durata de realizare. Momentul iniţial este considerat cel în care se ia decizia de a se trece la conceperea
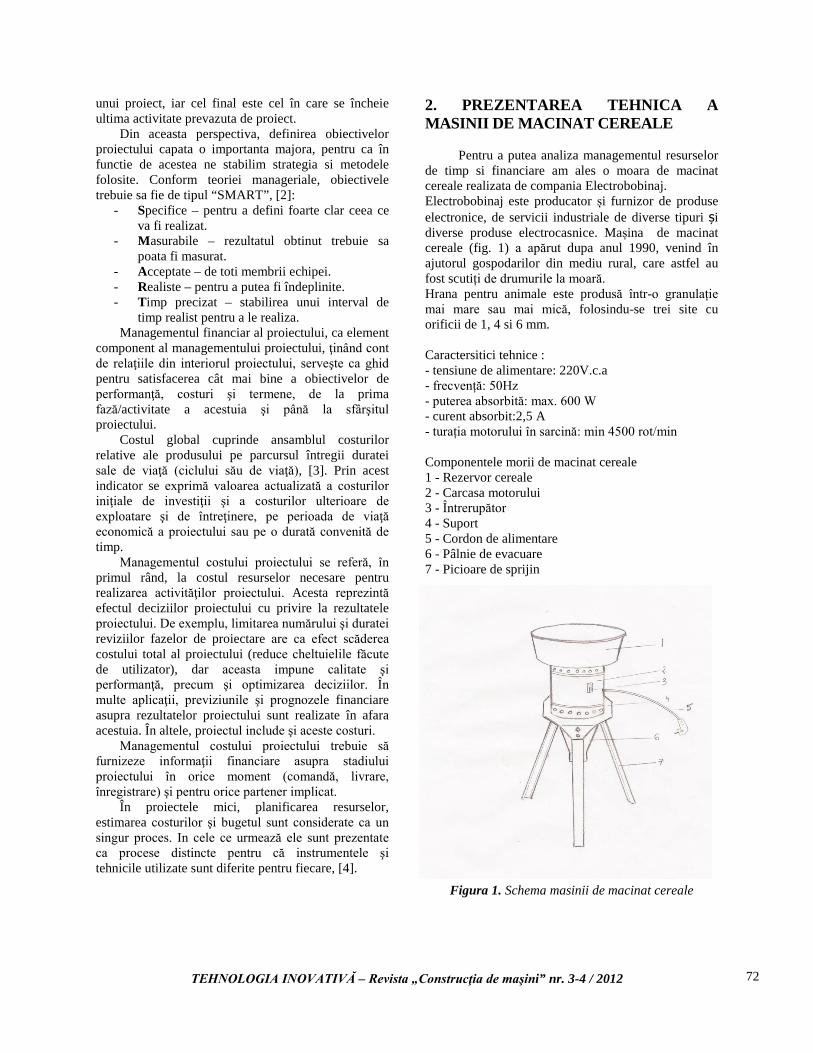
TEHNOLOGIA INOVATIVĂ – Revista „Construcţia de maşini” nr. 3-4 / 2012 72
unui proiect, iar cel final este cel în care se încheie ultima activitate prevazuta de proiect.
Din aceasta perspectiva, definirea obiectivelor proiectului capata o importanta majora, pentru ca în functie de acestea ne stabilim strategia si metodele folosite. Conform teoriei manageriale, obiectivele trebuie sa fie de tipul “SMART”, [2]:
- Specifice – pentru a defini foarte clar ceea ce va fi realizat.
- Masurabile – rezultatul obtinut trebuie sa poata fi masurat.
- Acceptate – de toti membrii echipei. - Realiste – pentru a putea fi îndeplinite. - Timp precizat – stabilirea unui interval de
timp realist pentru a le realiza. Managementul financiar al proiectului, ca element
component al managementului proiectului, ţinând cont de relaţiile din interiorul proiectului, serveşte ca ghid pentru satisfacerea cât mai bine a obiectivelor de performanţă, costuri şi termene, de la prima fază/activitate a acestuia şi până la sfârşitul proiectului.
Costul global cuprinde ansamblul costurilor relative ale produsului pe parcursul întregii duratei sale de viaţă (ciclului său de viaţă), [3]. Prin acest indicator se exprimă valoarea actualizată a costurilor iniţiale de investiţii şi a costurilor ulterioare de exploatare şi de întreţinere, pe perioada de viaţă economică a proiectului sau pe o durată convenită de timp.
Managementul costului proiectului se referă, în primul rând, la costul resurselor necesare pentru realizarea activităţilor proiectului. Acesta reprezintă efectul deciziilor proiectului cu privire la rezultatele proiectului. De exemplu, limitarea numărului şi duratei reviziilor fazelor de proiectare are ca efect scăderea costului total al proiectului (reduce cheltuielile făcute de utilizator), dar aceasta impune calitate şi performanţă, precum şi optimizarea deciziilor. În multe aplicaţii, previziunile şi prognozele financiare asupra rezultatelor proiectului sunt realizate în afara acestuia. În altele, proiectul include şi aceste costuri.
Managementul costului proiectului trebuie să furnizeze informaţii financiare asupra stadiului proiectului în orice moment (comandă, livrare, înregistrare) şi pentru orice partener implicat.
În proiectele mici, planificarea resurselor, estimarea costurilor şi bugetul sunt considerate ca un singur proces. In cele ce urmează ele sunt prezentate ca procese distincte pentru că instrumentele şi tehnicile utilizate sunt diferite pentru fiecare, [4].
2. PREZENTAREA TEHNICA A MASINII DE MACINAT CEREALE Pentru a putea analiza managementul resurselor de timp si financiare am ales o moara de macinat cereale realizata de compania Electrobobinaj. Electrobobinaj este producator și furnizor de produse electronice, de servicii industriale de diverse tipuri și diverse produse electrocasnice. Mașina de macinat cereale (fig. 1) a apărut dupa anul 1990, venind în ajutorul gospodarilor din mediu rural, care astfel au fost scutiți de drumurile la moară. Hrana pentru animale este produsă într-o granulație mai mare sau mai mică, folosindu-se trei site cu orificii de 1, 4 si 6 mm. Caractersitici tehnice : - tensiune de alimentare: 220V.c.a - frecvență: 50Hz - puterea absorbită: max. 600 W - curent absorbit:2,5 A - turația motorului în sarcină: min 4500 rot/min Componentele morii de macinat cereale 1 - Rezervor cereale 2 - Carcasa motorului 3 - Întrerupător 4 - Suport 5 - Cordon de alimentare 6 - Pâlnie de evacuare 7 - Picioare de sprijin
Figura 1. Schema masinii de macinat cereale
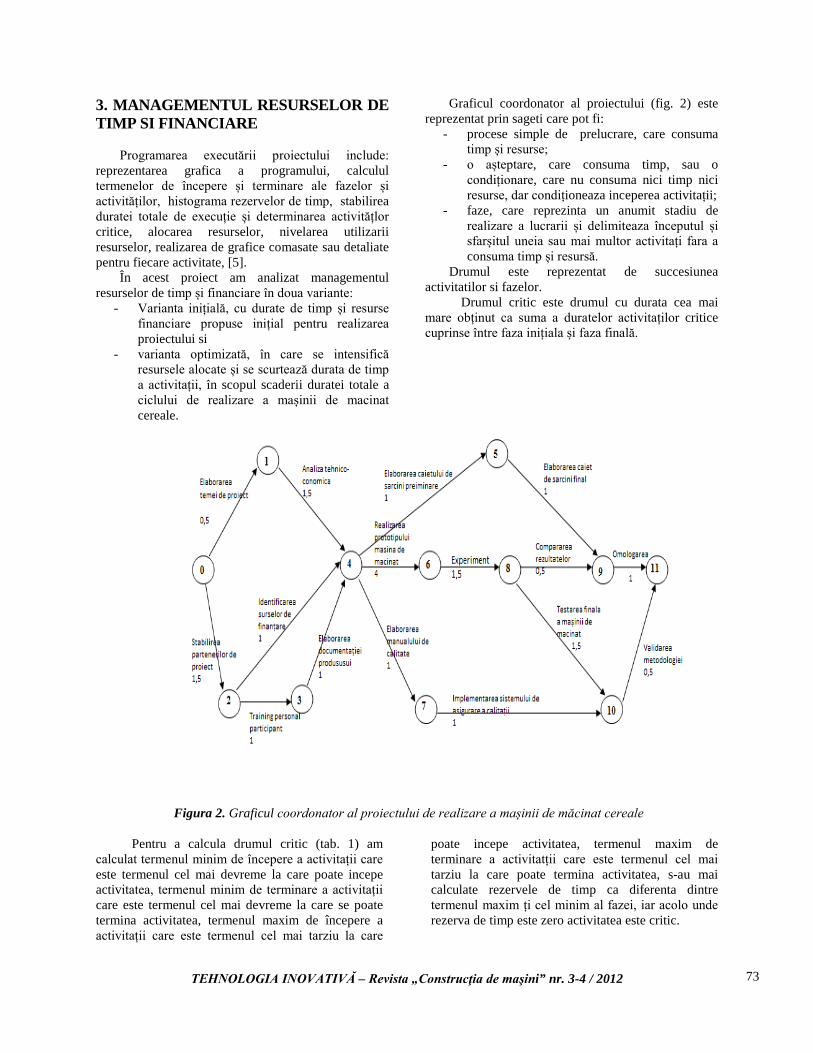
TEHNOLOGIA INOVATIVĂ – Revista „Construcţia de maşini” nr. 3-4 / 2012 73
3. MANAGEMENTUL RESURSELOR DE TIMP SI FINANCIARE Programarea executării proiectului include: reprezentarea grafica a programului, calculul termenelor de începere și terminare ale fazelor și activităților, histograma rezervelor de timp, stabilirea duratei totale de execuție și determinarea activitățlor critice, alocarea resurselor, nivelarea utilizarii resurselor, realizarea de grafice comasate sau detaliate pentru fiecare activitate, [5]. În acest proiect am analizat managementul resurselor de timp și financiare în doua variante:
- Varianta inițială, cu durate de timp și resurse financiare propuse inițial pentru realizarea proiectului si
- varianta optimizată, în care se intensifică resursele alocate și se scurtează durata de timp a activitații, în scopul scaderii duratei totale a ciclului de realizare a mașinii de macinat cereale.
Graficul coordonator al proiectului (fig. 2) este reprezentat prin sageti care pot fi:
- procese simple de prelucrare, care consuma timp și resurse;
- o așteptare, care consuma timp, sau o condiționare, care nu consuma nici timp nici resurse, dar condiționeaza inceperea activitații;
- faze, care reprezinta un anumit stadiu de realizare a lucrarii și delimiteaza începutul și sfarșitul uneia sau mai multor activitați fara a consuma timp și resursă.
Drumul este reprezentat de succesiunea activitatilor si fazelor. Drumul critic este drumul cu durata cea mai mare obținut ca suma a duratelor activitaților critice cuprinse între faza inițiala și faza finală.
Figura 2. Graficul coordonator al proiectului de realizare a mașinii de măcinat cereale
Pentru a calcula drumul critic (tab. 1) am calculat termenul minim de începere a activitații care este termenul cel mai devreme la care poate incepe activitatea, termenul minim de terminare a activitații care este termenul cel mai devreme la care se poate termina activitatea, termenul maxim de începere a activitații care este termenul cel mai tarziu la care
poate incepe activitatea, termenul maxim de terminare a activitatții care este termenul cel mai tarziu la care poate termina activitatea, s-au mai calculate rezervele de timp ca diferenta dintre termenul maxim ți cel minim al fazei, iar acolo unde rezerva de timp este zero activitatea este critic.
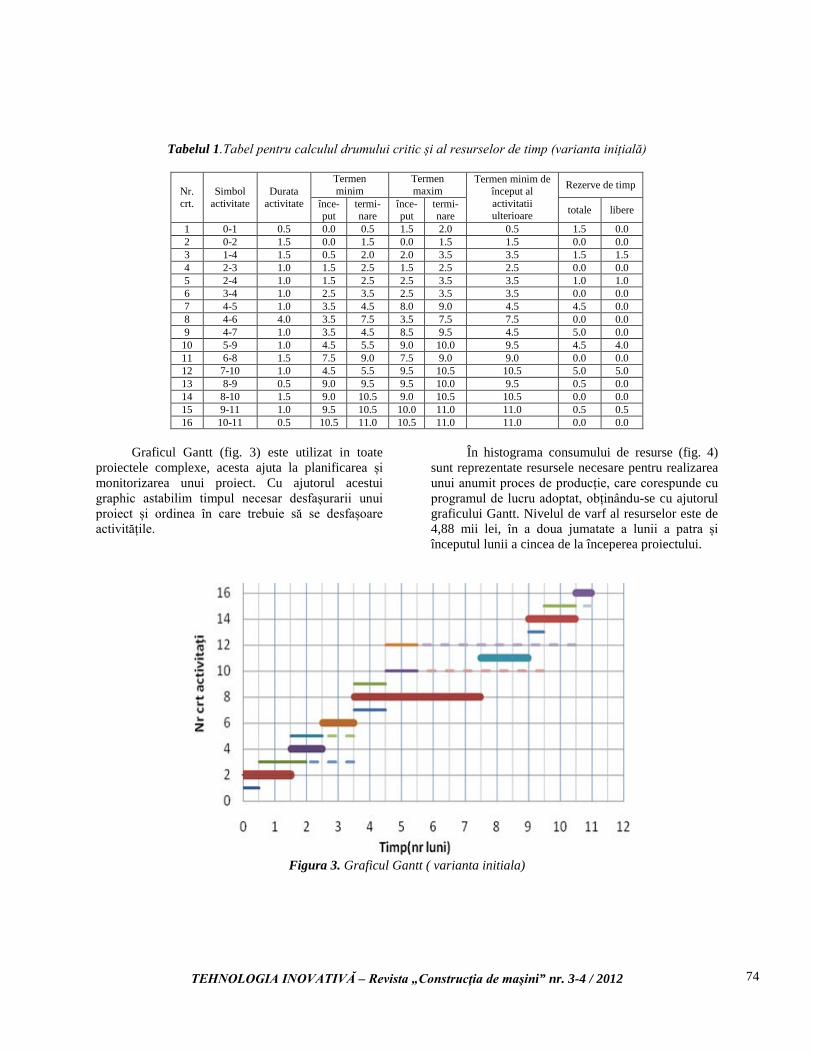
TEHNOLOGIA INOVATIVĂ – Revista „Construcţia de maşini” nr. 3-4 / 2012 74
Tabelul 1.Tabel pentru calculul drumului critic și al resurselor de timp (varianta inițială)
Nr. crt.
Simbol activitate
Durata activitate
Termen minim
Termen maxim
Termen minim de început al activitatii ulterioare
Rezerve de timp
înce-put
termi-nare
înce-put
termi-nare totale libere
1 0-1 0.5 0.0 0.5 1.5 2.0 0.5 1.5 0.0 2 0-2 1.5 0.0 1.5 0.0 1.5 1.5 0.0 0.0 3 1-4 1.5 0.5 2.0 2.0 3.5 3.5 1.5 1.5 4 2-3 1.0 1.5 2.5 1.5 2.5 2.5 0.0 0.0 5 2-4 1.0 1.5 2.5 2.5 3.5 3.5 1.0 1.0 6 3-4 1.0 2.5 3.5 2.5 3.5 3.5 0.0 0.0 7 4-5 1.0 3.5 4.5 8.0 9.0 4.5 4.5 0.0 8 4-6 4.0 3.5 7.5 3.5 7.5 7.5 0.0 0.0 9 4-7 1.0 3.5 4.5 8.5 9.5 4.5 5.0 0.0
10 5-9 1.0 4.5 5.5 9.0 10.0 9.5 4.5 4.0 11 6-8 1.5 7.5 9.0 7.5 9.0 9.0 0.0 0.0 12 7-10 1.0 4.5 5.5 9.5 10.5 10.5 5.0 5.0 13 8-9 0.5 9.0 9.5 9.5 10.0 9.5 0.5 0.0 14 8-10 1.5 9.0 10.5 9.0 10.5 10.5 0.0 0.0 15 9-11 1.0 9.5 10.5 10.0 11.0 11.0 0.5 0.5 16 10-11 0.5 10.5 11.0 10.5 11.0 11.0 0.0 0.0
Graficul Gantt (fig. 3) este utilizat in toate proiectele complexe, acesta ajuta la planificarea și monitorizarea unui proiect. Cu ajutorul acestui graphic astabilim timpul necesar desfașurarii unui proiect și ordinea în care trebuie să se desfașoare activitățile.
În histograma consumului de resurse (fig. 4) sunt reprezentate resursele necesare pentru realizarea unui anumit proces de producție, care corespunde cu programul de lucru adoptat, obținându-se cu ajutorul graficului Gantt. Nivelul de varf al resurselor este de 4,88 mii lei, în a doua jumatate a lunii a patra și începutul lunii a cincea de la începerea proiectului.
Figura 3. Graficul Gantt ( varianta initiala)
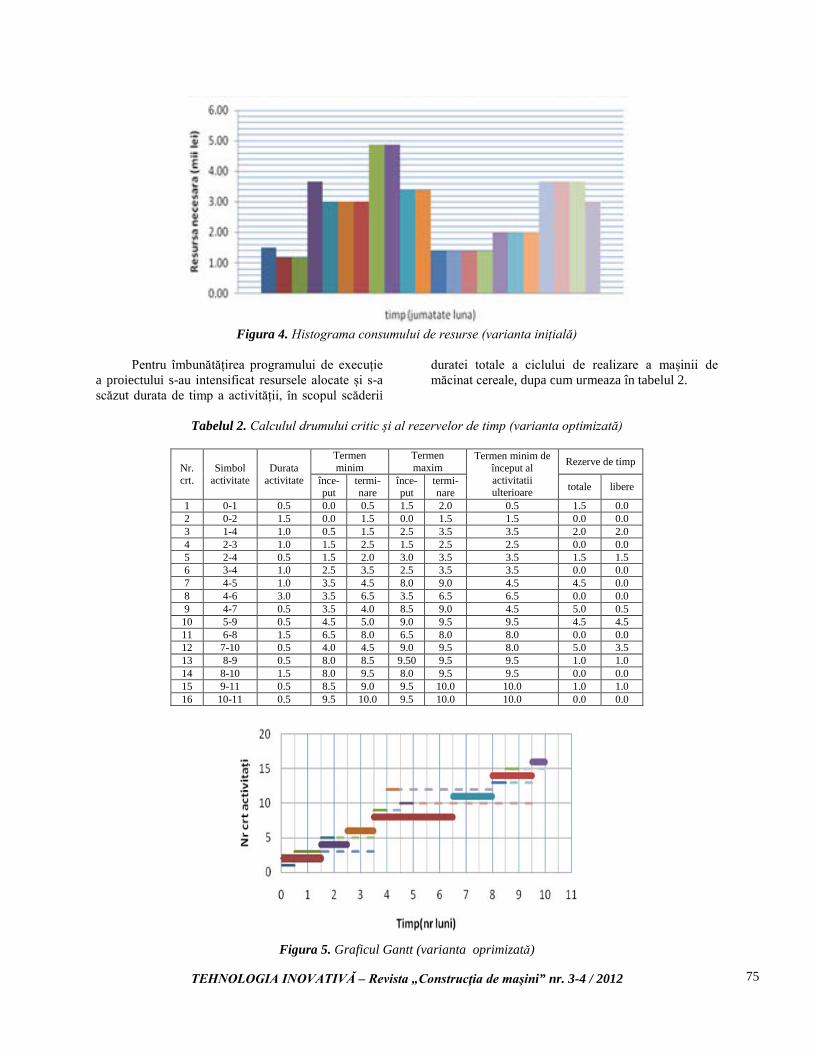
TEHNOLOGIA INOVATIVĂ – Revista „Construcţia de maşini” nr. 3-4 / 2012 75
Figura 4. Histograma consumului de resurse (varianta inițială)
Pentru îmbunătățirea programului de execuție a proiectului s-au intensificat resursele alocate și s-a scăzut durata de timp a activității, în scopul scăderii
duratei totale a ciclului de realizare a mașinii de măcinat cereale, dupa cum urmeaza în tabelul 2.
Tabelul 2. Calculul drumului critic și al rezervelor de timp (varianta optimizată)
Nr. crt.
Simbol activitate
Durata activitate
Termen minim
Termen maxim
Termen minim de început al activitatii ulterioare
Rezerve de timp
înce-put
termi-nare
înce-put
termi-nare totale libere
1 0-1 0.5 0.0 0.5 1.5 2.0 0.5 1.5 0.0 2 0-2 1.5 0.0 1.5 0.0 1.5 1.5 0.0 0.0 3 1-4 1.0 0.5 1.5 2.5 3.5 3.5 2.0 2.0 4 2-3 1.0 1.5 2.5 1.5 2.5 2.5 0.0 0.0 5 2-4 0.5 1.5 2.0 3.0 3.5 3.5 1.5 1.5 6 3-4 1.0 2.5 3.5 2.5 3.5 3.5 0.0 0.0 7 4-5 1.0 3.5 4.5 8.0 9.0 4.5 4.5 0.0 8 4-6 3.0 3.5 6.5 3.5 6.5 6.5 0.0 0.0 9 4-7 0.5 3.5 4.0 8.5 9.0 4.5 5.0 0.5
10 5-9 0.5 4.5 5.0 9.0 9.5 9.5 4.5 4.5 11 6-8 1.5 6.5 8.0 6.5 8.0 8.0 0.0 0.0 12 7-10 0.5 4.0 4.5 9.0 9.5 8.0 5.0 3.5 13 8-9 0.5 8.0 8.5 9.50 9.5 9.5 1.0 1.0 14 8-10 1.5 8.0 9.5 8.0 9.5 9.5 0.0 0.0 15 9-11 0.5 8.5 9.0 9.5 10.0 10.0 1.0 1.0 16 10-11 0.5 9.5 10.0 9.5 10.0 10.0 0.0 0.0
Figura 5. Graficul Gantt (varianta oprimizată)
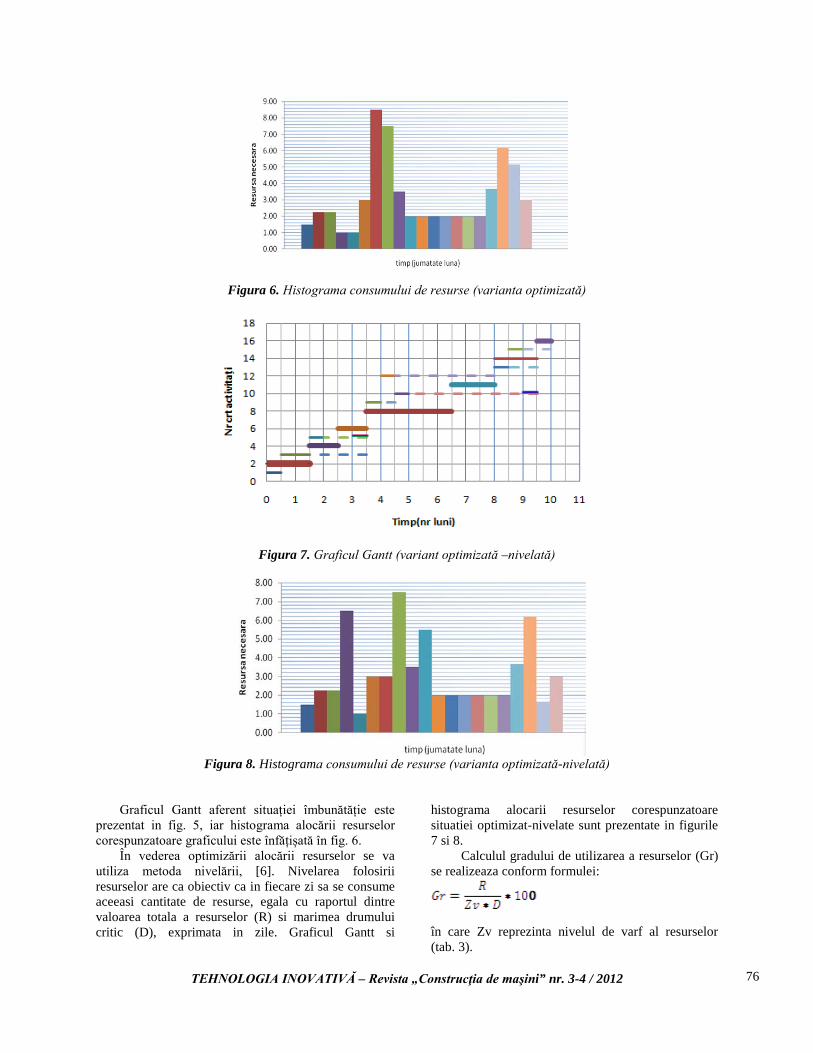
TEHNOLOGIA INOVATIVĂ – Revista „Construcţia de maşini” nr. 3-4 / 2012 76
Figura 6. Histograma consumului de resurse (varianta optimizată)
Figura 7. Graficul Gantt (variant optimizată –nivelată)
Figura 8. Histograma consumului de resurse (varianta optimizată-nivelată)
Graficul Gantt aferent situației îmbunătăție este prezentat in fig. 5, iar histograma alocării resurselor corespunzatoare graficului este înfățișată în fig. 6. În vederea optimizării alocării resurselor se va utiliza metoda nivelării, [6]. Nivelarea folosirii resurselor are ca obiectiv ca in fiecare zi sa se consume aceeasi cantitate de resurse, egala cu raportul dintre valoarea totala a resurselor (R) si marimea drumului critic (D), exprimata in zile. Graficul Gantt si
histograma alocarii resurselor corespunzatoare situatiei optimizat-nivelate sunt prezentate in figurile 7 si 8. Calculul gradului de utilizarea a resurselor (Gr) se realizeaza conform formulei:
în care Zv reprezinta nivelul de varf al resurselor (tab. 3).
TEHNOLOGIA INOVATIVĂ – Revista „Construcţia de maşini” nr. 3-4 / 2012 77
Tabelul 3. Gradul de utilizare al resurselor
Variante analizate Grad de utilizare
inițiala 54.4%
optimizata 41%
optimizată-nivelată 36%
4. DISCUTII SI CONCLUZII Pornind de la datele prezentate in tabelul 3, se vor analiza complet cele trei variante de finantare propuse. In tabelul 4 sunt prezentate sintetic cele trei variante, din punctul de vedere al duratei de realizare proiectului, resursele necesare, gradul lor de utilizare precum si nivelul maxim de resursa necesara. Tabelul 4. Concluzie, varianta care se va utiliza pentru realizarea proiectului
Varianta initiala
Varianta optimizata
Varianata optimizata-
nivelata Durata
realizarii proiectului
11 luni
10 luni
10 luni
Resursele necesare realizarii
proiectului
58.5 mii
lei
64.5 mii
lei
64.5 mii lei
Gradul de utilizarea al resurselor
54.40%
41%
36%
Nivelul de varf al
resurselor
4.88 mii
lei
8.5 mii lei
7.5 mii lei
Analizand datele prezentate in tabelul 4, se constata ca, din punctul de vedere al eficientei utilizarii resurselor, corelate cu durata de realizare a proiectului, varianta optima de finantare este varianta optimizata-nivelata. BIBLIOGRAFIE [1]. Stanescu, A.M., Dumitrache, I. Towards a General Systems Theory Approach for developing Concurrent Engineering, Smart Concurrent Engineering Sao Paolo, Springer Verlag, 2007 [2]. *** Open University Business School, Management performant, vol.2, Controlul managerial, Codecs, Bucuresti, 2000 [3]. Antonio, S., Ponea, S., Bradu, O. Manager de proiect. Modele operationale, Ed. Lumen, Iasi, 2011 [4]. Opran, C., Stan, S., Spânu, P. Managementul proiectelor, Ed. Comunicare, Bucuresti, 2007 [5]. Rădulescu, Al.V. Managementul producţiei – Teorie, Vol. I, Ed. PRINTECH, Bucuresti, 200 [6]. Gaither, N. Production and operation management, The Bryden Press Hartcourt Brace College Publishers, 1994
Quick Info B2B Networking Event Promoting Business Partnerships in Greece The aim of the event is to promote business partnerships between Greek and European companies active in sectors identified as key contributors to achieving Growth in Greece. The event is organized in the framework of an initiative of Vice President Antonio Tajani in cooperation with the Greek Ministry for Development, Competitiveness, Infrastructure, Transport & Networks and the support of the Enterprise Europe Network – Hellas. The B2B will focus on:
- Agrifood / Food processing - Construction, Materials and Key Enabling
Technologies - Energy - Information & Communication Technologies - Pharmaceuticals / Health sciences - Tourism - Why to participate - The event will be a unique opportunity for
enterprises aiming at: - reaching the Greek market and its key players - examining business and investment
opportunities in Greece - establishing cross-border contacts
Agenda:Day 1 & 2 - Conference & Bilateral Meetings Language: English Costs: Free of charge Date: 12 March 2013 Dates for your agenda Deadlines Tasks
18 Feb Registration and submission of a cooperation profile
25 Feb - 7 Mar
Online selection of face-to-face meetings
Mon, 11 March Tue, 12 March
Conference (12:30 - 18:00) Bilateral meetings (11:30 - 18:30)
The earlier you submit your collaboration profile the more it will be recognized. (source: http://www.b2match.eu/athens-b2b)
TEHNOLOGIA INOVATIVĂ – Revista „Construcţia de maşini” nr. 3-4 / 2012 78
Quick Info International business networking event, 17-18 April 2013, Malta Two full days of networking, individual business meetings, short practical workshops for companies and entrepreneurs from EU and Euromed countries. This international event will be held in Malta on 21 - 22 May 2013 and will focus on the following sectors: renewable energies, advanced manufacturing, sustainable construction, digital game production, maritime, aviation, logistics, functional food & beverages and life sciences. If you are interested in personally meeting other entrepreneurs to discuss business cooperation you are most welcome to join the event. Contact: Brigitte Tanti, [email protected] EUROGIA+, the EUREKA cluster supporting new technologies in the clean energies sector EUROGIA+, the EUREKA cluster supporting new technologies in the clean energies sector,is a market-oriented programme, financing projects aiming at the development of new technological products by commercial entities, companies or universities, transforming academic knowledge into innovative technologies. The cluster addresses all areas of the energy mix, from renewable energy to efficiency, reduction of the CO2 footprint of fossil fuels.
EUROGIA+ goal is to support and promote international partnerships developping innovative projects in low-carbon energy technologies. EUROGIA+ is a bottom-up, industry driven, market oriented programme which addresses all areas of the energy mix, from renewable energy to efficiency, and reduction of carbon footprint of fossil fuels. EUROGIA+ is a cluster of the EUREKA network, a decentralized intergovernmental initiative started in 1985 to enhance European competitiveness by supporting businesses, research centers and universities that take part in trans-national projects.
It adresses all innovative energy technologies that will:
• reduce the carbon footprint of energy production and use
• develop new technologies for energy such as solar, wind, biomass, geothermal, energy efficiency, etc.
2013 cut-off dates
CALL 10 Submission Deadlines: February 15, 2013 Evaluation Meeting: March 14, 2013 - Munich, Germany
May 24, 2013 Evaluation Meeting June 13, 2013 - San Sebastion or Madrid, Spain
EUROGIA2020:
CALL 01 - ProjectSubmission Deadlines: September 13, 2013 Evaluation Meeting: October 3, 2013 November 15, 2013 Evaluation Meeting: December 9, 2013
(source: http://www.eurogia.com/)

TEHNOLOGIA INOVATIVĂ – Revista „Construcţia de maşini” nr. 3-4 / 2012
79
REVISTA CONSTRUCŢIA DE MAŞINI SERIE NOUĂ
îşi propune să prezinte
cele mai valoroase realizări din domeniul Cercetării - Dezvoltării
româneşti şi internaţionale.
Revista oferă specialiştilor posibilitatea de a publica articole şi studii,
de a-şi prezenta produsele realizate şi de a face cunoscută
activitatea firmei sau instituţiei în paginile Revistei.
Instrucţiunile privind redactarea şi trimiterea
lucrărilor pot fi obţinute la adresa:
Irina Rădulescu S.C. ICTCM S.A. Bucureşti Şos. Olteniţei nr. 103 Sect. 4 Bucureşti Tel: 021 332 37 70 / 234 Fax: 021 332 07 75 E-mail: [email protected]
REVISTA CONSTRUCŢIA DE MAŞINI SERIE NOUĂ
S. C. ICTCM S. A. Bucureşti şi ICTCM - CITAf
vă oferă posibilitatea unui abonament pentru 4 numere revistă ⁄ an
la preţul de 60 lei ⁄ an. Pentru detalii şi informaţii suplimentare vă rugăm să luaţi legătura cu:
Irina Rădulescu S.C. ICTCM S.A. Bucureşti Şos. Olteniţei nr. 103 Sect. 4 Bucureşti Tel: 021 332 37 70 / 234 Fax: 021 332 07 75 E-mail: [email protected]
REVISTA CONSTRUCŢIA DE MAŞINI SERIE NOUĂ
Pentru a face cunoscute realizările din cercetare şi productie, Oficiul de Informare Documentară pentru Industrie, Cercetare, Management
din cadrul Centrului Incubator Tehnologic de Afaceri
S.C. ICTCM S.A. BUCUREŞTI
publică revista "Tehnologia Inovativă” – seria nouă a Revistei "Construcţia de maşini", realizează prospecte, cataloage, postere, la comandă,
în condiţii grafice deosebite, cu macheta beneficiarului sau cu design şi machete proprii.