biometrical and biodiversity indexes of the forest … · universitatea. de ŞtiinŢe agricole Şi...
TRANSCRIPT
UNIVERSITATEA DE ŞTIINŢE AGRICOLE ŞI MEDICINĂ VETERINARĂ A BANATULUI „REGELE MIHAI I AL ROMÂNIEI” DIN TIMIŞOARA
BIOMETRICAL AND BIODIVERSITY INDEXES OF THE FOREST STANDS FROM “RUNCU – GROȘI” NATURE RESERVE
O. Merce, F. G. Borlea, D. O. Turcu, I. C. Cîntar
1.Introduction •Biodiversity conservation became a core activity for the forest management, both in developing countries and especially in developed countries.
•Evaluation and monitoring of the ecosystems’ biodiversity is an activity of high interest which must be undertaken for nature protection. For this, methodologies for evaluation and monitoring must be developed.
•In order to describe and monitor the biodiversity, an alternative approach is to use indexes or measurable surrogates. In general, the biodiversity indexes could be placed in one of two categories: the category based on the identification of key species and the category based on the identification of key structures.
•The most complex ecosystems, both functionally and from the point of view of the information which they offer are the ecosystems from the forests with high degree of naturalness, called by many authors “virgin forests”. These forests could be considered as a true guide for the sustainable management of the cultivated (managed) forests.
1.1. Characteristics of the natural forest ecosystems • The virgin and quasi-virgin forest show the following structural characteristics:
• a large volume of biomass; • the presence of tree exemplars having large dimensions, with very old ages, exemplars that can reach the maximum potential of development of the species; • important dead wood volumes, in diverse stages of decomposition; • they show a heterogeneous structure, with a mosaic distribution of the components. • the structural complexity of the forest stand is deeply linked to the number of the structural attributes which are present and the relative abundance of each of these attributes. • The main elements used for the description of the stand structure are the following:
• the trees’ diameter, • the trees’ height, • the canopy closure index, • the stand biomass, • the species of trees, • the dead wood.
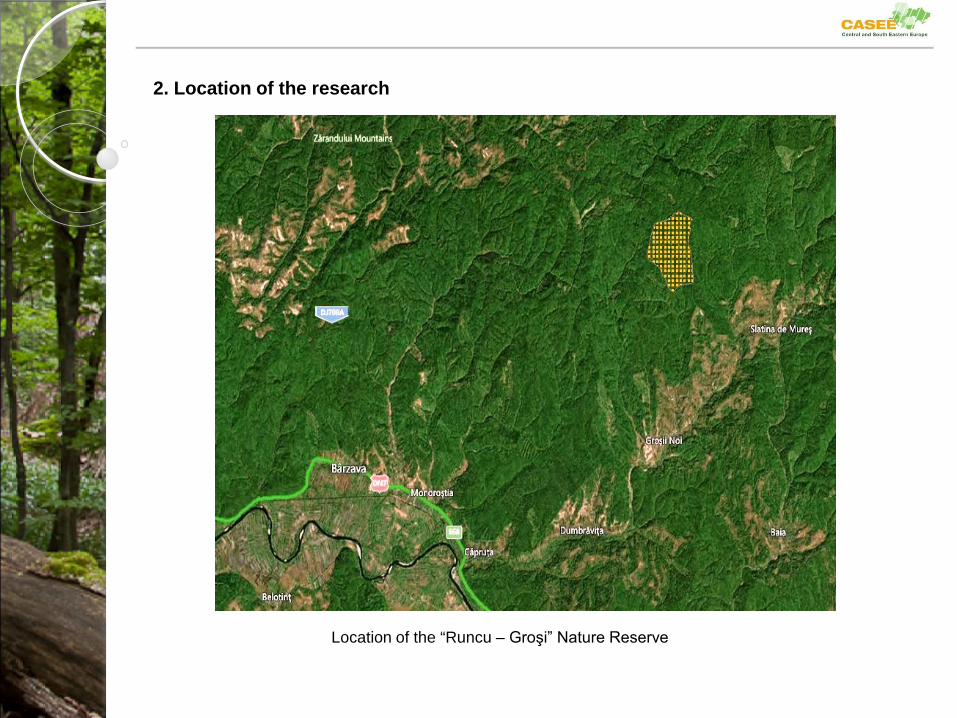
2. Location of the research
Location of the “Runcu – Groşi” Nature Reserve
3. Material and method • The research material consists of the quasi-virgin forest stands from Runcu – Groși; • The modality of the inventory used in the “Runcu - Groşi” Nature Reserve is based on the method of study issued by the European researchers for the forests included in nature reserves, within the COST Action E4; • In the Reserve, a network of circular sample plots of 1000m2 was installed. 41 sample plots were measured ( total surface 4,1 ha); • The recorded elements were the following:
•the precise position of the trees (living and dead trees) within the circular sample plot – measured using the FieldMap system; •the tree species; •the tree diameter – by averaging the measurements of two perpendicular diameters (the minimum diameter was 6 cm); •the total height of the tree – by measurement with the FieldMap or VERTEX – for each tree; •the state of vitality (state of vegetation) of the tree; •the tree injuries; •other observations regarding individual characteristics of the trees;
• The FieldMap equipment is composed of a field computer TabletPC, a laser device which measures distances to a reflector and the vertical angles, and an electronic compass which measures the horizontal angles.
• The data collected in the field from the 41 sample plots were processed using Microsoft Excel and R ( R Studio). • For the state of vegetation of the trees, a scale with 3 categories was used (I – healthy tree, II – damaged tree, III – dead tree). • In order to express the relationship between the biomass and the diversity through the structural diversity indexes, a series of biodiversity indexes were computed (Simpson index, Shannon-Weaver index, the equity, Margalef index, Menhinick index and Glisson coefficient). • Regarding the dead wood: the measurement of the precise position, the length (minimum 1 m) – by measuring with the FieldMap equipment, the diameter at each end – measured by calliper (the diameter at the thickest end minimum 10 cm) for the fallen stems and branches, respectively the position, height and diamtere (base diameter and upper diameter for stumps). Data were recorded for the stage of decomposition (5 classes of decomposition). • The fallen dead wood volume was taken from the automatic calculation made by the FieldMap software. In order to calculate the standing volume (living and dead wood), a double-logarithmic regression equation was used.
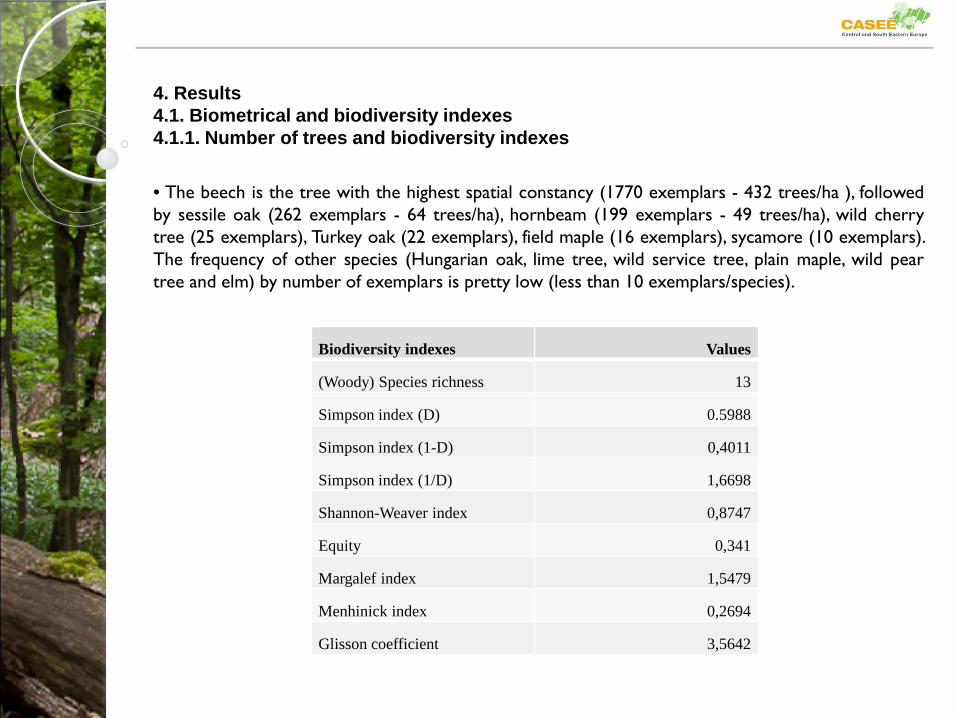
4. Results 4.1. Biometrical and biodiversity indexes 4.1.1. Number of trees and biodiversity indexes
• The beech is the tree with the highest spatial constancy (1770 exemplars - 432 trees/ha ), followed by sessile oak (262 exemplars - 64 trees/ha), hornbeam (199 exemplars - 49 trees/ha), wild cherry tree (25 exemplars), Turkey oak (22 exemplars), field maple (16 exemplars), sycamore (10 exemplars). The frequency of other species (Hungarian oak, lime tree, wild service tree, plain maple, wild pear tree and elm) by number of exemplars is pretty low (less than 10 exemplars/species).
Biodiversity indexes Values
(Woody) Species richness 13
Simpson index (D) 0.5988
Simpson index (1-D) 0,4011
Simpson index (1/D) 1,6698
Shannon-Weaver index 0,8747
Equity 0,341
Margalef index 1,5479
Menhinick index 0,2694
Glisson coefficient 3,5642
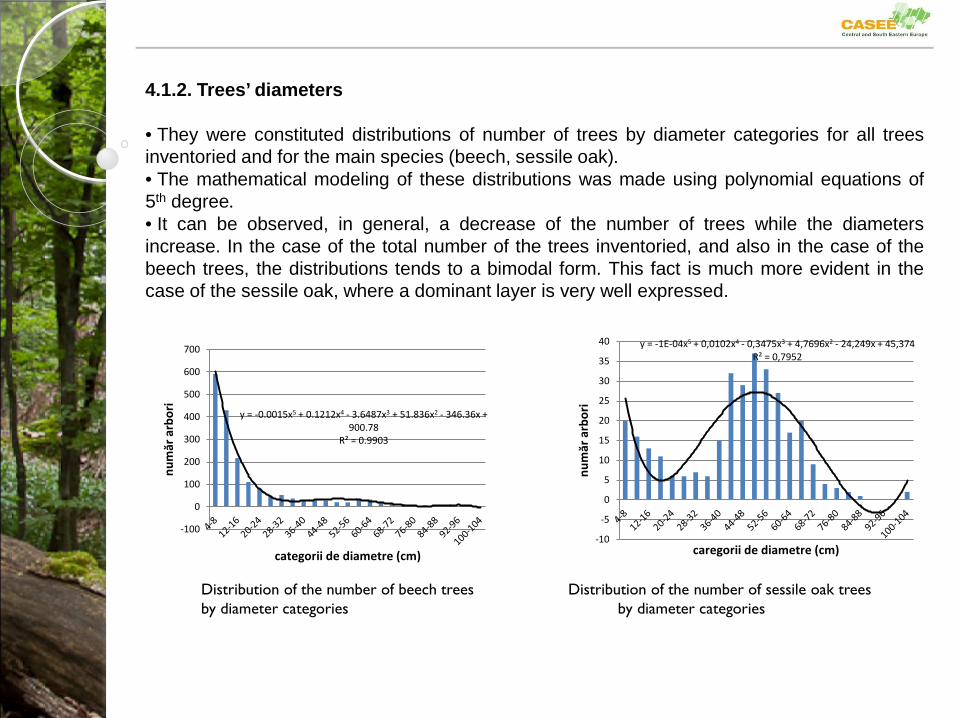
4.1.2. Trees’ diameters • They were constituted distributions of number of trees by diameter categories for all trees inventoried and for the main species (beech, sessile oak). • The mathematical modeling of these distributions was made using polynomial equations of 5th degree. • It can be observed, in general, a decrease of the number of trees while the diameters increase. In the case of the total number of the trees inventoried, and also in the case of the beech trees, the distributions tends to a bimodal form. This fact is much more evident in the case of the sessile oak, where a dominant layer is very well expressed.
y = -0.0015x5 + 0.1212x4 - 3.6487x3 + 51.836x2 - 346.36x + 900.78
R² = 0.9903
-100
0
100
200
300
400
500
600
700
num
ăr a
rbor
i
categorii de diametre (cm)
y = -1E-04x5 + 0,0102x4 - 0,3475x3 + 4,7696x2 - 24,249x + 45,374 R² = 0,7952
-10
-5
0
5
10
15
20
25
30
35
40
num
ăr a
rbor
i
caregorii de diametre (cm)
Distribution of the number of beech trees Distribution of the number of sessile oak trees by diameter categories by diameter categories
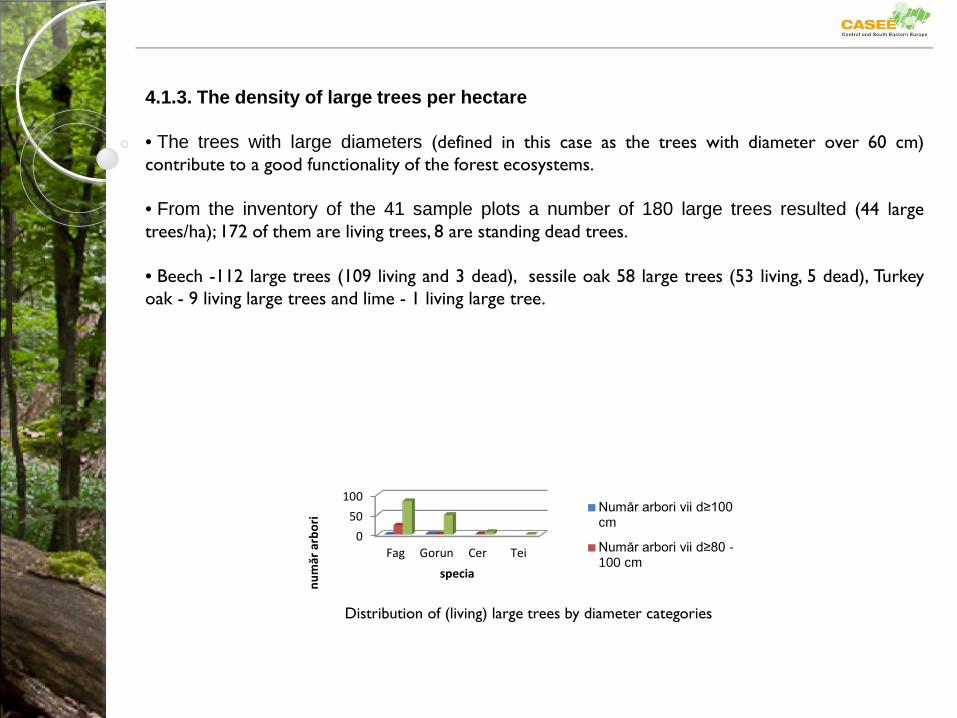
4.1.3. The density of large trees per hectare • The trees with large diameters (defined in this case as the trees with diameter over 60 cm) contribute to a good functionality of the forest ecosystems. • From the inventory of the 41 sample plots a number of 180 large trees resulted (44 large trees/ha); 172 of them are living trees, 8 are standing dead trees.
• Beech -112 large trees (109 living and 3 dead), sessile oak 58 large trees (53 living, 5 dead), Turkey oak - 9 living large trees and lime - 1 living large tree.
050
100
Fag Gorun Cer Tei
num
ăr a
rbor
i
specia
Număr arbori vii d≥100 cm
Număr arbori vii d≥80 - 100 cm
Distribution of (living) large trees by diameter categories
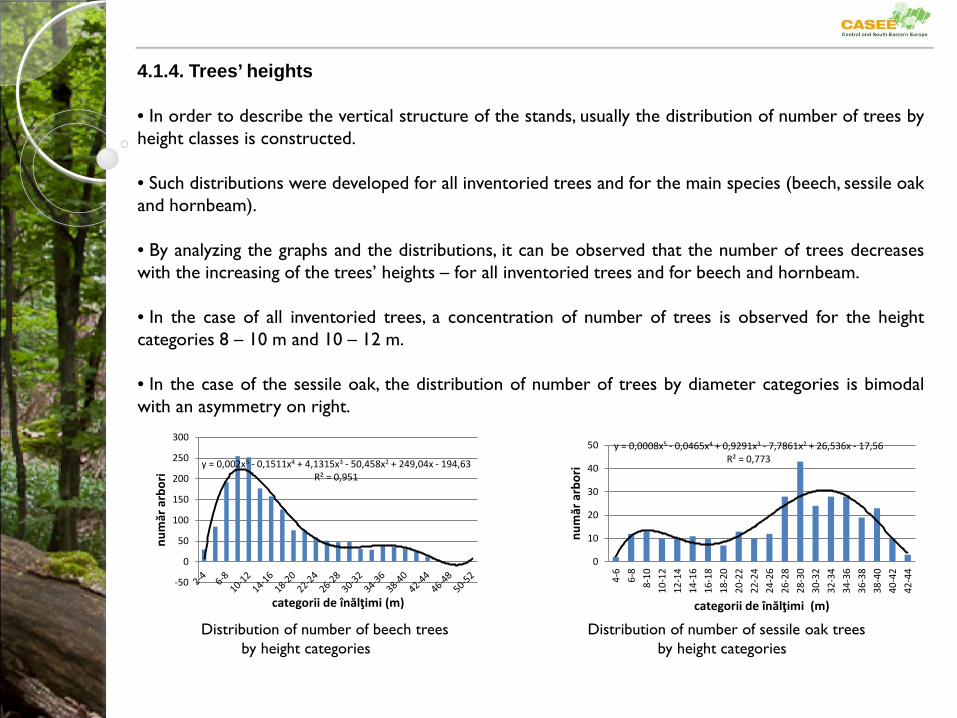
4.1.4. Trees’ heights • In order to describe the vertical structure of the stands, usually the distribution of number of trees by height classes is constructed.
• Such distributions were developed for all inventoried trees and for the main species (beech, sessile oak and hornbeam).
• By analyzing the graphs and the distributions, it can be observed that the number of trees decreases with the increasing of the trees’ heights – for all inventoried trees and for beech and hornbeam.
• In the case of all inventoried trees, a concentration of number of trees is observed for the height categories 8 – 10 m and 10 – 12 m.
• In the case of the sessile oak, the distribution of number of trees by diameter categories is bimodal with an asymmetry on right.
y = 0,002x5 - 0,1511x4 + 4,1315x3 - 50,458x2 + 249,04x - 194,63 R² = 0,951
-50
0
50
100
150
200
250
300
num
ăr a
rbor
i
categorii de înălţimi (m)
y = 0,0008x5 - 0,0465x4 + 0,9291x3 - 7,7861x2 + 26,536x - 17,56 R² = 0,773
0
10
20
30
40
50
4-6
6-8
8-10
10-1
212
-14
14-1
616
-18
18-2
020
-22
22-2
424
-26
26-2
828
-30
30-3
232
-34
34-3
636
-38
38-4
040
-42
42-4
4
num
ăr a
rbor
i
categorii de înălţimi (m)
Distribution of number of beech trees Distribution of number of sessile oak trees by height categories by height categories
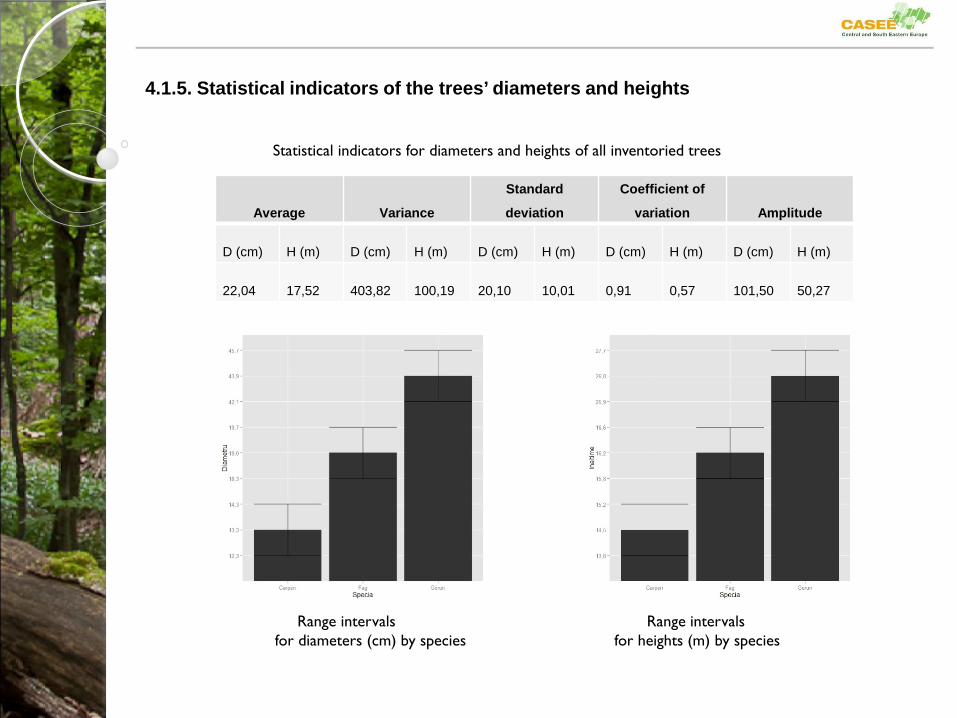
4.1.5. Statistical indicators of the trees’ diameters and heights
Average Variance
Standard
deviation
Coefficient of
variation Amplitude
D (cm) H (m) D (cm) H (m) D (cm) H (m) D (cm) H (m) D (cm) H (m)
22,04 17,52 403,82 100,19 20,10 10,01 0,91 0,57 101,50 50,27
Statistical indicators for diameters and heights of all inventoried trees
Range intervals Range intervals for diameters (cm) by species for heights (m) by species
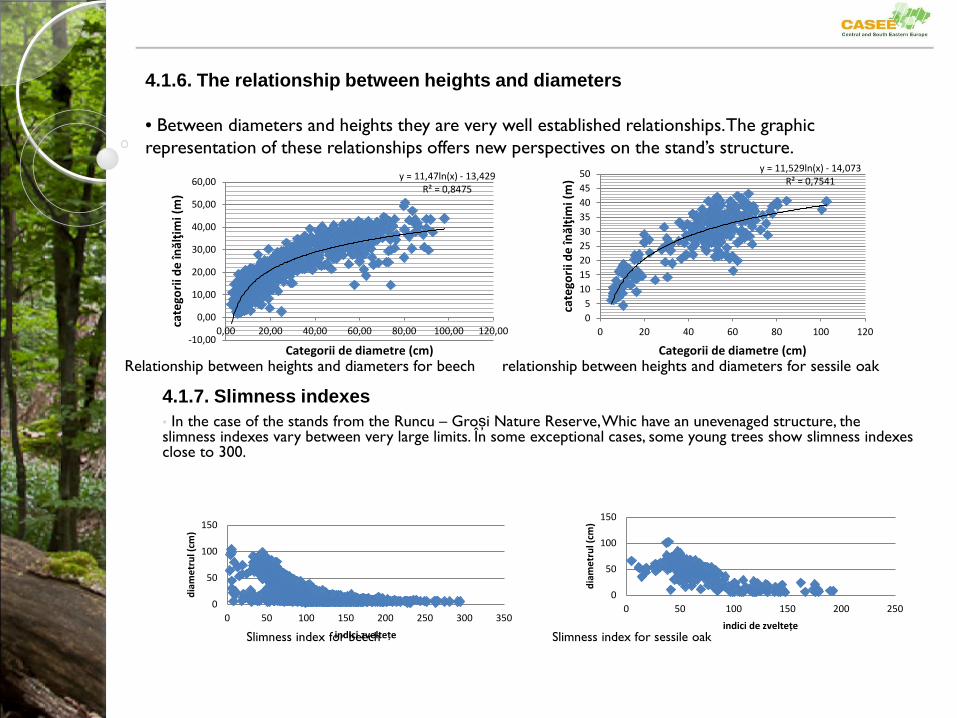
4.1.7. Slimness indexes • In the case of the stands from the Runcu – Groși Nature Reserve, Whic have an unevenaged structure, the slimness indexes vary between very large limits. În some exceptional cases, some young trees show slimness indexes close to 300.
Slimness index for beech Slimness index for sessile oak
4.1.6. The relationship between heights and diameters • Between diameters and heights they are very well established relationships. The graphic representation of these relationships offers new perspectives on the stand’s structure.
y = 11,47ln(x) - 13,429 R² = 0,8475
-10,00
0,00
10,00
20,00
30,00
40,00
50,00
60,00
0,00 20,00 40,00 60,00 80,00 100,00 120,00
cate
gorii
de
înăl
ţimi (
m)
Categorii de diametre (cm)
y = 11,529ln(x) - 14,073 R² = 0,7541
05
101520253035404550
0 20 40 60 80 100 120
cate
gorii
de
înăl
ţimi (
m)
Categorii de diametre (cm) Relationship between heights and diameters for beech relationship between heights and diameters for sessile oak
0
50
100
150
0 50 100 150 200 250 300 350
diam
etru
l (cm
)
indici zveltețe
0
50
100
150
0 50 100 150 200 250
diam
etru
l (cm
)
indici de zveltețe
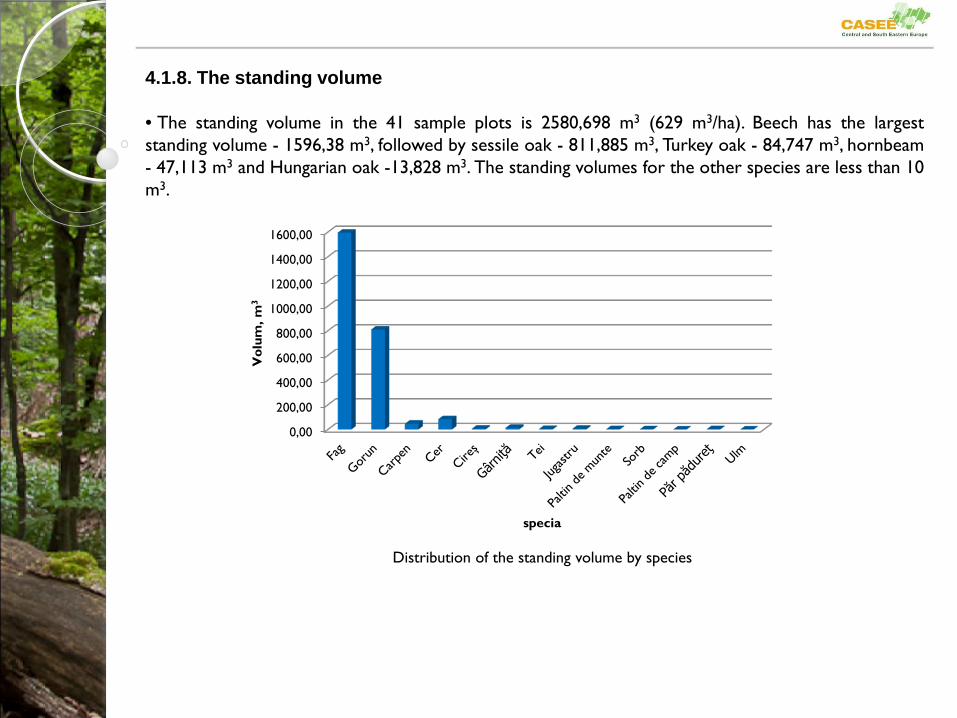
4.1.8. The standing volume • The standing volume in the 41 sample plots is 2580,698 m3 (629 m3/ha). Beech has the largest standing volume - 1596,38 m3, followed by sessile oak - 811,885 m3, Turkey oak - 84,747 m3, hornbeam - 47,113 m3 and Hungarian oak -13,828 m3. The standing volumes for the other species are less than 10 m3.
0,00
200,00
400,00
600,00
800,00
1000,00
1200,00
1400,00
1600,00
Vol
um, m
3
specia
Distribution of the standing volume by species
State of vegetation of the inventoried trees Types of damages
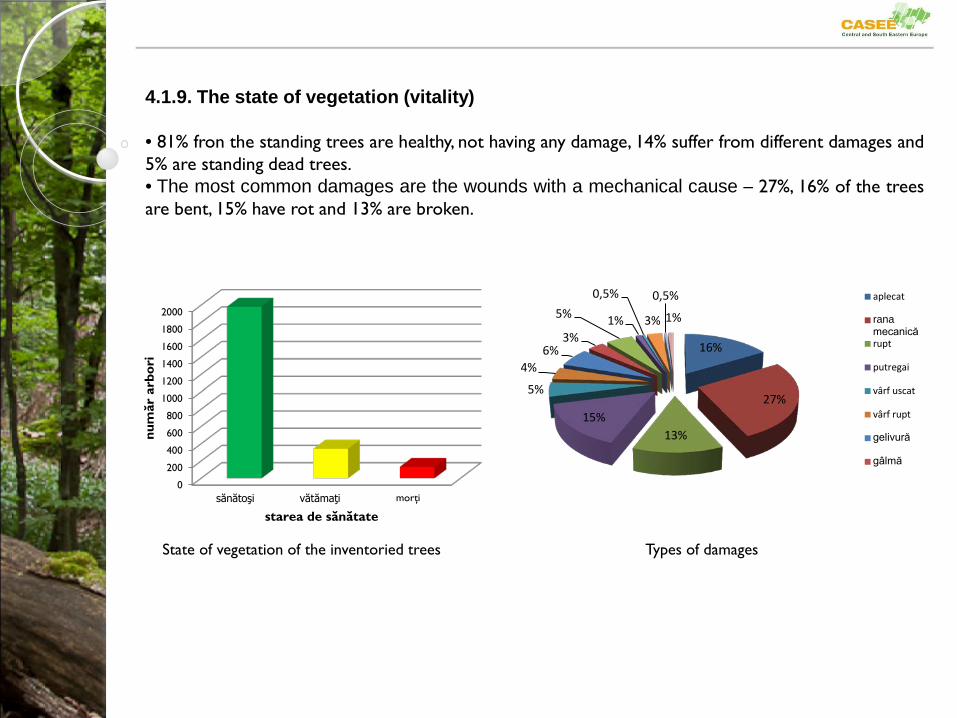
4.1.9. The state of vegetation (vitality) • 81% fron the standing trees are healthy, not having any damage, 14% suffer from different damages and 5% are standing dead trees. • The most common damages are the wounds with a mechanical cause – 27%, 16% of the trees are bent, 15% have rot and 13% are broken.
0
200
400
600
800
1000
1200
1400
1600
1800
2000
sănătoşi vătămaţi morţi
număr
arb
ori
starea de sănătate
16%
27%
13% 15%
5%
4% 6%
3%
5% 1%
0,5%
3%
0,5%
1%
aplecat
ranamecanicărupt
putregai
vârf uscat
vârf rupt
gelivură
gâlmă
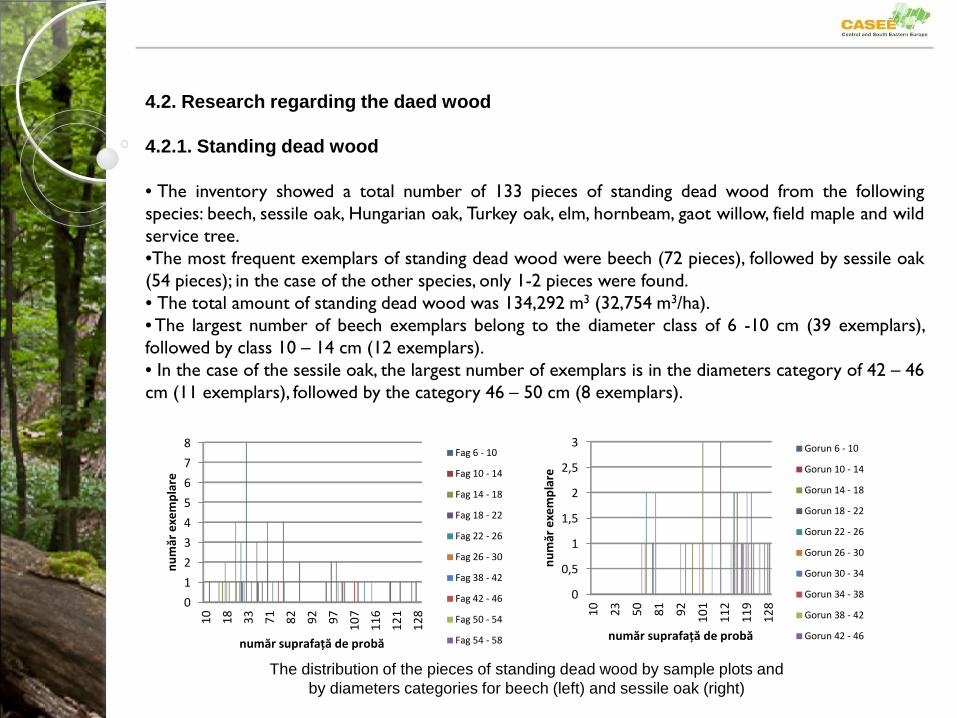
4.2. Research regarding the daed wood 4.2.1. Standing dead wood • The inventory showed a total number of 133 pieces of standing dead wood from the following species: beech, sessile oak, Hungarian oak, Turkey oak, elm, hornbeam, gaot willow, field maple and wild service tree. •The most frequent exemplars of standing dead wood were beech (72 pieces), followed by sessile oak (54 pieces); in the case of the other species, only 1-2 pieces were found. • The total amount of standing dead wood was 134,292 m3 (32,754 m3/ha). • The largest number of beech exemplars belong to the diameter class of 6 -10 cm (39 exemplars), followed by class 10 – 14 cm (12 exemplars). • In the case of the sessile oak, the largest number of exemplars is in the diameters category of 42 – 46 cm (11 exemplars), followed by the category 46 – 50 cm (8 exemplars).
012345678
10 18 33 71 82 92 97 107
116
121
128
num
ăr e
xem
plar
e
număr suprafață de probă
Fag 6 - 10
Fag 10 - 14
Fag 14 - 18
Fag 18 - 22
Fag 22 - 26
Fag 26 - 30
Fag 38 - 42
Fag 42 - 46
Fag 50 - 54
Fag 54 - 58
0
0,5
1
1,5
2
2,5
3
10 23 50 81 92 101
112
119
128
num
ăr e
xem
plar
e
număr suprafață de probă
Gorun 6 - 10
Gorun 10 - 14
Gorun 14 - 18
Gorun 18 - 22
Gorun 22 - 26
Gorun 26 - 30
Gorun 30 - 34
Gorun 34 - 38
Gorun 38 - 42
Gorun 42 - 46
The distribution of the pieces of standing dead wood by sample plots and by diameters categories for beech (left) and sessile oak (right)
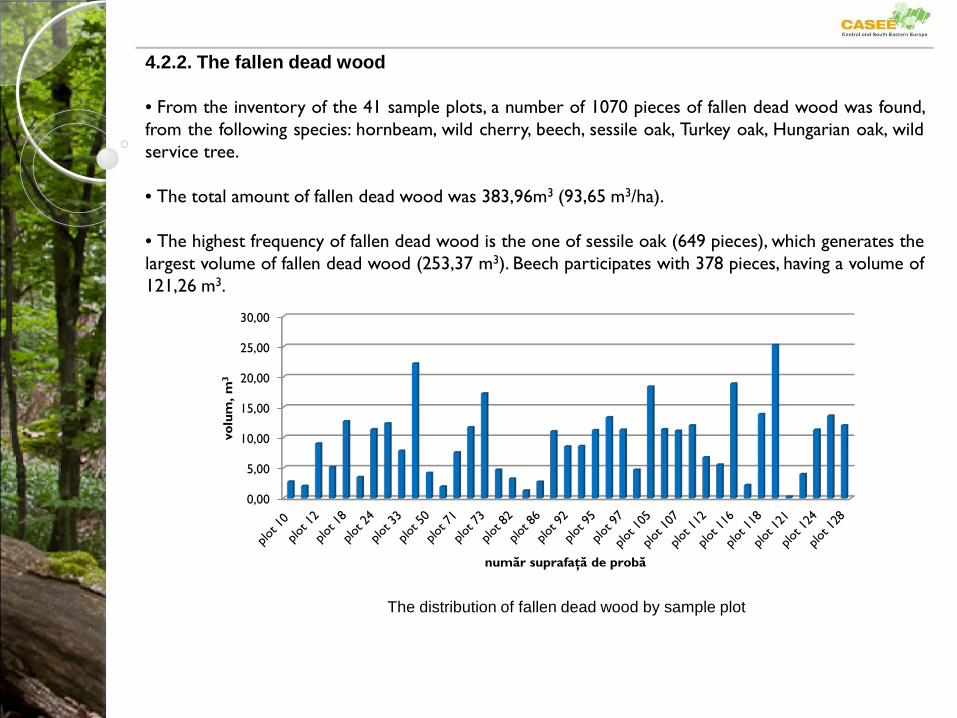
4.2.2. The fallen dead wood • From the inventory of the 41 sample plots, a number of 1070 pieces of fallen dead wood was found, from the following species: hornbeam, wild cherry, beech, sessile oak, Turkey oak, Hungarian oak, wild service tree.
• The total amount of fallen dead wood was 383,96m3 (93,65 m3/ha). • The highest frequency of fallen dead wood is the one of sessile oak (649 pieces), which generates the largest volume of fallen dead wood (253,37 m3). Beech participates with 378 pieces, having a volume of 121,26 m3.
0,00
5,00
10,00
15,00
20,00
25,00
30,00
volu
m, m
3
număr suprafaţă de probă
The distribution of fallen dead wood by sample plot
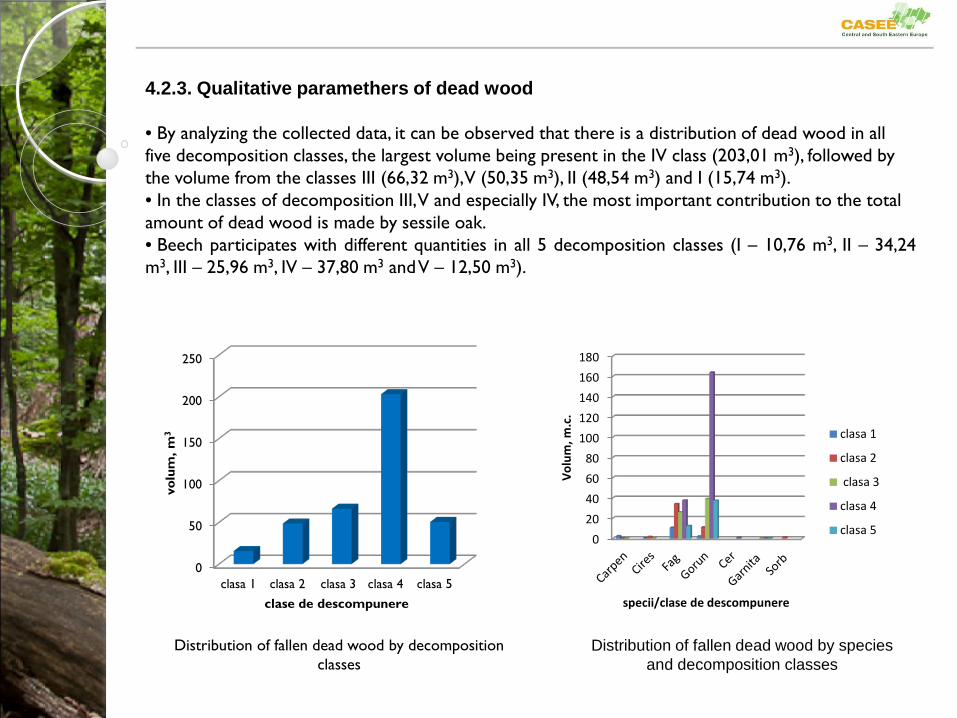
4.2.3. Qualitative paramethers of dead wood • By analyzing the collected data, it can be observed that there is a distribution of dead wood in all five decomposition classes, the largest volume being present in the IV class (203,01 m3), followed by the volume from the classes III (66,32 m3), V (50,35 m3), II (48,54 m3) and I (15,74 m3). • In the classes of decomposition III, V and especially IV, the most important contribution to the total amount of dead wood is made by sessile oak. • Beech participates with different quantities in all 5 decomposition classes (I – 10,76 m3, II – 34,24 m3, III – 25,96 m3, IV – 37,80 m3 and V – 12,50 m3).
0
50
100
150
200
250
clasa 1 clasa 2 clasa 3 clasa 4 clasa 5
volu
m, m
3
clase de descompunere
020406080
100120140160180
Volu
m, m
.c.
specii/clase de descompunere
clasa 1
clasa 2
clasa 3
clasa 4
clasa 5
Distribution of fallen dead wood by decomposition classes
Distribution of fallen dead wood by species and decomposition classes
5. Conclusion The stands’ composition •There are two main species: beech and sessile oak. Other species are also present: hornbeam, Turkey oak, wild cherry, lime tree, field maple, sycamore, maple, wild service tree, wild pear tree, elm.
Number of trees per hectare • 2327 exemplars of standing trees (567 exemplars/ha): 76% beech, 11% sessile oak, 9% hornbeam, the rest of the species totalizing 4%.
Diversity indexes • By analyzing the biodiversity indexes we found that they have values which confirm the existence of an evoluted biocenosis, with a good continuit in time.
The distribution of number of trees by diameter categories • In the case of the total number of trees, this distribution is modeled by a polynomial equation with a bimodal form. We can observe a maximum number of trees in the diameter category of 4 – 8 cm, then the number of trees decreases as the diameter increases, a slight increase is observed for the diameter category of 40 – 60 cm.
• An important number of large trees were recorded (3 trees with diameter over 100 cm, 28 trees with diameter between 80 - 100 cm and 141 trees with diameter between 60 – 80 cm).
The distribution of number of trees by height categories • The distribution of number of trees by height categories is bimodal with left asymmetry both for the total number of trees and for beech trees, the largest frequency being for the category of 8 – 12 m, and slightly increased frequencies being recorded for the category of 34 – 36 m, which indicates the presence of a dominat canopy layer. In the case of sessile oak, the distribution is bimodal with right asymmetry, the maximum being recorded for the category of 28 – 30 m.
Slimness indexes • This coefficient shows large variations for the stands from the Runcu – Groși Nature Reserve. Most of the trees, regardless of species, show values of this coefficient below 100.
The relationship between diameters and heights • The relationship between diameters and heights was modeled using logarithmic regression equations. By analyzing the graphs showing this relationship, both for the total number of trees and the main species, we can observe a variation of heights within the same diametere category, a fact that is also shown by the slimness indexes.
The standing volume per hectare • The mean standing volume is 629 m3/ha. The average standing volume varies between 621 m3/ha in the sample plots dominated by sessile oak and 647 m3/ha in the sample plots where only beech is present. This volume is close to the volumes recorded in other reserves of broadleaved species.
State of vegetation • 81% of the trees inventoried are healthy, 5% are standing dead trees and the rest of 14% show diverse form and/or structural damages. The most frequent damages are the ones produced by a mechanical cause, the rot and the bendt trees.
The total volume of dead wood • The average volume of dead wood was 125 m3/ha, the quantity varying from 143 m3/ha in the plots where sessile oak is dominant to 64 m3/ha in the sample plots with only beech.
The standing dead volume • The average standing dead wood volume is 32,75 m3/ha. The percentage of standing dead wood from the total amount of dead wood is 26%. This percentage varies from 9% in the sample plots with only beech to 30% in the sample plots with the volume dominated by beech (the percentage is 26% in the sample plots with the volume dominated by sessile oak).
The fallen dead wood • The average volume of fallen dead wood is 93,65 m3/ha. From the total amount of fallen dead wood, 66% is sessile oak.
Repartition of dead wood by decomposition classes • It can be observed that dead wood is distributed in all 5 decomposition classes, the largest volume being found in the IV class, followed by the classes III, V, II, I, 65% of the fallen dead wood being sessile oak in the IV class. An explanation for this large quantity is the sloww decomposition rate of sessile oak compared to beech.

Thank you for your attention!