automatic hip prosthesis fit estimation by … · eficienţa acestor metode de analiză este...
TRANSCRIPT
U.P.B. Sci. Bull., Series C, Vol. 71, Iss. 4, 2009 ISSN 1454-234x
AUTOMATIC HIP PROSTHESIS FIT ESTIMATION BY COOPERATIVE X-RAY IMAGE SEGMENTATION
Laura FLOREA1, Constantin VERTAN2
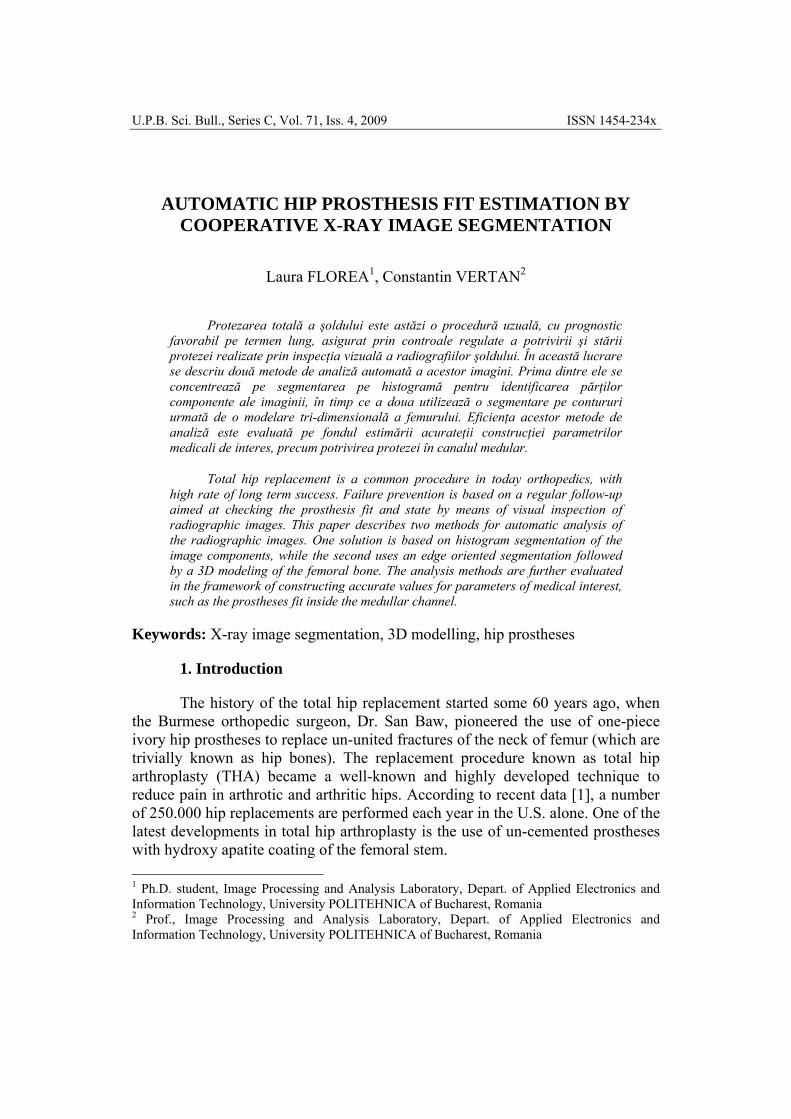
Protezarea totală a şoldului este astăzi o procedură uzuală, cu prognostic favorabil pe termen lung, asigurat prin controale regulate a potrivirii şi stării protezei realizate prin inspecţia vizuală a radiografiilor şoldului. În această lucrare se descriu două metode de analiză automată a acestor imagini. Prima dintre ele se concentrează pe segmentarea pe histogramă pentru identificarea părţilor componente ale imaginii, în timp ce a doua utilizează o segmentare pe contururi urmată de o modelare tri-dimensională a femurului. Eficienţa acestor metode de analiză este evaluată pe fondul estimării acurateţii construcţiei parametrilor medicali de interes, precum potrivirea protezei în canalul medular.
Total hip replacement is a common procedure in today orthopedics, with high rate of long term success. Failure prevention is based on a regular follow-up aimed at checking the prosthesis fit and state by means of visual inspection of radiographic images. This paper describes two methods for automatic analysis of the radiographic images. One solution is based on histogram segmentation of the image components, while the second uses an edge oriented segmentation followed by a 3D modeling of the femoral bone. The analysis methods are further evaluated in the framework of constructing accurate values for parameters of medical interest, such as the prostheses fit inside the medullar channel.
Keywords: X-ray image segmentation, 3D modelling, hip prostheses
1. Introduction
The history of the total hip replacement started some 60 years ago, when the Burmese orthopedic surgeon, Dr. San Baw, pioneered the use of one-piece ivory hip prostheses to replace un-united fractures of the neck of femur (which are trivially known as hip bones). The replacement procedure known as total hip arthroplasty (THA) became a well-known and highly developed technique to reduce pain in arthrotic and arthritic hips. According to recent data [1], a number of 250.000 hip replacements are performed each year in the U.S. alone. One of the latest developments in total hip arthroplasty is the use of un-cemented prostheses with hydroxy apatite coating of the femoral stem. 1 Ph.D. student, Image Processing and Analysis Laboratory, Depart. of Applied Electronics and Information Technology, University POLITEHNICA of Bucharest, Romania 2 Prof., Image Processing and Analysis Laboratory, Depart. of Applied Electronics and Information Technology, University POLITEHNICA of Bucharest, Romania
4 Laura Florea, Constantin Vertan
In the majority of cases, the patient is able to fully recover, although at certain times complications may appear. On the short term, infection is a major concern; on the long term, many problems relate to osteolysis. Osteolysis is an active resorption or dissolution of the bone tissue; in the case of total hip replacement, osteolysis is produced by the particles worn off the gliding surface of the prostheses (wear debris). The consequence is that the bone grows away from the implant, causing it to loosen; the worst scenario implies bone fracture. Thus, the detection of the osteolysis in its early stages is of great importance. In order to achieve such goal, it is important to have tools for the estimation of the prosthesis stem fit within the femoral bone [2].
The most common mean for investigating the human bone system is the X-ray imaging. In case that the radiographies are not acquired with a digital machine there have been developed means of digitizing and enhancing the analog counterparts [3], [4]. Once the digital radiographies are available, analysis techniques to identify the three major parts of the hip area images (the background corresponding to the soft tissue, the bone and prostheses) have to be applied. One class of segmentation techniques is related to the image histogram. In such a case, the histogram modes that correspond to the objects of interest are identified. An alternate class of image segmentation refers to detecting edges. In our particular application, since only the prostheses - bone edge is strong enough to be reliably detected, we use a 3D modeling technique for the identification of the femoral bone.
The remaining of the document is structured as follows: we shall start by briefly describing the theoretical background of histogram segmentation, and respectively the edge based segmentation, and we shall continue by presenting the 3D modeling technique. Once the methods have been defined, we shall describe the construction of a quantitative medical score and evaluate the proposed technique in this framework. The paper ends with a summary of the achieved results and with a discussion about the potential of this work.
2. Prosthesis-Bone Segmentation
The goal of image segmentation is the extraction of distinct objects (regions) from the original image [5]. The objects are defined according to the specific field of application and are usually described by some uniformity criterion. In this particular application we are primarily interested in the segmentation of the hip prosthesis, and, more precisely, in the segmentation of its stem (femoral component).

Automatic hip prosthesis fit estimation by cooperative X-ray image segmentation 5
2.1. Region Oriented Segmentation
A typical prosthesed hip area radiographic image and its histogram are shown in figure 1. It can be seen that the upper histogram mode corresponds to the prosthesis (the foreground) and to some parts of the bone (from both the acetabulum and the femur), while the middle histogram mode relates to the bone mass. Thus, if the separation thresholds can be reliable and automatically detected, then three-class thresholding methods [6] could be effective for the segmentation of the prosthesis stem.
Fig. 1. Typical X-ray of the hip with an un-cemented hip prosthesis and the associated histogram
Automatically finding the optimal thresholding value that correctly
extracts the foreground is a problem widely studied in the literature [7]. One of the histogram based segmentation techniques that leads to good results implies the use of the expectation maximization (EM) algorithm. The EM algorithm [8] is a classical method used in statistics to find the maximum likelihood estimates of a set of parameters that best fits the available data. In our case, as previously explained, we assumed that the image data is generated by a mixture of three classes (prosthesis, bone, soft tissue), with each class being characterized by a Gaussian probability density function with mean mi and variance σi, N(mi; σi) (with i = 1; 2; 3). Each class has its own weight wi, determined by the number of pixels in that class denominated by the total number of pixels, and the image probability density function is modeled by a mixture of Gaussians:
( )∑=
=3
1,
iiii mNwh σ (1)
0 50 100 150 200 2500
0.002
0.004
0.006
0.008
0.01
0.012
6 Laura Florea, Constantin Vertan
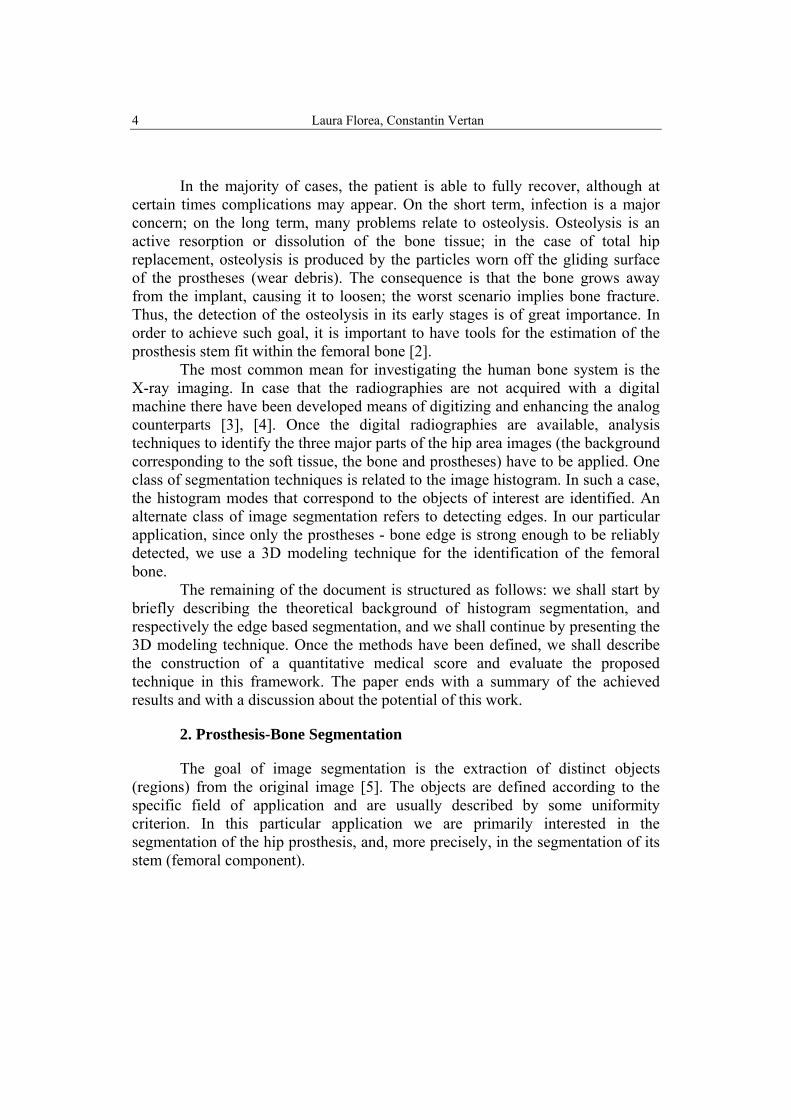
The EM algorithm will iterate until it finds the set of parameters that best fits the image histogram. Once the parameters are set, the class membership of each pixel is found by a simple maximum likelihood rule. An EM-segmented hip radiography is presented in figure 2 b).
a) b)
c)
Fig. 2. a) Original image; b) EM segmented image; c) prosthesis edge extracted by the Canny algorithm from the original image
2.2. Contour Oriented Segmentation
Edge oriented image segmentation takes into account the spatial distribution of the pixels [9], looking for pixels related to spatial gray level discontinuity. Edge detection highlights local contrast, which seems more suitable for separation of the prostheses from the bone. Several techniques are at hand. Basic gradient operators, second-order derivative operators, phase congruency methods can be used for edge detection. But probably the Canny operator [10] is the most common and effective choice. We shall focus on it, since it seems to provide the best results. A common choice [9] for the implementation of the Canny operator consists of the following steps:
• Gaussian smoothing to reduce the noise (which may be implemented by convolution with a Gaussian kernel);
• Sobel operator for edge detection; • Non-maxima suppression used for locating the highest magnitude points in
an edge map while suppressing the other; • Threshold with hysteresis to connect edge points and therefore to provide
continuous contours.

Automatic hip prosthesis fit estimation by cooperative X-ray image segmentation 7
The Canny operator has been found very reliable in separating the prostheses stem from the bone. An example of Canny edge detection within a hip X-ray is presented in figure 2 c). As one can easily notice, the edges of the stem are well detected.
3. Prosthesis-Bone Modeling
As mentioned in the introduction, X-ray images are the most common way to investigate the human skeleton. The basic image formation process in radiology goes as following: an X-ray machine (X-ray tube) directs an electromagnetic radiation upon a specified region (as the hip area, in our application) of the body. This radiation is absorbed or scattered by dense materials (bones, acrylic prostheses), but tends to pass through less dense matter (air, fat, muscle) and exposes the X-ray film. Areas of film exposed to higher amounts of radiation will appear as black or dark grey on radiography, while areas exposed to less radiation will appear lighter grey or white. Thus, the reported intensity in the X-ray image is depending on the thickness and on the absorption coefficient of the material passed by the radiation.
By the discussed means, two-dimensional radiographic images are constructed. Obviously, a three-dimensional perspective of the investigated area is more informative. Because of this demand, there were many approaches to build three-dimensional approximations of the imaged objects starting from the original planar radiography [11], [12], [13], [14]. In our case, the work of Jedrzejek et al [13], who constructed parametric models for the entire hip area and the work of Nikkhahe–Dehkordi et al [11], who used two radiographies taken from orthogonal directions to construct a 3D model of the femoral bone may be considered of interest. In contrast to the cited work, our goal focuses on modeling the lower part of the femoral bone (with and without prostheses) from a single input view.
Since our purpose is to build a model of the data with one dimension more than the one provided by input data, we have to imply additional information which is given by a model. A summary of the models that may be used to approximate the actual situation may be followed in [14]. The most accurate model is the so-called “non-concentrically model” and its short presentation and its extension to the prosthesed part follow in this section.
We shall begin our approximation by considering a section of the femoral bone, orthogonal to its main direction. Initially, for simplicity reasons, we shall focus on the part of the bone below the prosthesis stem (known as the 4th Gruen zone [2]), as one can see in figure 3a). An example of a scan-row through this area may be seen in figure 3b).
The model assumes that each orthogonal section through the bone will contain two non-concentrically circles (as showed in figure 3c) ), one modeling

8 Laura Florea, Constantin Vertan
the bone structure, with high absorption constant and the inner part, representing the medullar area, having lower absorption value. Furthermore, we shall consider that the X-ray source emitter will be placed in the upper part, while the receiver is found in the lower part, so that the projection will be on the horizontal axis.
a) b)
c)
Fig. 3. a) A part of the image corresponding to the femoral bone without prostheses (4th Gruen area). b) A scan line through this part of the image c) The abstract model of the femoral bone
Formalizing, we shall build the projection function, g, defined over the
[-R;R] range (where R is the bone radius) that at an abscissa point x has the value equal to the sum projection on the mentioned axis. Ignoring the medullar part, the projection function is equal with the chord length in the “bone circle”:
],[,2)( 22 RRxxRKxg R −∈−⋅= (2)
where KR is the absorption constant corresponding to the bone. If we extend the model to a part that include empty medullar area (concentrically to the bone), the projection function has the shape:
],[,22)( 2222 rrxxrKxRKxg rR −∈−−−= (3)
where Kr is the absorption constant corresponding to the medullar part and r is the medullar channel radius.
Moving one step further in modeling by adding the prostheses with its high absorption constant Kp, its radius Rp, the shift of the center of the medullar channel Δr, the shift of the prostheses center Δp and the background (soft tissue) residual absorption, Kb, the resulting projection function for a section row has the form:
Automatic hip prosthesis fit estimation by cooperative X-ray image segmentation 9
( )( ) ( )
( )⎪⎪⎪⎪
⎩
⎪⎪⎪⎪
⎨
⎧
+Δ−∈+−
+Δ−+Δ−∈+Δ+−−−
+Δ−−Δ−∈
+Δ+−+Δ+−−−
−Δ−−Δ−∈+Δ+−−−
−Δ−−∈+−
=
],(,2],(,22
],(
,222
],(,22],[,2
)(
22
2222
222222
2222
22
RrxKxRKrRxKxrKxRK
RRx
KxRKxrKxRK
RrxKxrKxRKrRxKxRK
xg
rbR
rppbrrR
pppp
bppPrrR
pprbrrR
rbR
(4)
In the equation (4), we implied the use of a set of nine parameters
(R;r;Rp;KR;Kr;Kp;Kb;Δr;Δp) that approximate scan-rows from the prosthesed part of the femoral bone.
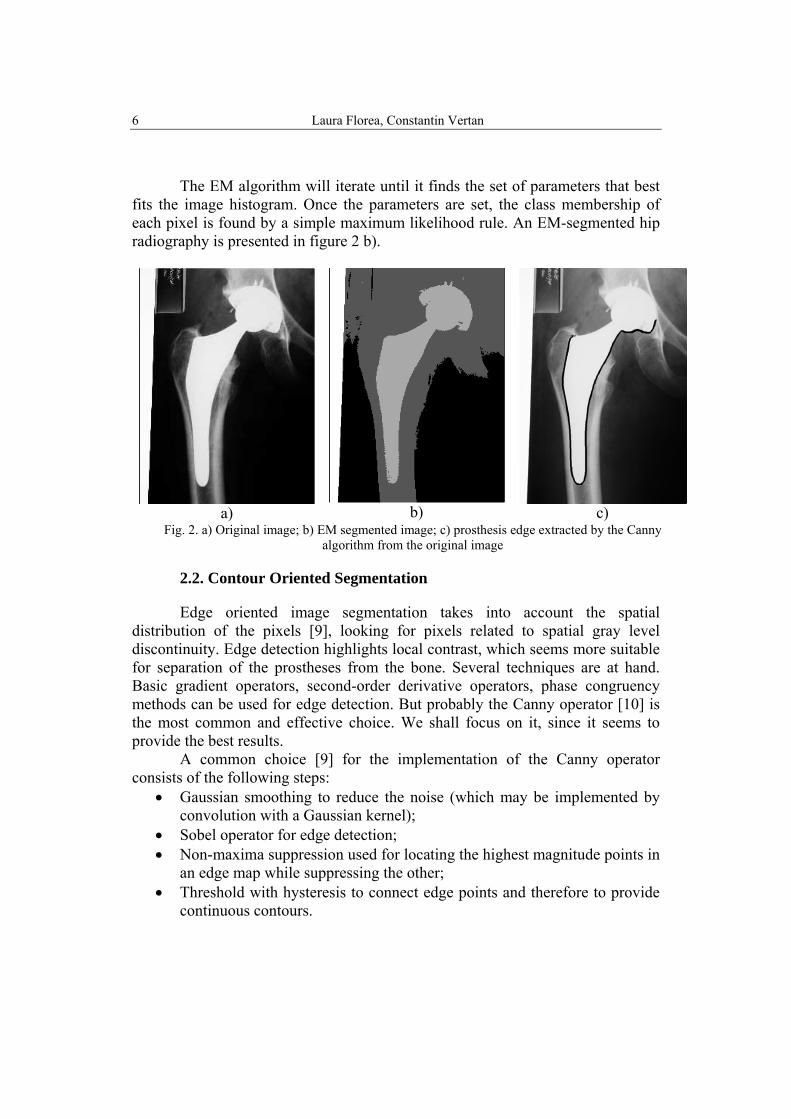
However, before discussing about the goodness of the fit, it is necessary to detail the techniques used for the estimation of the actual values of the parameter set. One alternative is to consider the mean squared error between the projection function, g and the available scan-row f and to minimize the error with respect to each of the parameters. Unfortunately the resulting equations system has no analytical solution and a more practical solution is at hand. The inflexion points (abscissas or values) may be easily determined in both situations. To achieve this goal a simple segmentation method has been assumed [15].
This short segmentation uses as input the edges of the prostheses found by the previous segmentation (either Canny detector or EM method) and continues
a) b) Fig. 4. a) A scan row and the method to determine the breaking points of the assumed model; b) the results on the original image (outer bone and medullar channel limits with white and
prostheses limits with black)

10 Laura Florea, Constantin Vertan
by analyzing each scan-row (as the scan-row showed in figure 4) and detecting the edges of the bone and, respectively, of the medullar channel. The actual conditions are:
• The bone outer limits (left hand and right hand) correspond to the first (last) pixel that has slope larger (smaller) than a threshold. These limits define a distance equal with 2R. The center of this distance is the origin of the plot.
• The prostheses limits are the ones found by the previous segmentation. These define a distance equal with 2Rp. Their center, with respect to the center of the bone, gives Δp.
• The medullar channel exists (it may be a case that the bone touches the prostheses) if there is a decrease followed by an increase of the intensity between the bone outer limit and the prostheses.
• The medullar channel limits are given by the largest decrease and, respectively, increase in this area. By this mean we find the 2r distance and respectively Δr.
• The average value outside the bone area determines the soft tissue absorption constant Kb.
• The center of the distance between the mentioned maxima marks the center of the medullar area, Δr.
• The projection function value in (Δr - r) gives the bone absorption constant as:
( )22
)(
rR
KrgKr
brR
−Δ−−
−−Δ−= (5)
In a similar manner one will determine the remainder of the values of the
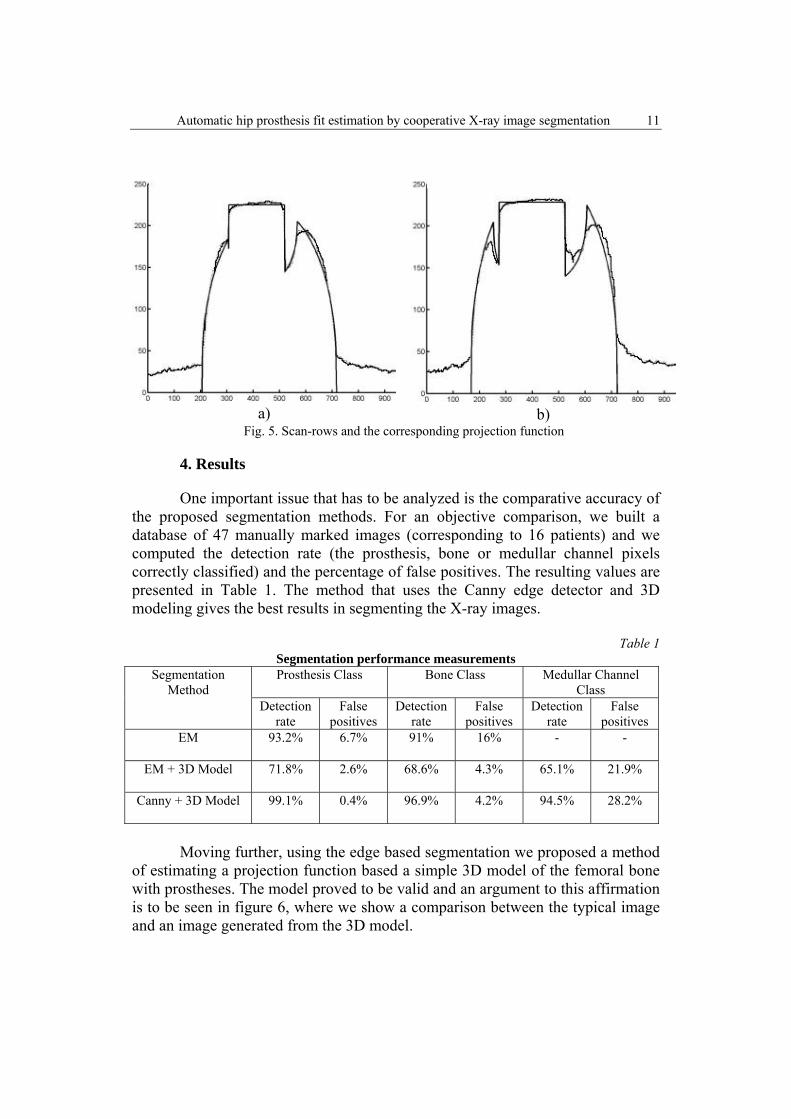
parameter set. Using the mentioned set of conditions to find the parameters, the projection function is fully determined. A set of examples of scan-rows and the associated projection functions are shown in figure 5.
The estimation may be performed independently for each scan row, which is not an accurate approximation of the reality, or parameter continuity may be imposed. In this sense, we fix all the absorption constants for the entire image and we impose all the shifts and respectively radiuses to have an absolute variation below a fixed threshold. Therefore, the actual values are determined by median filtering of the independently estimated data.
Automatic hip prosthesis fit estimation by cooperative X-ray image segmentation 11
4. Results
One important issue that has to be analyzed is the comparative accuracy of the proposed segmentation methods. For an objective comparison, we built a database of 47 manually marked images (corresponding to 16 patients) and we computed the detection rate (the prosthesis, bone or medullar channel pixels correctly classified) and the percentage of false positives. The resulting values are presented in Table 1. The method that uses the Canny edge detector and 3D modeling gives the best results in segmenting the X-ray images.
Table 1
Segmentation performance measurements Segmentation
Method Prosthesis Class Bone Class Medullar Channel
Class Detection
rate False
positives Detection
rate False
positives Detection
rate False
positives EM 93.2% 6.7% 91% 16% - -
EM + 3D Model 71.8% 2.6% 68.6% 4.3% 65.1% 21.9%
Canny + 3D Model 99.1% 0.4% 96.9% 4.2% 94.5% 28.2%
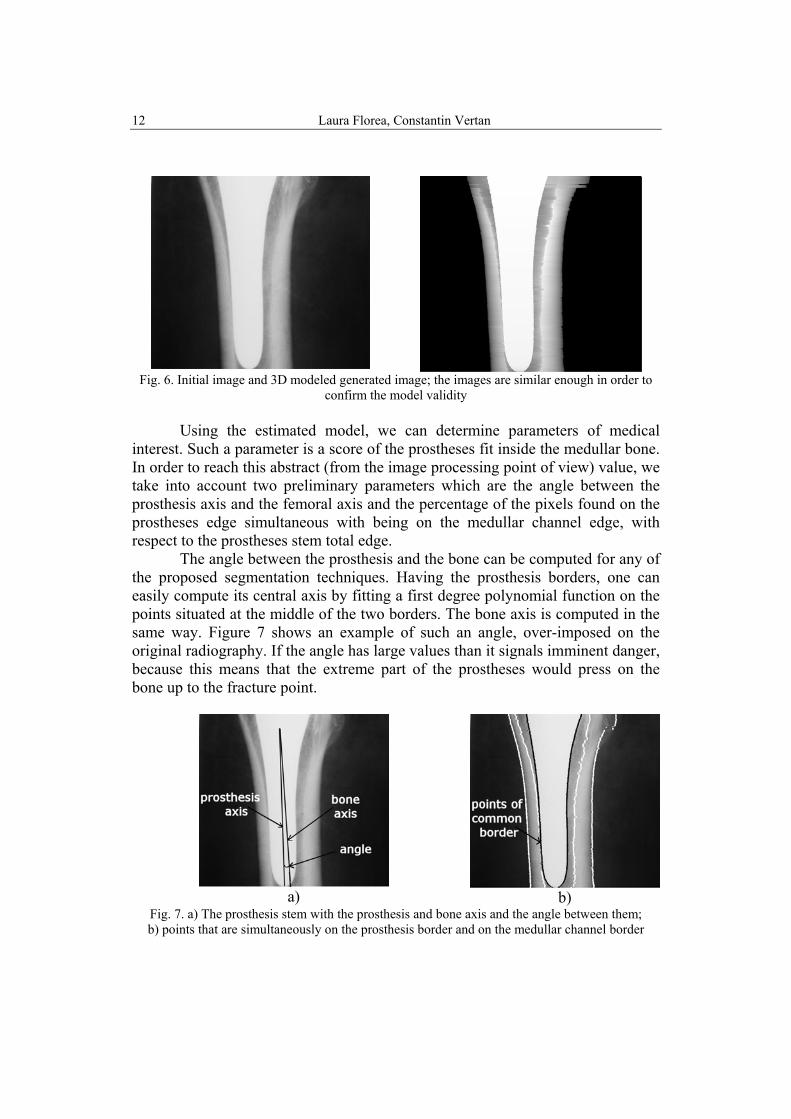
Moving further, using the edge based segmentation we proposed a method
of estimating a projection function based a simple 3D model of the femoral bone with prostheses. The model proved to be valid and an argument to this affirmation is to be seen in figure 6, where we show a comparison between the typical image and an image generated from the 3D model.
a) b)
Fig. 5. Scan-rows and the corresponding projection function
12 Laura Florea, Constantin Vertan
Fig. 6. Initial image and 3D modeled generated image; the images are similar enough in order to
confirm the model validity Using the estimated model, we can determine parameters of medical
interest. Such a parameter is a score of the prostheses fit inside the medullar bone. In order to reach this abstract (from the image processing point of view) value, we take into account two preliminary parameters which are the angle between the prosthesis axis and the femoral axis and the percentage of the pixels found on the prostheses edge simultaneous with being on the medullar channel edge, with respect to the prostheses stem total edge.
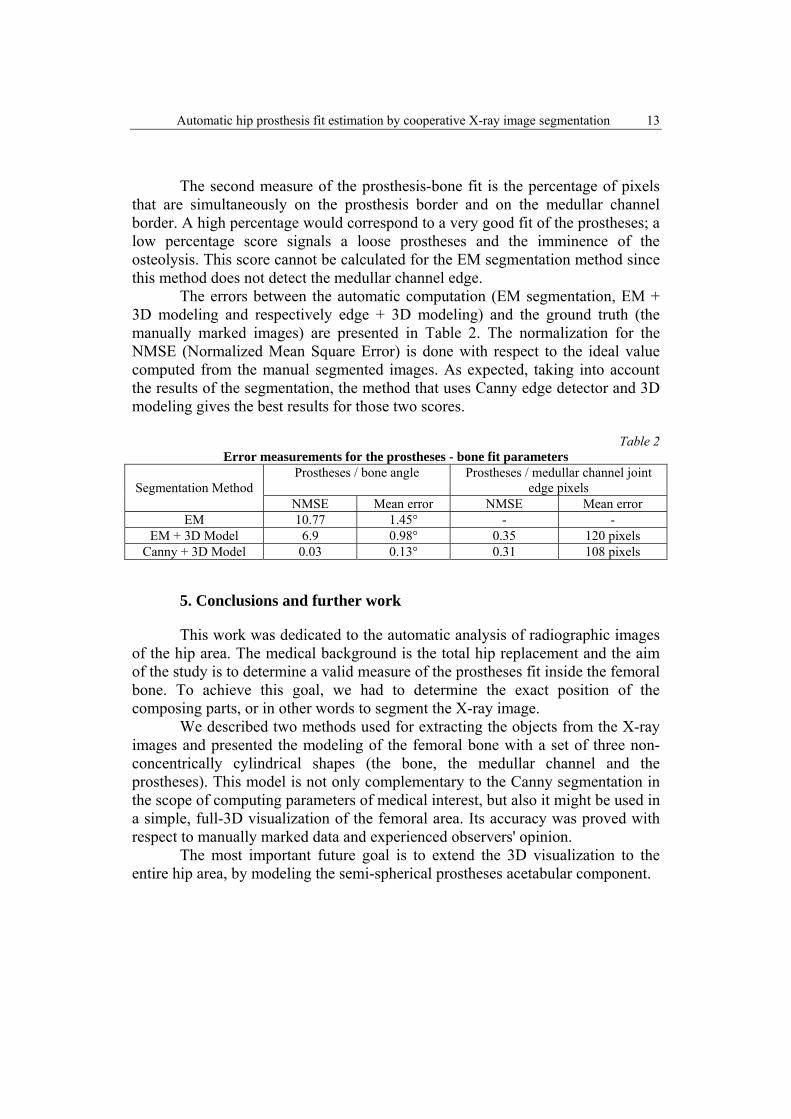
The angle between the prosthesis and the bone can be computed for any of the proposed segmentation techniques. Having the prosthesis borders, one can easily compute its central axis by fitting a first degree polynomial function on the points situated at the middle of the two borders. The bone axis is computed in the same way. Figure 7 shows an example of such an angle, over-imposed on the original radiography. If the angle has large values than it signals imminent danger, because this means that the extreme part of the prostheses would press on the bone up to the fracture point.
a) b)
Fig. 7. a) The prosthesis stem with the prosthesis and bone axis and the angle between them; b) points that are simultaneously on the prosthesis border and on the medullar channel border
Automatic hip prosthesis fit estimation by cooperative X-ray image segmentation 13
The second measure of the prosthesis-bone fit is the percentage of pixels that are simultaneously on the prosthesis border and on the medullar channel border. A high percentage would correspond to a very good fit of the prostheses; a low percentage score signals a loose prostheses and the imminence of the osteolysis. This score cannot be calculated for the EM segmentation method since this method does not detect the medullar channel edge.
The errors between the automatic computation (EM segmentation, EM + 3D modeling and respectively edge + 3D modeling) and the ground truth (the manually marked images) are presented in Table 2. The normalization for the NMSE (Normalized Mean Square Error) is done with respect to the ideal value computed from the manual segmented images. As expected, taking into account the results of the segmentation, the method that uses Canny edge detector and 3D modeling gives the best results for those two scores.
Table 2
Error measurements for the prostheses - bone fit parameters
Segmentation Method Prostheses / bone angle Prostheses / medullar channel joint
edge pixels NMSE Mean error NMSE Mean error
EM 10.77 1.45° - - EM + 3D Model 6.9 0.98° 0.35 120 pixels
Canny + 3D Model 0.03 0.13° 0.31 108 pixels
5. Conclusions and further work
This work was dedicated to the automatic analysis of radiographic images of the hip area. The medical background is the total hip replacement and the aim of the study is to determine a valid measure of the prostheses fit inside the femoral bone. To achieve this goal, we had to determine the exact position of the composing parts, or in other words to segment the X-ray image.
We described two methods used for extracting the objects from the X-ray images and presented the modeling of the femoral bone with a set of three non-concentrically cylindrical shapes (the bone, the medullar channel and the prostheses). This model is not only complementary to the Canny segmentation in the scope of computing parameters of medical interest, but also it might be used in a simple, full-3D visualization of the femoral area. Its accuracy was proved with respect to manually marked data and experienced observers' opinion.
The most important future goal is to extend the 3D visualization to the entire hip area, by modeling the semi-spherical prostheses acetabular component.
14 Laura Florea, Constantin Vertan
Acknowledgement
The authors acknowledge the support of the CEEX VIASAN research grant 69/2006.
R E F E R E N C E S
[1] K. Rogoff, Health care costs to squeeze capitalism, The Japan Times, August 2007. [2] A.G.D. Valle, W.G. Paprosky, Revision total hip arthroplasty. Orthopaedic Knowledge Online,
American Academy of Orthopaedic Surgeons, 2003 [3] C. Florea, C. Vertan, L. Florea, Logarithmic Model-based Dynamic Range Enhancement of
Hip X-ray Images, In Proc. of ACIVS 2007, vol. 4678, pp. 587-596, Delft, Netherlands, August 2007
[4] C. Florea, C. Vertan, Piecewise linear approximation of logarithmic image processing models for dynamic range enhancement, in Scientific Bulletin of University POLITEHNICA, Bucuresti, , series C, vol. 71, Iss. 2, pp. 3-15, 2009
[5] R.C. Gonzales, R.E. Woods, Digital Image Processing, Reading MA: Addison Wesley, 1992 [6] A. Oprea, C. Vertan, A quantitative evaluation of the hip prosthesis segmentation quality in X-
ray images, In Proc. of ISSCS 2007, vol. 1, pp. 197–200, Iaşi, Romania, July 2007 [7] M. Sezgin, B. Sankur, Survey over image thresholding techniques and quantitative performance
evaluation, Journal of Electronic Imaging, vol. 13, no. 1, pp. 146–168, 2004 [8] R. Redner, H. Walker, Mixture densities, maximum likelihood and the EM algorithm, In Proc.
of Society for Industrial and Applied Mathematics, vol. 26, pp.195–239, 1984 [9] M. Nixon, A. Aguado, Feature Extraction & Image Processing, Newnes, Butterworth-
Heinemann Linacre House, Oxford, 2002 [10] J. Canny, A Computational Approach to Edge Detection, IEEE Transaction on Pattern
Recognition and Machine Intelligence, vol. 8, no.6, pp. 679-698, 1986 [11] B.N. Dehkordi, M. Bro-Nielsen, T. Darvann, C. Gramkow, N. Egund, K. Hermann, 3-D
reconstruction of the femoral bone using two X-ray images from orthogonal views, In Proc. of Assisted Radiology, Elsevier, pp. 26–29, 1996
[12] R. Kurazume, K. Nakamura, T. Okada, Y. Sato, N. Sugano, T. Koyama, Y. Iwashita, T. Hasegawa, 3D reconstruction of a femoral shape using a parametric model and two 2D fluoroscopic images, Computer Vision and Image Understanding, vol. 113, Iss. 2, pp. 202-211, 2009
[13] C. Jedrzejek, A. Lempicki, R. Renk, J. Radziulis, 3-D modeling and parametrisation of pelvis and hip joint, In Lecture Notes in Computer Science, vol. 2124, pp. 282–289, 2001
[14] L. Florea, C. Vertan, C. Florea, 3D Femoral Bone Approximation in Prosthesed Hip Radiographies, In Proc. of 2008 IEEE International Conference on Intelligent Computer Communication and Processing ICCP, Cluj, Romania, pp. 75-82, August 2008
[15] L. Florea, C. Vertan, C. Florea, Automatic Fit Estimation of the Femoral Component of a Hip Prosthses in Digitized Radiographies, In Proc. of Communications 2008, Bucureşti, Romania, vol. 1, pp. 121-124, June 2008.